Article

Effect of Cropping Systems and Environment on Phenolic Acid Profiles and Yielding of Hybrid Winter Wheat Genotypes

by
Jan Buczek
1,
Marta Jańczak-Pieniążek
1,*,
Elżbieta Harasim
2,
Cezary A. Kwiatkowski
2 and
Ireneusz Kapusta
3
1
Department of Crop Production, College of Natural Sciences, University of Rzeszow, Zelwerowicza 4 St., 35-601 Rzeszow, Poland
2
Department of Herbology and Plant Cultivation Techniques, Faculty of Agrobioengineering, University of Life Sciences in Lublin, Akademicka 13, 20-950 Lublin, Poland
3
Department of Food Technology and Human Nutrition, College of Natural Sciences, University of Rzeszow, Zelwerowicza 4 St., 35-601 Rzeszow, Poland
*
Author to whom correspondence should be addressed.
Agriculture 2023, 13(4), 834; https://doi.org/10.3390/agriculture13040834
Submission received: 13 March 2023 / Revised: 1 April 2023 / Accepted: 4 April 2023 / Published: 6 April 2023
(This article belongs to the Section Crop Production)

Abstract

:
Wheat is of significant economic importance due to its high yield potential and high nutritional value as well as the technological usefulness of the grain. Field experiments were carried out in the years 2015–2018 in southeastern Poland. A three-factor experiment was used to study the influence of wheat cultivars (hybrid—cvs. Hybred and Hymack; common—cv. Batuta), cultivation systems (organic—ORG, integrated—INT, conventional—CON) and of environmental conditions (using two different locations: Dukla and Nowy Lubliniec) on wheat grains’ phenolic acid (PA) content and grain yield. The research confirms the genetic determinants of grain yield and PA composition in wheat grains, and their different accumulation levels of ferulic acid and other PAs—with the exception of sinapic, p-coumaric, and salicilic—with hybrid cultivars performing better than common cultivars. The ORG system, compared to the INT and CON systems, caused a larger increase in total acids (TPAs)—especially of ferulic, vanillic, and syringic acids—in grains of cv. Hybred, and of caffeic acid in cv. Hymack, compared to cv. Batuta. The lack of interaction between the cultivation systems and the cultivars indicates that similar reactions to increases in grain yield due to increases in the intensity of cultivation take place in cultivars. The more favourable environmental conditions in Dukla favoured the accumulation of ferulic, p-coumaric, vanillic, syringic, p-hydroxybenzoic, and protocatechuic acids in the grains. TPAs were higher by 4.3% and the grain yield by 4.0% on average. Variable conditions in the season 2015/2016 resulted in higher yields of hybrid cvs. grains than of common cv., which proves the greater yielding stability of these cultivars in years with adverse weather conditions. The season 2016/2017 had less rainfall and faced high temperatures during grain ripening, favouring a higher PA content and TPAs, especially in the grains of cv. Hybred. This suggests a need to further assess the genetic progress of hybrid wheat cultivars cultivated under different environmental conditions in terms of their PA composition and content.

1. Introduction

Wheat (Triticum aestivum L.) is one of the most widely cultivated cereal crops in the world and is the basic food of many people [1]. Today, wheat is cultivated around the world on 221 million ha, with global production of 771 million tons in 2021 [2]. Winter wheat is a species with a significant share of the sowing structure; therefore, it is considered to be a crop of very high economic importance [3]. Wheat grain is not only an important source of energy but also a source of nutrients and health-promoting ingredients [4,5]. Higher contents of phytochemicals, and in particular of phenolic antioxidants, are important parameters for determining the quality of wheat grains [6]. In recent years, especially in developed countries, great attention has been paid to the secondary metabolites contained in grains that are beneficial to health. The growing awareness of consumers about the role of diet in disease prevention makes the level of these substances present in grains an important differentiator when assessing the quality of plant products. Cereals, and especially wheat grains, because they play an important role in human nutrition and because of their very large scale of consumption, can be a significant and important source of bioactive compounds [5,7,8]. Phenolic compounds are classified based on their molecular structure. They include phenolic acids, flavonoids, proanthocyanidins, stilbenes, and coumarins. Wheat grains mainly contain phenolic acids and flavonoids [5]. Phenolic compounds in wheat grains occur in free, conjugated, and bound forms, with the latter being the most common [9]. Ferulic acid is the primary phenolic acid found in wheat grains, accounting for more than 90% of total polyphenols. Of the phenolic acids that are mainly concentrated in the aleurone and pericarp layers of the wheat grain, caffeic, p-coumaric, p-hydroxybenzoic, salicylic, sinapic, syringic, and vanillic acids have also been found [5,7,10,11,12,13,14,15]. Ferulic acid is the main hydroxycinnamic acid, which is classified as a bioactive element of the nutritional scheme because it is bound to the basic mixes of the cell wall [16]. Like other phenolic compounds, phenolic acids play a significant role in protecting plants against the effects of pests, diseases, and abiotic stress [17].
The yield and quality of wheat grains are greatly influenced by the cultivar, the cultivation environment, and the applied fertilisation, as they determine the yield of the grain, its protein content, and its final use [18]. Due to the high soil and agrotechnical requirements of wheat, the yields achieved may vary significantly depending on the environmental conditions in which it is cultivated [3,19].
The level of polyphenols in plants depends to a large extent on the conditions of cultivation [20]. The conventional (CON) and organic (ORG) systems differ significantly in their applied agrotechnical factors and environmental impact. The CON system aimed at maximising profits uses mineral fertilization and pesticides [21], while the ORG system prohibits the use of mineral fertilisers and plant-protection products. All nutrients are provided through cover crops, proper crop rotation, manure, and other organic fertilisers. The ORG system is largely based on natural methods and the use of a biological plant protection and nutrient mobilisation system [22]. The ORG system is therefore a unique management system that promotes biological activity in the soil and biodiversity [20,23,24]. The integrated (INT) cropping system can be an alternative to the ORG and CON systems. The INT system aims to reduce pesticide consumption to the minimum necessary and to determine the dose of mineral fertilisation required based on soil resources, resulting in a reduction in the negative impact of this system on the natural environment [21,25,26].
Interest in cultivating plants using the ORG system is increasing due to the better quality of the raw materials produced as a result of lower contents of pesticides and nitrates and increased nutritional values [12]. Products originating from ORG systems compared to CON systems are characterised by a higher content of secondary metabolites [12,27]. This may be due to the increased exposure of organic crops to pest attacks and nutritional stress as a result of the ban on the use of pesticides and artificial fertilisers [28].
The wheat cultivar, alongside other agrotechnical factors, is an important factor affecting the composition of phenolic acids [29,30,31]. In view of the ever-growing population, it is necessary to develop technology for the increased production of cereals without an excessive increase in water consumption and mineral fertilisers. A good solution is the cultivation of hybrid wheat with a higher agricultural potential due to the higher yield stability and higher productivity of its grain and straw compared to common cultivars [32,33]. In addition, hybrid cultivars are characterised by faster growth rates and differentiations of the plant, higher growth of its biomass, better resistance to environmental stress [33], and favourable grain-quality parameters [34]. Among farmers, however, hybrid wheat cultivars are not widely used, mainly due to the high cost of seed production (due to the low seed set on the male-sterilised female lines) [35].
The consumption of cereal products with a high content of phenolic compounds, which mainly includes phenolic acids, can contribute to public health [36]. It is therefore very important to focus the breeding of cereals, and in particular wheat, on the production of cultivars with a high content of these compounds, which is particularly important for consumers interested in improving their eating habits [31,37].
There is insufficient information in the literature on the content of phenolic compounds in hybrid wheat grains. Therefore, the purpose of this study was to demonstrate the impact of cultivation systems and environmental factors (location, weather conditions) on yield and phenolic acid content in hybrid wheat grains compared to the common cultivar. This research was expected to show that hybrid wheat cultivars can be an alternative to common cultivars not only in terms of yield levels but also in terms of the favorable phenolic acid profile of the grains.

2. Materials and Methods

2.1. Site Description and Experimental Design

Field experiments were carried out during three growing seasons in 2015–2018 at the Experimental Facility for Cultivar Assessment in Dukla (49°34′ N, 21°41′ E) and Nowy Lubliniec (50°16′ N, 23°06′ E) located in southeastern Poland. The experiments were carried out using random blocks in three repetitions, and the area of individual experimental plots for harvesting was 15 m2.
The research factors were:
I. Winter wheat cultivars (Triticum aestivum L.): hybrid—cvs. Hybred and Hymack (quality class B, breeder Saaten-Union GmbH, Estrées-Saint-Denis, France); common—cv. Batuta (quality class B, breeder Danko Hodowla Roślin sp. z o.o., Choryń, Poland). Cvs. Hybred and Hymack are bread cultivars with high grain quality (quality class B) and good yield potential. Cv. Hybred is an early-maturing cultivar with good drought tolerance. Cv. Hymack matures later, is resistant to ear and root diseases, and is recommended for less fertile soils. Hybrid wheat cultivars were obtained by crossing two separate parental lines using a chemical sterilization process.
II. Cropping systems: organic—ORG, integrated—INT, and conventional—CON. In the ORG system, mineral fertilisers and plant-protection products were not used and in INT, protection and mineral fertilisation were limited and applied in the amount of 90 N, 50 P, and 70 K kg ha−1. In the CON system, comprehensive plant protection was used with the application of herbicides, spraying against diseases and pests, fertilisation in the amount of 170 N, 90 P, and 140 K kg ha−1, as well as foliar fertilisation and the use of a growth regulator.
III. Location: Dukla (upland region, altitude 324 m, annual mean temperature 8.0 °C/total precipitation 780 mm) and Nowy Lubliniec (lowland region, altitude 210 m, annual mean temperature 8.9 °C/total precipitation 690 mm). Both regions are dominated by the cultivation of cereals, including wheat.
Pre-crop: Pre-crops for wheat cultivars were cultivated for a year in crop rotation: red clover in the ORG system (sugar beet, spring barley, red clover, winter wheat), pea in the INT system (sugar beet, spring barley, pea-winter wheat), and winter rape in the CON system (sugar beet, spring barley, winter rape, winter wheat).
Date and quantity of sowing: Wheat cultivars in all cultivation systems were sown in the first decade of October in the amount of 180 (hybrid cvs.) and 360 (common cv.) seeds m2.
Fertilisation: In the INT and CON systems, N fertilisation (ammonium nitrate 34%) was applied in divided doses; the first dose of N after the start of vegetation was 50 and 60 kg ha−1, respectively, and the second dose of N in the stem-elongation phase (32–33 BBCH) was 40 and 60 kg ha−1, respectively. Additionally, in the CON system, a third dose of N was applied in the heading phase (54–56 BBCH) in the amount of 50 kg ha−1. Fertilisation with P (superphosphate 19%) and K (potassium salt 60%) in the INT and CON systems were applied in one dose, before sowing wheat under ploughing.
Weed control: In the ORG system, weeds were mechanically controlled in the autumn before emergence (harrowing 1×) and in the spring after vegetation started in the 3- to 4-leaf phase (harrowing 2×). In the INT and CON systems, Marathon 375 SC (pendimethalin + isoproturon) was applied in autumn at doses of 2.0 and 4.0 L ha−1. In the spring, weeds were additionally mechanically controlled (3- to 4- leaf phase, harrowing 1×) in the INT system, and Aminopielik Standard 600 SL (2.4-dichlorophenoxyacetic acid) was applied (21–22 BBCH) at a dose of 1.3 L ha−1 (21–22 BBCH) in the CON system.
Plant protection: Protection against diseases was applied in the INT and CON systems during the stem-elongation phase (32–33 BBCH) using the preparation Tilt Plus 400 EC (propiconazole + fenpropidin, 1.0 L ha−1). In the CON system, in the heading phase (54–56 BBCH), Artea 330 EC fungicide (propiconazole + cyproconazole, 0.5 L ha−1) was additionally applied along with Plonvit Z foliar fertiliser (1.5 L ha−1). The growth regulator Moddus 250 EC (trinexapac-ethyl) was applied in the stem-elongation phase (32–33 BBCH) at a dose of 0.2 (INT) and 0.4 L ha−1 (CON).
Grain yield: Wheat cultivars were harvested in the second decade of July, during the full-grain-maturity phase (89–92 BBCH). Immediately after harvesting, the water content of the grain was determined and the yield of the grain was calculated (t ha−1) at 15% humidity.

2.2. Environmental Conditions in the Field Experiments

The weather conditions were recorded at the Experimental Facility for Cultivar Assessment in Dukla and Nowy Lubliniec. The experiments in Dukla and Nowy Lubliniec were set up in each season on Haplic Cambisol (CMha) and Fluvic Cambisol (CMfv) soils formed of silty clay and loamy sand, respectively [38]. The amount of Nmin measured before sowing the wheat was low and ranged from 58.3 to 65.7 kg ha−1 in Dukla, and from 52.4 to 63.0 kg ha−1 in Nowy Lubliniec. The soil organic carbon (SOC) content was higher in Dukla and ranged from 1.12 to 1.42% and from 0.82 to 1.15% in Nowy Lubliniec. The soil in the experiment was characterised by pH from slightly acidic to neutral in Dukla and neutral in Nowy Lubliniec. On both sites, the soil content was very high in available P, high in available K, very high in available Mg in Dukla, and high in available Mg in Nowy Lubliniec. The content of microelements was very high for Zn and Cu and medium forMn (Table 1).
In the comparison of weather conditions, we can see that during the autumn vegetation period the warmest season in the three years of research was 2016/2017 with a mean temperature that was 1.3 (Dukla) and 1.9 °C (Nowy Lubliniec) higher than the long-term average (Table 2). A small amount of precipitation (106.8 mm in Dukla and 90.9 mm in Nowy Lubliniec) occurred especially in 2015/2016, the first year of the study, in the period of germination and emergence of the wheat. The winter months (December–February) in the period 2017/2018 were warmer than the long-term average and the amount of precipitation did not differ except in 2017/2018 in Nowy Lubliniec.
The temperatures during spring and summer vegetation periods in Dukla and Nowy Lubliniec corresponded to the long-term average; however, they saw the largest rainfall shortage in many years, with 52.7 and 66.2% recorded in July 2016/2017, respectively (Figure 1). In the period from sowing to harvesting in both research sites, air temperatures were higher than the long-term average, especially in 2017/2018. The growing seasons in the years of research in Nowy Lubliniec were warmer and with less rainfall than in Dukla. In Dukla, a higher rainfall shortage of 89.8 and 83.4 mm occurred in the first and second years of research, while in 2017/2018, the amount of precipitation was higher by 2.8% than the long-term average. A fairly uniform distribution of precipitation compared to the long-term average was recorded in Nowy Lubliniec with a small shortage of 39.5 mm (2015/2016) and 21.8 mm (2016/2017) and a higher (by 46.9 mm) amount of precipitation in the third year of the experiment.

2.3. Analytical Methods

2.3.1. Extraction and Separation of Phenolic Acids

The extraction and determination of phenolic compounds were carried out by the method of Mpofu et al. [44], as modified by Żuchowski et al. [7]. The wheat grain was ground in a LabMill (Perten, Hägersten, Sweden) with a homogenizing sieve with a d = 0.5 mm mesh size. The ground wheat samples (2.0 g) were hydrolysed with 4 M NaOH (60 mL) maintaining a boiling point (100 °C) for 4 h. Then, samples were cooled and acidified using ice-cold 6 M HCl to achieve a pH value of about 2. The resulting mixtures were centrifuged at 7000 rpm (Centrifuge 5427 R, Eppendorf, Nussloch, Germany) for 10 min. Supernatants were extracted three times with 70.0 mL of ethyl acetate. The organic phase was collected, filtered, and evaporated to dryness at 45 °C in a rotary evaporator (Rotavapor 100, Buchi, Flawil, Switzerland). The residue was dissolved in 50% acetonitrile (2.0 mL) and stored in a refrigerator. After filtration (millipore, 0.45 µm), samples were diluted 10-fold with ultrapure water and subjected to UPLC analysis.
The phenolic acid content in wheat extracts was determined using UPLC PDA-MS/MS, performed on an ACQUITY UPLC Systems chromatograph (Waters Corporation, Milford, MA, USA), equipped with a photodiode array (PDA) detector and coupled to a triple-quadrupole mass spectrometer (Waters ACQUITY® TQD (Tandem Quadrupole Detector), Micromass, Wilmslow, UK). The capillary potential was set to 3.5 kV, the cone voltage was 30 V, the extractor voltage was 3 V, RF lens was set to 0.1 V. The source temperature was 250 °C, desolvation temperature was 350 °C. Nitrogen was used as a desolvation gas at 1000 L h−1 flow and as a cone gas (100 L h−1). Argon was used as a collision gas at the flow of 0.1 mL min−1, and collision energies were optimised for particular phenolic acids. Samples were separated on a Waters ACQUITY UPLC BEH C18 column (100 × 2.1 mm, 1.7 µm) with a mobile phase gradient of solvent A (0.1% formic acid in water, v/v) and solvent B (40% acetonitrile in 0.1% formic acid, v/v). The solvent gradient was programmed as follows: 5 min, 0% B; 0.5 min, 1% B; 2.5 min, 10% B; 10 min, 10–100% B; 1 min, 100% B; 1 min, 100–0% B. The flow rate was kept at 0.3 mL/min, and the column temperature was maintained at 50 °C. The analyses were made in three repetitions. The determinations were made in two repetitions.

2.3.2. Identification of Phenolic Acids

Phenolic acids (PAs) were identified by comparing UV spectra and retention times of peaks in wheat extracts to those of the standard compounds. The following phenolic acids were quantified: ferulic acid (FER), sinapic acid (SIN), p-coumaric acid (p-COU), caffeic acid (CAF), vanillic acid (VAN), syringic acid (SYR), p-hydroxybenzoic acid (p-HB), protocatechuic acid (PCA), and salicylic acid (SA). The concentration of the phenolic acids in samples was calculated based on standard curves.

2.4. Statistical Analysis

All results were statistically developed using a multifactor analysis of variance (ANOVA) using TIBCO Statistica 13.3.0 (TIBCO Software Inc., Palo Alto, CA, USA). The significance of the differences between the means was determined based on the least significant difference (LSD) test at the level of significance p = 0.05. The standard deviation (SD) value is also given for all results. The principal component analysis (PCA) was used to provide a ready means of visualizing the differences and similarities between the investigated locations, cropping systems, and wheat cultivars.

3. Results and Discussion

3.1. The Effect of Genotype and Cropping Systems on the Content of Phenolic Acids

Wheat grain is an important source of PAs [31,45]. In addition to agrotechnical and environmental factors, the PA profiles of wheat grains are strongly associated with their genotype [29,37,44,46].
In the experiment carried out, nine phenolic acids were identified in the grain of wheat cultivars, including FER, SIN, p-COU, CAF, VAN, SYR, p-HB, PCA, and SA.
Statistical analysis showed a significant influence of the cultivar (C), the cropping system (CS), and of the environmental conditions (location (L), weather conditions in years (Y)) on the PA profile of wheat grain. As expected, FER occurred in the highest amounts, while the concentrations of other TPAs were significantly lower (Table 3).
On average, FER levels represented between 87.6 (cv. Batuta) and 88.7% (cvs. Hybred and Hymack) of the TPAs. The grains of the hybrid cultivars cvs. Hybryd and Hymack contained significantly higher amounts of FER and other PAs—except for SIN, p-COU, and SAL—compared to the common cv. Batuta. The grains of cv. Hybred did not statistically differ in their content of SIN and SA compared with cv. Hymack; however, cv. Hybred had significantly higher quantities of p-COU. The PA profile expressed as the mean content of TPAs was FER (88.39%), SIN (5.96%), VAN (1.48%), p-COU (1.46%), SYR (1.35%), p-HB (0.82%), CAF (0.28%), PCA (0.22%), and SA (0.04%).
According to Li et al. [29], the range of FER content for 130 wheat genotypes ranged from 326.0 to 1171.0 μg g−1, with a mean content of 664.0 μg g−1, whereas in our own study the mean was 584.1 μg g−1. Mpofu et al. [44] reported FER content across cultivars from 371.0 to 441.0 μg g−1.
In a study by Horvat et al. [37], the reported ranges of certain PA contents determined in wheat cultivars differ and may vary widely: FER (424.0–482.0 μg g−1), p-COU (32.0–38.0 μg g−1), CAF (20.0–33.0 μg g−1), SYR (14.0–23.0 μg g−1), p-HB (31.0–59.0 μg g−1), TPAs (556.0–654.0 μg g−1).
The cultivation of wheat cultivars in the ORG system compared to the CON system was conducive to the accumulation in the grain of FER (4.0%), SIN (11.1%), CAF (36.3%), VAN (13.1%), SYR (14.3%), and p-HB (22.3%). The INT system resulted in an increase in the number of certain TPAs compared to the CON system; however, some TPAs were significantly lower compared with the ORG system and ranged from 1.0 (FER) to 29.6% (CAF). There were no statistical differences between the ORG and INT systems in the amount of p-COU and PCA found. The SA content was the same in the ORG and CON systems and, significantly, was lowest in the INT system. The CON system reduced TPAs from 3.5% to 5.2% compared to TPAs in the INT and ORG systems. However, the difference in TPAs content between the INT and ORG system was of only 1.8%.
In a study conducted by Żuchowski et al. [12], it was shown that grains from winter and spring wheat cultivars originating from an ORG system had significantly larger amounts of TPAs than wheat cultivated in the CON system by 5.0 and 3.0 μg g−1, respectively. In addition, the ORG system favoured the accumulation in the grains of spring wheat cultivars of FER and PCA, and additionally of SIN.
Similar observations were shown by Zrcková et al. [46] who found statistically significant differences between the ORG and CON systems in the content of determined antioxidant compounds, such as the sum of the content (670.5 and 630.3 μg g-1) and the concentrations (797.0 and 744.7 μg g-1) of phenolic acids..
Elevated concentrations of PAs found in the grain and other plant raw materials in the ORG system, as highlighted by some authors [12,28,47], can be explained by changes in the plant’s metabolism due to differences in the availability of soil nitrogen in the ORG and CON systems (carbon/nutrient balance hypothesis).
According to Stracke et al. [48], the PA content did not change significantly in the wheat grains cultivated in the ORG system compared to the CON.
Moreover, a study by Konopka et al. [49] showed that despite the use of different ecological fertilisation systems (compost, manure, meat, and bone meal) the PA content of wheat grains did not change compared to NPK fertilization. The lowest FER content (418.3 μg g−1) and TPAs (517.3 μg g−1) were found in the variants fertilised with meat and bone meal.
A statistically significant interaction between cropping systems (CS) × cultivars (C) showed that the ORG system compared to the INT and CON systems caused a significant increase in the content of FER, VAN and SYR in the grain of cv. Hybryd, and of CAF in cv. Hymack (Table 4). Cvs. Hybred and Hymack, and cv. Batuta had a 2.8, 1.8, and 0.5% higher TPAs content in the ORG system compared to the INT system, respectively, and a 5.9, 6.6, and 2.7% higher TPAs content compared to the CON system, respectively. The INT system favoured a higher P-COU content in the grain of cv. Hymack, while ORG favoured higher p-HB and PCA in the grains of cv. Hybred.

3.2. The Effect of Environmental Conditions

The values of the determined PAs were significantly differentiated by the conditions of the experiments and their location. A higher content of FER, p-COU, VAN, SYR, p-HB, and PCA in the grains was obtained in the experiments in Dukla compared to the experiments in Nowy Lubliniec (Table 3). Wheat cultivars in Dukla, compared to Nowy Lubliniec, were cultivated on soils with a higher content of SOC, Nmin, and of available forms (N, P, K). Research conducted by Tian et al. [50] indicates that environmental conditions (soil type, soil nitrogen content) have a greater influence on the PA content than genotypes.
The cultivation of wheat cultivars in Dukla was mainly conducive to the accumulation of p-COU, PCA, and p-HB in the grain (an increase of 15.2, 19.5 and 31.0%), and of smaller amounts of FER, SYR, and VAN (an increase of 3.9, 4.6 and 8.3%). The grains from the experiments in Nowy Lubliniec accumulated 4.3% fewer TPAs than in Dukla. However, the impact of the location of the experiments on the amount of SIN, CAF, and SA was not demonstrated. The lower SYR content depending on weather conditions in Nowy Lubliniec and the increase in SIN concentration in Dukla, especially in the dry 2016/2017 year, suggesting that SYR and SIN may be formed in grains using different metabolic pathways, which may be the basis for further physiological studies [50,51,52].
Mpofu et al. [44] showed a significant impact of the diversity of environmental conditions and location on the variability of the phenolic acid profile in wheat. The amounts of VAN (7.7–10.3 μg g−1) and SYR (10.3–16.1 μg g−1) for wheat cultivars grown in four locations were similar to those obtained in our own research. However, Mpofu et al. [44] showed significantly higher amounts of p-COU (28.2–34.5 μg g−1) and CAF (9.7–11.9 μg g−1) and lower amounts for FER (383.6–449.5 μg g−1) compared to the grains of wheat cultivars grown in Dukla and Nowy Lubliniec.
Kowalska et al. [53], based on wheat studies at eight European locations, found that the PA profiles consisted of five hydroxybenzoic acids and four hydroxycinnamic acid derivatives, among which FER and SIN predominated. In our study as well, the PA profiles, expressed by their average content, was dominated by FER and SIN, which accounted for 88.22 and 5.87% of TPAs, respectively, in Dukla, and 88.57 and 6.04% of TPAs, respectively, in Nowy Lubliniec.
In our experiment, no interaction effect between the location (L) and the cultivar (C) is proven, expect for SIN and SA (Table 5). It has been shown that grains of cv. Hybred from Dukla and Nowy Lubliniec collected the highest amounts of FER, VAN, and PCA, as well as of CAF, SYR, and p-HB in the case of grains in Nowy Lubliniec. The quantity of TPAs contained in a grain of cv. Hybred from Dukla was 4.7% higher than in cv. Hymack and 20.0% higher than in cv. Batuta. In Nowy Lubliniec, cv. Hybred had 2.1% more TPAs than cv. Hymack, and 12.1% more than cv. Batuta. The lowest amounts of FER, CAF, VAN, SYR, and TPAs (Dukla), and of p-COU and PCA (Nowy Lubliniec) were obtained in a grain of cv. Batuta. However, grains of this cultivar had the highest amount of p-HB in Dukla.
The interaction of location (L) × cropping systems (CS) also showed a higher accumulation in the wheat grain of FER and TPAs in the ORG and INT systems in Dukla, and in the ORG system in Nowy Lubliniec. In addition, higher amounts of CAF, VAN, SYR, and p-HB in the ORG system in Dukla compared to Nowy Lubliniec was confirmed (Table S1). In addition, the interaction of L × Y shows that 2016/2017 had a significant impact on the content of FER and TPAs in Dukla and Nowy Lubliniec, as well as on the content of SYR, p-HB, and PCA in Dukla, and of CAF in Dukla and Nowy Lubliniec, compared to 2015/2016 and 2017/2018 (Table S2). On the other hand, in each cropping system (interaction CS × L), higher contents of PAs and TPAs—except for SIN, p-COU, PCA, and SA—(Table S3) were favoured in 2016/2017 compared to the 2015/2016 and 2017/2018 seasons.
The PA content of wheat grains is modified by the weather during the growing season [37,46,54], which was confirmed in our own research. Weather patterns strongly modified the wheat grain’s PA profile. Wheat grains harvested in season 2016/2017 had the most PAs and TPAs. Weather conditions in 2015/2016 caused the lowest accumulation of FER, SYR, p-HB, PCA, and TPAs in the wheat grain. This year of research did not affect the content of SA. There were also no differences in the content of SIN, p-COU, CAF, and VAN between the seasons 2015/2016 and 2017/2018.
According to Stumpf et al. [55], the organic factor in the accumulation of PAs in wheat grain is drought stress. The authors showed that the deficiency in precipitation in the period from April to July in the first year of the experiment resulted in a reduction in TPAs and FER content by 55.0% compared to the second year of research.
This was not demonstrated in our research because the season 2015/2016, in which the lowest concentration of PAs in grain was obtained, was characterised by a slight lack of precipitation of 14.1 mm in Dukla and an excess of 20.0 mm in Nowy Lubliniec during the spring–summer vegetation period (April–July). However, it was shown that thermal stress in the season 2016/2017, which occurred in July in both Dukla and Nowy Lubliniec, could cause an increase in the concentration of TPAs in the grain. This is pointed out in the research by De Leonardis et al. [51] which considers that heat stress during the wheat growing season may have interfered with the normal ripening process and therefore relatively more PAs remained in mature wheat grains. This is also confirmed by Tian et al. [50] in which the effect of the wheat harvest year was significant for the concentration of most PAs except for SYR.
The statistical analysis of the results of our research indicates a significant interaction of the cultivar (C) and year of the experiment (Y) in shaping the PA profile of wheat grains (Table 6). A significant interaction between C × Y was established for four acids: FER, VAN, SYR, p-HB, PCA, and TPAs. The hybrid grain cv. Hybred was characterised by the highest content of FER, VAN, SYR, and PCA in the season 2016/2017, higher by 3.8 and 11.9% than in 2017/2018 for FER and VAN, and by 4.5, 11.1 and 26.7% than in 2015/2016 for FER, SYR, and PCA. In addition, for cv. Hybred, a higher TPAs content was shown in 2016/2017 than in other years of research. In general, the 2016/2017 season favoured the accumulation of VAN, SYR, p-HB, PCA, and TPAs in both the hybrid grain of cv. Hymack and common cv. Batuta.

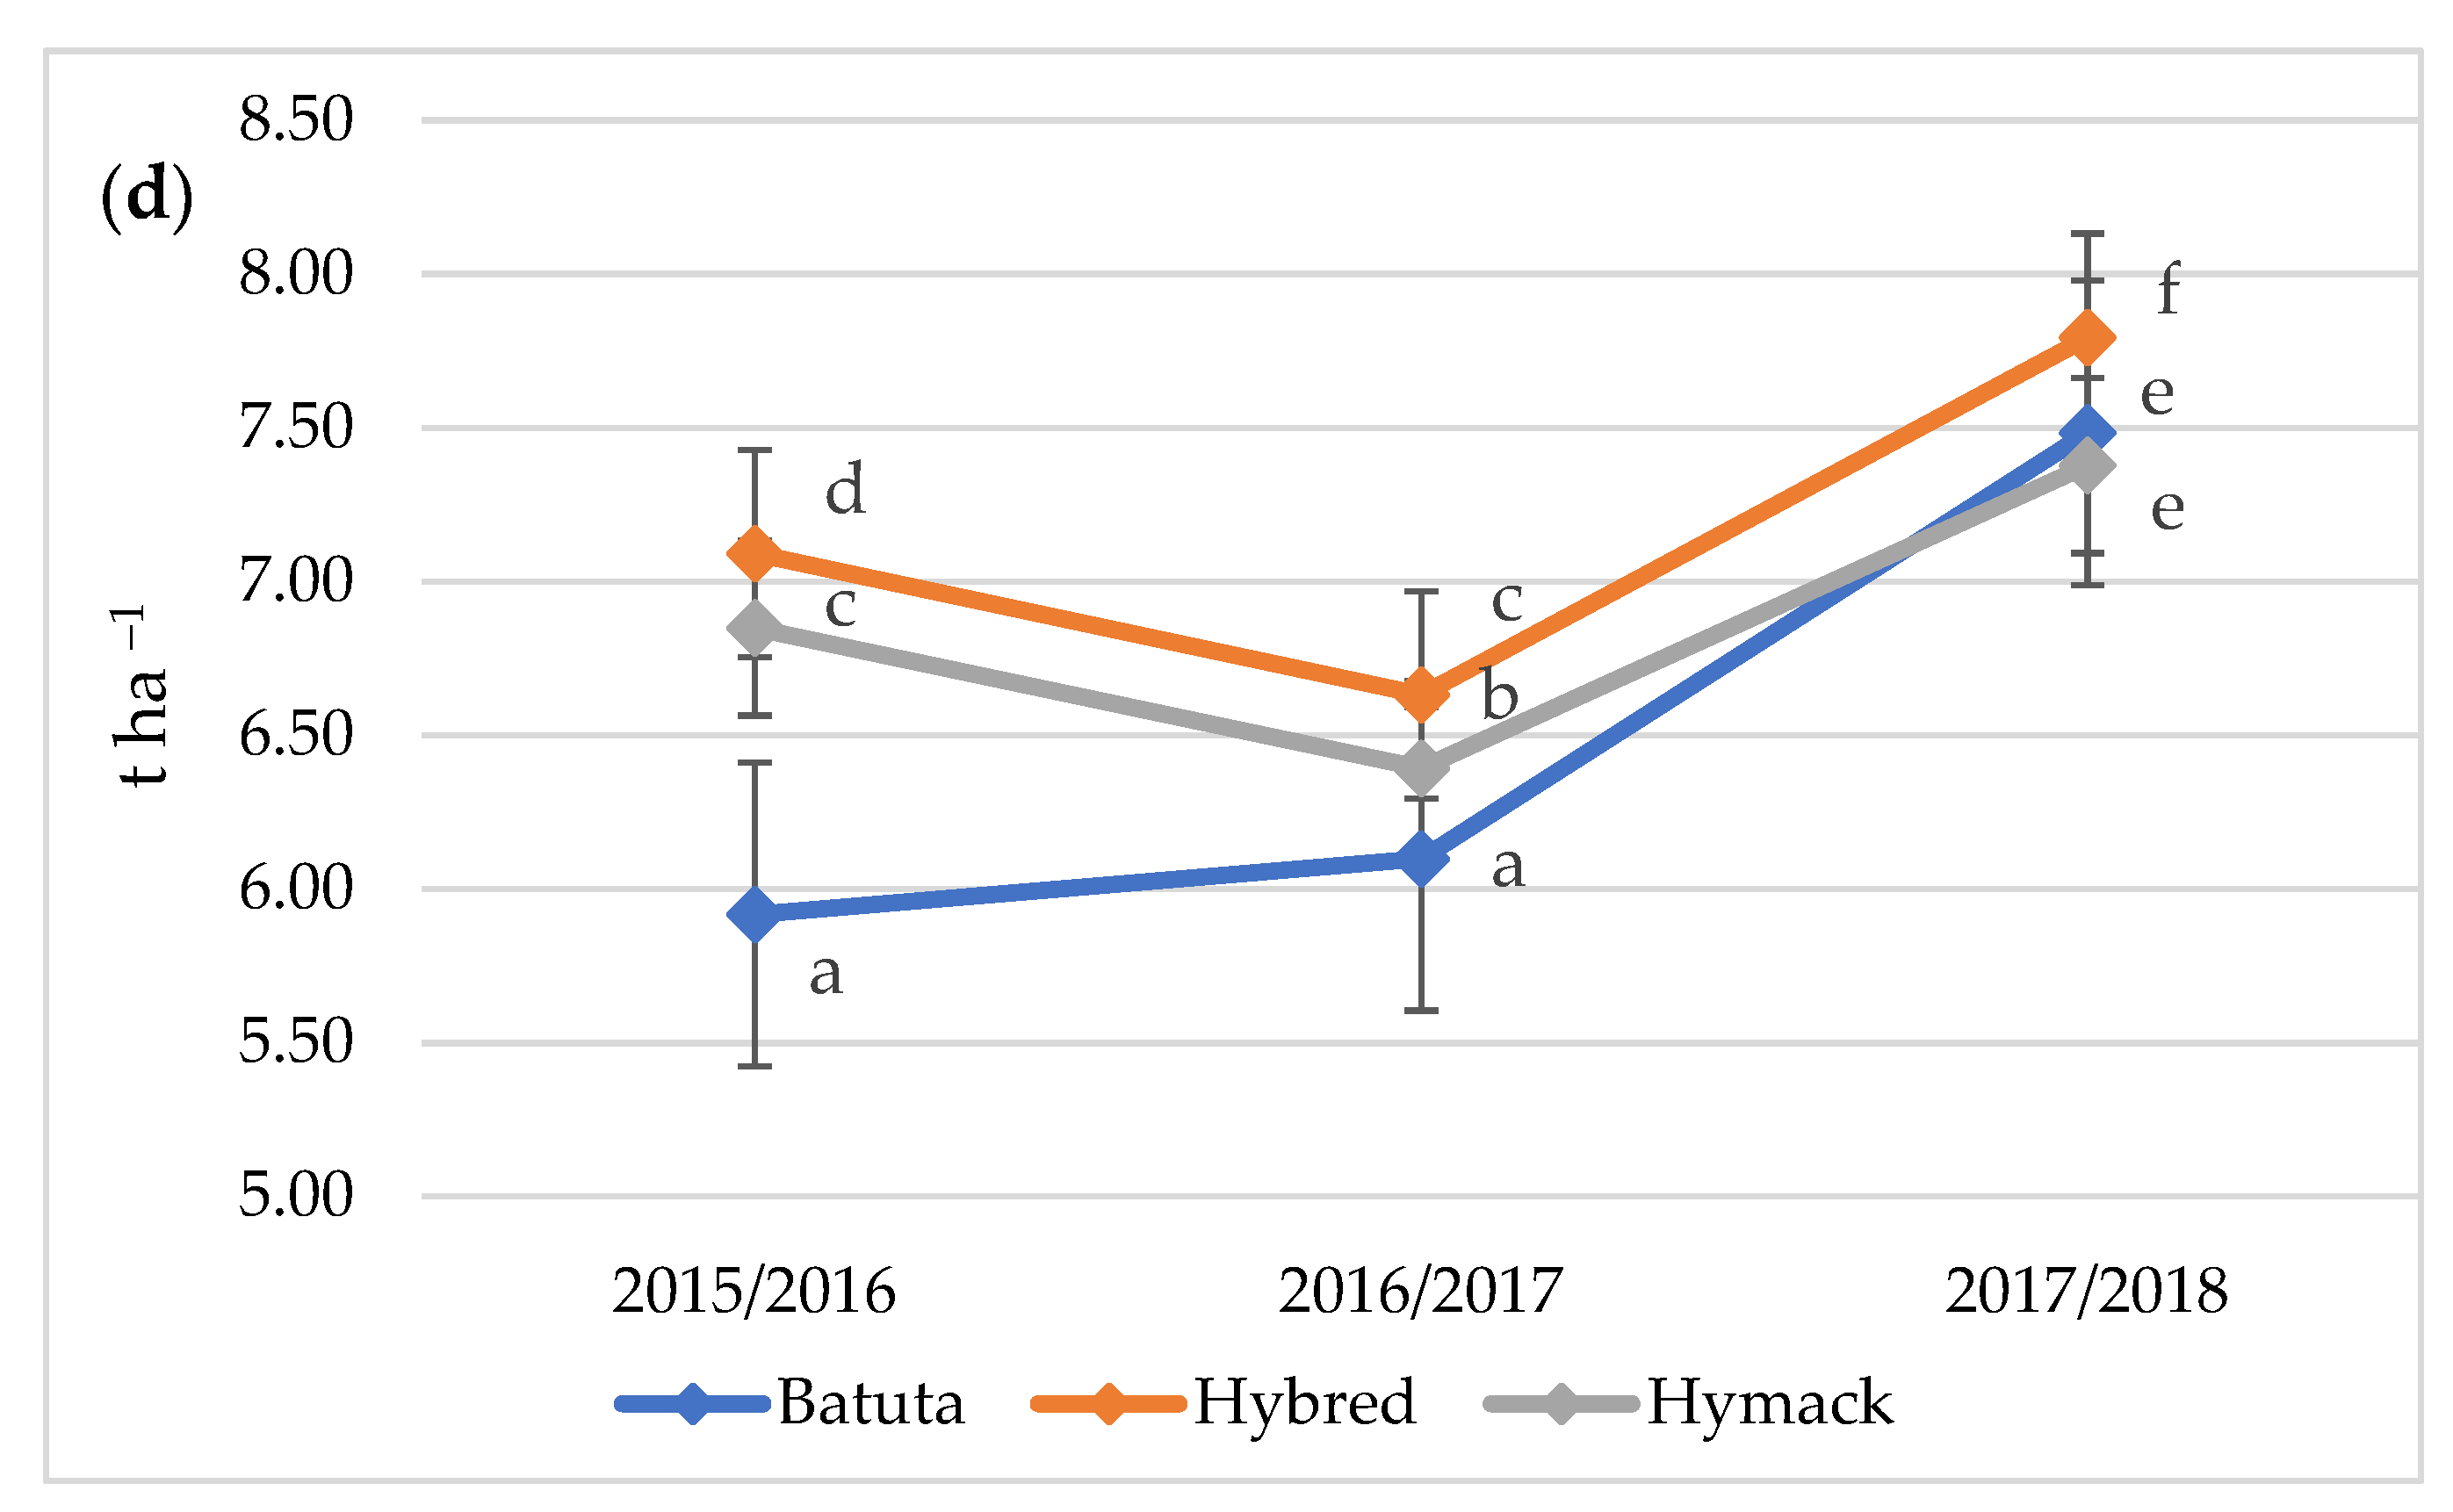
3.3. Grain Yield Performance

In the study, the mean grain yield was 6.85 t ha−1 (Figure 2). The factors in the experiment had a significant impact on the yield of winter wheat cultivars. Taghouti et al. [52] and Rozbicki et al. [56] in their studies have also shown that the effects of genotype, environmental factors, and their interaction have a differentiating effect on the wheat grain yield obtained. The cultivation of wheat cultivars in Dukla resulted in yield higher by 4.0% compared to that recorded in Nowy Lubliniec, which can be explained by better soil parameters including higher organic carbon and Nmin content in the soil as well as other available forms of macronutrients (P, K and Mg) compared to Nowy Lubliniec. The significant influence of soil conditions on wheat yield was also shown by Tkaczyk et al. [19]. These authors, similarly to our study, observed a positive, although statistically insignificant effect of a higher content of potassium and phosphorus in the soil on the yield of winter wheat grain. In our research, wheat cultivation in the CON system resulted in higher grain yield compared to the INT system (by 11.8%) and the ORG system (by 32.3%). The INT and ORG systems are less intensive and more environmentally friendly but the reduction in crop yields compared to the CON system varies from 14.0 to 40.0% [57,58]. Lower crop productivity in the ORG system may be due to a decrease in biomass production and crop structure elements caused by lower fertilisation levels [55,59]. Crop reduction is linked to the reduced availability of nutrients in the soil, including nitrogen, considered to be the main factor responsible for the very low productivity of the ORG system. Nitrogen fertilisation in the CON system may result in an increase in yield; however, an excessive nitrogen application dose not significantly improve yields and has a negative impact on the environment [60,61]. Kołodziejczyk and Szmigiel [62] showed a 26.5% higher crop yield for wheat cultivation in the CON system compared to the INT, which was caused by the application of higher nitrogen doses and the use of comprehensive fungicide protection.
The interaction of the location (L) × cropping system (CS) showed that in the ORG system, a 16.2% higher grain yield was found in Dukla compared to the yield obtained in Nowy Lubliniec (Figure 3a). The use of the CON and INT systems resulted in an increase in yields in both locations, but the differences between Dukla and Nowy Lubliniec were statistically insignificant. However, the ORG system in Dukla showed a higher grain yield compared to in Nowy Lubliniec, which proves that wheat displays more variability of yield in the ORG system than in the CON and INT systems depending on the location of the research.
In our research, introduction to the cultivation of cv. Hybred resulted in a significantly higher grain yield compared to cv. Hymack and cv. Batuta, by 4.3 and 10.3%, respectively. According to previous studies conducted by Whitford et al. [32], Plessis et al. [63], and Jańczak-Pieniążek et al. [64], wheat hybrid cultivars are distinguished by a yield 3.5 to 15.0% higher than the common cultivars, which proves their effectiveness.
Cv. Batuta’s yields were 8.0% lower in Nowy Lubliniec compared to Dukla (Figure 3b). The differences in yields were smaller between the studied locations for hybrid cv. Hybred (3.8%), while for cv. Hymack it was statistically insignificant. This may indicate better stability in the yield of hybrid cultivars, in particular cv. Hymack, when cultivated in different locations.
Dunăreanu and Bonea [65] showed that neither the cultivar factor nor the interaction between cultivation systems affected the differentiation of grain yields. On the other hand, Hildermann et al. [66] found that the cultivar used and a lack of interaction between these factors (CS × C) had an effect, which was also confirmed in our own research.
Wheat yields are affected by weather conditions that are difficult to predict, in particular as a result of progressive climate change. The weather conditions during the growing season play a significant role; therefore, it is important to properly assess its impact on habitat and implement appropriate agricultural practices, which are the main factors determining the grain yield obtained [67]. In our research as well, the weather conditions prevailing in the years of research had a differential effect on wheat yields. The favourable temperatures and precipitation distributions observed in the 2017/2018 season led to higher grain yields for the remaining years of the study. In the 2015/2016 and 2016/2017 seasons, 14.0 and 18.5% lower grain yields, respectively, were achieved compared to the 2017/2018 season. A similar relationship was confirmed by Iwańska et al. [68] who, in their studies, showed the importance of environmental conditions, and in particular weather conditions, as important factors determining the size and quality of the yield of winter wheat grain.
The interaction of location (L) × year of research (Y) showed that in the 2015/2016 season, the yield of wheat cultivated in Dukla was lower than in Nowy Lubliniec, while in 2016/2017 the yield of grains in both locations was at a similar level (Figure 3c). In the final year of the study, as much as a 16.6% higher grain yield was found in Dukla compared to Nowy Lubliniec, which indicates that wheat cultivated in Dukla reacted well to more favourable environmental conditions.
In addition, the interaction between C × Y has been proven as the lowest grain yield was found in cv. Batuta in 2015/2016; however, an increase in yield was shown in 2016/2017 compared to cvs. Hybred and Hymack where a decrease in yield was recorded compared to 2015/2016 (Figure 3d). Favourable weather conditions in 2017/2018 caused an increase in the yields of all studied cultivars. However, cv. Batuta, which had the lowest yields in 2015/2016, was characterised by similar levels of yield to cvs. Hybred and Hymack in 2017/2018. This proves that hybrid cvs. show greater yield stability in years characterised by unfavourable weather conditions compared to the common cv.

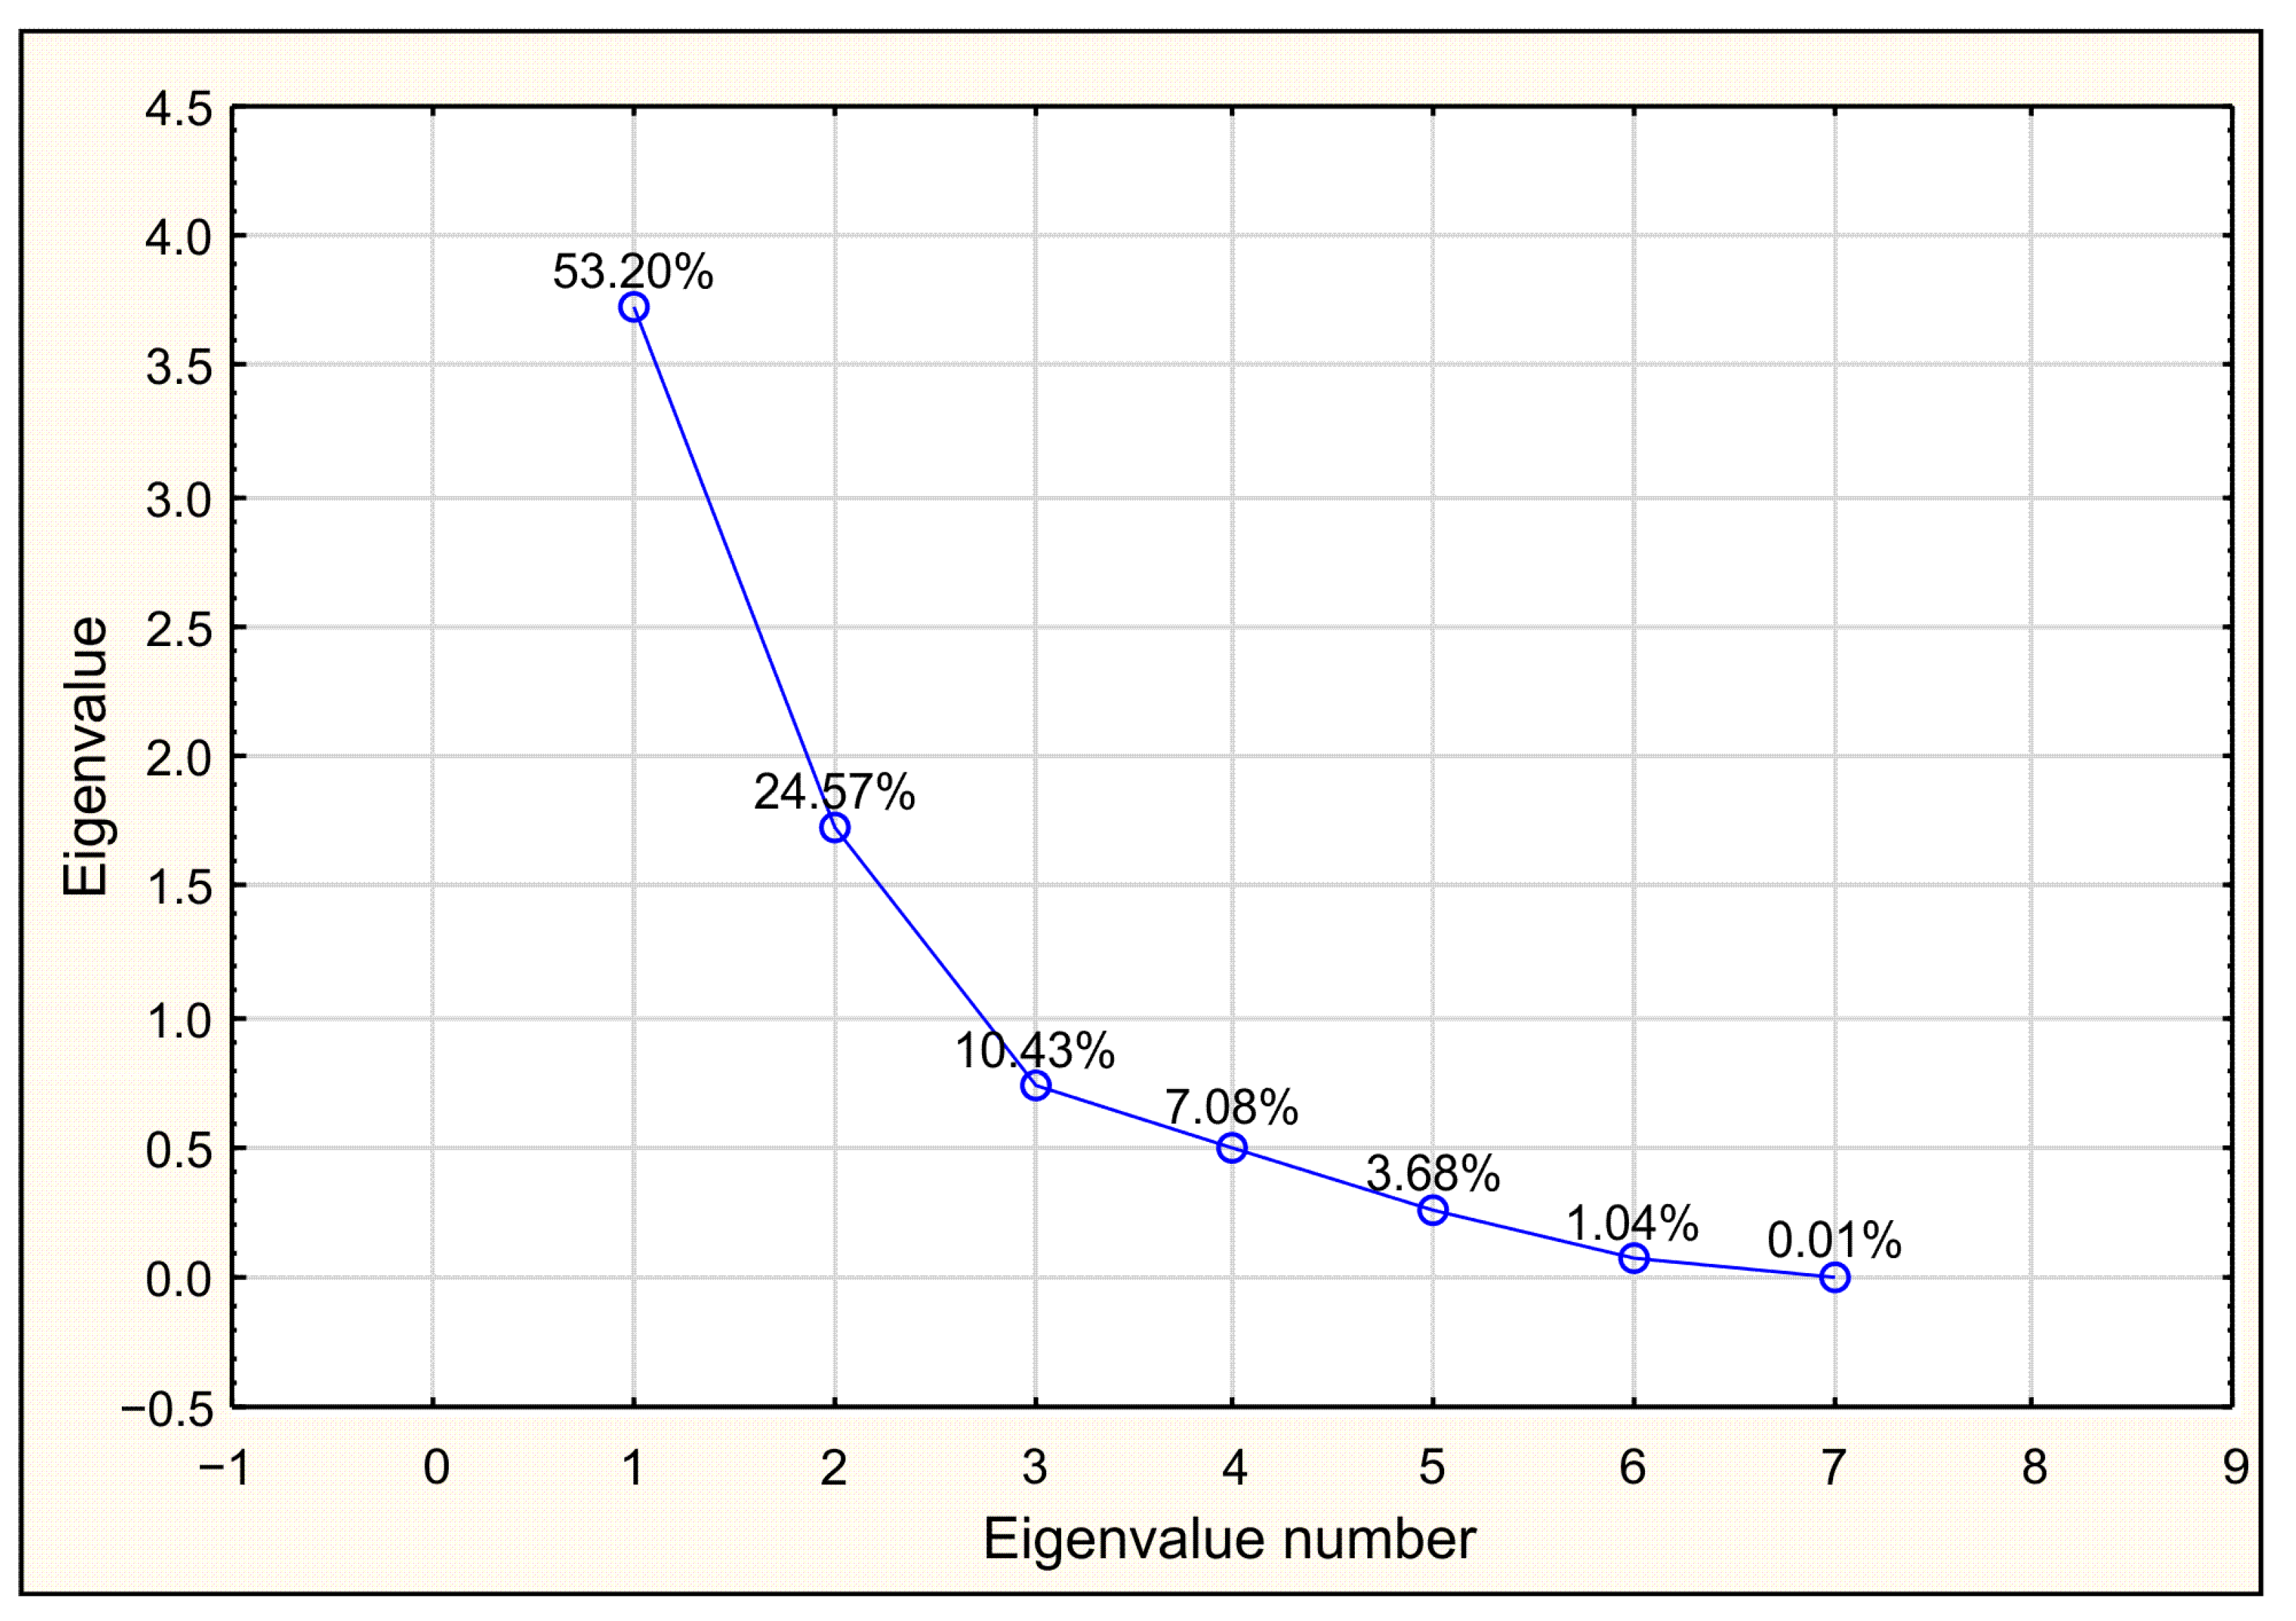
3.4. Principal Component Analysis

The relationship between parameters measured in locations, cropping systems, and wheat cultivars has been assessed by the principal component analysis (PCA) in order to estimate the source of the variability. Among the eleven tested parameters, for the purposes of this analysis, seven extracted principal components were selected which had eigenvalues higher than the average. The eigenvalue for the first component is 3.72, and the percentage of the variance it explains is 53.20%. The second component explains 24.57% of the variance, and its eigenvalue is 1.72 (Table 7). The first two components account for 77.77% of the variability in the original data. In order to determine the number of main components, the criterion of accepting eigenvalues greater than one—the so-called Kaiser criterion—was used [69]. It is therefore possible, with a good approximation, to analyse the original dataset in two dimensions only. The scree plot confirms the significance of the first two components, which allows the reduction in the 7-dimensional space to two components (Figure 4).
Figure 5a describes the projection of variables onto the factor plane. The first component carries negatively correlated information for most variables (Table 8). The second variable component shows a positive charge with the following parameters: FER, CAF, SYR, and TPAs. The variable FER is strongly correlated with the variables TPAs and CAF, while the variable PCA is correlated with the variables VAN and p-HB. Figure 5b shows the projection of the different locations (Dukla and Nowy Lubliniec), cropping systems (ECO, CON, and, INT), and winter cultivars (Batuta, Hybred, and Hymack) on the factor plane. Cultivation of the cv. Batuta in Dukla, regardless of the cropping system used (variants 1, 4, 7), resulted in low values for TPAs, CAF, and FER. Cultivation of this cultivar in Nowy Lubliniec (variants: 10, 13, 16) resulted in the lowest PCA and p-HB values. The application of variants 5, 11, 14, and 17 resulted in high values for TPAs, CAF, and FER, while variant 12 showed low values for PCA, p-HB, and SYR.

4. Conclusions

The variability in the grains’ PA profiles and wheat yields depended mainly on the cultivar genotype, the environmental factors present during the years of research, and the cropping system.
Cv. Hybred was the cultivar showing the highest grain yield and PA content and TPAs, especially during the research season with drought in the grain-ripening phase. This confirms the view that the increasing productivity (yield) of wheat cultivars does not prevent a higher concentration of PAs.
In addition, studies have shown that cultivating hybrid cultivars in the ORG and INT systems can help to increase the level of PAs in grains.
In upland areas with variable conditions during the growing season, it is possible to obtain a higher grain yield from hybrid cultivars. This proves the yielding stability of these cultivars, which can be an alternative to conventional cultivars in years with adverse weather conditions.
The obtained results indicate that it is possible to cultivate high-yielding hybrid wheat cultivars with a high concentration of PAs in different environmental conditions and in cropping systems varying in intensity of inputs. This knowledge may facilitate farmers’ decision making when choosing wheat cultivars (hybrid or common cultivars) based on their genetic profile and the specific environmental and agricultural conditions they are cultivated under.
Hybrid wheat is an interesting source of phenolic acid; however, a thorough understanding of the variability in the genes determining the content of phenolic compounds is also necessary. This is needed for a targeted improvement of the heterosis breeding processes to improve the potential quality and quantity of phenolic compounds in the grains of hybrid wheat cultivars.

Supplementary Materials

The following supporting information can be downloaded at: https://www.mdpi.com/article/10.3390/agriculture13040834/s1. Table S1: Phenolic acids (PAs) composition of wheat grain [μg g−1], mean values for interaction location × cropping systems, Table S2: Phenolic acids (PAs) composition of wheat grain [μg g−1], mean values for interaction location × years, Table S3: Phenolic acids (PAs) composition of wheat grain [μg g−1], mean values for interaction cropping systems × years.

Author Contributions

Conceptualization, J.B., M.J.-P., C.A.K. and E.H.; methodology, J.B., M.J.-P. and I.K.; formal analysis, J.B. and M.J.-P.; investigation, J.B., M.J.-P., C.A.K., E.H. and I.K.; writing—original draft preparation, J.B. and M.J.-P.; writing—review and editing, J.B. and M.J.-P. All authors have read and agreed to the published version of the manuscript.

Funding

This research was funded by the financial resources of the Ministry of Education and Science for the scientific activities of the Institute of Agricultural Sciences, Land Management and Environmental Protection, University of Rzeszow.

Institutional Review Board Statement

Not applicable.

Conflicts of Interest

The authors declare no conflict of interest.

References

  1. Godfray, H.C.J.; Beddington, J.R.; Crute, I.R.; Haddad, L.; Lawrence, D.; Muir, J.F.; Pretty, J.; Robinson, S.; Thomas, S.M.; Toulmin, C. Food Security: The Challenge of Feeding 9 Billion People. Science 2010, 327, 812–818. [Google Scholar] [CrossRef] [Green Version]
  2. FAOSTAT. Available online: https://www.fao.org/faostat/en/#data/QCL (accessed on 7 February 2023).
  3. Chwil, S. Effects of foliar feeding under different soil fertilization conditions on the yield structure and quality of winter wheat (Triticum aestivum L.). Acta Agrobot. 2014, 67, 135–144. [Google Scholar] [CrossRef] [Green Version]
  4. Liu, R.H. Whole grain phytochemicals and health. J. Cereal Sci. 2007, 46, 207–219. [Google Scholar] [CrossRef]
  5. Ma, D.; Wang, C.; Feng, J.; Xu, B. Wheat Grain Phenolics: A Review on Composition, Bioactivity, and Influencing Factors. J. Sci. Food Agric. 2021, 101, 6167–6185. [Google Scholar] [CrossRef] [PubMed]
  6. Shewry, P.R.; Charmet, G.; Branlard, G.; Lafiandra, D.; Gergely, S.; Salgó, A.; Saulnier, L.; Bedő, Z.; Mills, E.N.C.; Ward, J.L. Developing new types of wheat with enhanced health benefits. Trends Food Sci. Technol. 2012, 25, 70–77. [Google Scholar] [CrossRef]
  7. Żuchowski, J.; Kapusta, I.; Szajwaj, B.; Jończyk, K.; Oleszek, W. Phenolic acid content of organic and conventionally grown winter wheat. Cereal Res. Commun. 2009, 37, 189–197. [Google Scholar] [CrossRef]
  8. Shewry, P.R.; Hey, S. Do ‘ancient’ wheat species differ from modern bread wheat in their contents of bioactive components? J. Cereal Sci. 2015, 65, 236–243. [Google Scholar] [CrossRef] [Green Version]
  9. Zhu, Y.; Sang, S. Phytochemicals in whole grain wheat and their health-promoting effects. Mol. Nutr. Food Res. 2017, 61, 1600852. [Google Scholar] [CrossRef]
  10. Naczk, M.; Shahidi, F. Phenolics in cereals, fruits and vegetables: Occurrence, extraction and analysis. J. Pharm. Biomed. Anal. 2006, 41, 1523–1542. [Google Scholar] [CrossRef]
  11. Siebenhandl, S.; Grausgruber, H.; Pellegrini, N.; del Rio, D.; Fogliano, V.; Pernice, R.; Berghofer, E. Phytochemical profile of main antioxidants in different fractions of purple and blue wheat, and black barley. J. Agric. Food Chem. 2007, 55, 8541–8547. [Google Scholar] [CrossRef]
  12. Żuchowski, J.; Jończyk, K.; Pecio, L.; Oleszek, W. Phenolic acid concentrations in organically and conventionally cultivated spring and winter wheat. J. Sci. Food Agric. 2011, 91, 1089–1095. [Google Scholar] [CrossRef]
  13. Martini, D.; Taddei, F.; Ciccoritti, R.; Pasquini, M.; Nicoletti, I.; Corradini, D.; D’Egidio, M.G. Variation of total antioxidant activity and of phenolic acid, total phenolics and yellow coloured pigments in durum wheat (Triticum turgidum L. var. durum) as a function of genotype, crop year and growing area. J. Cereal Sci. 2015, 65, 175–185. [Google Scholar] [CrossRef]
  14. Stuper-Szablewska, K.; Kurasiak-Popowska, D.; Nawracała, J.; Perkowski, J. Quantitative profile of phenolic acids and antioxidant activity of wheat grain exposed to stress. Eur. Food Res. Technol. 2019, 245, 1595–1603. [Google Scholar] [CrossRef] [Green Version]
  15. Spaggiari, M.; Calani, L.; Folloni, S.; Ranieri, R.; Dall’Asta, C.; Galaverna, G. The impact of processing on the phenolic acids, free betaine and choline in Triticum spp. L. whole grains and milling by-products. Food Chem. 2020, 311, 125940. [Google Scholar] [CrossRef] [PubMed]
  16. Gupta, R.; Meghwal, M.; Prabhakar, P.K. Bioactive compounds of pigmented wheat (Triticum aestivum): Potential benefits in human health. Trends Food Sci. Technol. 2021, 110, 240–252. [Google Scholar] [CrossRef]
  17. Žilić, S.; Šukalović, V.H.-T.; Dodig, D.; Maksimović, V.; Maksimović, M.; Basić, Z. Antioxidant activity of small grain cereals caused by phenolics and lipid soluble antioxidants. J. Cereal Sci. 2011, 54, 417–424. [Google Scholar] [CrossRef]
  18. Yong, Z.; Zhonghu, H.; Ye, G.; Aimin, Z.; Van Ginkel, M. Effect of environment and genotype on bread-making quality of spring-sown spring wheat cultivars in China. Euphytica 2004, 139, 75–83. [Google Scholar] [CrossRef]
  19. Tkaczyk, P.; Bednarek, W.; Dresler, S.; Krzyszczak, J. The effect of some soil physicochemical properties and nitrogen fertilisation on winter wheat yield. Acta Agrophys. 2018, 25, 107–116. [Google Scholar] [CrossRef]
  20. Średnicka-Tober, D.; Obiedzińska, A.; Kazimierczak, R.; Rembiałkowska, E. Environmental impact of organic vs. conventional agriculture—A review. J. Res. Appl. Agric. Eng. 2016, 61, 204–211. [Google Scholar]
  21. Szeląg-Sikora, A.; Sikora, J.; Niemiec, M.; Gródek-Szostak, Z.; Kapusta-Duch, J.; Kuboń, M.; Komorowska, M.; Karcz, J. Impact of Integrated and Conventional Plant Production on Selected Soil Parameters in Carrot Production. Sustainability 2019, 11, 5612. [Google Scholar] [CrossRef] [Green Version]
  22. Durán-Lara, E.F.; Valderrama, A.; Marican, A. Natural Organic Compounds for Application in Organic Farming. Agriculture 2020, 10, 41. [Google Scholar] [CrossRef] [Green Version]
  23. Charyulu, D.K.; Biswas, S. Economics and Efficiency of Organic Farming Vis-à-Vis Conventional Farming in India; Indian Institute of Management: Ahmedabad, India, 2010. [Google Scholar]
  24. Kilcher, L. How organic agriculture contributes to sustainable development. J. Agric. Res. Trop. Subtrop. 2007, 89, 31–49. Available online: https://orgprints.org/id/eprint/10680/1/Kilcher_2007_JARTS_SP_89.pdf (accessed on 9 February 2023).
  25. Tuomisto, H.L.; Hodge, I.D.; Riordan, P.; Macdonald, D.W. Comparing global warming potential, energy use and land use of organic, conventional and integrated winter wheat production. Ann. Appl. Biol. 2012, 161, 116–126. [Google Scholar] [CrossRef]
  26. Grabiński, J. Productive and Economical Effects of Intensive and Integrated Technology Production of Winter Wheat and Spring Barley. Ann. Pol. Assoc. Agric. Agribus. Econ. 2015, 17, 94–99. Available online: http://ageconsearch.umn.edu/record/233486 (accessed on 9 February 2023). (In Polish).
  27. Barański, M.; Średnicka-Tober, D.; Volakakis, N.; Seal, C.; Sanderson, R.; Stewart, G.B.; Benbrook, C.; Biavati, B.; Marellou, E.; Giotis, C.; et al. Higher antioxidant and lower cadmium concentrations and lower incidence of pesticide residues in organically grown crops: A systematic literature review and meta-analyses. Br. J. Nutr. 2014, 112, 794–811. [Google Scholar] [CrossRef] [Green Version]
  28. Rembiałkowska, E. Quality of plant products from organic agriculture. J. Sci. Food Agric. 2007, 87, 2757–2762. [Google Scholar] [CrossRef]
  29. Li, L.; Shewry, P.R.; Ward, J.L. Phenolic acids in wheat varieties in the HEALTHGRAIN diversity screen. J. Agric. Food Chem. 2008, 56, 9732–9739. [Google Scholar] [CrossRef]
  30. Zhang, Y.; Wang, L.; Yao, Y.; Yan, J.; He, Z. Phenolic acid profiles of chinese wheat cultivars. J. Cereal Sci. 2012, 56, 629–635. [Google Scholar] [CrossRef]
  31. Tian, W.; Wang, F.; Xu, K.; Zhang, Z.; Yan, J.; Yan, J.; Tian, Y.; Liu, J.; Zhang, Y.; Zhang, Y.; et al. Accumulation of wheat phenolic acids under different nitrogen rates and growing environments. Plants 2022, 11, 2237. [Google Scholar] [CrossRef]
  32. Whitford, R.; Fleury, D.; Reif, J.C.; Garcia, M.; Okada, T.; Korzun, V.; Langridge, P. Hybrid breeding in wheat: Technologies to improve hybrid wheat seed production. J. Exp. Bot. 2013, 64, 5411–5428. [Google Scholar] [CrossRef] [Green Version]
  33. Gupta, P.K.; Balyan, H.S.; Gahlaut, V.; Saripalli, G.; Pal, B.; Basnet, B.R.; Joshi, A.K. Hybrid wheat: Past, present and future. Theor. Appl. Genet. 2019, 132, 2463–2483. [Google Scholar] [CrossRef]
  34. Jańczak-Pieniążek, M.; Buczek, J.; Kaszuba, J.; Szpunar-Krok, E.; Bobrecka-Jamro, D.; Jaworska, G. A Comparative Assessment of the Baking Quality of Hybrid and Population Wheat Cultivars. Appl. Sci. 2020, 10, 7104. [Google Scholar] [CrossRef]
  35. Muqaddasi, Q.H.; Reif, J.C.; Röder, M.S.; Basnet, B.R.; Dreisigacker, S. Genetic mapping reveals large-effect qtl for anther extrusion in CIMMYT spring wheat. Agronomy 2019, 9, 407. [Google Scholar] [CrossRef] [Green Version]
  36. Hung, P.V. Phenolic compounds of cereals and their antioxidant capacity. Crit. Rev. Food Sci. Nutr. 2016, 56, 25–35. [Google Scholar] [CrossRef]
  37. Horvat, D.; Šimić, G.; Drezner, G.; Lalić, A.; Ledenčan, T.; Tucak, M.; Plavšić, H.; Andrić, L.; Zdunić, Z. Phenolic acid profiles and antioxidant activity of major cereal crops. Antioxidants 2020, 9, 527. [Google Scholar] [CrossRef]
  38. IUSS Working Group WRB World Reference Base for Soil Resources 2014, First Update. 2015. Available online: https://icdc.cen.uni-hamburg.de/fileadmin/user_upload/icdc_Dokumente/WorldSoilResources_a-i3794e.pdf (accessed on 9 February 2023).
  39. Šimanský, V.; Bajcan, D.; Ducsay, L. The effect of organic matter on aggregation under different soil management practices in a vineyard in an extremely humid year. Catena 2013, 101, 108–113. [Google Scholar] [CrossRef]
  40. Van Erp, P.J.; Houba, Y.J.G.; Van Beusichem, M.L. One hundredth molar calcium chloride extraction procedure. Part I: A review of soil chemical, analytical, and plant nutritional aspects. Commun. Soil Sci. Plant Anal. 1998, 29, 1603–1623. [Google Scholar] [CrossRef]
  41. Egner, H.; Riehm, H.; Domingo, R.W. Investigations on the chemical soil analysis as a basis for assessing the nutrient condition of the soil, II: Chemical extraction methods for phosphorus and potassium determination. K. Lantbr. Ann. 1960, 26, 199–215. [Google Scholar]
  42. Schachtschabel, P. The plant-available magnesium in the soil and its determination. Z. Pflanz. Düngung Bodenkd. 1954, 67, 9–23. [Google Scholar] [CrossRef]
  43. Rinkis, G.J. Micronutrients in Agriculture and Medicine; Naukova Dumka: Kijev, Ukraine, 1963. [Google Scholar]
  44. Mpofu, A.; Sapirstein, H.D.; Beta, T. Genotype and environmental variation in phenolic content, phenolic acid composition, and antioxidant activity of hard spring wheat. J. Agric. Food Chem. 2006, 54, 1265–1270. [Google Scholar] [CrossRef]
  45. Abotaleb, M.; Liskova, A.; Kubatka, P.; Büsselberg, D. Therapeutic potential of plant phenolic acids in the treatment of cancer. Biomolecules 2020, 10, 221. [Google Scholar] [CrossRef] [Green Version]
  46. Zrcková, M.; Capouchová, I.; Eliášová, M.; Paznocht, L.; Pazderů, K.; Dvořák, P.; Konvalina, P.; Orsák, M.; Štěrba, Z. The effect of genotype, weather conditions and cropping system on antioxidant activity and content of selected antioxidant compounds in wheat with coloured grain. Plant Soil Environ. 2018, 64, 530–538. [Google Scholar] [CrossRef] [Green Version]
  47. Massad, T.J.; Dyer, L.A.; Vega, G.C. Costs of defense and a test of the carbon-nutrient balance and growth-differentiation balance hypotheses for two co-occurring classes of plant de-fense. PLoS ONE 2012, 7, e47554. [Google Scholar] [CrossRef] [Green Version]
  48. Stracke, B.A.; Eitel, J.; Watzl, B.; Mader, P.; Rufer, C.E. Influence of the Production Method on Phytochemical Concentrations in Whole Wheat (Triticum aestivum L.): A Comparative Study. J. Agric. Food Chem. 2009, 57, 10116–10121. [Google Scholar] [CrossRef] [PubMed]
  49. Konopka, I.; Tańska, M.; Faron, A.; Stępień, A.; Wojtkowiak, K. Comparison of the phenolic compounds, carotenoids and tocochromanols content in wheat grain under organic and mineral fertilization regimes. Molecules 2012, 17, 12341–12356. [Google Scholar] [CrossRef] [PubMed] [Green Version]
  50. Tian, W.; Wilson, T.L.; Chen, G.; Guttieri, M.J.; Nelson, N.O.; Fritz, A.; Smith, G.; Li, Y. Effects of environment, nitrogen, and sulfur on total phenolic content and phenolic acid composition of winter wheat grain. Cereal Chem. 2021, 98, 903–911. [Google Scholar] [CrossRef]
  51. De Leonardis, A.M.; Fragasso, M.; Beleggia, R.; Ficco, D.B.M.; De Vita, P.; Mastrangelo, A.M. Effects of heat stress on metabolite accumulation and composition, and nutritional properties of durum wheat grain. Int. J. Mol. Sci. 2015, 16, 30382–30404. [Google Scholar] [CrossRef] [Green Version]
  52. Taghouti, M.; Gaboun, F.; Nsarellah, N.; Rhrib, R.; El-Haila, M.; Kamar, M.; Abbad-Andaloussi, F.; Udupa, S.M. Genotype × environment interaction for quality traits in durum wheat cultivars adapted to different environments. Afr. J. Biotechnol. 2010, 9, 3054–3062. Available online: https://www.ajol.info/index.php/ajb/article/view/80550 (accessed on 9 February 2022).
  53. Kowalska, I.; Mołdoch, J.; Pawelec, S.; Podolska, G.; von Cossel, M.; Derycke, V.; Haesaert, G.; Lana, M.A.; da Silva Lopes, M.; Riche, A.B.; et al. Environmental and cultivar variability in composition, content and biological activity of phenolic acids and alkylresorcinols ofwinter wheat grains from a multi-site field trial across Europe. J. Cereal Sci. 2022, 107, 103527. [Google Scholar] [CrossRef]
  54. Laddomada, B.; Blanco, A.; Mita, G.; D’Amico, L.; Singh, R.P.; Ammar, K.; Crossa, J.; Guzmán, C. Drought and heat stress impacts on phenolic acids accumulation in durum wheat cultivars. Foods 2021, 10, 2142. [Google Scholar] [CrossRef]
  55. Stumpf, B.; Yan, F.; Honermeier, B. Influence of nitrogen fertilization on yield and phenolic compounds in wheat grains (Triticum aestivum L. ssp aestivum). J. Plant Nutr. Soil Sci. 2019, 182, 111–118. [Google Scholar] [CrossRef] [Green Version]
  56. Rozbicki, J.; Ceglińska, A.; Gozdowski, D.; Jakubczak, M.; Cacak-Pietrzak, G.; Mądry, W.; Golba, J.; Piechociński, M.; Sobczyński, G.; Studnicki, M.; et al. Influence of the cultivar, environment and management on the grain yield and bread-making quality in winter wheat. J. Cereal Sci. 2015, 61, 126–132. [Google Scholar] [CrossRef]
  57. Seufert, V.; Ramankutty, N.; Foley, J.A. Comparing the yields of organic and conventional agriculture. Nature 2012, 485, 229–232. [Google Scholar] [CrossRef] [PubMed]
  58. Iannucci, A.; Codianni, P. Effects of conventional and organic farming systems on bio-agronomic and quality traits of durum wheat under Mediterranean conditions. Aust. J. Crop Sci. 2016, 10, 1083–1091. [Google Scholar] [CrossRef]
  59. Sacco, D.; Moretti, B.; Monaco, S.; Grignani, C. Six-year transition from conventional to organic farming: Effects on crop production and soil quality. Eur. J. Agron. 2015, 69, 10–20. [Google Scholar] [CrossRef]
  60. Sadras, V.O.; Calderini, D.F. Crop Physiology—Applications for Genetic Improvement and Agronomy; Elsevier: London, UK, 2009. [Google Scholar]
  61. Moitzi, G.; Neugschwandtner, R.W.; Kaul, H.-P.; Wagentristl, H. Efficiency of mineral nitrogen fertilization in winter wheat under Pannonian climate conditions. Agriculture 2020, 10, 541. [Google Scholar] [CrossRef]
  62. Kołodziejczyk, M.; Szmigiel, A. Efficiency of nitrogen fertilization in spring wheat. Int. J. Plant Prod. 2016, 10, 447–456. [Google Scholar] [CrossRef]
  63. Plessis, A.; Ravel, C.; Bordes, J.; Balfourier, F.; Martre, P. Association study of wheat grain protein composition reveals that gliadin and glutenin composition are trans-regulated by different chromosome regions. J. Exp. Bot. 2013, 64, 3627–3644. [Google Scholar] [CrossRef] [Green Version]
  64. Jańczak-Pieniążek, M.; Buczek, J.; Kwiatkowski, C.A.; Harasim, E. The Course of physiological processes, yielding, and grain quality of hybrid and population wheat as affected by integrated and conventional cropping systems. Agronomy 2022, 12, 1345. [Google Scholar] [CrossRef]
  65. Dunăreanu, I.C.; Bonea, D. Grain yield and hectolitre weight of some wheat cultivars in organic and conventional production systems. Rom. Agric. Res. 2022, 39, 1–9. Available online: https://www.incda-fundulea.ro/new/images/rar/nr39/rar39.22.pdf (accessed on 9 February 2023).
  66. Hildermann, I.; Thommen, A.; Dubois, D.; Boller, T.; Wiemken, A.; Mader, P. Yield and baking quality of winter wheat cultivars in different farming systems of the DOK long-term trial. J. Sci. Food Agric. 2009, 89, 2477–2491. [Google Scholar] [CrossRef]
  67. Koppensteiner, L.J.; Kaul, H.-P.; Piepho, H.-P.; Barta, N.; Euteneuer, P.; Bernas, J.; Klimek-Kopyra, A.; Gronauer, A.; Neugschwandtner, R.W. Yield and yield components of facultative wheat are affected by sowing time, nitrogen fertilization and environment. Eur. J. Agron. 2022, 140, 126591. [Google Scholar] [CrossRef]
  68. Iwańska, M.; Paderewski, J.; Stępień, M.; Rodrigues, P.C. Adaptation of winter wheat cultivars to different environments: A case study in Poland. Agronomy 2020, 10, 632. [Google Scholar] [CrossRef]
  69. Kaiser, H.F. The application of electronic computers to factor analysis. Educ. Psychol. Meas. 1960, 20, 141–151. [Google Scholar] [CrossRef]
Figure 1. Weather conditions during the spring–summer growing season of wheat in two locations (a) Dukla; (b) Nowy Lubliniec.
Agriculture 13 00834 g001
Figure 2. Wheat grain yield depends on location, cropping system, cultivar, and years of research. Different letters show significant differences between means (according to the Tukey test p < 0.05). ORG—organic system; INT—integrated system; CON—conventional system.
Agriculture 13 00834 g002
Figure 3. Wheat grain yield—interactions between experimental factors: (a) cropping system × location (CS × L); (b) cultivar × location (C × L); (c) location × year of research (L × Y); and (d) cultivar × year of research (C × Y). Different letters show significant differences between means (according to the Tukey test p < 0.05). ORG—organic system; INT—integrated system; CON—conventional system.
Agriculture 13 00834 g003aAgriculture 13 00834 g003b
Figure 4. Scree plot for individual values of the matrix of correlation.
Agriculture 13 00834 g004
Figure 5. Principal components analysis of the (a) distribution of the analyzed parameters, and (b) distribution of variants of the experiment: 1—Dukla/EKO/Batuta; 2—Dukla/EKO/Hybred; 3—Dukla/EKO/Hymack; 4—Dukla/INT/Batuta; 5—Dukla/INT/Hybred; 6—Dukla/INT/Hymack; 7—Dukla/CON/Batuta; 8—Dukla/CON/Hybred; 9—Dukla/CON/Hymack; 10—N. Lubliniec/EKO/Batuta; 11—N. Lubliniec/EKO/Hybred; 12—N. Lubliniec/EKO/Hymack; 13—N. Lubliniec/INT/Batuta; 14—N. Lubliniec/INT/Hybred; 15—N. Lubliniec/INT/Hymack; 16—N. Lubliniec/CON/Batuta; 17—N. Lubliniec/CON/Hybred; 18—N. Lubliniec/CON/Hymack.
Agriculture 13 00834 g005
Table 1. Physical and chemical properties of the soil (0–35 cm).
YearspH
in M
KCl
Soil Organic Carbon (SOC) (%)Nmin
(kg ha−1)
Content of Available Forms (mg kg−1 Soil)
Phosphorus (P)Potassium (K)Magnesium (Mg)Zinc (Zn)Manganese (Mn)Copper (Cu)
Dukla
2015/20166.821.2258.3180.0170.181.013.682.45.2
2016/20175.901.1260.6175.3174.272.214.384.25.4
2017/20186.201.4265.7120.1152.368.415.187.25.8
Nowy Lubliniec
2015/20165.360.8252.4166.2162.450.114.888.55.1
2016/20176.101.1563.0170.1141.252.113.985.95.5
2017/20186.500.9258.1101.0150.556.114.086.45.6
SOC—by Tiurin’s method [39]; Nmin—in 0.01 CaCl2 solution [40]; P, K—by Egner-Riehm’s method [41]; Mg—by Schachtschabel’s method [42]; Zn, Mn, Cu—by Rinkis’s method [43].
Table 2. Temperature and precipitation in the experimental period.
Period/MonthsDuklaNowy Lubliniec
2015/
2016
2016/
2017
2017/
2018
Long Term2015/
2016
2016/
2017
2017/
2018
Long Term
Temperature [°C]
Autum/09–118.19.48.68.18.29.89.27.9
Winter rest/12–03−3.6−2.51.3−2.2−2.8−2.2−0.5−1.9
Spring–summer/04–0715.114.915.215.116.215.815.715.9
Sowing–harvest/09–077.98.18.77.58.38.69.28.2
Precipitation [mm]
Autum/09–1178.3129.2232.9185.158.9129.4178.3149.8
Winter rest/12–03171.8162.589.8140.8130.4145.398.799.0
Spring–summer/04–07387.5352.4384.6401.6327.4259.7326.1307.4
Sowing–harvest/09–07637.6644.1707.3727.5516.7534.4603.1556.2
Long-term (1960–2014).
Table 3. Phenolic acid (PA) composition of wheat grain [μg g−1], mean values for factors.
FactorsFERSINp-COUCAFVANSYRp-HBPCASATPAs
Cultivars (C)
Batuta519.13 a
±13.04
38.13 a
±3.55
9.25 a,b
±1.42
1.27 a
±0.36
9.11 b
±1.19
7.27 a
±1.06
4.74 b
±2.16
1.05 b
±0.43
0.26 b
±0.05
592.72 a
±17.19
Hybred627.41 c
±36.27
40.61 a,b
±3.32
9.88 a
±1.28
2.44 b
±0.69
10.42 c
±1.45
10.59 c
±2.19
5.92 c
±1.27
1.95 c
±0.38
0.28 a
±0.05
707.03 c
±40.20
Hymack605.82 b
±21.28
39.33 b
±5.30
9.81 b
±2.55
1.90 c
±0.73
9.92 a
±1.50
8.82 b
±2.59
5.61 a
±1.62
1.30 a
±0.36
0.27 a,b
±0.06
682.75 b
±32.13
Cropping systems (CS)
ORG593.94 c
±56.25
42.06 b
±4.42
10.02 b
±1.80
2.40 c
±0.85
10.40 c
±1.62
9.91 c
±3.02
6.01 c
±1.93
1.53 b
±0.60
0.28 b
±0.06
676.55 c
±63.95
INT588.19 b
±55.59
38.63 a
±3.20
9.83 b
±1.86
1.69 b
±0.67
10.00 b
±1.04
8.97 b
±1.91
5.59 b
±1.63
1.47 b
±0.48
0.25 a
±0.04
664.61 b
±58.19
CON570.23 a
±46.11
37.39 a
±3.60
9.09 a
±1.79
1.53 a
±0.46
9.04 a
±1.39
7.80 a
±1.80
4.67 a
±1.52
1.30 a
±0.54
0.28 b
±0.05
641.34 a
±47.64
Location (L)
Dukla595.79 b
±63.85
39.66 a
±4.82
10.44 b
±1.87
1.90 a
±0.97
10.24 b
±1.60
9.10 b
±2.69
6.42 b
±1.54
1.59 b
±0.41
0.28 a
±0.05
675.37 b
±68.67
Nowy Lubliniec572.45 a
±37.25
39.05 a
±3.58
8.85 a
±1.44
1.84 a
±0.52
9.39 a
±1.21
8.68 a
±2.17
4.43 a
±1.40
1.28 a
±0.61
0.26 a
±0.05
646.30 a
±41.53
Years (Y)
2015/2016575.39 a
±51.37
38.16 a
±3.32
9.05 a
±1.78
1.74 a
±0.72
9.32 a
±1.43
8.42 a
±2.25
4.97 a
±1.81
1.27 a
±0.44
0.26 a
±0.05
648.58 a
±55.24
2016/2017596.03 c
±58.32
41.34 b
±3.92
10.47 b
±1.84
2.11 b
±0.79
10.54 b
±1.53
9.47 c
±2.53
5.93 c
±1.80
1.66 c
±0.63
0.28 a
±0.06
677.83 c
±62.92
2017/2018580.94 b
±49.20
38.57 a
±4.71
9.42 a
±1.66
1.76 a
±0.78
9.58 a
±1.19
8.78 b
±2.50
5.38 b
±1.62
1.38 b
±0.47
0.27 a
±0.05
656.09 b
±54.02
Mean584.1239.369.651.879.818.895.421.430.27660.83
C**********************
CS*****************************
L*ns***ns**********ns***
Y************************ns***
Values are expressed as mean ± SD. Means in a column followed by different letters show significant differences (p < 0.05) according to the Tukey test. Significance at: *** p < 0.001; ** p < 0.01; * p < 0.05; ns—not significant. FER—ferulic acid, SIN—sinapic acid, p-COU—p-coumaric acid, CAF—caffeic acid, VAN—vanillic acid, SYR—syringic acid, p-HB—p-hydroxybenzoic acid, PCA, protocatechuic acid, SA—salicylic acid, TPAs—total content of phenolic acids
Table 4. Phenolic acid (PA) composition of wheat grain [μg g−1], mean values for interaction cropping systems × cultivars.
Cropping Systems (CS)Cultivars (C)FERSINp-COUCAFVANSYRp-HBPCASATPAs
ORGBatuta523.14 b
±16.96
39.74 a,b
±3.43
9.97 b–d
±1.42
1.54 b
±0.34
10.04 c
±1.16
7.23 b
±1.22
5.74 c
±2.30
1.37 c
±0.50
0.28 a,b
±0.06
599.04 b
±21.29
Hybred641.36 f
±31.89
41.60 c,b
±3.10
9.81 b–d
±1.72
2.44 e
±0.53
11.37 e
±1.43
12.52 g
±1.18
6.78 d
±0.47
2.01 d
±0.52
0.27 a,b
±0.06
728.15 g
±37.72
Hymack617.33 d
±15.69
44.83 c
±5.14
10.28 c,f
±2.28
3.23 f
±0.61
9.80 b,c
±1.85
9.98 f
±3.29
5.51 c
±2.30
1.23 b,c
±0.48
0.29 a,b
±0.06
702.46 e,f
±30.73
INTBatuta522.23 b
±12.24
38.15 a,b
±2.44
9.72 a-d
±1.40
1.23 a
±0.34
9.69 b,c
±1.06
8.00 c
±0.73
5.72 c
±2.29
1.29 b,c
±0.42
0.27 a,b
±0.03
596.31 a,b
±15.07
Hybred630.17 e
±43.12
38.32 a,b
±1.98
8.75 a,b
±0.96
1.66 b
±0.81
10.59 d
±1.07
9.74 e,f
±1.84
6.41 d
±0.46
1.99 d
±0.25
0.24 a
±0.04
707.87 f
±44.11
Hymack612.17 d
±22.96
39.40 a,b
±4.66
11.01 d
±2.31
2.18 d
±0.40
9.72 b,c
±0.77
9.17 d
±2.45
4.65 b
±1.13
1.14 b
±0.21
0.23 a
±0.04
689.67 d,e
±27.99
CONBatuta512.02 a
±4.47
36.51 a
±4.07
9.75 a-d
±1.55
1.06 a
±0.24
10.01 c
±1.38
6.57 a
±0.64
5.37 c
±2.03
1.24 b,c
±0.40
0.30 b
±0.05
582.82 a
±9.79
Hybred610.7 d
±28.00
38.06 a,b
±3.60
9.18 a–c
±0.83
1.61 b
±0.35
9.29 b
±1.04
9.51 d,e
±2.09
4.58 a,b
±1.29
1.86 d
±0.34
0.27 a,b
±0.05
685.06 d
±27.57
Hymack587.98 c
±11.51
37.61 a,b
±3.22
±8.34 a
2.46
1.90 c
±0.27
7.82 a
±0.64
7.32 b
±0.65
4.07 a
±0.80
0.80 a
±0.14
0.28 a,b
±0.05
656.13 c
±17.50
CS × C***ns****************ns***
Values are expressed as mean ± SD. Means in a column followed by different letters show significant differences (p < 0.05) according to the Tukey test. Significance at: *** p < 0.001; ** p < 0.01; ns—not significant. FER—ferulic acid, SIN—sinapic acid, p-COU—p-coumaric acid, CAF—caffeic acid, VAN—vanillic acid, SYR—syringic acid, p-HB—p-hydroxybenzoic acid, PCA, protocatechuic acid, SA—salicylic acid, TPAs—total content of phenolic acids.
Table 5. Phenolic acid (PA) composition of wheat grain [μg g−1], mean values for interaction location × cultivars.
Location (L)Cultivars (C)FERSINp-COUCAFVANSYRp-HBPCASATPAs
DuklaBatuta513.58 a
±6.68
37.95 a
±3.90
10.14 b
±1.57
1.12 a
±0.32
9.89 b
±1.30
6.88 a
±0.79
7.64 d
±0.79
1.67 c
±0.27
0.30 b
±0.05
589.17 a
±11.79
Hybred656.56 e
±24.63
39.70 a,b
±3.37
9.32 b
±1.45
1.64 c
±0.86
10.87 c
±1.87
9.68 c
±2.78
5.70 b
±1.68
1.83 d
±0.39
0.28 a,b
±0.05
735.59 d
±32.99
Hymack617.24 d
±22.48
41.33 b
±6.30
11.86 c
±1.68
2.77 e
±0.76
9.95 b
±1.48
10.75 d
±2.41
5.94 b,c
±1.27
1.26 b
±0.36
0.27 a,b
±0.05
701.37 c
±32.42
Nowy
Lubliniec
Batuta524.69 b
±15.49
38.31 b,a
±3.26
9.48 b
±1.20
1.43 b
±0.34
9.94 b
±1.10
7.65 b
±1.17
3.58 a
±0.45
0.93 a
±0.15
0.27 a,b
±0.04
596.28 a
±21.04
Hybred598.27 c
±17.39
38.95 a,b
±3.31
9.17 b
±1.12
2.17 d
±0.33
9.96 b
±0.61
11.49 e
±0.62
6.15 c
±0.61
2.07 e
±0.35
0.24 a
±0.04
678.46 b
±22.63
Hymack594.41 c
±12.31
39.90 a,b
±4.12
7.90 a
±1.51
2.10 d
±0.52
8.27 a
±0.98
6.90 a
±0.36
3.55 a
±0.88
0.85 a
±0.20
0.26 a,b
±0.06
664.14 a
1±8.45
L × C***ns******************ns***
Values are expressed as mean ± SD. Means in a column followed by different letters show significant differences (p < 0.05) according to the Tukey test. Significance at: *** p < 0.001; ns—not significant. FER—ferulic acid, SIN—sinapic acid, p-COU—p-coumaric acid, CAF—caffeic acid, VAN—vanillic acid, SYR—syringic acid, p-HB—p-hydroxybenzoic acid, PCA, protocatechuic acid, SA—salicylic acid, TPAs—total content of phenolic acids
Table 6. Phenolic acid (PA) composition of wheat grain [μg g−1], mean values for interaction cultivars × years.
Cultivars (C)Years
(Y)
FERSINp-COUCAFVANSYRp-HBPCASATPAs
Batuta2015/2016512.36 a
±8.61
37.41 a,b
±2.72
9.47 a–c
±1.27
1.14 a
±0.24
9.43 b,c
±1.08
6.79 a
±0.78
5.05 b,c
±2.10
1.16 b
±0.35
0.27 a
±0.04
583.07 a
±9.96
2016/2017526.31 c
±14.85
39.95 a–c
±2.97
10.75 c
±1.38
1.51 b
±0.32
10.65 c,d
±1.09
7.80 b
±0.98
6.28 f
±2.43
1.49 c
±0.53
0.30 a
±0.05
605.04 b
±17.53
2017/2018518.73 a,b
±11.81
37.05 a
±4.28
9.22 a,b
±1.19
1.18 a
±0.40
9.66 a
±1.10
7.21 a
±1.20
5.50 c–e
±1.90
1.24 b
±0.36
0.28 a
±0.05
590.07 a
±16.10
Hybred2015/2016615.73 d
±35.48
38.03 a,b
±2.72
8.43 a,b
±0.96
1.83 c
±0.66
10.03 d
±1.41
10.01 e
±1.88
5.66 b,c
±1.25
1.70 d
±0.22
0.25 a
±0.05
691.67 d,e
±37.96
2016/2017645.58 e
±40.27
41.50 b,c
±2.62
10.02 b,c
±1.06
2.17 d
±0.79
11.28 f
±1.42
11.26 g
±2.01
6.21 f
±1.03
2.32 e
±0.20
0.26 a
±0.06
730.59 f
±42.42
2017/2018620.93 d
±27.38
38.45 a–c
±3.59
9.29
±1.33 a,b
1.71 b,c
±0.59
9.94 c,d
±1.21
10.50 f
±2.60
5.90 c–e
±1.52
1.83 d
±0.38
0.27 a
±0.05
698.82 e
±31.08
Hymack2015/2016598.09 c
±19.75
39.05 a–c
±4.34
9.25 a,b
±2.62
2.26 c
±0.69
8.50 d
±1.42
8.47 e
±2.51
4.20 d,e
±1.81
0.94 a
±0.33
0.25 a
±0.05
671.01 c
±30.25
2016/2017616.21 d
±23.54
42.57 c
±5.43
10.63 b,c
±2.72
2.64 d
±0.74
9.70 f
±1.70
9.37 g
±2.97
5.30 f
±1.65
1.17 b
±0.42
0.28 a
±0.05
697.88 f
±35.13
2017/2018603.16 d
±17.51
40.22 a–c
±5.83
9.75 a–c
±2.32
2.41 b,c
±0.76
9.14 c,d
±1.21
8.64 f
±2.38
4.73 e,f
±1.30
1.06 a,b
±0.29
0.27 a
±0.06
679.38 c,d
±26.87
C × Y**nsnsns********ns*
Values are expressed as mean ±SD. Means in a column followed by different letters show significant differences (p < 0.05) according to the Tukey test. Significance at: *** p < 0.001; ** p < 0.01; * p < 0.05; ns—not significant. FER—ferulic acid, SIN—sinapic acid, p-COU—p-coumaric acid, CAF—caffeic acid, VAN—vanillic acid, SYR—syringic acid, p-HB—p-hydroxybenzoic acid, PCA, protocatechuic acid, SA—salicylic acid, TPAs—total content of phenolic acids
Table 7. Individual values of the correlation matrix.
Value NumberEigenvalues (Correlations), Related Statistics
Eigenvalue% of Total VarianceCumulative EigenvalueCumulative %
13.72389053.198433.72389053.1984
21.71963524.566225.44352577.7646
30.73033510.433366.17386088.1980
40.4952597.075136.66911995.2731
50.2576483.680686.92676798.9538
60.0726791.038276.99944699.9921
70.0005540.007917.000000100.0000
Table 8. Value of principal components coefficients.
VariableFactor Coordinates of Variables Based on Correlation
Factor 1Factor 2
FER−0.7778710.484286
CAF−0.6301520.491209
VAN−0.677796−0.430096
SYR−0.8992730.033775
p−HB−0.531913−0.731996
PCA−0.676173−0.584022
TPAs−0.8446750.425197
Disclaimer/Publisher’s Note: The statements, opinions and data contained in all publications are solely those of the individual author(s) and contributor(s) and not of MDPI and/or the editor(s). MDPI and/or the editor(s) disclaim responsibility for any injury to people or property resulting from any ideas, methods, instructions or products referred to in the content.

