Article

Enhancing Fruit Fly Detection in Complex Backgrounds Using Transformer Architecture with Step Attention Mechanism

1
China Agricultural University, Beijing 100083, China
2
Tsinghua University, Beijing 100083, China
*
Authors to whom correspondence should be addressed.
These authors contributed equally to this work.
Agriculture 2024, 14(3), 490; https://doi.org/10.3390/agriculture14030490
Submission received: 15 February 2024 / Revised: 4 March 2024 / Accepted: 13 March 2024 / Published: 18 March 2024
(This article belongs to the Section Digital Agriculture)

Abstract

:
This study introduces a novel high-accuracy fruit fly detection model based on the Transformer structure, specifically aimed at addressing the unique challenges in fruit fly detection such as identification of small targets and accurate localization against complex backgrounds. By integrating a step attention mechanism and a cross-loss function, this model significantly enhances the recognition and localization of fruit flies within complex backgrounds, particularly improving the model’s effectiveness in handling small-sized targets and its adaptability under varying environmental conditions. Experimental results demonstrate that the model achieves a precision of 0.96, a recall rate of 0.95, an accuracy of 0.95, and an F1-score of 0.95 on the fruit fly detection task, significantly outperforming leading object detection models such as YOLOv8 and DETR. Specifically, this research delves into and optimizes for challenges faced in fruit fly detection, such as recognition issues under significant light variation, small target size, and complex backgrounds. Through ablation experiments comparing different data augmentation techniques and model configurations, the critical contributions of the step attention mechanism and cross-loss function to enhancing model performance under these complex conditions are further validated. These achievements not only highlight the innovativeness and effectiveness of the proposed method, but also provide robust technical support for solving practical fruit fly detection problems in real-world applications, paving new paths for future research in object detection technology.

1. Introduction

With global agricultural production facing increasing challenges [1,2], effective pest control and management have become key factors in enhancing crop yields [3] and ensuring food safety [4]. Fruit flies, as widely distributed agricultural pests [5], cause significant damage to fruits and vegetables during their adult developmental stage [6]. Therefore, the development of an efficient and accurate method for identifying fruit flies, particularly focusing on the adult stage that lays eggs leading to the most damaging larval stage within the fruits, is crucial for early pest warning and implementing precise control measures [7].
In traditional studies of Drosophila identification, reliance has predominantly been placed on classical image processing techniques and machine learning algorithms, such as Support Vector Machines (SVMs) and Random Forests. These conventional methods principally leverage manually designed feature extraction, encompassing shape, texture, and color features, to achieve classification and identification of Drosophila. Although these approaches have attained certain success in early research, they often exhibit significant limitations when dealing with complex or variable image data. The process of manually designed feature extraction requires extensive domain knowledge and expert experience; in addition, the generalizability of this approach tends to perform poorly when faced with the diversity of Drosophila species and changes in external conditions (e.g., lighting, background), thus restricting its reliability in practical applications. Furthermore, with the advancement of image acquisition technologies, the resolution and dimensionality of images have continuously increased, rendering traditional algorithms inefficient in processing these high-dimensional data and thereby struggling to meet the demands for rapid and accurate identification. For instance, Lello and Florence, et al. [8] discovered the use of photonic electronic fruit fly traps for fruit fly trapping and detection, yet phototransistors and diodes in light sensors need to be distanced from artificial light due to susceptibility to interference.
In recent years, with the rapid development of deep learning technology, image-based pest identification methods have made significant progress. Particularly, the successful application of Convolutional Neural Networks (CNNs) [9] in the field of object detection has opened new technical paths for pest image recognition [10]. However, despite the proven effectiveness of CNN-based models such as You Only Look Once (YOLO) [11] and Faster-RCNN [12] in various domains, they still face challenges in accurately identifying small targets and highly similar species due to insufficient precision and robustness [13]. For example, Freitas, Lucas, et al. [14] trained several CNN architectures with different configurations to find the model with the highest accuracy and shortest time. The results showed that ResNet18 had the best classification effect, achieving an overall accuracy of 90.72%, but with longer inference time; Victoriano Margarida et al. [15] fine-tuned the YOLOv7 model to identify and classify olive fruit flies, demonstrating precise identification but lacking model robustness.
The Transformer structure [16], a revolutionary deep learning architecture, initially achieved great success in the field of Natural Language Processing (NLP) [17]. Its design principle, leveraging the Self-Attention Mechanism to capture long-distance dependencies within data, effectively enhances the model’s representation ability. Recently, researchers have begun to explore the application of Transformer structures in image recognition and object detection tasks [18], demonstrating remarkable potential. The application of the Transformer architecture in the field of fruit fly recognition has facilitated the capability of automatic feature learning, significantly reducing the dependence on manual feature design and thereby enhancing the model’s generalization ability. Moreover, the deep network structure and extensive parameters of the Transformer endow it with formidable data representation and learning capabilities, effectively improving recognition accuracy [19]. More importantly, owing to the flexibility of the self-attention mechanism, the Transformer model is capable of adapting to various complex image scenarios, demonstrating commendable robustness against environmental changes and diversity in species [20]. Therefore, the adoption of models based on the Transformer structure not only overcomes the limitations of traditional methods, but also paves a more effective and cutting-edge technological path for high-precision fruit fly recognition.
Qi et al. [21] designed a novel multi-head cross-attention module using the Detection Transformer (DETR) method for pest detection, achieving an accuracy of 72.5%. In pursuit of higher accuracy, Li et al. [22] proposed an automatic pest identification method based on the Vision Transformer (ViT), which achieved 96.71% accuracy in automatic classification of plant pests through experiments. Dai et al. [23] incorporated the SWin Transformer (SWinTR) and Transformer (C3TR) mechanisms into the YOLOv5m network, reaching 95.7% accuracy. The proposed method proved more effective, not only in terms of high precision but also in model robustness.
This paper introduces a high-precision fruit fly recognition model based on the Transformer structure, aiming to overcome the limitations of traditional CNN models in fruit fly identification tasks by leveraging the powerful representation capability of the Transformer to enhance recognition accuracy and robustness. The main contributions and innovations of this work include:
  • High-precision Transformer model design: A new Transformer model architecture was designed specifically for the characteristics of fruit flies, adjusting the model’s layers, heads, and dimensions to better suit the properties of fruit fly images.
  • Step attention mechanism: To further enhance the model’s ability to capture subtle features of fruit flies, a step attention mechanism was proposed, allowing for the model to progressively focus on key features during image sequence processing, thereby improving recognition precision and efficiency.
  • Cross-Loss Function: To address the issue of class imbalance in fruit fly identification, a new cross-loss function was designed, effectively enhancing the model’s ability to recognize minority classes, thus improving overall model performance.
  • Adaptive Stable Optimizer: To solve potential gradient vanishing or exploding problems during model training, an adaptive stable optimizer was proposed, dynamically adjusting the learning rate and regularization terms to ensure training stability and efficiency.
Through these innovations, the model presented in this paper achieved results surpassing existing technologies in fruit fly identification tasks. Experiments demonstrated not only the model’s high-precision identification capabilities on local datasets, but also its good generalization ability and robustness in cross-dataset validation. Furthermore, this research provides valuable references and insights for future applications of Transformer structures in similar fields. In summary, this paper not only introduces an efficient and accurate fruit fly identification model, but also advances the application of deep learning technology in pest management within the agricultural sector, contributing to the goals of precision agriculture and sustainable development. Future efforts will explore the potential applications of deep learning technology in pest identification and management, contributing to precision agriculture and sustainable development goals.

2. Related Work

2.1. Convolutional Neural Network-Based Object Detection Models

2.1.1. One-Stage Networks

One-stage object detection networks, particularly the YOLO series [24], occupy an important position in the field of object detection due to their unique design and efficient detection speed [25]. The core idea of YOLO is to simplify the object detection problem into a single regression problem, directly mapping from image pixels to bounding box coordinates and class probabilities. This innovative approach has significantly improved detection speed, allowing for widespread application in real-time scenarios [26]. The network structure of YOLO can be divided into three main parts: the input layer, the backbone network, and the neck network.
  • The input layer divides the input image into a grid of cells (typically 13 × 13 , 26 × 26 , or higher-resolution grids), each cell responsible for predicting objects whose center points fall within that cell.
  • The backbone network serves to extract features from the image. In different versions of YOLO, the backbone network varies. For example, YOLOv1 [27] employed a custom network structure, while starting from YOLOv3 [28], the backbone network adopted Darknet-53 [29], a deep convolutional network with 53 convolutional layers, enhancing feature transfer through residual connections, enabling effective learning even in deep networks.
  • The neck network, situated between the backbone network and the prediction layer, further processes the feature maps to make them more suitable for object detection tasks. YOLOv3 and its subsequent versions introduced the Feature Pyramid Network (FPN) [30] as the neck network, aiming to improve the model’s detection capability for small objects by merging feature maps of different scales.
YOLO’s loss function is one of its core designs, used to train the network to accurately predict object positions and categories. It consists of three parts: the bounding box location loss, confidence loss, and classification loss. The bounding box location loss calculates the difference between the predicted and the actual bounding boxes [31]. YOLO employs the squared difference loss to measure this discrepancy, including the loss for the coordinates of the bounding box center and the dimensions of the bounding box. For width w and height h of the bounding box, YOLO calculates the loss using their square roots to reduce the discrepancy between the prediction errors of large and small boxes.
L coord = i = 0 S 2 j = 0 B i j obj ( x i x ^ i ) 2 + ( y i y ^ i ) 2 + ( w i w ^ i ) 2 + ( h i h ^ i ) 2
Here, i j obj denotes the indicator function for the jth bounding box containing an object in the ith cell, ( x i , y i , w i , h i ) are the parameters of the predicted bounding box, and ( x ^ i , y ^ i , w ^ i , h ^ i ) are the corresponding actual bounding box parameters. The confidence loss measures whether the predicted bounding box contains an object and the confidence of the object presence [32]. The confidence reflects the IOU (Intersection over Union) between the predicted bounding box and any actual bounding box.
L conf = i = 0 S 2 j = 0 B i j obj ( σ i σ ^ i ) 2 + λ noobj ( 1 i j obj ) ( σ i σ ^ i ) 2
Here, σ i is the predicted confidence, σ ^ i is the actual confidence (one if there is an object in the cell, otherwise zero), and λ noobj is the weight for the absence of an object.
The classification loss calculates the difference between the predicted class probabilities and the actual classes [33], typically using the cross-entropy loss function.
L class = i = 0 S 2 i obj c classes ( p i ( c ) p ^ i ( c ) ) 2
Here, p i ( c ) is the conditional probability that class c is detected in the ith cell, and p ^ i ( c ) is the corresponding actual probability. In summary, YOLO’s total loss function is a weighted sum of these three parts:
L YOLO = λ coord L coord + L conf + λ class L class
where λ coord and λ class are weight parameters used to balance the contributions of different parts of the loss. Through the design of this loss function, YOLO achieves simultaneous optimization of object position, presence, and category, thereby maintaining high-speed detection while maximizing detection accuracy. However, due to limitations in YOLO’s performance on small objects and dense scenes [34], subsequent versions of YOLO have made multiple improvements in network structure, loss function, and training strategy to enhance the model’s overall performance and applicability.

2.1.2. Two-Stage Networks

Two-stage object detection networks, especially Faster R-CNN [35], represent a significant advancement in object detection technology, achieving high-precision detection through sophisticated network structure design and meticulous loss function calculation. Faster R-CNN performs the detection task in two main stages: the first stage generates candidate object regions using the Region Proposal Network (RPN), and the second stage classifies these candidate regions and performs precise bounding box regression. This design significantly improves detection accuracy, particularly in applications requiring fine bounding box localization. The network structure of Faster R-CNN includes several key components: the backbone network, the RPN, the RoI Pooling layer, and the classification and regression head.
  • The backbone network is responsible for extracting features from the input image. In Faster R-CNN, various convolutional networks can be used as the backbone network, such as VGG-16 [36], ResNet-50 [37], or ResNet-101. These networks extract high-level semantic features from the image through multiple convolutional operations, providing necessary information for subsequent object detection tasks.
  • The RPN is the core of Faster R-CNN, generating candidate object regions from the feature maps extracted by the backbone network. The RPN slides a small network over the feature map, predicting multiple scales and aspect ratios of anchor boxes at each position, indicating whether they contain objects and the adjustments to the anchor boxes’ positions. This step generates a set of high-quality candidate regions for further classification and regression.
  • The RoI (Region of Interest) Pooling layer converts candidate regions of varying sizes into fixed-size feature maps for uniform classification and bounding box regression. This step ensures a fixed-dimensional feature representation regardless of the original sizes of the candidate regions.
  • Finally, for each fixed-size feature map output by the RoI Pooling layer, the network performs two tasks: determining the category of the region (including the background class) and making precise adjustments to the bounding box to more accurately cover the object.
The loss function of Faster R-CNN consists of two parts: the loss for the RPN and the loss for classification and bounding box regression. The RPN loss comprises two components: the classification loss for anchor boxes (i.e., the probability of anchor boxes containing objects) and the regression loss for anchor boxes’ position adjustments. The classification loss uses the cross-entropy loss function, while the regression loss uses the smooth L 1 loss.
L RPN = L cls + λ L reg
Here, L cls is the classification loss, L reg is the regression loss, and λ is a weight parameter to balance these two. For each RoI, the classification loss also uses the cross-entropy loss function for calculation, while the bounding box regression loss uses the smooth L 1 loss, similar to the regression loss in the RPN.
L Fast R - CNN = L cls + λ L reg
Here, L cls and L reg represent the classification and regression losses, respectively, with λ as the balancing factor. The total loss of Faster R-CNN is the sum of the RPN loss and the Fast R-CNN loss, ensuring that the network can generate high-quality region proposals and accurately classify and regress these regions. Through this carefully designed network structure and loss function, Faster R-CNN achieves high precision in object detection [38], especially in scenarios requiring precise bounding box localization [39]. However, the computational complexity of Faster R-CNN is relatively high, which to some extent limits its use in real-time application scenarios [40]. Future research may further optimize the network structure and training strategy to improve speed while maintaining or even enhancing detection accuracy.

2.2. Transformer-Based Object Detection Models

Since the Transformer model [41] achieved remarkable success in the field of natural language processing [42], its unique architecture and mechanisms were rapidly adopted in the field of computer vision, especially for object detection tasks. Compared to traditional Convolutional Neural Network (CNN) approaches, the Transformer, with its self-attention mechanism capable of capturing long-distance dependencies, offers a new perspective for understanding complex scenes in images and precisely detecting small objects. However, in the specific domain of agricultural pest detection, existing Transformer-based models face unique challenges, including but not limited to the small size of pests, their concealment against complex backgrounds, and the diversity of pest forms. Although existing Transformer models perform excellently in image processing, their effectiveness in addressing these specific challenges remains to be improved. For instance, the Vision Transformer (ViT) [43], which directly processes images by dividing them into multiple small patches, might overlook crucial detail information when dealing with small-sized targets, such as fruit flies. Meanwhile, DETR [44], despite simplifying the object detection process through an end-to-end approach that directly predicts the categories and bounding boxes of objects, exhibits low efficiency and is prone to false detections when dealing with scenes containing a large number of small objects.
To meet the specific needs of agricultural pest detection, this study proposes a model that optimizes the traditional Transformer structure. Firstly, a step attention mechanism is introduced, enabling the model to gradually focus on finer details of the targets after initially identifying their approximate regions, effectively improving the detection accuracy of small-sized pests. Secondly, a cross-loss function is designed to address the requirements of class imbalance and localization accuracy in object detection, balancing the needs for classification accuracy and localization precision. Furthermore, an adaptive stable optimizer is employed to enhance the stability and efficiency of the training process, particularly accelerating the model’s convergence speed and improving detection accuracy when dealing with complex backgrounds and diverse pest forms. These targeted optimizations not only theoretically address the shortcomings of existing Transformer models in the domain of agricultural pest detection, but also empirically demonstrate their significant effects in improving the detection accuracy of small-sized pests, handling pests’ concealment against complex backgrounds, and adapting to the diversity of pest forms. These innovative approaches and experimental results provide new insights and technical support for the field of agricultural pest detection, showcasing the considerable potential and practical value of Transformer-based models for specific tasks.

3. Materials and Method

3.1. Dataset Collection

In this research, a high-precision fruit fly recognition model based on the Transformer structure was developed with the aim of enhancing the efficiency and accuracy of agricultural pest management. The foundation of achieving this goal was the construction of a dataset containing a large number of fruit fly images, which were precisely annotated. This section provides a detailed description of the dataset’s sources, acquisition methods, reasons for selection, and the annotation process, including the mathematical principles involved. The dataset used in this paper primarily originates from two sources: the Plant Protection Laboratory at China Agricultural University and internet scraping. The image data provided by the Plant Protection Laboratory at China Agricultural University comes from research projects within the laboratory, accumulating images of fruit flies at various stages of growth, against different backgrounds, and under varying lighting conditions throughout multiple research processes. The advantage of this part of the data lies in its professionalism and high quality, with high image clarity and obvious fruit fly features, making it highly suitable for training and testing deep learning models. In addition to images from professional laboratories, a large number of fruit fly images were also collected from publicly accessible databases and websites through internet scraping. These images come from a wide range of sources, including different geographical locations, seasons, and environmental conditions, thereby significantly increasing the dataset’s diversity and complexity, as shown in Table 1.
The data collected from the internet not only supplement the quantity and diversity of the laboratory data, but also enable the model to better adapt to and recognize fruit fly images encountered in practical applications. The primary reason for choosing the Plant Protection Laboratory at China Agricultural University and internet scraping as data sources is that these two sources together provide both professionalism and diversity. The data from the laboratory ensure the accuracy and reliability of the fruit fly images in the dataset, which is crucial for the model’s accurate recognition. The internet scraping data significantly expands the scale and diversity of the dataset, enabling the model to learn more varieties of fruit fly presentations, thus enhancing the model’s generalization ability and robustness in practical applications.

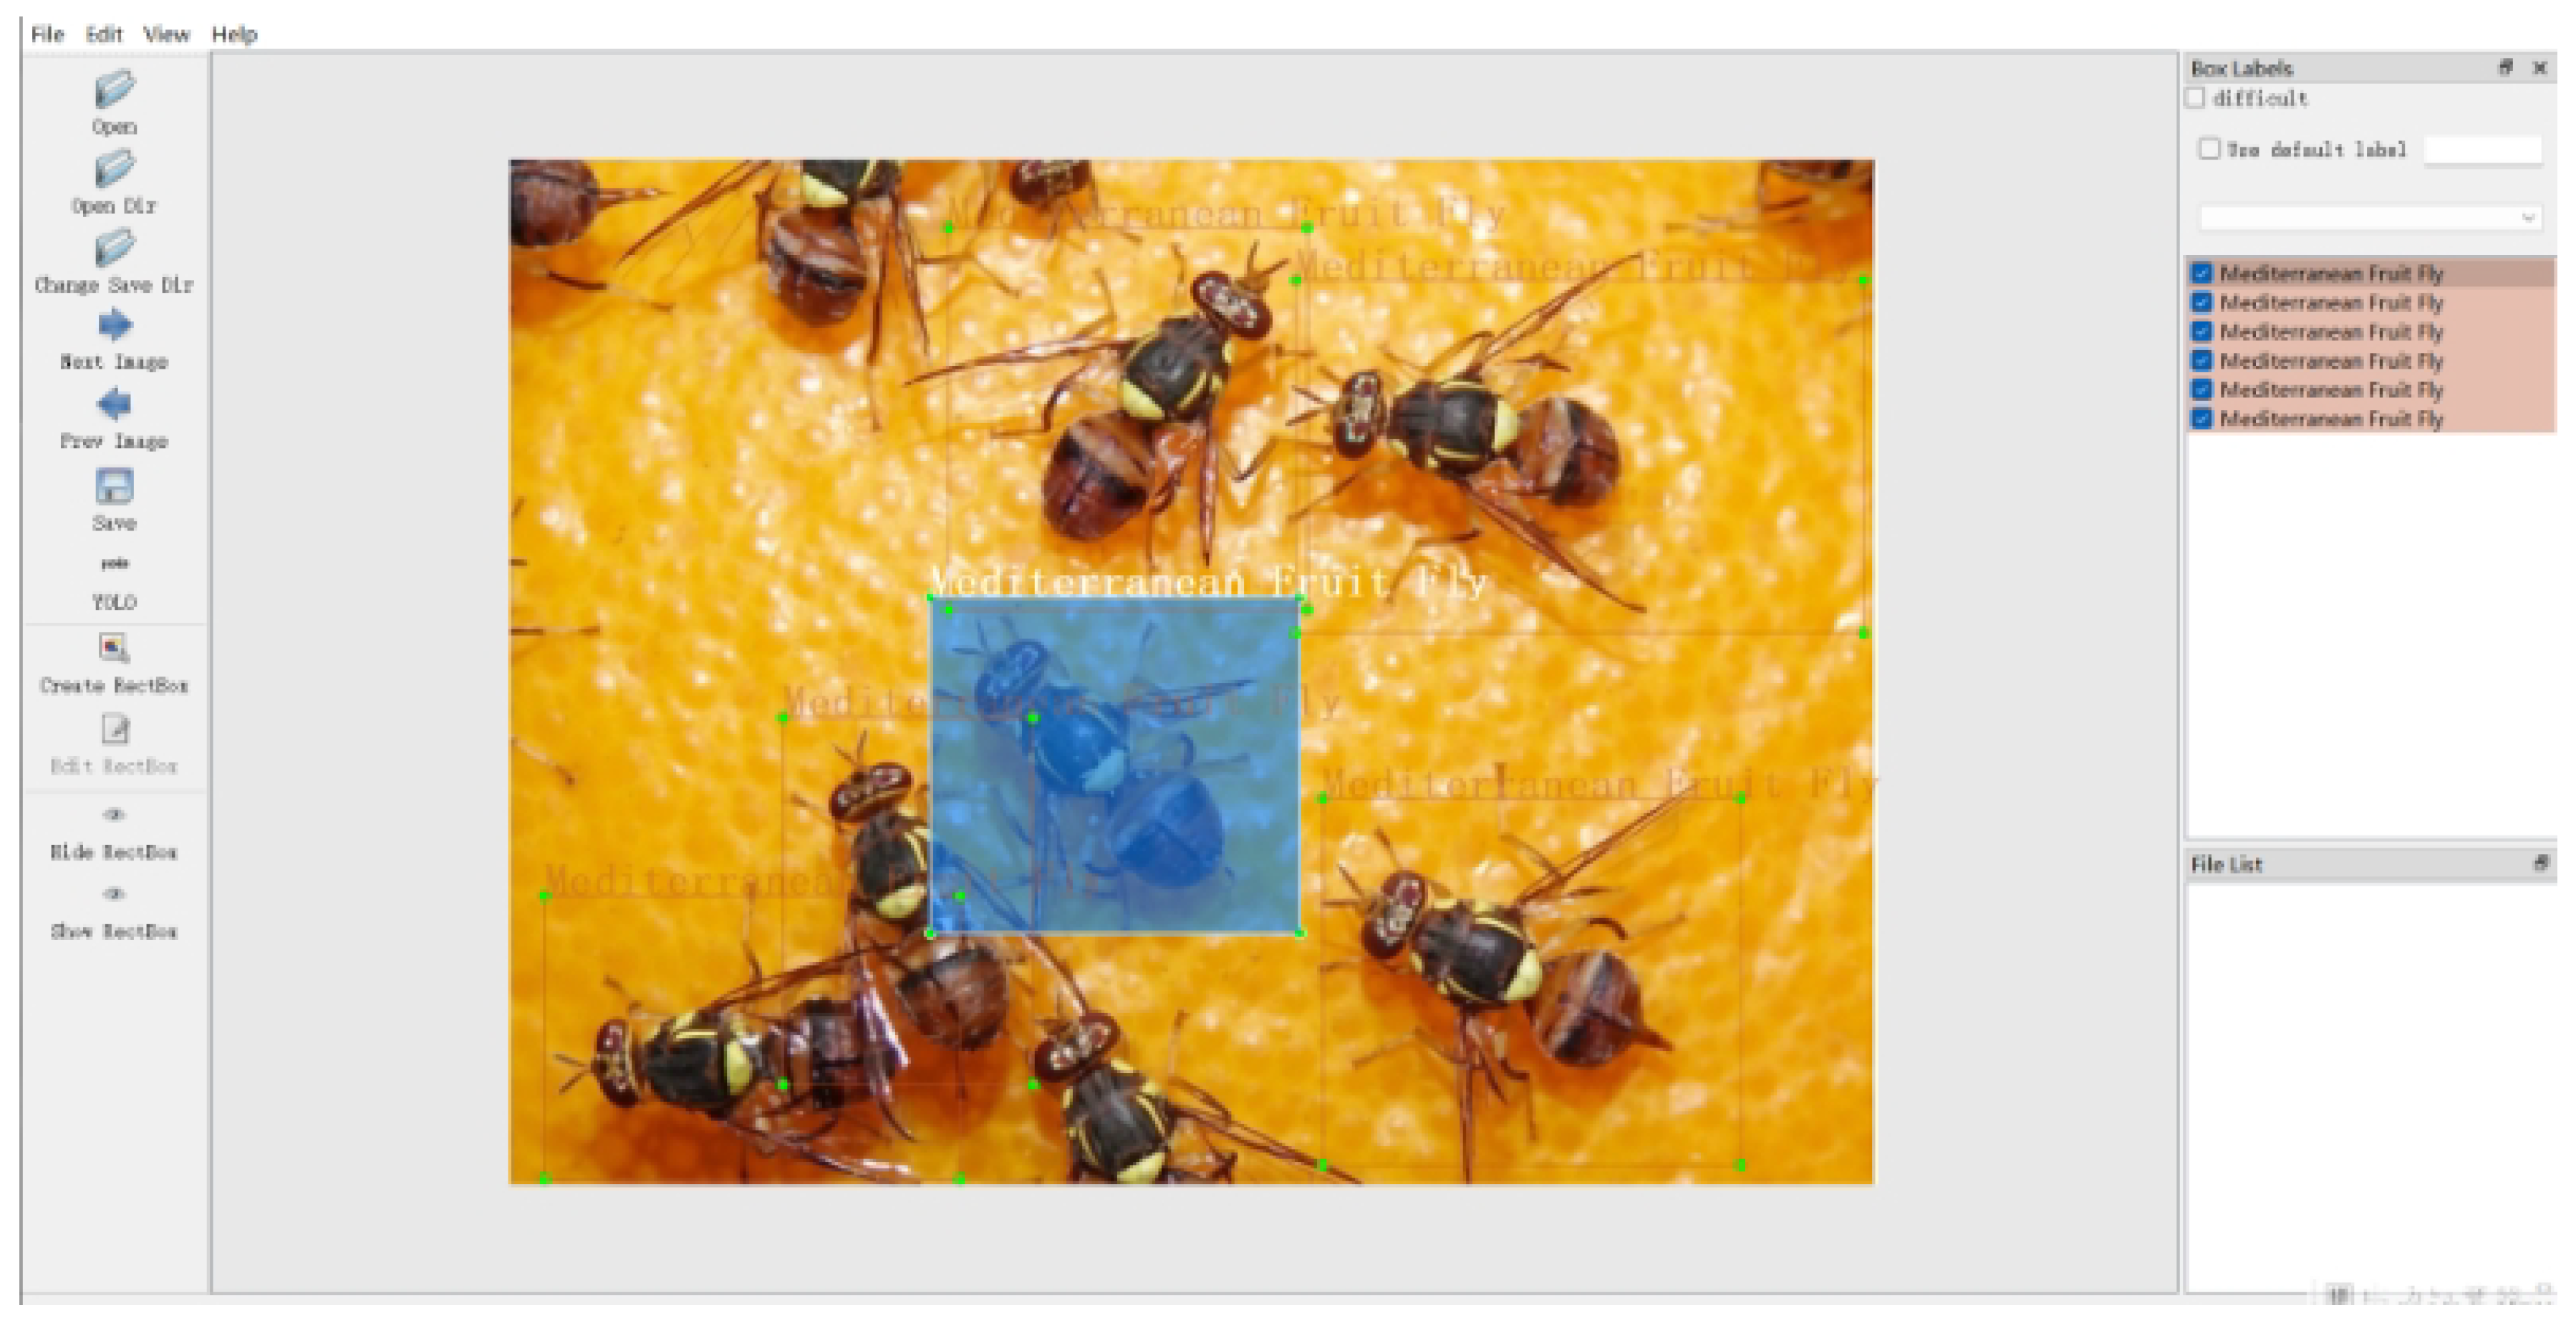
3.2. Dataset Annotation

Precise annotation of the dataset is a key step in training a high-precision recognition model. A team composed of professional researchers and data annotation experts was organized to manually annotate all collected fruit fly images. We divide the annotation team into groups for labeling. After the first round of annotation is completed, cross-validation is performed. Images with significant discrepancies during the validation process undergo expert review to ensure uniformity in annotation standards. During the annotation process, every fruit fly in each image was accurately outlined, and the corresponding category information was labeled. Specifically, the annotation work mainly included two steps: determining bounding boxes and labeling categories, as shown in Figure 1.

3.2.1. Bounding Box Annotation

For each target (fruit fly) in the images, annotators were required to determine the smallest rectangular box that completely contained the target while minimizing the inclusion of the background. Bounding boxes can be described by four parameters, namely ( x , y , w , h ) , where x , y represent the coordinates of the top-left corner of the rectangle, and w , h represent the width and height of the rectangle, respectively. In practice, these parameters needed to be manually selected and adjusted using annotation tools until the bounding box accurately covered the fruit fly in the image.

3.2.2. Category Annotation

Based on the determined bounding boxes, annotators also need to assign a category label to each bounding box, indicating the type of the contained target. Since this study focuses on the recognition of fruit flies, the category label for each bounding box is relatively straightforward, namely “fruit fly”. Additionally, there is sexual dimorphism among the adult individuals of these four species of fruit flies; we mix images of males and females together as a single species. Therefore, sexual dimorphism does not lead the model to misidentify the same species as two different species. The entire annotation process not only requires the professional knowledge and meticulous work of the annotators, but also involves a series of mathematical principles, especially in the determination and optimization of bounding box parameters. For example, to improve the consistency and accuracy of the annotations, the IoU could be used as a standard of evaluation, calculating the overlap between manually annotated bounding boxes and the actual target boundaries:
IoU = Area of Overlap Area of Union
where the closer the IoU value is to one, the more closely the annotated bounding box matches the actual target boundary, indicating higher quality of annotation. By training annotators to understand and apply this principle, the quality and consistency of data annotation can be effectively improved. Through the systematic collection, annotation, and theoretical support described above, a high-quality fruit fly image dataset that is both professional and widely diverse is constructed for this research. This dataset not only provides a solid foundation for training and testing the high-precision fruit fly recognition model based on the Transformer structure, but also lays the groundwork for further research work and practical application.

3.3. Dataset Preprocessing

In the study on the high-precision fruit fly recognition model based on the Transformer structure, data preprocessing is an indispensable step, directly affecting the efficiency of model training and the accuracy of final recognition. The primary goal of data preprocessing is to improve data quality through a series of technical means, enhancing the model’s understanding of data, thereby boosting model performance. In this research, data preprocessing includes image resizing, normalization, denoising, and contrast enhancement, as shown in Figure 2.

3.3.1. Image Resizing

During the training process of deep learning models, to ensure the consistency of input data, all images need to be resized to the same dimensions. Image resizing is achieved through interpolation algorithms, among which the most commonly used methods include nearest-neighbor interpolation, bilinear interpolation, and cubic interpolation. Taking bilinear interpolation as an example, its mathematical expression can be represented as:
I ( x , y ) = i = 0 1 j = 0 1 I ( x i , y j ) · ( 1 | x x i | ) · ( 1 | y y j | )
Here, I ( x , y ) is the pixel value of the original image at coordinates ( x , y ) , and I ( x , y ) is the pixel value of the resized image at coordinates ( x , y ) , with x i and y j being the coordinates of the four neighboring pixels in the original image closest to the new coordinates, ( x , y ) . This method obtains new image pixel values by calculating the weighted average of neighboring pixel values in the original image, thereby resizing the image.

3.3.2. Image Normalization

Normalization is a crucial step in data preprocessing, adjusting the scale of image data to make the model training process more stable and faster. Typically, normalization can be performed using the following formula:
I norm ( x , y ) = I ( x , y ) μ σ
Here, I norm ( x , y ) represents the normalized pixel value, I ( x , y ) is the pixel value of the original image at coordinates ( x , y ) , μ is the mean pixel value of the image, and σ is the standard deviation of image pixel values. Through this method, image pixel values are transformed to a space with a uniform scale, facilitating faster convergence of the model and improving the stability of model training.

3.3.3. Denoising and Contrast Enhancement

In practical applications, images often suffer from various noise interferences, affecting the model’s understanding and recognition of the image. Therefore, denoising is an indispensable part of data preprocessing. Common image denoising methods include median filtering and Gaussian filtering. For example, the mathematical expression for median filtering is
I denoise ( x , y ) = median { I ( x i , y i ) }
Here, I denoise ( x , y ) is the denoised pixel value, median is the median function, and I ( x i , y i ) is the set of pixel values in the vicinity of coordinates ( x , y ) in the original image. Median filtering achieves denoising by replacing the pixel value of a point with the median value of pixels in its neighborhood. Contrast enhancement makes features more pronounced by adjusting the image’s contrast, facilitating model learning. A simple method for contrast enhancement is linear transformation, expressed as
I contrast ( x , y ) = α · I ( x , y ) + β
Here, I contrast ( x , y ) represents the pixel value after contrast enhancement, α is the amplification coefficient, and β is the offset. By adjusting the values of α and β , the image’s contrast can be effectively enhanced, making it easier for the model to recognize features in the image.
In summary, data preprocessing is an essential step in constructing a high-precision recognition model. Through image resizing, normalization, denoising, and contrast enhancement, data quality is significantly improved, providing a solid foundation for model training. These preprocessing steps not only help to enhance the training efficiency and accuracy of the model, but also improve the model’s generalization ability and robustness in practical applications.

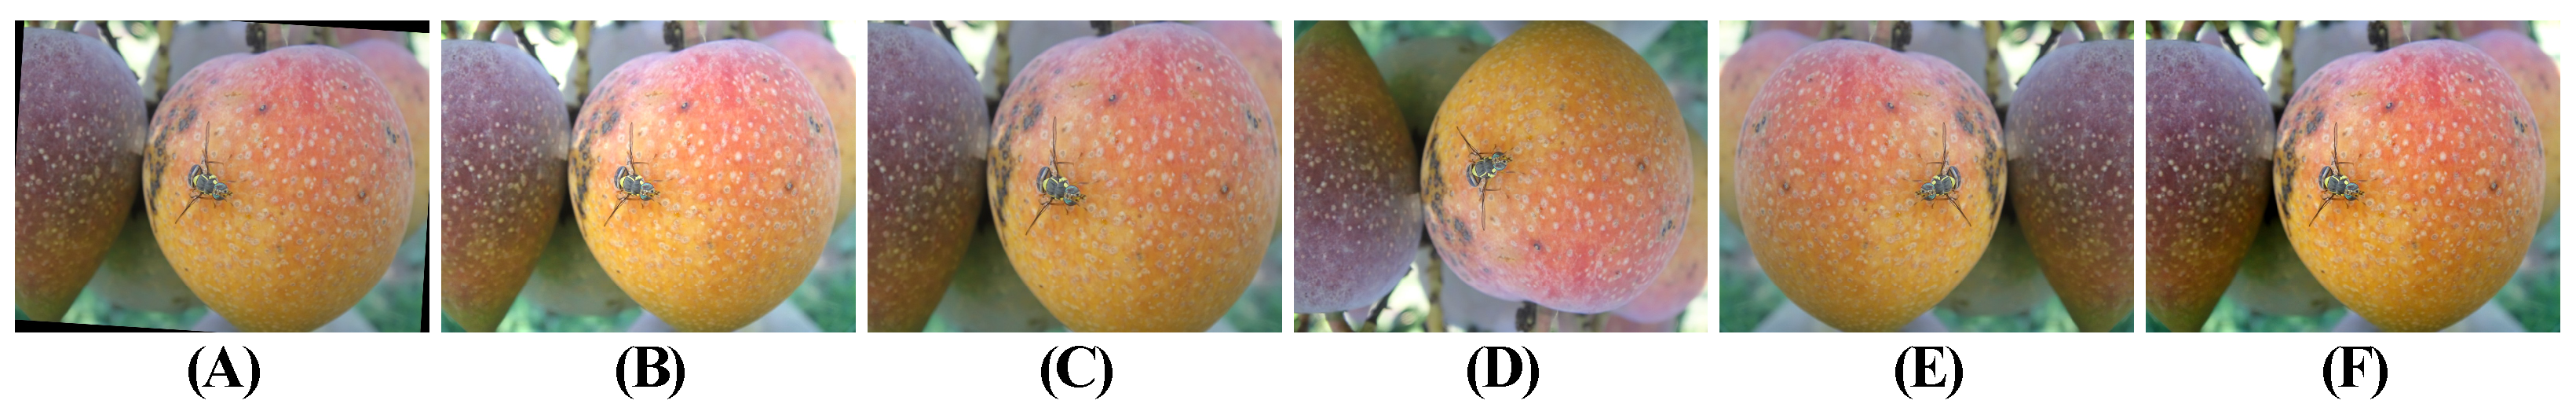
3.4. Image Augmentation

Data augmentation is a commonly used technique in the field of deep learning, especially in image processing and computer vision tasks, which increases the diversity of data by applying a series of transformations to the original image data, thus enhancing the model’s generalization ability and robustness. Considering the characteristics of fruit fly image data, various data augmentation methods were employed in the research on the high-precision fruit fly recognition model based on the Transformer structure, including random rotation, scaling, color jitter, and random cropping. The concepts, features, and mathematical principles of these data augmentation methods are detailed below.
Random rotation is a common data augmentation method that increases data diversity by randomly changing the angle of images. This method is particularly suitable for tasks where the orientation of the target is not fixed or varies, such as fruit fly recognition. Random rotation can be represented as
I rot ( x , y ) = I ( x , y )
Here, I ( x , y ) is the pixel value of the original image at coordinates ( x , y ) , and I rot ( x , y ) is the pixel value of the rotated image at new coordinates ( x , y ) . The relationship between the new coordinates ( x , y ) and the original coordinates ( x , y ) can be expressed through a rotation matrix:
x y = cos θ sin θ sin θ cos θ x y
where θ is the angle of rotation. By performing random rotations on images, the appearance of fruit flies from different directions can be effectively simulated, enhancing the model’s robustness to rotational transformations. Scaling increases the diversity of the dataset by changing the size of images, simulating fruit fly images at different distances. The scaling operation can be represented as
I scale ( x , y ) = I ( α x , α y )
where α is the scaling factor, and I scale ( x , y ) is the pixel value of the scaled image at new coordinates ( x , y ) . A scaling factor α greater than one indicates image enlargement, while that less than one indicates image reduction. By randomly selecting scaling factors, the model’s adaptability to changes in fruit fly size can be increased. Color jitter enhances data diversity by randomly changing color attributes of images (such as brightness, contrast, and saturation). The mathematical representation of color jitter can be performed as follows:
I color ( x , y ) = α · I ( x , y ) + β
where α and β represent the coefficients for adjusting color attributes and the offset, respectively, controlling the degree of color changes. By randomly selecting α and β , fruit fly images under different lighting and environmental conditions can be simulated, improving the model’s generalization ability. Random cropping simulates the situation where only part of the fruit fly appears in the field of view by randomly selecting a portion of the image for cropping. Random cropping can be expressed as
I crop ( x , y ) = I ( x + Δ x , y + Δ y )
where ( Δ x , Δ y ) is the offset of the randomly selected cropping starting point, and I crop ( x , y ) is the pixel value of the cropped image at new coordinates ( x , y ) . By randomly selecting the size and position of the cropping area, the model’s ability to recognize partially occluded fruit flies can be enhanced. In summary, by implementing data augmentation methods such as random rotation, scaling, color jitter, and random cropping, this study significantly increased the diversity and complexity of the dataset, providing a solid foundation for training the high-precision fruit fly recognition model based on the Transformer structure. These data augmentation techniques not only simulate various situations that fruit flies may encounter in natural environments, but also effectively enhance the model’s robustness and adaptability in facing real-world application scenarios.

3.5. Proposed Method
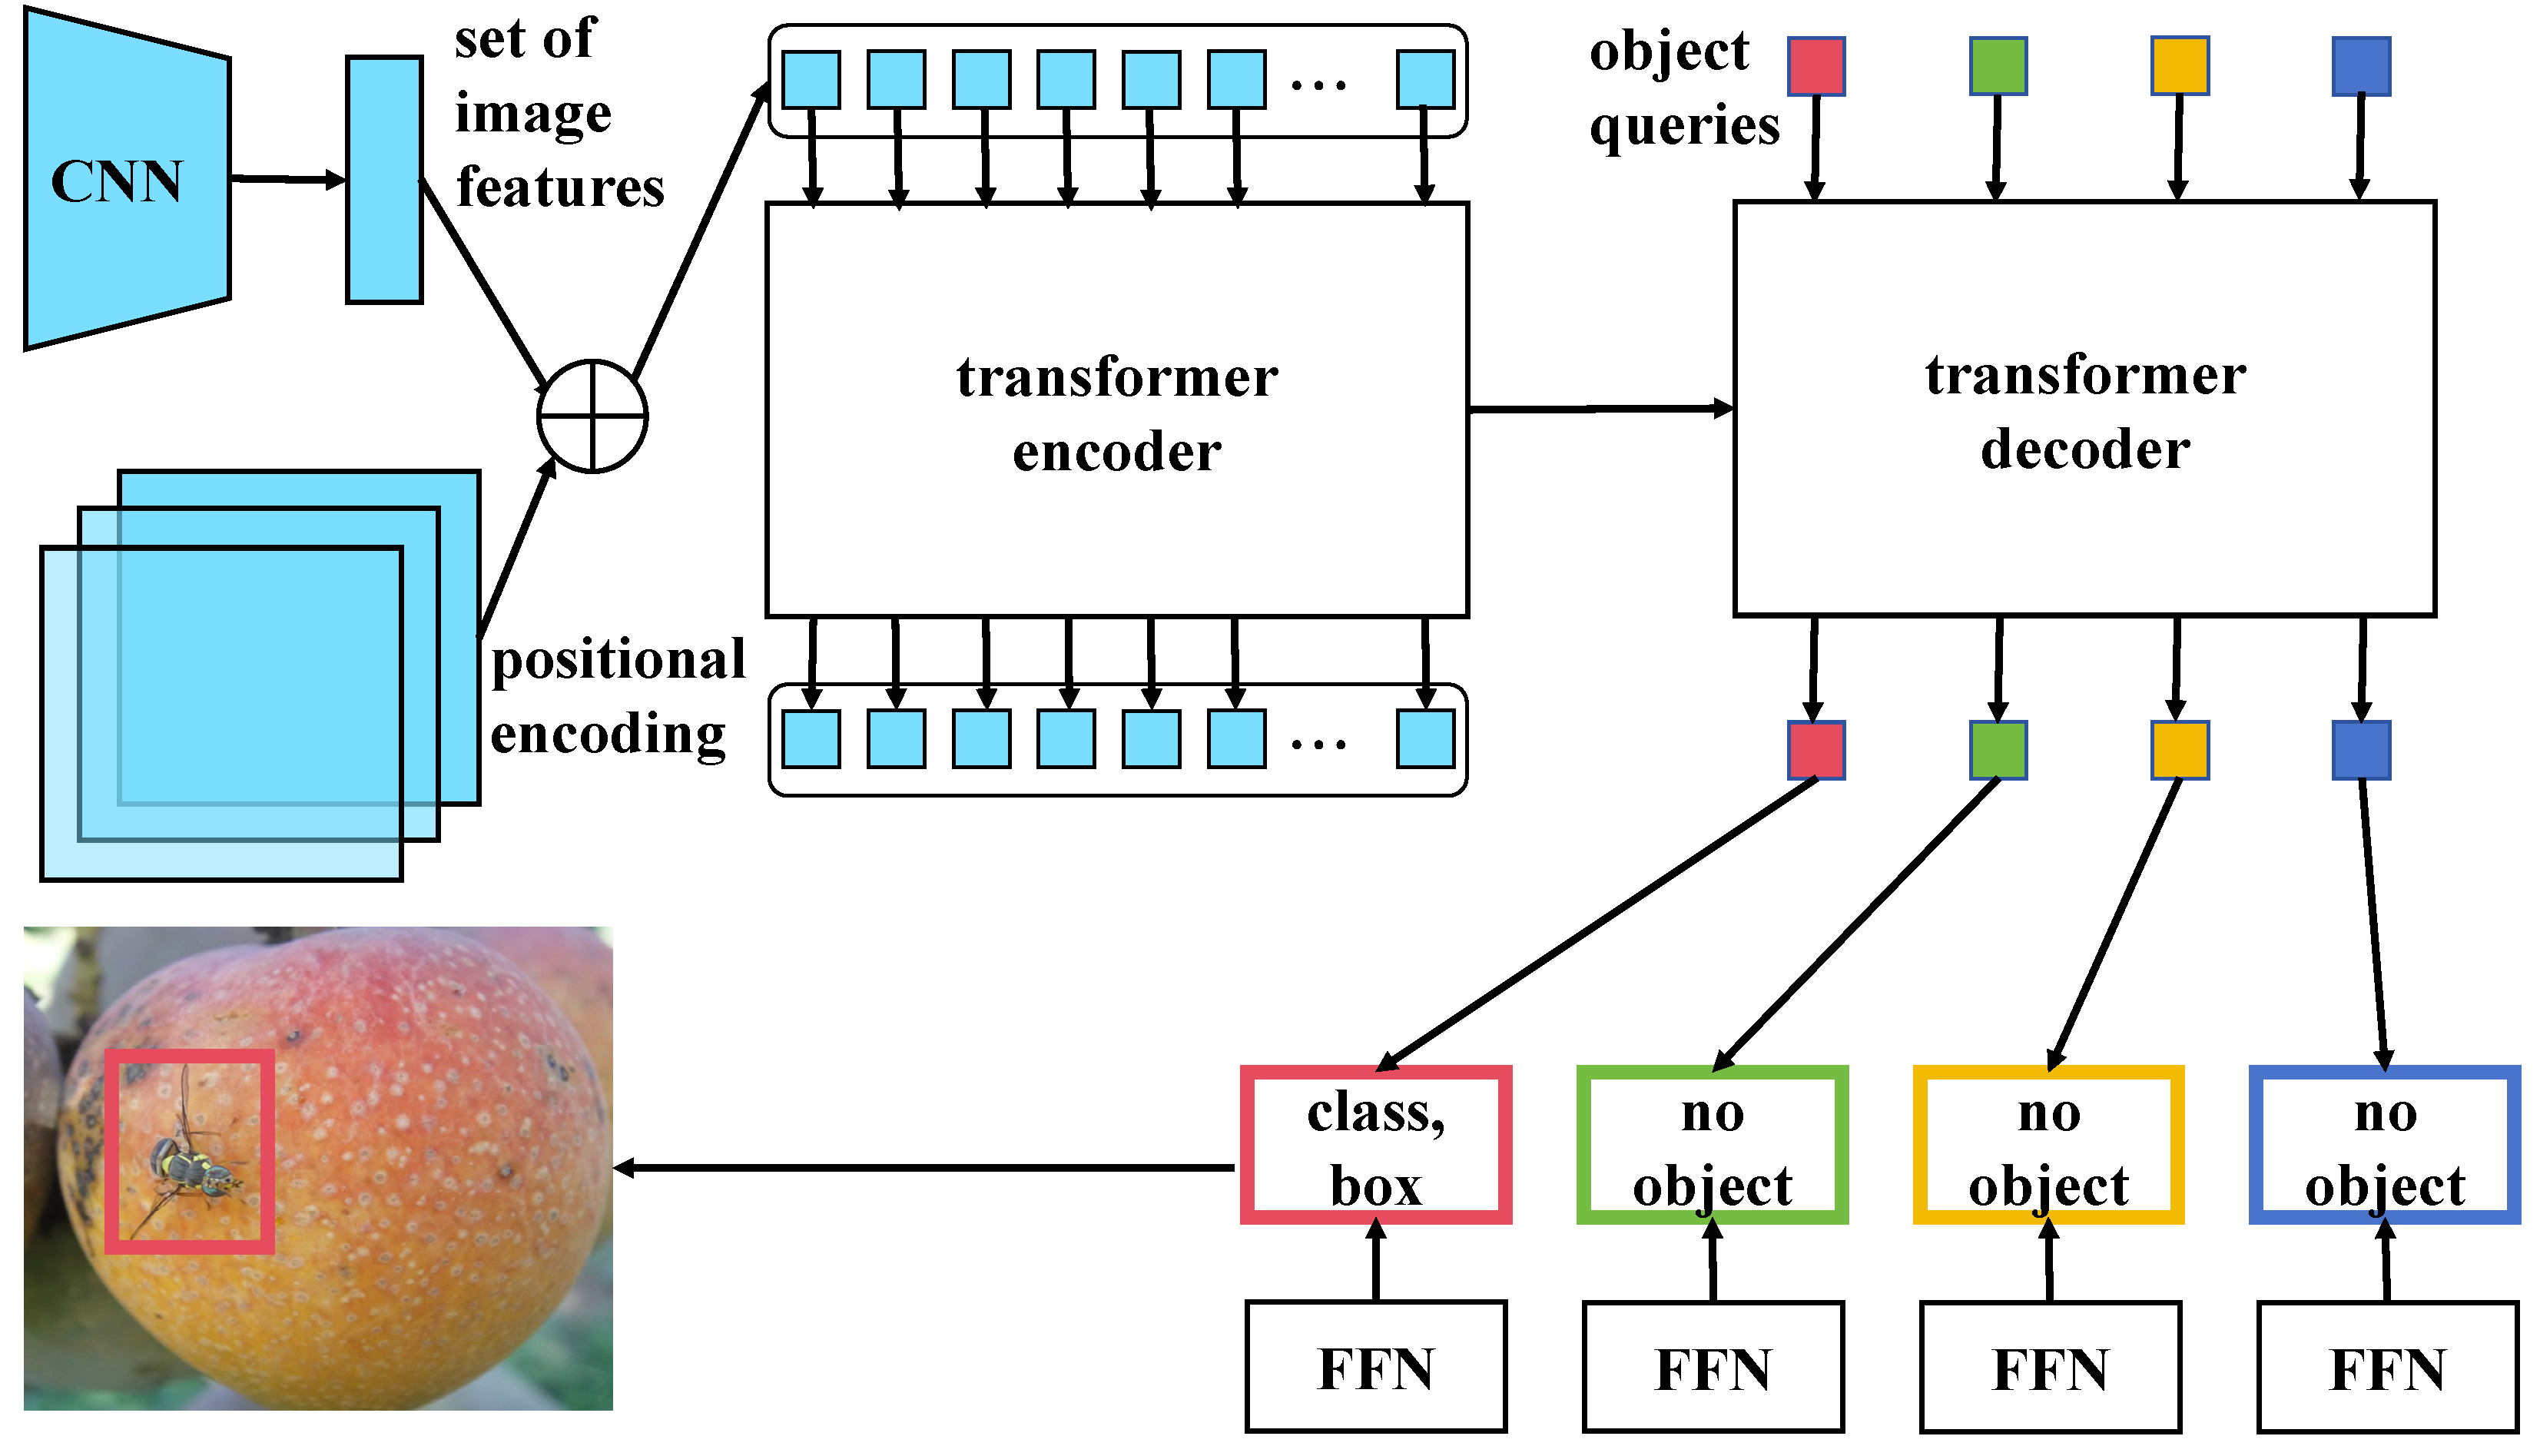
In this research, a high-precision fruit fly recognition model based on the Transformer structure is proposed, aiming to effectively enhance the accuracy of fruit fly detection and recognition through deep learning technology. The design philosophy of this method is to leverage the powerful capabilities of the Transformer to capture long-distance dependencies in images, combined with attention mechanisms, loss functions, and stable optimization strategies specifically optimized for object detection tasks, to achieve the purpose of high-precision recognition. The overall framework and workflow of the proposed method are summarized below.

3.5.1. Overview

In this study, a model incorporating four key technological components—high-precision Transformer architecture, step attention mechanism, cross-loss function, and adaptive stable optimizer—is proposed to address the challenges of high-accuracy fruit fly detection, as shown in Figure 3.
Each component specifically addresses the issues highlighted in the introduction and related work, with their unique contributions and practical impact detailed as follows:
  • High-precision Transformer Structure: The adopted modified Transformer structure is specifically designed for image target detection tasks. Compared to the traditional Transformer, optimizations for image features in the encoder and decoder significantly enhance the model’s capability to process image data and extract target features. Utilizing the self-attention mechanism, this structure effectively captures global dependencies within images, markedly improving the accuracy of fruit fly recognition. This improvement directly responds to the need outlined in the introduction for enhanced handling and recognition accuracy of complex image data.
  • Step Attention Mechanism: The introduced step attention mechanism incrementally refines the focus of attention, allowing for the model to concentrate on the details of the target after initially locating it. This mechanism not only boosts the model’s ability to capture image details, but also enhances accuracy and robustness in recognition, effectively addressing the challenge of identifying small targets against complex backgrounds.
  • Cross-Loss Function: To balance the issue of class imbalance in target detection tasks and improve the accuracy of boundary box positioning, the cross-loss function is designed. Combining classification and location losses, this function effectively enhances the model’s capabilities in managing class imbalance and improving positioning accuracy.
  • Adaptive Stable Optimizer: The application of the adaptive stable optimizer dynamically adjusts the learning rate based on the model’s performance during training and introduces a stabilizing factor to reduce fluctuations, accelerating convergence and enhancing performance. This optimizer overcomes the instability issues common with traditional optimizers in training deep networks, ensuring stable and efficient training processes.
Integrating these four technological components, the model framework of this study begins with data preprocessing, proceeds through feature extraction with the high-precision Transformer structure, refines target positioning with the step attention mechanism, and completes model training with the cross-loss function, ultimately adjusting the training process with the adaptive stable optimizer. This comprehensive approach not only represents theoretical innovation, but also demonstrates significant practical effects in application, fully reflecting the novelty and practical impact of the proposed method in this study.

3.5.2. High-Accuracy Transformer for Object Detection Task

In this study, for the high-accuracy detection task of fruit flies, the encoder and decoder structure of the Transformer model is carefully designed and optimized to suit the specific needs of image object detection. Firstly, the encoder is composed of 6 Transformer blocks, with each layer dimension set to 512, to adequately process image features. This depth and dimensionality are chosen based on comparative experiments, proving effective in capturing global information and complex details in images while ensuring computational efficiency. Each Transformer block includes 8 attention heads, enhancing the model’s ability to capture information in different regions of the image in parallel, especially for small targets like fruit flies, allowing for more detailed feature recognition. Secondly, the decoder also employs 6 Transformer blocks, maintaining the same dimensionality as the encoder. The design of the decoder aims to accurately predict each target’s position and category based on the features extracted by the encoder and the target query sequence. By introducing 8 attention heads in the cross-attention mechanism, the model can more effectively distinguish between different targets and the background from the rich features transmitted by the encoder, thus improving the accuracy of recognition and localization.
The choice of 6 layers of Transformer blocks balances ensuring model performance while avoiding excessive complexity that could lead to overfitting and computational burden. This depth is sufficient for the model to learn complex features and relationships in images, especially crucial in fruit fly detection tasks, where precise handling of small targets and complex backgrounds is required. The selection of 512 dimensions and 8 attention heads is based on balancing model performance with computational efficiency. A higher dimensionality provides sufficient representational space to capture image features, while multiple attention heads allow for the model to process information in parallel across different representational subspaces, enhancing the model’s ability to finely recognize target features. Through such parameter configurations and structural optimizations, the model can more accurately address the challenges encountered in fruit fly target detection tasks, such as identifying small targets and separating complex backgrounds, ensuring high accuracy and good generalization performance.

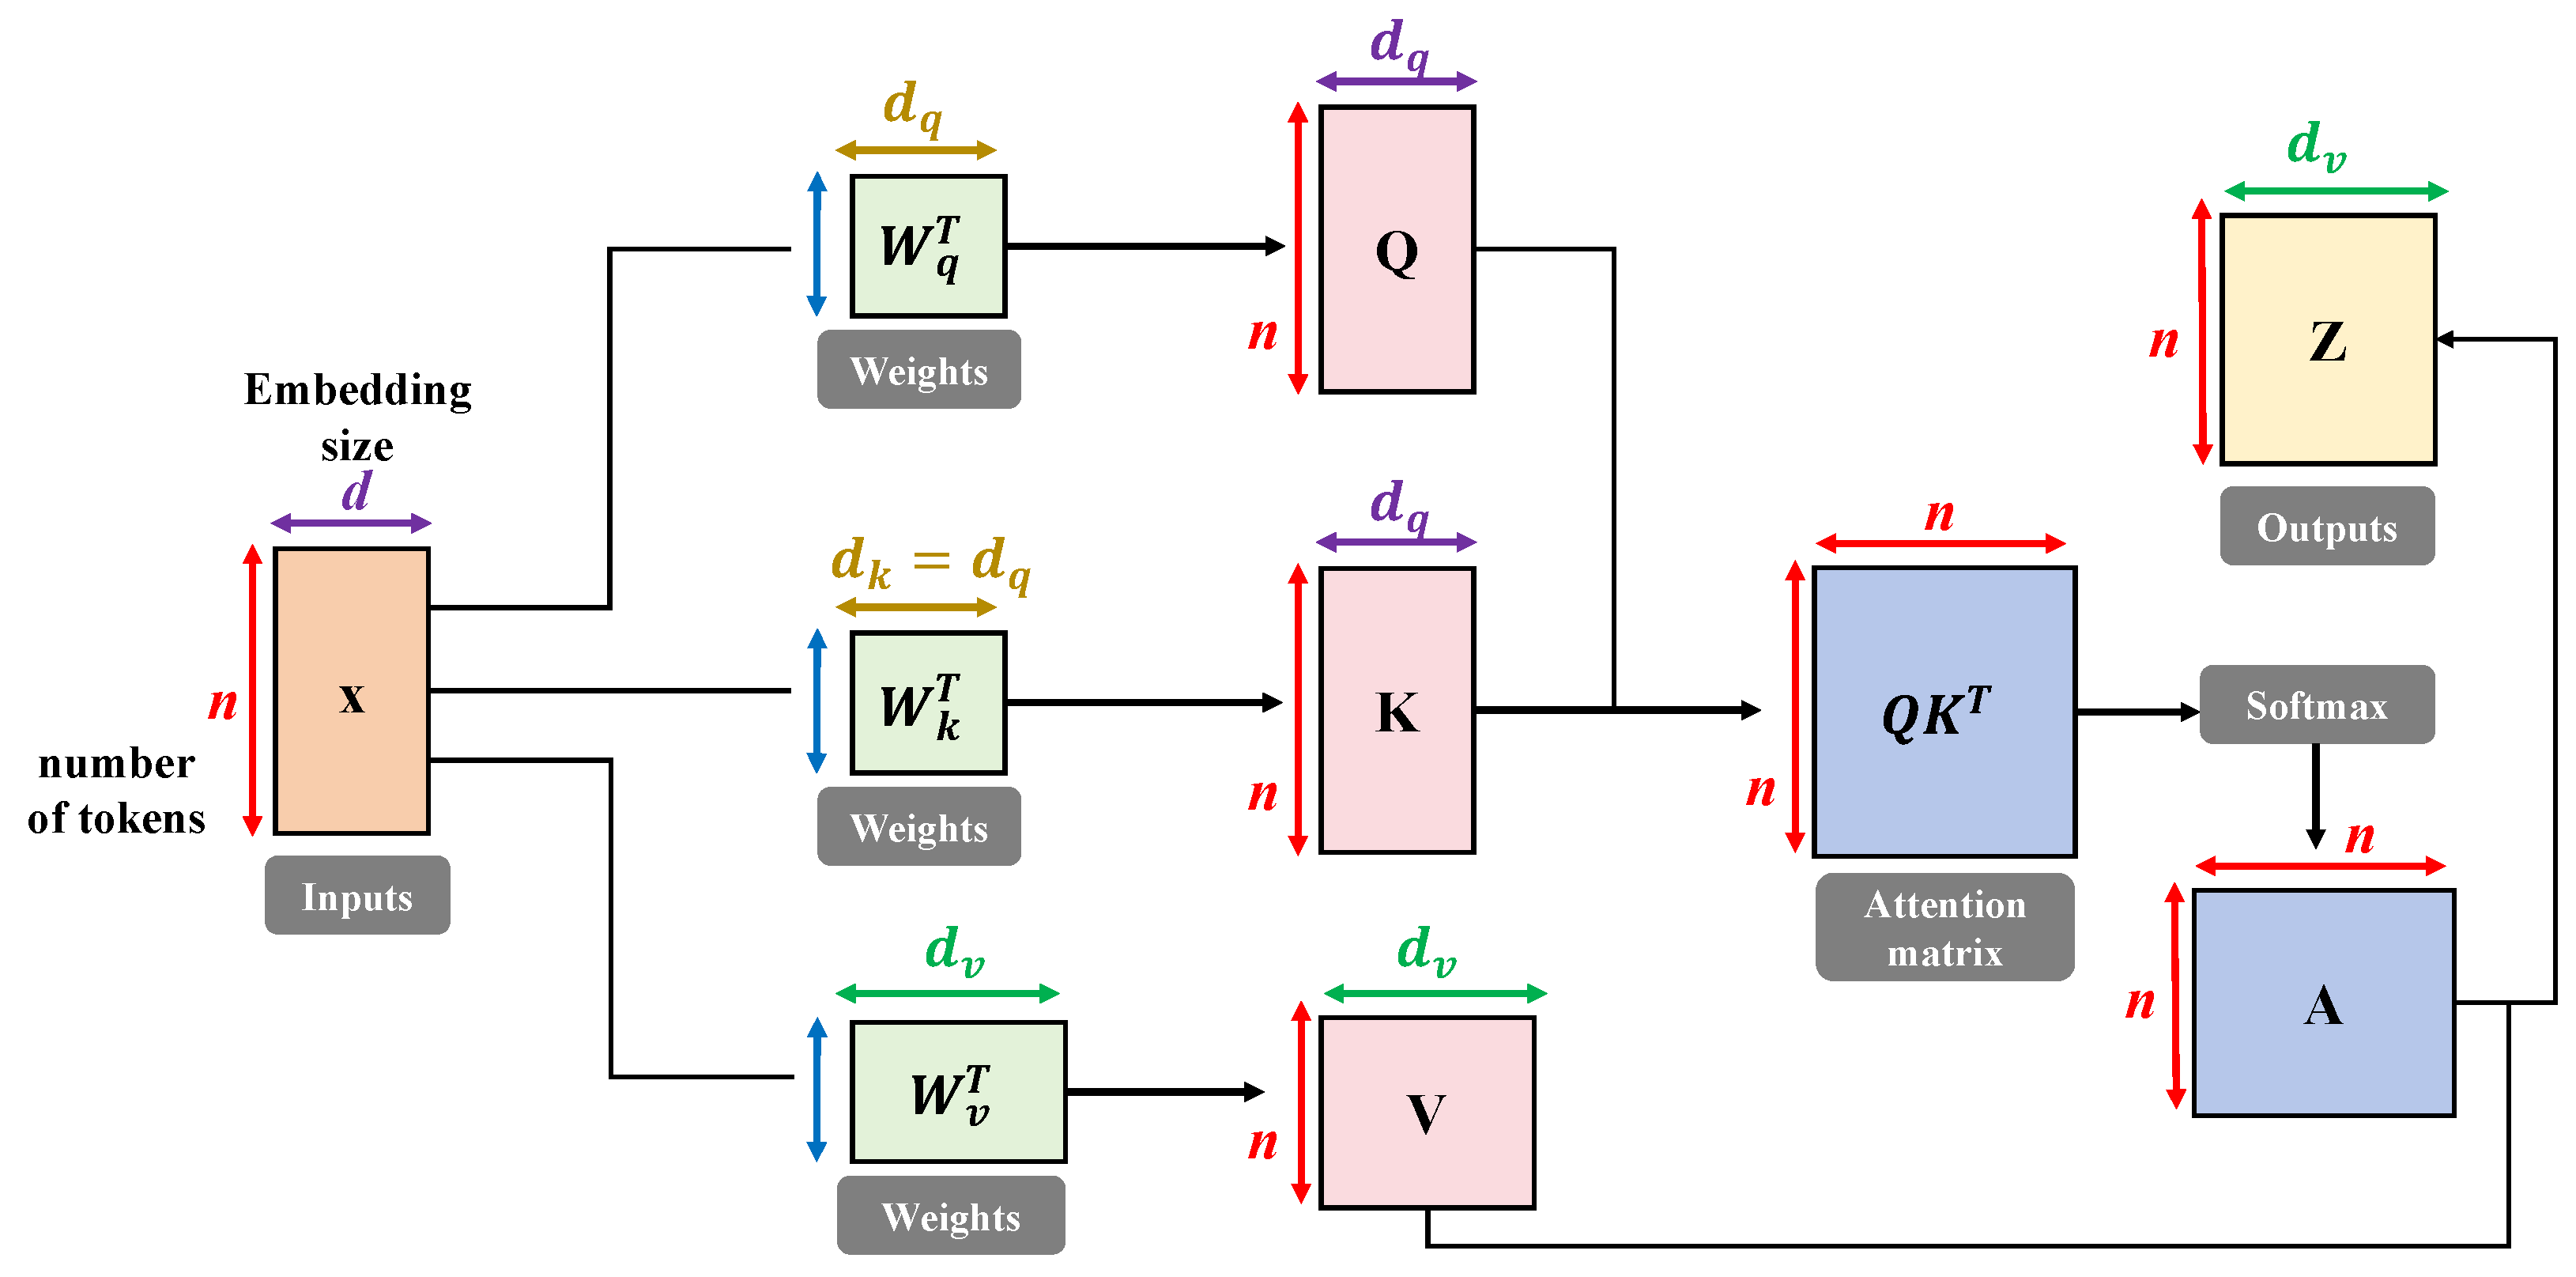
3.5.3. Step Attention Mechanism

The attention mechanism, a core component of the Transformer model, allows for the model to learn different aspects of the input data in parallel across various representation subspaces, as shown in Figure 4.
The underlying concept involves projecting queries (Q), keys (K), and values (V) into multiple spaces for attention calculation, concatenating these attention outputs, and then applying a linear mapping to produce the final output. The mathematical expression is as follows:
MultiHead ( Q , K , V ) = Concat ( head 1 , , head h ) W O
where head i = Attention ( Q W i Q , K W i K , V W i V )
Here, W i Q , W i K , W i V , and W O are learnable parameter matrices, and h represents the number of heads. The step attention mechanism proposed in this study aims to gradually focus the model’s attention, thereby enhancing its ability to recognize target details, as shown in Figure 5.
Unlike the multi-head attention mechanism’s parallel processing of different representation subspaces, the step attention mechanism adjusts the focus area of attention in steps, enabling the model to gradually concentrate on more detailed parts of the target after initially capturing its approximate location. The basic idea can be described by the following mathematical expression:
StepAttention ( Q , K , V , S ) = softmax Q K T d k + S V
where S is a step control matrix used to adjust the model’s attention focus progressively, and d k is the dimension of the key vector. In each training step, S is adjusted according to a predetermined strategy, allowing for the model’s attention to shift from a broad area to focus on key details gradually. The design of the step attention mechanism is based on the following two main principles:
  • Gradual learning strategy: By refining the focus range of attention in steps, the model can learn more local detail information on top of capturing global information, thereby improving recognition precision.
  • Dynamic adjustment of attention: Unlike the static multi-head attention mechanism, the step attention mechanism allows for the dynamic adjustment of attention distribution, more flexibly adapting to the challenges of complex backgrounds and diverse targets in object detection tasks.
In the high-precision fruit fly recognition task of this paper, the step attention mechanism offers clear advantages: it enhances localization precision, enabling the model to locate fruit flies more accurately, especially in complex backgrounds or when close to other objects. It strengthens the model’s capability to capture details, improving recognition accuracy through a gradual focusing process. It boosts the model’s generalization ability, as the dynamic adjustment of attention allows for the model to adapt to object detection tasks under different scenes and conditions, enhancing its generalization.

3.5.4. Cross-Loss Function

In models based on the Transformer structure, the cross-entropy loss function is commonly used, measuring the difference between the probability distribution predicted by the model and the actual label distribution in classification tasks. However, in object detection tasks, using only the cross-entropy loss function may not fully capture the target’s location information. Therefore, this research proposes a new loss function—the cross-loss function—designed to optimize both classification accuracy and target localization precision simultaneously. The cross-loss function, tailored for object detection tasks, combines classification and localization losses to optimize the model’s performance in identifying target categories and determining target locations. The specific mathematical expression is as follows:
L cross = L cls ( y , y ^ ) + λ L loc ( b , b ^ )
where L cls represents the classification loss; L loc represents the localization loss; y and y ^ represent the actual category and the predicted category probability distribution, respectively; b and b ^ represent the actual and predicted target bounding boxes; λ is a hyperparameter for balancing the weight of classification and localization losses. The classification loss is calculated using the cross-entropy loss function:
L cls = c = 1 C y o , c log ( y ^ o , c )
where C is the total number of categories, y o , c is an indicator function whether the oth sample belongs to category c, and y ^ o , c is the probability predicted by the model that the sample belongs to category c. The localization loss uses the smooth L1 loss function, defined as
L loc = i { x , y , w , h } smooth L 1 ( b i b ^ i )
smooth L 1 ( x ) = 0.5 x 2 if | x | < 1 | x | 0.5 otherwise
where b i and b ^ i represent the coordinates, width, and height of the actual and predicted bounding boxes. The main advantage of this design is its simultaneous focus on the model’s performance in both classification and localization. By combining these two parts of the loss, the model is required to not only accurately identify the target category but also precisely predict the target’s location, crucial for object detection tasks. Additionally, by adjusting the value of λ , the balance between classification accuracy and localization precision can be tuned according to specific task requirements, increasing the model’s flexibility. Compared to the loss function used in traditional Transformer structures, the cross-loss function is more suited for object detection tasks, as it optimizes both key performance indicators: classification and localization. This design enables the model to more accurately recognize and locate targets in complex object detection scenarios, such as fruit fly detection, significantly enhancing the overall performance of the model. Applied to the task in this paper, the advantages of the cross-loss function are mainly reflected in its ability to effectively improve the accuracy of fruit fly recognition and the precision of localization, especially in situations where the contrast between fruit flies and the background is not pronounced, or when fruit flies are small in size. By precisely capturing and learning the features of fruit flies, the model can accurately identify targets against complex backgrounds, playing a crucial role in practical applications.

3.5.5. Adaptive Stable Optimizer

In the field of deep learning, the choice of optimizer plays a crucial role in the efficiency of model training and its final performance. The traditional method of Stochastic Gradient Descent (SGD) is widely utilized due to its simplicity and ease of implementation, yet it struggles with slow convergence and a propensity to fall into local minima when dealing with complex non-convex optimization problems. To overcome these drawbacks, the Adaptive Moment Estimation (Adam) optimizer was introduced, accelerating convergence and enhancing the stability of model training by adjusting the learning rate for each parameter based on estimates of first and second moments of the gradients. However, Adam may encounter difficulties in hyperparameter tuning and instability in the initial phase of training under certain conditions. To further enhance the stability and efficiency of the optimization process, this study introduces a novel optimizer—the Adaptive Stable Optimizer (ASO). ASO aims to combine the stability of SGD with the adaptive learning rate characteristics of Adam, incorporating a new dynamic adjustment mechanism for a more robust and efficient optimization process. The essence of ASO lies in the modification of the gradient update rule, expressed mathematically as
θ t + 1 = θ t η t β 1 m t + ( 1 β 1 ) g t v t + ϵ
Here, θ t denotes the parameters at time step t, η t represents the dynamic learning rate, g t is the gradient at time step t, m t and v t are estimates of the first and second moments of the gradient, respectively, β 1 is a hyperparameter for adjusting the estimate of the first moment, and ϵ is a small constant added for numerical stability. The primary distinction between ASO and SGD or Adam is the incorporation of both the first moment and the raw gradient through the β 1 parameter. This approach is designed to automatically adjust the reliance on the first moment estimate at different stages of model training, thereby achieving faster convergence in the early stages and maintaining stability later on. Moreover, unlike the fixed decay strategy of Adam, the dynamic learning rate η t of ASO employs an adaptive adjustment mechanism based on the progress of training, making it more flexible and robust in the face of complex optimization problems. The advantages of ASO are mainly reflected in the following aspects:
  • Balance between stability and efficiency: By intelligently combining the stability of SGD with the adaptiveness of Adam, ASO maintains the stability of the optimization process while accelerating convergence, particularly suitable for training deep networks and complex datasets.
  • Dynamic learning rate adjustment: The learning rate adjustment of ASO not only takes gradient information into account, but also considers the progress of training, offering more appropriate learning rates at different stages of model training, thus optimizing the training process.
  • Improvement in initial instability: Compared to Adam, ASO reduces reliance on the first moment estimate during the initial phase of training, mitigating early training instability and facilitating a quicker transition to effective learning phases.
  • Flexible hyperparameter adjustment: ASO provides more adjustment space and strategies, making model training more aligned with the requirements of real-world problems, and reducing the difficulty and complexity of hyperparameter tuning.

3.6. Experimental Setup

In the research of the high-precision fruit fly recognition model based on the Transformer structure, a reasonable experimental setup is crucial for ensuring the validity and reliability of the experimental results. The experimental setup mainly includes the configuration of hyperparameters, the selection of hardware platforms and libraries, and the determination of baseline models.

3.6.1. Hyperparameter Configuration

The selection of hyperparameters directly impacts the performance of the model during the training process. To achieve the best training results, several key hyperparameters were meticulously adjusted based on extensive preliminary experiments and literature review:
  • Learning Rate: The learning strategy employed in this manuscript is cosine annealing, a method that gradually decreases the learning rate according to the cosine function, thereby adjusting the learning rate during neural network training. This approach facilitates smoother convergence of the model throughout the training process, particularly in avoiding oscillations caused by excessively high learning rates as it nears the optimal solution. The fundamental mathematical expression for cosine annealing is provided as follows:
    η t = η min + 0.5 × ( η max η min ) × ( 1 + cos ( T cur T max π ) )
    where η t represents the learning rate at the current iteration, η max denotes the maximum learning rate, typically set as the initial learning rate, and η min signifies the minimum learning rate, which can be a value close to 0. T cur is the current iteration number, and T max is the total number of iterations in a cycle, after which the learning rate resets to η max . This equation simulates a cycle of the cosine curve, starting the learning rate at η max , gradually decreasing it as T cur increases, reaching η min , and then rising back to η max , completing a cycle. In this manner, the learning rate exhibits periodic rises and falls, aiding the model in escaping local minima while finely tuning parameters in the later stages of training for optimal training outcomes.
  • Batch Size: Regarding the selection of batch size in this manuscript, using two NVIDIA GeForce RTX 3090 graphics cards as an example, the batch size was calculated based on the graphics card’s memory capacity, the model’s parameter volume, and the computational resources required per sample. The RTX 3090 features 24 GB of GDDR6X memory. The steps and considerations for calculating the batch size are as follows: Initially, the total parameter count of the model is 110 M, including weights and biases, typical of a model based on the Transformer architecture. Each parameter is usually stored as a 32-bit floating-point number (float32), requiring 4 bytes of storage space. Subsequently, the memory required to process a single sample is calculated. This includes the storage needs for input data, intermediate activation values, gradients, etc. Considering the 24 GB of memory on the RTX 3090, it is imperative to ensure that the total memory demand for the model’s parameters, a batch of samples, and the gradients and intermediate values generated during training does not exceed this capacity. With the premise of not exceeding the memory capacity, the maximum batch size is calculated based on the memory required by the model to process a single sample. The batch size should be a value that, while adhering to memory constraints, effectively utilizes the GPU’s computational resources to expedite the training process. Assuming the model requires approximately 1 GB of memory per sample (including memory needs for both forward and backward propagation), theoretically, the RTX 3090 can handle a maximum batch size of 24 GB/1 GB × 2 = 48. However, in practical applications, additional memory consumption for model parameters, optimizer states, etc., must be considered, thus the actual chosen batch size is 32.
  • Optimizer: Of the multitude of optimizers, the Adam optimizer was selected. It combines the advantages of Adagrad and RMSprop optimizers by adaptively adjusting the learning rate for each parameter, making it suitable for training deep learning models with large-scale data and parameters.
  • Loss Function Weights: In the cross-entropy loss function, different weights were assigned to the classification loss and localization loss. After repeated experimental adjustments, the weight for the classification loss was determined to be 1, and the weight for the localization loss was set to 2. This configuration aims to balance the model’s performance between recognition accuracy and localization precision.
  • The division of training and validation data: The study adopted a common random splitting method to ensure the randomness and representativeness of the data.
The choice of batch size was not only based on hardware resource limitations, but also considered the potential impact of batch size on model performance. Excessively large batch sizes could lead to memory overflow, while excessively small sizes might affect the model’s convergence speed and performance. As for the learning rate adjustment strategy, a gradual decay method was chosen to refine the parameter adjustment process, especially when the loss reduction halts, by reducing the learning rate to prevent overfitting and enable the model to converge more accurately to the global optimum. The selection of these hyperparameters and adjustment strategies stems from a deep understanding of the deep learning training process and model behavior, as well as an accurate grasp of the relevant mathematical principles. The validation of the effectiveness of these strategies can provide a more scientific and rational reference for future model training.

3.6.2. Software and Hardware Platform

The chosen hardware platform plays a key role as the foundational infrastructure, directly affecting the efficiency of model training and testing. For this purpose, a high-performance computer equipped with an NVIDIA GeForce RTX 3090 GPU was selected as the main experimental platform. The NVIDIA GeForce RTX 3090 GPU, with 24 GB of GDDR6 memory, provides powerful computational support for processing large datasets and complex neural network models. Additionally, the GPU’s support for Tensor Core and Ray Tracing technologies further enhances the efficiency of deep learning tasks. Such hardware configuration not only shortens model training time but also improves the experimental parallel processing capability, making it an ideal choice for conducting deep learning research.
Regarding the software platform, model development, training, and evaluation were based on the PyTorch 1.8 deep learning framework. PyTorch, an open-source deep learning library developed by Facebook’s AI research team, offers a flexible programming model and extensive APIs, supporting rapid experimentation and innovation. The dynamic computation graph feature of PyTorch makes model design and debugging more intuitive and flexible, greatly accelerating the progress of research. Moreover, the active PyTorch community provides a wealth of tutorials and documentation, facilitating learning and problem-solving. To efficiently implement the model and conduct experiments, multiple library functions under the PyTorch framework were utilized, including but not limited to ‘torch.nn’, which provides modules and classes for building neural networks, such as various types of layers (fully connected layers, convolutional layers, etc.), activation functions (ReLU, Sigmoid, etc.), and loss functions (cross-entropy loss, mean squared error loss, etc.); ‘torch.optim’, which offers various optimization algorithms for updating network parameters, including SGD, Adam, etc., crucial for training deep learning models; ‘torchvision’, which an extension package of PyTorch, offering tools for image data processing and common datasets, model architectures, etc., used for image preprocessing and data augmentation; and ‘torch.utils.data’, which provides tools for loading and processing data, facilitating the construction of efficient data input pipelines. By leveraging these hardware and software resources, an efficient and flexible experimental environment was established, providing solid support for the research on the high-precision fruit fly recognition model based on the Transformer structure. This not only ensured the smooth progress of the experiments but also laid a good foundation for subsequent research and applications.

3.6.3. Baseline Models

For a comprehensive evaluation of the performance of the fruit fly high-precision recognition model based on the Transformer structure, several representative comparison models were selected, including one-stage models (YOLOv6 [45], YOLOv8 [46], RetinaDet [47]), a two-stage model (Faster-RCNN [48]), and a Transformer-based model (DETR [49]). These models each have distinct characteristics within the domain of object detection. Comparison with these models allows for a more objective assessment of the performance of the model proposed in this study. The rationale behind the selection of these models and their features are detailed below.
YOLOv6, a newer version within the YOLO series, inherits the series’ characteristics of speed and accuracy while optimizing the model structure and algorithm to enhance detection precision and speed. Introducing more effective feature extraction networks and attention mechanisms, YOLOv6 has improved detection capabilities for small objects, achieving a balance between real-time performance and accuracy. Another update in the YOLO series, YOLOv8, further enhances detection performance and efficiency. It achieves more accurate object recognition and faster detection by adopting advanced network architectures and optimization techniques, showcasing outstanding performance in processing large datasets and complex scenes. RetinaDet, optimized for detecting small objects in one-stage detection models, improves detection precision for small targets through enhanced feature fusion mechanisms and anchor design, particularly suitable for applications requiring precise identification of small objects against complex backgrounds. Faster-RCNN, an influential two-stage model in the field of object detection, first generates candidate object regions through the RPN and then performs fine-grained classification and bounding box regression on these regions. It excels in accuracy, especially in scenarios requiring precise target localization. DETR is the first model to fully apply the Transformer to object detection. It abandons the conventional anchor and region proposal mechanisms of traditional object detection models, achieving end-to-end object detection through global feature understanding and direct set prediction. DETR exhibits unique advantages in handling scenes with complex relationships and occlusions.
The comparison with the aforementioned models is justified as they each represent different technological approaches and developmental stages within the field of object detection. YOLOv6, YOLOv8, and RetinaDet, as one-stage detection models, emphasize speed and efficiency, serving as important benchmarks for assessing the real-time detection performance of the new model. Faster-RCNN, representing two-stage detection models, provides a significant reference standard for accuracy. DETR, as a Transformer-based model, with its novel design philosophy and excellent performance, offers inspiration and challenges for the design of the model in this study. Through comparison with these models, the performance of the model proposed in this study can be comprehensively evaluated in terms of speed, accuracy, and generalization ability, validating its advantages and innovations in high-precision fruit fly recognition tasks.

3.6.4. Experiment Metric

In the evaluation of the high-precision fruit fly recognition model based on the Transformer structure, four main metrics were used: Precision, Recall, Accuracy, and F1-Score. These metrics provide a comprehensive assessment of different aspects of model performance, as detailed below. Precision measures the proportion of samples correctly identified as positive (fruit flies) among all samples classified as positive by the model. Its mathematical expression is
Precision = T P T P + F P
where T P (True Positive) represents the number of samples correctly identified as fruit flies, and F P (False Positive) represents the number of non-fruit fly samples incorrectly identified as fruit flies. Precision assesses the model’s accuracy in identifying positive classes.
Recall measures the proportion of samples correctly identified by the model among all actual positive (fruit fly) samples. Its mathematical expression is
Recall = T P T P + F N
where F N (False Negative) represents the number of fruit fly samples incorrectly identified as non-fruit flies by the model. Recall assesses the model’s ability to cover positive samples.
Accuracy, the most intuitive metric, measures the proportion of samples correctly identified by the model among all samples. Its mathematical expression is
Accuracy = T P + T N T P + T N + F P + F N
where T N (True Negative) represents the number of samples correctly identified as non-fruit flies. Accuracy assesses the overall accuracy of the model’s identifications.
The F1-Score is the harmonic mean of Precision and Recall, considering both the model’s accuracy and coverage ability. Its mathematical expression is
F 1 - Score = 2 · Precision · Recall Precision + Recall
The F1-Score is particularly important when the model operates on imbalanced datasets, as it does not favor classes with a larger number of samples, balancing Precision and Recall consideration.
In this study, the metrics adopted for model evaluation, including Precision, Recall, Accuracy, and F1-score, are standard benchmarks in the domain of object detection. However, these metrics alone cannot fully evaluate a model’s performance in practical applications. For instance, while Precision reflects the model’s accuracy in identifying positive samples, an excessively high false positive rate could lead to an undue focus on incorrect targets, thus wasting resources in practical applications. Recall demonstrates the model’s ability to cover positive samples, but in practical applications like pest control, missing detections could result in severe consequences due to uncontrolled pests. Accuracy provides an overview of the model’s overall performance but does not differentiate between false positives and false negatives, which fails to reflect the model’s reliability in critical tasks. The F1-score, as the harmonic mean of Precision and Recall, attempts to balance the two, yet in practice, one may need to prioritize one over the other based on specific circumstances. Therefore, from a practical application perspective, the rationale behind choosing these evaluation metrics should be based on an understanding of the actual requirements and expected performance of the fruit fly detection task. For example, in high-precision fruit fly detection, given the urgency of pest control, greater emphasis may need to be placed on Recall to ensure as few misses as possible. Additionally, when conducting an in-depth analysis of the model’s performance, special requirements in the practical application context, such as stability under different environmental conditions and the ability to recognize pests of varying sizes, must be considered. These are crucial aspects of evaluating whether a model can meet the demands of real-world applications. In summary, the selection of evaluation metrics should be grounded in actual application scenarios, combined with the specific demands of the fruit fly detection task, as well as the model’s anticipated performance and role in real-world settings, to provide a more detailed and comprehensive assessment of the model’s practicality and efficacy.

4. Results and Discussions

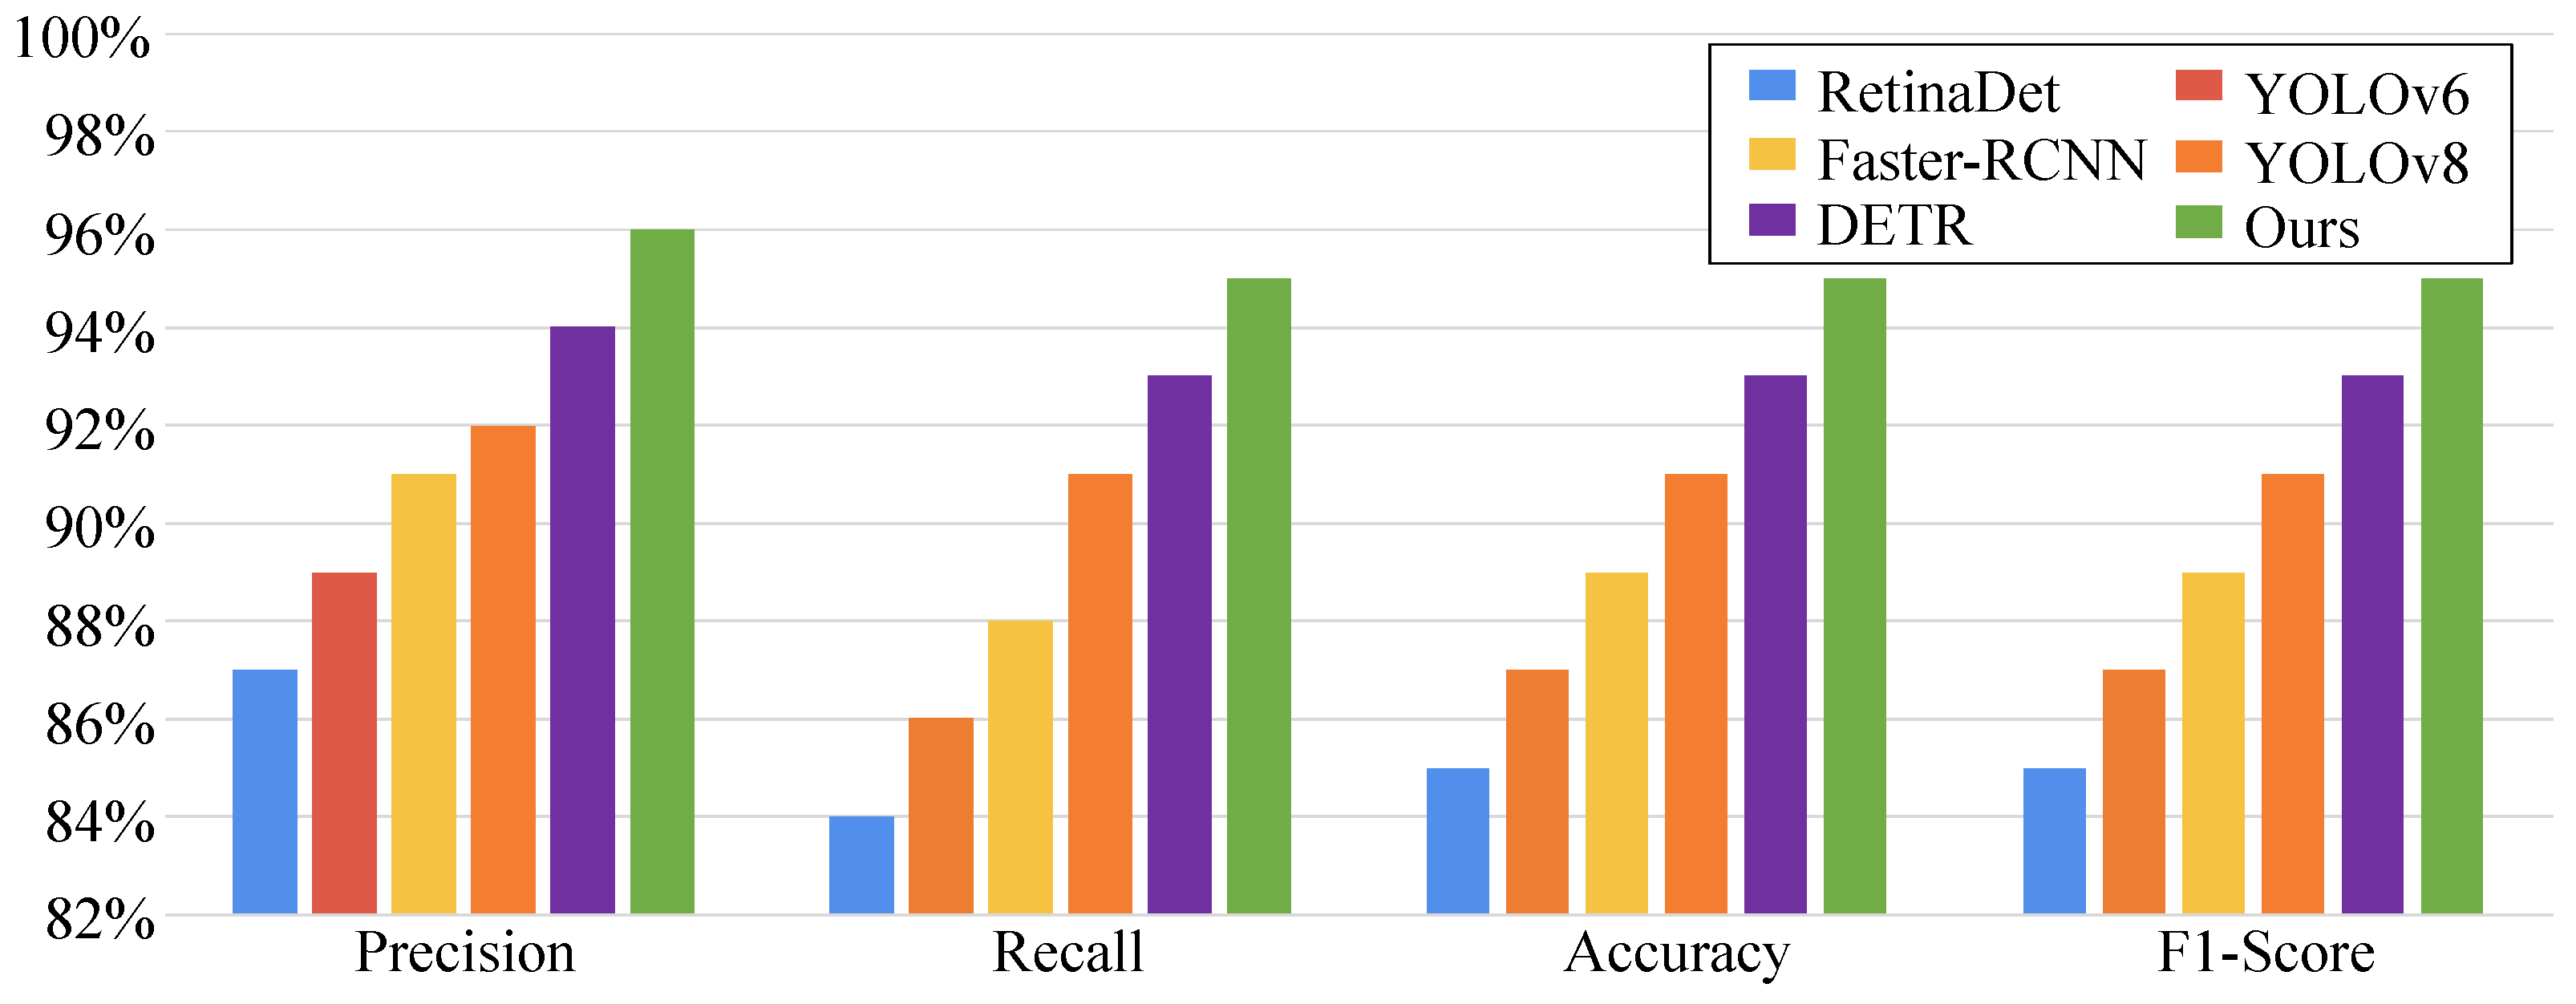
4.1. Fruit Fly Detection Results

This experiment aimed to evaluate and validate the performance of the high-precision fruit fly recognition model based on the Transformer structure in fruit fly detection tasks. By comparing with current popular target detection models, the experimental results intended to demonstrate the advantages of the proposed method in four key performance metrics: Precision, Recall, Accuracy, and F1-score. The experimental results are displayed in Table 2 and Figure 6.
As it is a single-stage target detection model, RetinaDet’s main advantage lies in its fast detection speed. However, its performance may be limited when dealing with small targets and complex backgrounds. Mathematically, although RetinaDet’s multi-scale target detection capability can improve detection of different sizes, it might not match Transformer-based models in feature extraction and learning of target details. Therefore, its performance in Precision, Recall, Accuracy, and F1-score is relatively lower. The YOLO series, known for its speed and accuracy, has seen improvements in models like YOLOv6 and YOLOv8 through the introduction of more advanced feature extraction networks and optimization technologies, such as attention mechanisms and deeper network structures. Nevertheless, as single-stage models, YOLOv6 and YOLOv8 still face challenges in handling highly overlapping targets and very small targets. Despite better performance than RetinaDet, there remains a gap compared to Transformer-based models. FasterRCNN, a dual-stage target detection model, exhibits higher detection precision through RPN and subsequent precise classification and bounding box regression. It can better handle target occlusions and small target detection, benefiting from its ability to generate high-quality region proposals for precise classification and regression. However, its more complex process and slower detection speed may limit its applicability in some real-time applications. DETR, by fully applying Transformer to target detection and discarding traditional anchors and complex preprocessing steps, achieves end-to-end target recognition and localization within a global scope. This method shows superior performance in handling complex scenes and relationships between targets. DETR’s design philosophy, leveraging the self-attention mechanism of the Transformer to capture global dependencies, thus improves detection precision and recall, outperforming traditional target detection models across all metrics.
The proposed model, incorporating the step attention mechanism and cross-loss function, is specifically optimized for the fruit fly detection task. The step attention mechanism significantly enhances the model’s recognition precision and localization ability by gradually focusing on target details after initially identifying the target’s approximate location. The cross-loss function, by balancing classification accuracy and localization precision, optimizes key performance indicators in detection tasks. These mathematical principles ensure the model’s excellent performance in Precision, Recall, Accuracy, and F1-score. Comparative analysis reveals the significant performance advantage of the proposed method in fruit fly detection tasks, attributable to its innovative network design and optimization strategies. Through the carefully designed step attention mechanism and cross-loss function, the proposed method effectively enhances the model’s capability to handle complex target detection tasks, especially in terms of Precision, Recall, and Accuracy, showcasing its great potential and applicability in fruit fly detection tasks.

4.2. Analysis of Visualization Results for Fruit Fly Detection

This section delves into the performance of the proposed model for fruit fly detection against complex backgrounds, comparing it with other advanced object detection models, as shown in Figure 7. Through a series of visualization results, it is observed that the high-precision fruit fly recognition model based on the Transformer structure exhibits superior accuracy and robustness in identifying and locating fruit flies within complex imagery. This consistency with prior experimental outcomes further validates the model’s effectiveness and superiority.
Comparative visualization between the proposed model and other models distinctly reveals the proposed model’s higher accuracy and robustness in identifying and locating fruit flies against complex backgrounds. Specifically, the model is capable of accurately differentiating between fruit flies and complex backdrops, even in scenarios where fruit flies closely match the background color or are partially obscured. Mathematically, the design of the step attention mechanism allows for focus to be concentrated on significant detail features, crucial for identifying small targets within complex backgrounds. The cross-loss function, by balancing classification and localization losses, optimizes the model’s ability to accurately identify target categories while precisely locating them. The Transformer structure’s self-attention mechanism and encoder–decoder architecture provide the model with a powerful global information processing capability, enabling key target feature capture within complex backgrounds.

4.3. Ablation Study on the Step Attention Mechanism

This experiment, through an ablation study, analyzes the role and contribution of different attention mechanisms within the high-precision fruit fly recognition model based on the Transformer structure. By comparing models with no attention mechanism, spatial attention, channel attention, multi-head attention, and step attention mechanisms, the experiment aims to reveal the impact of different attention mechanisms on model performance metrics such as Precision, Recall, Accuracy, and F1-score, thereby demonstrating the step attention mechanism’s advantages and necessity in enhancing target detection performance.
Results indicate that incorporating attention mechanisms significantly enhances model performance, with the step attention mechanism’s model outperforming all metrics, achieving over 0.95 in Precision, Recall, Accuracy, and F1-score. Conversely, models without any attention mechanism perform the worst, with all metrics falling below 0.81. Spatial and channel attention models’ performances lie between those without any attention mechanism and the step attention mechanism, with multi-head attention models performing better than all alternative attention mechanisms but still falling short of step attention.
Models lacking an attention mechanism fail to account for the relative importance of targets within images, treating all parts equally and not fully exploiting target correlations and differences. This results in limited feature extraction and representation capabilities, making accurate background and target distinction challenging, thus affecting overall model performance. Spatial attention mechanisms, by assigning different weights to each location on the input feature map, emphasize important image areas, aiding the model in focusing on key parts. However, focusing solely on spatial dimensions may overlook channel dependencies, limiting performance enhancement. Channel attention mechanisms concentrate on distributing weights across feature channels, enhancing the model’s reliance and selection ability on different feature channels. This mechanism aids in capturing high-level semantic information from images but also neglects spatial detail nuances, thereby offering room for performance improvement despite outperforming spatial attention. Multi-head attention mechanisms, by distributing attention across multiple heads for parallel processing, capture different aspects of information simultaneously, considering both spatial and channel information for a more comprehensive feature representation. This integrated approach significantly improves multi-head attention mechanisms’ performance over single spatial or channel attention mechanisms. Step attention mechanisms, by dynamically adjusting the focus of attention, allow for the model to concentrate on more detailed target aspects following an initial target location identification. This gradual refinement process, mimicking the natural way humans observe objects, helps the model accurately locate and identify targets within complex backgrounds. The step attention mechanism’s design fully leverages Transformer’s self-attention features, improving target identification precision and localization through fine-tuned attention distribution, achieving optimum performance across all evaluation metrics.

4.4. Ablation Study on the Cross-Loss Function

The objective of this experiment was to assess the role of the cross-loss function within the high-precision fruit fly recognition model based on the Transformer structure through ablation study. The experimental design aimed to compare the performance of models utilizing the cross-loss function against those employing other commonly used loss functions, such as the ones used in YOLOv8 and DETR, in target detection tasks. The experimental outcomes are presented in Table 3.
The YOLOv8 model employs a composite loss function, combining classification loss, localization loss, and confidence loss. Although this design balances classification and localization performance to some extent, it may not fully consider the intrinsic connection and trade-off between classification and localization in target detection tasks. The DETR model, utilizing a set prediction approach and employing the Hungarian matching algorithm combined with a loss function, directly optimizes the final outcome of target detection. This method is effective in handling targets with complex relationships but may require longer training times to converge in some cases. The cross-loss function combines classification and localization losses, aiming to optimize two key aspects of target detection tasks simultaneously: identifying the target’s category and locating its position. Classification loss typically uses cross-entropy loss, focusing on improving the model’s accuracy in recognizing target categories; localization loss employs smooth L1 loss, focusing on enhancing the model’s precision in predicting target locations. By balancing these two parts of loss, the cross-loss function encourages the model to improve classification accuracy while more precisely locating targets. Experimental results show that the model using the cross-loss function outperforms the YOLOv8 and DETR models across all metrics. Specifically, the cross-loss function model achieved 0.96, 0.95, 0.95, and 0.95 in Precision, Recall, Accuracy, and F1-score, respectively. In contrast, the YOLOv8 model scored 0.92, 0.91, 0.91, and 0.91 in these metrics; the DETR model scored 0.94, 0.93, 0.93, and 0.93, respectively. These results indicate the cross-loss function’s significant advantage in enhancing fruit fly detection performance.

4.5. Ablation Study on Preprocessing and Augmentation Method

This section aims to explore the impact of different data preprocessing and augmentation techniques on the performance of the Transformer-based model for high-precision identification of adult fruit flies. The primary objective of the experimental design is to assess the influence of various data augmentation methods, including rotation, brightness adjustment, cropping, flipping, and contrast adjustment, on model performance. The experimental results are displayed in Table 4.
Based on the experimental outcomes, it is observed that when no data augmentation methods are applied, the model’s performance is lower, with Precision, Recall, Accuracy, and F1-score being 0.85, 0.82, 0.83, and 0.84, respectively. This suggests that the model has limited generalization capability on raw, unprocessed data, potentially struggling with image variations brought about by changes in pose, illumination differences, and obstructions. Upon the separate application of rotation, brightness adjustment, cropping, flipping, and contrast adjustment, the model’s performance improves, notably with the most significant enhancement observed following the application of cropping augmentation, where Precision, Recall, Accuracy, and F1-score reach 0.92, 0.93, 0.92, and 0.93, respectively. This indicates that the cropping technique effectively enhances the model’s precision in target localization, likely due to cropping forcing the model to focus on local features of images rather than global information, thereby partially mimicking the partial occlusions that targets may experience in practical application scenarios. Enhancements in contrast and flipping also improve the model’s performance, although to a lesser extent. Brightness adjustment noticeably improves the model’s recall, likely because brightness variation strengthens the model’s capability to recognize targets under varying lighting conditions. Rotation augmentation also significantly improves model performance, possibly because it enables the model to learn the appearance of targets at different angles, thereby enhancing the model’s robustness to rotational changes. When all data augmentation methods are employed simultaneously, the model scores the highest across all evaluation metrics, achieving 0.96, 0.95, 0.95, and 0.95. This demonstrates that the combination of these data augmentation methods not only adds diversity to the data but also enhances the model’s adaptability to complex variations. The method of integrating various preprocessing and augmentation strategies enables the model to more comprehensively understand and recognize targets under different conditions, significantly boosting the model’s generalization capability.
In summary, different data augmentation techniques enhance the model’s ability to recognize targets and its generalization power by altering the training inputs. The judicious application of these augmentation techniques can substantially improve the performance of the Transformer-based model in the high-precision identification task of adult fruit flies. Future work may further explore the interaction between these data augmentation techniques and model structure, as well as ways to design more efficient and effective augmentation strategies to adapt to a broader range of application scenarios and more challenging tasks.

4.6. Limitations and Future Work

In this study, a Transformer-based high-precision identification model for adult fruit flies is developed, which shows excellent detection performance after the introduction of step attention mechanisms and cross-loss functions. However, the model still has some limitations that require quantitative analysis and improvement in future work. Firstly, although the step attention mechanism generally enhances model performance, its performance under extreme conditions still needs improvement. For example, for extremely small targets or those in complex backgrounds, step attention may fail to capture key features in the early stages, leading to subsequent steps being unable to effectively compensate for this information. To address this issue, future work could involve adding preprocessing steps to increase target size or improving the attention mechanism to enhance the model’s ability to handle such cases. To quantitatively assess the specific impact of these limitations on performance, a test set containing targets of various sizes could be constructed and the model’s performance under different size distributions analyzed, thus providing guidance for improvement strategies. Secondly, although the cross-loss function performed well in experiments, the choice of hyperparameters significantly affects model performance. The optimal values of hyperparameters may vary across different tasks, thus necessitating the development of an adaptive hyperparameter adjustment strategy.
In future work, an automatic adjustment mechanism based on validation set performance could be introduced, allowing for the model to find the optimal hyperparameter configuration for different tasks. Additionally, statistical analysis could be used to assess the impact of hyperparameter changes on model performance, thereby formulating more precise adjustment strategies. In terms of generalization ability, although the model performs well on a specific dataset, its performance in other target detection tasks has not been verified. Future research should apply the model to more diverse and challenging datasets and use statistical methods to quantitatively analyze the model’s performance across different tasks to evaluate and improve its generalization ability. Moreover, the computational complexity and resource consumption of the model are also important considerations. In resource-limited situations, reduction in resource consumption while maintaining performance is a key issue. Future studies could introduce model compression and acceleration techniques to reduce the model’s computational requirements and use experiments and theoretical analysis to assess the specific impact of these methods on performance. In summary, although this study makes progress in the field of fruit fly identification, it still faces many challenges. Future work should focus on the existing limitations, quantitatively assess the specific impact of these limitations through experiments and theoretical analysis, and explore effective improvement strategies to achieve higher-performance, more widely applicable target detection models.

5. Conclusions

In this study, a high-precision fruit fly recognition model based on the Transformer structure was proposed to address the critical issue in object detection tasks of accurately identifying and locating small targets against complex backgrounds. Experimental results demonstrated that the model achieves a Precision of 0.96, a Recall rate of 0.95, an Accuracy of 0.95, and an F1-score of 0.95. These outcomes significantly surpass those of comparative models, including popular one-stage models (such as YOLOv6, YOLOv8, RetinaDet) and two-stage models (such as Faster-RCNN), as well as Transformer-based models (DETR). Specifically, when compared to the more advanced models YOLOv8 and DETR, the proposed model in this paper shows substantial improvements in Precision, Recall, Accuracy, and F1-score, fully validating the effectiveness and advancement of the presented method in the task of high-precision fruit fly recognition. Additionally, the importance of the two innovative contributions to enhancing model performance was further verified through ablation studies on the step attention mechanism and cross-loss function. The results of the ablation study on the step attention mechanism indicated that the introduction of this mechanism significantly enhanced the model’s detection performance, especially in terms of precision and recall. The ablation study on the cross-loss function revealed that, compared to traditional loss functions, the cross-loss function more effectively balanced the accuracy of classification and the precision of target localization, thereby achieving better results across all evaluation metrics. In summary, the high-precision fruit fly recognition model based on the Transformer structure presented in this paper demonstrated significant performance advantages in the field of object detection, particularly in handling complex backgrounds and small target detection tasks. Despite the achievements of this research, it is believed that there is still considerable room for improvement in model optimization, generalization capability enhancement, and computational efficiency. Future research will continue to explore more efficient and accurate object detection models to meet the demands for high-performance object detection models in practical applications.

Author Contributions

Conceptualization, L.Z. (Lexin Zhang), L.Z. (Liping Zheng) and S.Y.; Data curation, L.Z. (Liping Zheng), X.L., F.L., Y.C. and Y.W.; Formal analysis, K.C. and X.L.; Funding acquisition, S.Y.; Investigation, L.Z. (Lexin Zhang) and Y.L.; Methodology, L.Z. (Lexin Zhang) and K.C.; Project administration, Y.S. and S.Y.; Resources, L.Z. (Liping Zheng), Y.L. and Y.C.; Software, K.C. and F.L.; Supervision, Y.S.; Validation, F.L., Y.L. and Y.W.; Visualization, X.L., Y.C. and Y.W.; Writing—original draft, L.Z. (Lexin Zhang), K.C., L.Z. (Liping Zheng), X.L., F.L., Y.L., Y.C., Y.W., Y.S. and S.Y.; Writing—review and editing, Y.S. and S.Y. All authors have read and agreed to the published version of the manuscript.

Funding

This work was funded by the Research and Application of Industrial Technology System for Organic Agriculture in Yunnan Plateau (202202AE090029) and Yunnan Academician Expert Workstation (202305AF150142).

Data Availability Statement

The data presented in this study are available on request from the corresponding author.

Conflicts of Interest

The authors declare no conflicts of interest.

References

  1. Zhang, Y.; Wa, S.; Zhang, L.; Lv, C. Automatic plant disease detection based on tranvolution detection network with GAN modules using leaf images. Front. Plant Sci. 2022, 13, 875693. [Google Scholar] [CrossRef] [PubMed]
  2. Lin, X.; Wa, S.; Zhang, Y.; Ma, Q. A dilated segmentation network with the morphological correction method in farming area image Series. Remote Sens. 2022, 14, 1771. [Google Scholar] [CrossRef]
  3. Cusumano, A.; Harvey, J.A.; Bourne, M.E.; Poelman, E.H.; G de Boer, J. Exploiting chemical ecology to manage hyperparasitoids in biological control of arthropod pests. Pest Manag. Sci. 2020, 76, 432–443. [Google Scholar] [CrossRef] [PubMed]
  4. Bajwa, A.A.; Farooq, M.; Al-Sadi, A.M.; Nawaz, A.; Jabran, K.; Siddique, K.H. Impact of climate change on biology and management of wheat pests. Crop Prot. 2020, 137, 105304. [Google Scholar] [CrossRef]
  5. Balagawi, S.; Drew, R.A.; Clarke, A.R. Comparative demography of a specialist and generalist fruit fly: Implications for host use and pest management. Ann. Appl. Biol. 2023, 182, 295–311. [Google Scholar] [CrossRef]
  6. Muriithi, B.W.; Gathogo, N.G.; Diiro, G.M.; Mohamed, S.A.; Ekesi, S. Potential adoption of integrated pest management strategy for suppression of mango fruit flies in East Africa: An ex ante and ex post analysis in Ethiopia and Kenya. Agriculture 2020, 10, 278. [Google Scholar] [CrossRef]
  7. Wang, J.; Chen, Y.; Hou, X.; Wang, Y.; Zhou, L.; Chen, X. An intelligent identification system combining image and DNA sequence methods for fruit flies with economic importance (Diptera: Tephritidae). Pest Manag. Sci. 2021, 77, 3382–3395. [Google Scholar] [CrossRef]
  8. Lello, F.; Dida, M.; Mkiramweni, M.; Matiko, J.; Akol, R.; Nsabagwa, M.; Katumba, A. Fruit fly automatic detection and monitoring techniques: A review. Smart Agric. Technol. 2023, 5, 100294. [Google Scholar] [CrossRef]
  9. Arkin, E.; Yadikar, N.; Xu, X.; Aysa, A.; Ubul, K. A survey: Object detection methods from CNN to transformer. Multimed. Tools Appl. 2023, 82, 21353–21383. [Google Scholar] [CrossRef]
  10. Zhang, Y.; Wa, S.; Liu, Y.; Zhou, X.; Sun, P.; Ma, Q. High-accuracy detection of maize leaf diseases CNN based on multi-pathway activation function module. Remote Sens. 2021, 13, 4218. [Google Scholar] [CrossRef]
  11. Redmon, J.; Divvala, S.; Girshick, R.; Farhadi, A. You only look once: Unified, real-time object detection. In Proceedings of the IEEE Conference on Computer Vision and Pattern Recognition, Las Vegas, NV, USA, 27–30 June 2016; pp. 779–788. [Google Scholar]
  12. Ren, S.; He, K.; Girshick, R.; Sun, J. Faster R-CNN: Towards Real-Time Object Detection with Region Proposal Networks. IEEE Trans. Pattern Anal. Mach. Intell. 2017, 39, 1137–1149. [Google Scholar] [CrossRef]
  13. Han, T.; Sun, L.; Dong, Q. An Improved YOLO Model for Traffic Signs Small Target Image Detection. Appl. Sci. 2023, 13, 8754. [Google Scholar] [CrossRef]
  14. Freitas, L.; Martins, V.; de Aguiar, M.; de Brisolara, L.; Ferreira, P. Deep Learning Embedded into Smart Traps for Fruit Insect Pests Detection. ACM Trans. Intell. Syst. Technol. 2022, 14, 1–24. [Google Scholar] [CrossRef]
  15. Victoriano, M.; Oliveira, L.; Oliveira, H.P. Automated Detection and Identification of Olive Fruit Fly Using YOLOv7 Algorithm. In Proceedings of the Iberian Conference on Pattern Recognition and Image Analysis, Alicante, Spain, 27–30 June 2023; Springer: Berlin/Heidelberg, Germany, 2023; pp. 211–222. [Google Scholar]
  16. Vaswani, A.; Shazeer, N.; Parmar, N.; Uszkoreit, J.; Jones, L.; Gomez, A.N.; Kaiser, Ł.; Polosukhin, I. Attention is all you need. Adv. Neural Inf. Process. Syst. 2017, 30, 1–11. [Google Scholar]
  17. Tetko, I.V.; Karpov, P.; Van Deursen, R.; Godin, G. State-of-the-art augmented NLP transformer models for direct and single-step retrosynthesis. Nat. Commun. 2020, 11, 5575. [Google Scholar] [CrossRef] [PubMed]
  18. Adarsh, P.; Rathi, P.; Kumar, M. YOLO v3-Tiny: Object Detection and Recognition using one stage improved model. In Proceedings of the 2020 6th International Conference on Advanced Computing and Communication Systems (ICACCS), Coimbatore, India, 6–7 March 2020; pp. 687–694. [Google Scholar]
  19. Zhang, Y.; Yang, X.; Liu, Y.; Zhou, J.; Huang, Y.; Li, J.; Zhang, L.; Ma, Q. A time-series neural network for pig feeding behavior recognition and dangerous detection from videos. Comput. Electron. Agric. 2024, 218, 108710. [Google Scholar] [CrossRef]
  20. Zhang, Y.; Lv, C. TinySegformer: A lightweight visual segmentation model for real-time agricultural pest detection. Comput. Electron. Agric. 2024, 218, 108740. [Google Scholar] [CrossRef]
  21. Qi, F.; Chen, G.; Liu, J.; Tang, Z. End-to-end pest detection on an improved deformable DETR with multihead criss cross attention. Ecol. Inf. 2022, 72, 101902. [Google Scholar] [CrossRef]
  22. Li, H.; Li, S.; Yu, J.; Han, Y.; Dong, A. Plant disease and insect pest identification based on vision transformer. In Proceedings of the International Conference on Internet of Things and Machine Learning (IoTML 2021), Harbin, China, 16–18 December 2022; Volume 12174, pp. 194–201. [Google Scholar]
  23. Dai, M.; Dorjoy, M.M.H.; Miao, H.; Zhang, S. A New Pest Detection Method Based on Improved YOLOv5m. Insects 2023, 14, 54. [Google Scholar] [CrossRef]
  24. Jiang, P.; Ergu, D.; Liu, F.; Cai, Y.; Ma, B. A Review of Yolo algorithm developments. Procedia Comput. Sci. 2022, 199, 1066–1073. [Google Scholar] [CrossRef]
  25. Ahmad, T.; Ma, Y.; Yahya, M.; Ahmad, B.; Nazir, S.; Haq, A.u. Object detection through modified YOLO neural network. Sci. Program. 2020, 2020, 8403262. [Google Scholar] [CrossRef]
  26. Diwan, T.; Anirudh, G.; Tembhurne, J.V. Object detection using YOLO: Challenges, architectural successors, datasets and applications. Multimed. Tools Appl. 2023, 82, 9243–9275. [Google Scholar] [CrossRef]
  27. Hussain, M. YOLO-v1 to YOLO-v8, the Rise of YOLO and Its Complementary Nature toward Digital Manufacturing and Industrial Defect Detection. Machines 2023, 11, 677. [Google Scholar] [CrossRef]
  28. Redmon, J.; Farhadi, A. Yolov3: An incremental improvement. arXiv 2018, arXiv:1804.02767. [Google Scholar]
  29. Yang, L.; Chen, G.; Ci, W. Multiclass objects detection algorithm using DarkNet-53 and DenseNet for intelligent vehicles. EURASIP J. Adv. Signal Process. 2023, 2023, 85. [Google Scholar] [CrossRef]
  30. Gong, Y.; Yu, X.; Ding, Y.; Peng, X.; Zhao, J.; Han, Z. Effective fusion factor in FPN for tiny object detection. In Proceedings of the IEEE/CVF Winter Conference on Applications of Computer Vision, Virtual, 5–9 January 2021; pp. 1160–1168. [Google Scholar]
  31. Zheng, Z.; Wang, P.; Liu, W.; Li, J.; Ye, R.; Ren, D. Distance-IoU loss: Faster and better learning for bounding box regression. In Proceedings of the AAAI Conference on Artificial Intelligence, New York, NY, USA, 7–12 February 2020; Volume 34, pp. 12993–13000. [Google Scholar]
  32. Kang, D.; Lai, J.; Han, Y. Improving surface defect detection with context-guided asymmetric modulation networks and confidence-boosting loss. Expert Syst. Appl. 2023, 225, 120121. [Google Scholar] [CrossRef]
  33. Ridnik, T.; Ben-Baruch, E.; Zamir, N.; Noy, A.; Friedman, I.; Protter, M.; Zelnik-Manor, L. Asymmetric loss for multi-label classification. In Proceedings of the IEEE/CVF International Conference on Computer Vision, Virtual, 11–17 October 2021; pp. 82–91. [Google Scholar]
  34. Liu, M.; Wang, X.; Zhou, A.; Fu, X.; Ma, Y.; Piao, C. Uav-yolo: Small object detection on unmanned aerial vehicle perspective. Sensors 2020, 20, 2238. [Google Scholar] [CrossRef]
  35. Su, Y.; Li, D.; Chen, X. Lung nodule detection based on faster R-CNN framework. Comput. Methods Programs Biomed. 2021, 200, 105866. [Google Scholar] [CrossRef] [PubMed]
  36. Simonyan, K.; Zisserman, A. Very deep convolutional networks for large-scale image recognition. arXiv 2014, arXiv:1409.1556. [Google Scholar]
  37. He, K.; Zhang, X.; Ren, S.; Sun, J. Deep residual learning for image recognition. In Proceedings of the IEEE Conference on Computer Vision and Pattern Recognition, Las Vegas, NV, USA, 27–30 June 2016; pp. 770–778. [Google Scholar]
  38. Xu, X.; Zhao, M.; Shi, P.; Ren, R.; He, X.; Wei, X.; Yang, H. Crack detection and comparison study based on faster R-CNN and mask R-CNN. Sensors 2022, 22, 1215. [Google Scholar] [CrossRef] [PubMed]
  39. Qiao, L.; Zhao, Y.; Li, Z.; Qiu, X.; Wu, J.; Zhang, C. Defrcn: Decoupled faster r-cnn for few-shot object detection. In Proceedings of the IEEE/CVF International Conference on Computer Vision, Virtual, 11–17 October 2021; pp. 8681–8690. [Google Scholar]
  40. Xiao, Y.; Wang, X.; Zhang, P.; Meng, F.; Shao, F. Object detection based on faster R-CNN algorithm with skip pooling and fusion of contextual information. Sensors 2020, 20, 5490. [Google Scholar] [CrossRef]
  41. Xu, X.; Feng, Z.; Cao, C.; Li, M.; Wu, J.; Wu, Z.; Shang, Y.; Ye, S. An improved swin transformer-based model for remote sensing object detection and instance segmentation. Remote Sens. 2021, 13, 4779. [Google Scholar] [CrossRef]
  42. Graterol, W.; Diaz-Amado, J.; Cardinale, Y.; Dongo, I.; Lopes-Silva, E.; Santos-Libarino, C. Emotion detection for social robots based on NLP transformers and an emotion ontology. Sensors 2021, 21, 1322. [Google Scholar] [CrossRef] [PubMed]
  43. Zhang, Z.; Lu, X.; Cao, G.; Yang, Y.; Jiao, L.; Liu, F. ViT-YOLO: Transformer-based YOLO for object detection. In Proceedings of the IEEE/CVF international Conference on Computer Vision, Virtual, 11–17 October 2021; pp. 2799–2808. [Google Scholar]
  44. Carion, N.; Massa, F.; Synnaeve, G.; Usunier, N.; Kirillov, A.; Zagoruyko, S. End-to-end object detection with transformers. In Proceedings of the European Conference on Computer Vision, Glasgow, UK, 23–28 August 2020; Springer: Berlin/Heidelberg, Germany, 2020; pp. 213–229. [Google Scholar]
  45. Li, C.; Li, L.; Jiang, H.; Weng, K.; Geng, Y.; Li, L.; Ke, Z.; Li, Q.; Cheng, M.; Nie, W.; et al. YOLOv6: A single-stage object detection framework for industrial applications. arXiv 2022, arXiv:2209.02976. [Google Scholar]
  46. Talaat, F.M.; ZainEldin, H. An improved fire detection approach based on YOLO-v8 for smart cities. Neural Comput. Appl. 2023, 35, 20939–20954. [Google Scholar] [CrossRef]
  47. Lin, T.Y.; Goyal, P.; Girshick, R.; He, K.; Dollár, P. Focal loss for dense object detection. In Proceedings of the IEEE international Conference on Computer Vision, Venice, Italy, 22–29 October 2017; pp. 2980–2988. [Google Scholar]
  48. Jiang, D.; Li, G.; Tan, C.; Huang, L.; Sun, Y.; Kong, J. Semantic segmentation for multiscale target based on object recognition using the improved Faster-RCNN model. Future Gener. Comput. Syst. 2021, 123, 94–104. [Google Scholar] [CrossRef]
  49. Dai, Z.; Cai, B.; Lin, Y.; Chen, J. Up-detr: Unsupervised pre-training for object detection with transformers. In Proceedings of the IEEE/CVF Conference on Computer Vision and Pattern Recognition, Seattle, WA, USA, 14–19 June 2021; pp. 1601–1610. [Google Scholar]
Figure 1. Screenshot of dataset annotation by Labelimg.
Agriculture 14 00490 g001
Figure 2. Dataset Preprocessing. (A) is rotate_augmented; (B) is brightness_augmented; (C) is crop_ augmented; (D) is flipud_augmented; (E) is fliplr_augmented; (F) is contrast_augmented.
Agriculture 14 00490 g002
Figure 3. Illustration of the whole method proposed in this paper.
Agriculture 14 00490 g003
Figure 4. Schematic diagram of the step attention mechanism applied in the Transformer-based high-precision fruit fly adult identification model, illustrating the process by which the model refines target localization and enhances recognition precision by progressively adjusting the focus area of attention.
Agriculture 14 00490 g004
Figure 5. Detailed design diagram of the step attention mechanism, showing the process by which the input sequence is transformed into queries (Q), keys (K), and values (V) through the embedding layer and weight matrices, and how these elements generate the attention matrix (A) through self-attention computation, culminating in the production of the output sequence (Z).
Agriculture 14 00490 g005
Figure 6. Detection Results.
Agriculture 14 00490 g006
Figure 7. Detection result visualization. (A) is our method; (B) is DETR; (C) is YOLOv8; (D) is YOLOv6; (E) is RetinaDet; (F) is Faster-RCNN.
Agriculture 14 00490 g007
Table 1. Number of Images for Each Fruit Fly Species.
Fruit Fly SpeciesScientific NameFamily NameNumber of Images
Melon FlyBactrocera cucurbitaeTephritidae193
Mediterranean Fruit FlyCeratitis capitataTephritidae532
Mexican Fruit FlyAnastrepha ludensTephritidae419
Oriental Fruit FlyBactrocera dorsalisTephritidae374
Table 2. Fruit fly detection experiment results.
ModelPrecisionRecallAccuracyF1-Score
RetinaDet0.870.840.850.85
YOLOv60.890.860.870.87
Faster-RCNN0.910.880.890.89
YOLOv80.920.910.910.91
DETR0.940.930.930.93
Ours0.960.950.950.95
Table 3. Ablation study results for different loss functions.
ModelPrecisionRecallAccuracyF1-Score
Loss in YOLOv8 [46]0.920.910.910.91
Loss in DETR [49]0.940.930.930.93
Cross-loss0.960.950.950.95
Table 4. Ablation study results of different data augmentation methods. ✗ means not using these augmentation; ✓ means using these augmentation.
RotationBrightnessCroppingFlippingContrastP.R.Acc.F1-Score
0.850.820.830.84
0.910.880.900.90
0.890.900.890.90
0.920.930.920.93
0.860.850.850.86
0.870.850.860.86
0.960.950.950.95
Disclaimer/Publisher’s Note: The statements, opinions and data contained in all publications are solely those of the individual author(s) and contributor(s) and not of MDPI and/or the editor(s). MDPI and/or the editor(s) disclaim responsibility for any injury to people or property resulting from any ideas, methods, instructions or products referred to in the content.

