

Yield Gap Analysis of Super High-Yielding Rice (>15 t ha−1) in Two Ecological Regions
1
College of Agronomy, Hunan Agricultural University, Changsha 410128, China
2
State Key Laboratory of Hybrid Rice, Hunan Hybrid Rice Research Center, Changsha 410125, China
*
Author to whom correspondence should be addressed.
Agriculture 2024, 14(3), 491; https://doi.org/10.3390/agriculture14030491
Submission received: 9 February 2024
/
Revised: 10 March 2024
/
Accepted: 13 March 2024
/
Published: 18 March 2024
(This article belongs to the Special Issue Enhancing Yield and Quality in Conventional and New Crops: From Molecular Approaches to Agricultural Practices)
Abstract
:Super high-yielding rice (SHYR) (>15 t ha−1) plays a crucial role in global food production and security. We hypothesized that the external environment of different ecological regions could improve biomass accumulation in different periods and thus increase the rice yield. Two SHYR varieties, i.e., Xiangliangyou900 (XLY900) and Yliangyou900 (YLY900), were cultivated in the YONGSHENG and LONGHUI ecoregions, China. The results indicated that the average yield of the two SHYRs in the LONGHUI ecological region was 15.27–15.45 t ha−1 and 18.81–20.10 t ha−1 in YONGSHENG. The high grain yield in the YONGSHENG ecoregion was mainly due to the increased number of spikelets per panicle, crop growth rate, and total biomass during the transplanting–heading stage (TP-HS) and heading–maturity stage (HS-MS), and harvest index. The yield of SHYR was significantly correlated with external environment conditions, i.e., average minimum temperature, average daytime, and night-time temperature, and average daily temperature at the TP-HS, HS-MS, and transplanting–maturity (TP-MS) stages. The rice yield was significantly and positively correlated with the cumulative daily radiation. Therefore, it can be concluded that the final yield of super high-yield rice is closely related to the utilization of temperature and radiation resources during the growth process in the ecological environment.
1. Introduction
Rice (Oryza sativa L.) is an important cereal crop and is consumed as a staple food globally, particularly in Asia [1,2]. In China, rice production accounts for one-third of total grain production and plays a crucial role in ensuring national food security [3]. However, the area under rice cultivation in China has decreased over the past three decades [4]. Therefore, Chinese breeders and researchers are actively exploring ways to increase the yield potential of rice due to the increased pressure of population growth and the reduction in arable land area.
Rice yields in China have experienced two significant leaps over the past few decades. The first occurred in the 1950s due to the breeding of semidwarf varieties, and the second occurred in the 1970s with the development of hybrid varieties, resulting in a significant increase in yields. However, since 1990, rice production in China has faced stagnant yield issues for the developed crop varieties [5]. To overcome the stagnant yield issues, a super rice breeding program was launched in 1996 with the objective of producing super high-yielding rice varieties (SHYRs) [6]. In 1998, Professor Yuan Longping proposed a strategy for the development of super hybrid rice that combines the ideal-type approach with hybrid dominance [7]. The super rice breeding program has achieved significant results over the past 20 years [5,8,9]. Until 2019, 132 rice varieties had met the super rice variety standards with high yield potential and also made significant contributions to food production in recent decades [10].
Rice yield is not solely determined by a variety of characteristics but is also influenced by external environmental conditions and nitrogen fertilizer application [11]. Although rice yields of more than 15 t ha−1 have also been reported in China, such high yields have been recorded in only a few ecological regions such as Taoyuan, Yunnan Province and Xupu, Hunan Province [12,13,14]. Previously, Huang et al. [15] reported that external environmental factors play a more important role in determining rice yield. Katsura et al. [13] and Li et al. [16] reported that intense incident solar radiation, coupled with lower night-time temperatures, was the primary environmental factor for high yields of irrigated rice in Taoyuan. Jiang et al. [17] demonstrated that differences in total biomass among different experimental sites, i.e., Huaiji, Binyang, Haikou, Changsha, and Xingyi in China were mainly due to temperature and cumulative solar radiation-induced changes in the crop growth rate. Additionally, Jiang et al. [18] reported that the magnitude of the difference in seed yield between hybrid and autogamous rice varieties depends on the environment in which they are grown. Previous studies have primarily examined the response mechanisms of hybrid rice and autogamous lines to the environment at relatively high yield levels (>10 t ha−1 or 13.5 t ha−1); however, less attention has been paid to SHYR (>15 t ha−1). In addition, according to Jiang et al. [17], rice increased by more than 30% with high N application (220 kg ha−1) compared to zero N application. Therefore, it is crucial to investigate the effects of external environmental conditions and/or regional climate on SHYR to further improve the rice yield and productivity.
SHYR usually possesses a combination of superior traits including excellent grain quality traits and an efficient stress tolerance mechanism [19]. However, farmers are still facing some serious limitations regarding the cultivation and implementation of farm operations. Chen et al. [20] noted that there is a lag in the combination of super rice varieties and SHYR cultivation technology, resulting in a low yield. In addition, there are significant differences in the yields of super rice plants in different ecological regions, whereas the physiological mechanisms underlying its high yields are complex and difficult to elucidate, making it difficult to determine the high yield potential of super rice. Therefore, super rice has not yet been accepted by the majority of the farmers, and its yield potential has not been fully realized yet. We hypothesized that the external environment of different ecological regions could improve biomass accumulation in different growth periods and thus increase the rice yield. Therefore, understanding the effects of different ecological environments on the yield of SHYR and its underlying mechanisms is imperative to provide useful information for rice breeding and optimal management practices.
2. Materials and Methods
2.1. Experimental Details
The experiment was conducted at the Super Rice Research Base of Leifeng village, Yangguao Town, Longhui County, Hunan Province (110.92 N, 27.46 E) (LONGHUI) and Xingyi village, Chenghai Town, Yongsheng County, Lijiang City, Yunnan Province (100.66 N, 26.64 E) (YONGSHENG) during the summers of 2020 and 2021. Both regions are ecologically suitable for rice cultivation. The study involved two super high-yielding rice varieties (SHYRs), Y Liangyou 900 (Y58S × R900, YLY-900), which achieved a representative yield of 15 t ha−1 and represented the first super hybrid rice that reached phase IV in China, and Xiangliangyou 900 (Guangxiang24S × R900, XLY-900), which yielded 17.28 t ha−1 in Gejiu city of Honghe Prefecture in Yunnan Province during 2018. All the rice varieties were provided by the Hunan Hybrid Rice Center, China.
The seeds were sown in rice fields that were kept fallow during winter. The physicochemical properties of the soil are presented in Table S1. The two rice varieties were planted in accordance with a randomized complete block design with four replications, with each plot having a size of 96 m2 (12 m × 8 m). Thirty-day-old plants were transplanted at row and column distances of 33.33 cm and 16 cm, respectively. The experiment involved manually transplanting two plants per hill to ensure uniform stand establishment. Fertilizers, i.e., urea (N, 46%), superphosphate (P2O5, 12%), and potassium chloride (K2O, 60%), were applied at 300 kg N ha−1, 150 kg P ha−1, and 360 kg K ha−1, respectively. The ratio of the amount of fertilizer used for basal, tillering, and panicle initiation was 4:2:4.
Meteorological data were collected during the rice reproductive season through a Decagon Micrometeorological Monitoring System (Model EM50, Decagon Corporation, Pullman, WA, USA) (Figure S1). The records included average daily values for photosynthetically active radiation (PAR), daily temperature as well as average minimum temperature, average daytime temperature, average night temperature, and average temperature at transplanting (TP) to full heading (HS), HS to maturity (MS), and TP to MS to measure biomass.
Ten rice hills from each treatment were sampled at the TP, HS, and MS stages to measure biomass. The plants were first placed in an oven at 105 °C for 30 min, and then at 80 °C until a constant weight was reached. The durations of growth from TP to HS and from HS to MS were subsequently recorded, and the crop growth rate (CGR) was calculated.
At MS, 30 panicles from each plot were evaluated before harvesting to estimate the number of effective panicles. Ten plants were chosen at random from each plot, including their spikelet per panicle, seed-setting rate, and 1000-grain weight. Ten plants were selected from each treatment, the panicles were then threshed and stored in bags, and the remaining straw was sun-dried and weighed to calculate the harvest index. All the rice plants from a 20 m2 area within the center of each yield plot were harvested, and the final grain yield was calculated assuming ≈ 13.5% moisture content.
Total spikelets = Effective panicle number × Spikelets per panicle
Sink capacity = Total spikelets × 1000-grain weight
HI = grain yield/total biomass
2.2. Data Analyses
The data were analyzed using analysis of variance (ANOVA) with SPSS 19.0 software (SPSS, Inc., Chicago, IL, USA). The least significant difference (LSD) test at a probability level of 0.05 was used to separate the differences among the treatment means of each trial. All images were generated by using Origin 9.0 (OriginLab Corp., Northampton, MA, USA).
3. Results
3.1. Grain Yield and Yield Components of Super High-Yielding Rice in Two Ecological Regions
The impact of location, year, variety, and their interaction on 1000-grain weight was significant. The impact of location, year, variety, and their interaction on 1000-grain weight was significant or highly significant, except for the insignificant effect of the interaction of year and variety. In 2020 and 2021, the average grain yields of the two SHYRs in the YONGSHENG ecoregion were 27.89% and 22.75% greater than those in the LONGHUI ecoregion, respectively, whereas the number of spikelets per panicle on the two SHYRs in the YONGSHENG ecoregion was significantly greater than that in the LONGHUI ecoregion by 18.00% and 16.87% in 2020 and 2021, respectively. However, the effective panicle number and grain-filling rate were found statistically similar for both regions in either year (Table 1).
3.2. Total Biomass and Harvest Indices of Super High-Yielding Rice in Two Ecological Regions
The impact of location, year, variety, and their interaction on total biomass and harvest index was not significant, except for the significant effect of location factor. The total biomass at MS and harvest indices of the two SHYRs in the LONGHUI ecoregion were 2418.00–2500.20 g m−2 and 57.60–60.00% in 2020 and 2021, respectively, (Table 2). In comparison, the total biomass at MS and the harvest index of SHYR in YONGSHENG were 2803.60–2846 g m−2 and 63.00–64.4% in 2020 and 2021, respectively, which were 15.86–14.72% and 8.35–9.27% greater than those in the LONGHUI ecoregion.
3.3. Climatic Factors of Super High-Yielding Rice Plants in Two Ecological Regions
In 2020 and 2021, the growth duration of two SHYRs in the YONGSHENG ecoregion exceeded that in the LONGHUI ecoregion by an average of 20 and 11.5 days, 6 and 4.5 days, and 26 and 16 days during the TP-HS, HS-MS, and TP-MS, respectively. In 2020 and 2021, the average maximum temperature in the YONGSHENG ecoregion was 1.21 °C and 0.26 °C lower than that in the LONGHUI ecoregion for both SHYRs during the TP-HS. In 2020 and 2021, the average minimum temperature in YONGSHENG during the TP-HS, HS-MS, and TP-MS was lower than that in the LONGHUI ecological area by 3.36 °C and 0.94 °C, 2.30 °C and 3.69 °C, and 2.83 and 2.32 °C, respectively (Table 3).
In 2021, the average daytime temperatures of the two SHYRs in the YONGSHENG ecoregion were lower than those in LONGHUI during the TP-HS, HS-MS, and TP-MS. In 2020 and 2021, the average night temperature of YONGSHENG during the TP-HS, HS-MS, and TP-MS was lower than that in LONGHUI by 2.05 °C and 0.51 °C, 1.83 °C and 3.51 °C, and 1.95 °C and 2.02 °C, respectively. Additionally, the average temperatures during the TP-HS, HS-MS, and TP-MS for both SHYRs in 2020 and 2021 were lower in the YONGSHENG ecoregion than those in the LONGHUI ecoregion (Table 4).
In addition, during the TP-HS, HS-MS, and TP-MS, the cumulative daily radiation of two SHYRs in the YONGSHENG ecozone exceeded that in the LONGHUI ecozone in both years. Specifically, in 2020 and 2021, the average cumulative daily radiation in the YONGSHENG ecoregion was 17.83%, 17.65%, and 15.34% greater than that in the LONGHUI ecoregion during the TP-HS, HS-MS, and TP-MS, respectively (Table 5).
3.4. Biomass Production and CGR of Super High-Yielding Rice in Two Ecological Regions
At the TP-HS, the biomass accumulation in the two SHYRs in the YONGSHENG ecoregion was significantly greater than that in the LONGHUI ecoregion in 2020 and 2021. Specifically, the biomass accumulation in the YONGSHENG ecoregion exceeded that in the LONGHUI ecoregion by an average of 11.32% and 11.65%, respectively, during the TP-HS. However, in 2020, the CGR of both SHYRs during the TP-HS was similar for both the LONGHUI and YONGSHENG ecoregions. Nonetheless, in 2021, the CGR of both SHYRs during the TP-HS stage was significantly greater in the YONGSHENG than in the LONGHUI ecoregion (Figure 1).
During the HS-MS, the biomass accumulation was significantly greater in YONGSHENG than in the LONGHUI ecoregion for both SHYRs in both years. For instance, during 2020 and 2021, the biomass accumulation in both SHYRs on average exceeded that in the LONGHUI ecoregion by 23.23% and 19.95%, respectively, during the HS-MS. Additionally, during 2020 and 2021, the CGR of both SHYRs during the HS-MS in YONGSHENG was significantly greater than that in the LONGHUI ecoregion (Figure 2).
3.5. Climatic Factors and Their Relationship with Grain Yield
The correlation between the average daytime temperature at the TP-MS (R2 = 0.84) was higher than that at the TP-HS (R2 = 0.60) and HS-MS (R2 = 0.56). Furthermore, the correlation between the average daytime temperature and the HS-MS (R2 = 0.78) was stronger than that between the average daytime temperature and the TP-HS (R2 = 0.42). The average temperature was also higher during the HS-MS (R2 = 0.61) than during the TP-HS (R2 = 0.51). At the TP-HS, the average night temperature (R2 = 0.93) and average temperature (R2 = 0.90) were the highest, in contrast to those at the TP-HS and HS-MS (Figure S2).
The correlation was stronger for the average minimum temperature at the HS-MS (R2 = 0.87) than at the TP-HS (R2 = 0.71). The highest coefficient value (R2 = 0.97) was observed for the average minimum temperature (R2 = 0.97) during the TP-MS, compared to that of the TP-HS and HS-MS. However, the rice yield was not correlated with the average maximum temperature during the TP-HS and HS-MS, but it became significantly correlated with the average maximum temperature during the TP-MS (Figure S3).
Additionally, the rice yield was significantly and positively correlated with cumulative daily radiation at the TP-HS, HS-MS, and TP-MS (p < 0.01), whereas the cumulative daily radiation was greater during the TP-HS (R2 = 0.92) than during the TP-HS and HS-MS (Figure S4).
4. Discussion
This study indicates that optimal environmental conditions are crucial for achieving the full potential of super rice. Previous research on rice growth and yield has primarily examined the average temperature [21,22,23]. However, recent studies have revealed that the effects of average maximum daytime and average minimum night temperatures on physiological processes in rice differ [24]. Crop yield is more sensitive to changes in average night temperature [25]. According to Peng et al. [26], under optimal growth conditions, an increase of 1 °C in minimum nighttime temperature results in a 10% decrease in rice yield. Our results indicated that during the grain-filling period, the average maximum and minimum temperatures in YONGSHENG were 2.17 °C and 3.0 °C lower than those in LONGHUI, respectively. This suggests that low temperatures during the filling period are key climatic factors that can help increase the yield of the SHYR. These results are also in line with Jiang et al. [17], who reported a strong linear negative correlation between grain yield and the average maximum and minimum temperatures during the grain-filling period, whereas Kong et al. [27] reported that high temperature during post-heading or early filling stage enhanced the spikelet sterility in rice. Our results showed that the temperature was always within the optimum range at the HS-MS, which is conducive to improved grain yield. Higher night temperatures can reduce the photosynthetic rate in different ways, including a reduction in the enzyme activity associated with photosynthesis and also leading to chlorophyll degradation [28,29]. In addition, high night temperature also affects the nitrogen composition with an increase in respiration rate, resulting in reduced photo-assimilation and ultimately crop yield [28].
Furthermore, Jiang et al. [17] reported that high average daytime temperatures and low average night temperatures are a result of intense cumulative daily radiation, which has a positive impact on both grain yield and quality. The present study indicated that the cumulative daily radiation during the TP-HS, HS-MS, and TP-MS was higher in YONGSHENG than in LONGHUI, respectively. Similarly, Peng et al. [26] revealed a positive correlation between grain yield and cumulative daily radiation with 54% of the variation in grain yield attributed to cumulative daily radiation. In addition, under optimal growing conditions, rice yield can increase by 10% with an increase in cumulative daily radiation of 21.5 MJ−2 [26]. Our results support the correlation between average daily cumulative solar radiation and yield as a significant and positive correlation was found during all growth periods. Furthermore, we observed a 10% increase in the yield of SHYR for each 21.69 MJ m−2 increase in cumulative daily radiation at the TP-MS. Intense solar radiation in YONGSHENG is favorable for tillering during the vegetative stage that improves the photosynthetic efficiency and leads to higher accumulation and translocation of photosynthates during the grain-filling period. As a result, greater biomass and N accumulation can occur [16]. Adequate local sunshine and long growing days can extend the growing periods of rice plants, thus improving the assimilate partitioning and dry matter accumulation. Furthermore, light quality, especially light with short wavelengths, promotes the development of productive tillers, increases the chlorophyll content, improves stress tolerance, and enhances protein accumulation, thus resulting in high yield in rice [20].
Furthermore, the present study suggested that the lower rice yield of LONGHUI was due to the presence of fewer sinks, specifically small spikelets per panicle. This difference was caused by relatively small differences in the number of effective panicles, seed setting rate, and 1000-grain weight, which resulted in a reduced number of spikelets per panicle. Previous studies have reported the importance of sinks in improving grain yield [30,31]. Although the seed setting rate in LONGHUI was consistently higher than that in YONGSHENG, it is noteworthy to mention that SHYRs in YONGSHENG had a greater sink capacity than LONGHUI. This difference may be attributed to the lower night-time temperatures during the grain-filling period and higher daily cumulative solar radiation in the YONGSHENG. The results showed that higher average night temperatures reduced the translocation of assimilates to seeds during grain filling, which is consistent with the findings of Kobata et al. [32]. Additionally, the results showed a significant and positive correlation between the reduced average night temperature during the TP-MS and rice yield. However, no significant differences in the 1000-grain weight were noted among the SHYR varieties in each region. The result was not in accordance with Huang et al. [33], who suggested that increased rice yield is attributed to the enhancement in 1000-grain weight, and that the grain weight of hybrid varieties was 23% higher than that of self-inherited lines. However, Zhang et al. [30] and Bueno and Lafarge [34] reported no consistent difference in grain weight among the hybrid and self-inherited rice varieties. Breeding rice varieties for high grain weight may be a viable way to achieve high yields in rice. Therefore, for the continued improvement in yields in SHYRs (>15 t ha−1), attention should be given to the simultaneous improvement in the source–sink relationship and grain-filling rate.
The difference in total biomass and harvest indices could explain the difference in yield between YONGSHENG and LONGHUI. The duration of HS-MS growth and the CGR was higher in the YONGSHENG ecoregion than in the LONGHUI ecoregion due to the better environmental conditions and radiation interception. These findings are inconsistent with Song et al. [35] and Horie et al. [36], who reported that further increases in rice yield may be attributed to an increase in total biomass rather than an increase in the harvest index. The study discovered that increasing biomass in super high-yielding rice can boost yield, but there is still significant potential for improvement in the harvest index. Typically, the harvest index is around 0.5 under normal yield [17]. However, in this study, the harvest index was already above 0.58 at 15 t ha−1 (LONGHUI) and above 0.63 at 18 t ha−1 (YONGSHENG). To achieve a super high yield, it is essential to have a synergistic increase in both high biomass and high harvest index. This can be achieved by increasing the rate of material translocation. Furthermore, rice yield is determined by biomass accumulation after heading and translocation and assimilate partitioning at heading to the seed formation stage [37]. According to Laza et al. [38], efficient translocation of prestored reserves should be emphasized rather than biomass accumulation during ripening vegetation. The biomass of both SHYRs was higher at the TP-HS and HS-MS in the YONGSHENG ecoregion than that in LONGHUI. In summary, the accumulation of biomass before and after heading is crucial for rice yield improvement; however, to achieve super high yields, the focus should be on increasing the biomass yield during the post-heading stage. Moreover, high dry matter accumulation under a higher temperature than the critical range is associated with improved yield and stress tolerance ability in rice [39]. Generally, dry matter accumulation is the basis for high rice yields [20]. Moreover, the CGR refers to the average daily biomass, reflecting the apparent photosynthetic efficiency of the plants per unit area [17]. The results indicated that the CGR of both SHYRs in YONGSHENG was higher than that in LONGHUI during the TP-HS and HS-MS. In YONGSHENG, the increased yield of SHYRs was mainly due to the high CGR from TP-HS and HS-MS and the long growth duration of HS-MS. Therefore, prolonging the duration of the growth period, especially ‘HS-MS’, and improving the CGR via TP-MS would be beneficial for further grain yield improvement of SHYRs.
5. Conclusions
In both years, the average grain yield of the two SHYRs in the YONGSHENG ecoregion was significantly greater than that in the LONGHUI ecoregion. Higher yield in the YONGSHENG ecoregion was mainly due to the higher number of spikelets per panicle, total biomass at maturity, and harvest index. The external environment conditions, i.e., average minimum temperature, average daytime and night-time temperature, and average daily temperature during the transplanting–heading, heading–maturity, and transplanting–maturity stages were lower than those in LONGHUI. Moreover, the cumulative daily radiation in YONGSHENG was higher than that in LONGHUI. The favorable climatic conditions in the YONGSHENG ecoregion resulted in higher total biomass accumulation during the transplanting–heading stage and heading-to-maturity stage in both SHYRs. Therefore, optimal environmental conditions are essential for grain yield improvement of SHYRs.
Supplementary Materials
The following supporting information can be downloaded at: https://www.mdpi.com/article/10.3390/agriculture14030491/s1, Figure S1: Maximum temperature, minimum temperature, and solar radiation from transplantation to maturity in 2020 and 2021 in YONGSHENG (A and B) and LONGHUI (C and D), China; Figure S2: Relationships of grain yield with average daytime temperature, average night temperature, average temperature from transplanting to heading (A, D, and G), from heading to maturity (B, E, and H), and from transplanting to maturity (C, F, and I); Figure S3: Relationships of grain yield with the average maximum temperature and average minimum temperature from transplanting to heading (A and D), from heading to maturity (B and E), and from transplanting to maturity (C and F); Figure S4: Relationships of grain yield with accumulative solar radiation from transplanting to heading (A), from heading to maturity (B), and from transplanting to maturity (C); Table S1: Physical and chemical properties of the soil.
Author Contributions
Z.W., Y.Z. and W.J. designed the study; Z.W., Y.Z. and W.J. collected and analyzed the data; Z.W., Y.Z. and W.J. wrote the manuscript. All authors have read and agreed to the published version of the manuscript.
Funding
The research was supported by the Science and Technology Innovation Fund of Hunan Hybrid Rice Research Center (ZD201905), an Open project of the State Key Laboratory of hybrid rice (2020KF01).
Institutional Review Board Statement
Not applicable.
Data Availability Statement
The data presented in this study are available on request from the corresponding author.
Acknowledgments
The authors also would like to express their appreciation to all students and staff for their contributions to the execution of this research.
Conflicts of Interest
The authors declare that they have no known competing financial interests or personal relationships that could have appeared to influence the work reported in this paper.
Abbreviations
SHYR: Super high-yielding rice; TP-HS: transplanting–heading stage; HS-MS: heading–maturity stage; TP-MS: transplanting–maturity stage; XLY900: Xiangliangyou900; YLY900: Yliangyou900; CGR: crop growth rate.
References
- Zhang, W.; Cao, G.; Li, X.; Zhang, H.; Wang, C.; Liu, Q.; Chen, X.; Cui, Z.; Shen, J.; Jiang, R.; et al. Closing yield gaps in China by empowering smallholder farmers. Nature 2016, 537, 671–674. [Google Scholar] [CrossRef]
- Li, L.; He, L.; Li, Y.; Wang, Y.; Ashraf, U.; Hamoud, Y.A.; Hu, X.; Wu, T.; Tang, X.; Pan, S. Deep fertilization combined with straw incorporation improved rice lodging resistance and soil properties of paddy fields. Eur. J. Agron. 2023, 142, 126659. [Google Scholar] [CrossRef]
- Deng, N.; Grassini, P.; Yang, H.; Huang, J.; Cassman, K.G.; Peng, S. Closing yield gaps for rice self-sufciency in China. Nat. Commun. 2019, 10, 1725. [Google Scholar] [CrossRef] [PubMed]
- Huang, M. The decreasing area of hybrid rice production in China: Causes and potential effects on Chinese rice self-sufficiency. Food Secur. 2022, 14, 267–272. [Google Scholar] [CrossRef]
- Cheng, S.; Cao, L.; Zhuang, J.; Chen, S.; Zhan, X.; Fan, Y.; Zhu, D.; Min, S. Super hybrid rice breeding in China: Achievements and prospects. J. Integr. Plant Biol. 2007, 49, 805–810. [Google Scholar] [CrossRef]
- Cheng, S.; Liao, X.; Min, S. China’s “super”rice research: Background, goals and issues. China Rice 1998, 1, 3–5. [Google Scholar]
- Yuan, L.P. Breeding of super hybrid rice. In Rice Research for Food Security and Poverty Alleviation; Peng, S.B., Hardy, B., Eds.; International Rice Research Institue: Los Baños, Philippines, 2001; pp. 143–149. [Google Scholar]
- Peng, S.; Khush, G.S.; Virk, P.; Tang, Q.; Zou, Y. Progress in ideotype breeding to increase rice yield potential. Field Crops Res. 2008, 108, 32–38. [Google Scholar] [CrossRef]
- Yuan, L.P. Development of hybrid rice to ensure food security. Rice Sci. 2014, 21, 1–2. [Google Scholar] [CrossRef]
- Yuan, L. Progress in superhybrid rice breeding. Crops J. 2017, 5, 100–102. [Google Scholar] [CrossRef]
- Zou, Y.; Zhou, S.; Tang, Q. Status and prospect of high yielding cultivation studies on China super hybrid rice. J. Hunan Agric. Univ. 2003, 29, 78–84. (In Chinese) [Google Scholar]
- Ying, J.; Peng, S.; He, Q.; Yang, H.; Yang, C.; Visperas, R.M.; Cassman, K.G. Comparison of high-yield rice in tropical and subtropical environments: I. Determinants of grain and dry matter yields. Field Crops Res. 1998, 57, 71–84. [Google Scholar] [CrossRef]
- Katsura, K.; Maeda, S.; Lubis, I.; Horie, T.; Cao, W.; Shiraiwa, T. The high yield of irrigated rice in Yunnan, China—‘A cross-location analysis’. Field Crops Res. 2008, 107, 1–11. [Google Scholar] [CrossRef]
- Yuan, L. Development of super hybrid rice for food security in China. Engineering 2015, 1, 13–14. [Google Scholar] [CrossRef]
- Huang, M.; Jiang, L.; Xia, B.; Zou, Y.; Jiang, P.; Ao, H. Yield gap analysis of super hybrid rice between two subtropical environments. Aust. J. Crop Sci. 2013, 7, 600–608. [Google Scholar]
- Li, G.; Xue, L.; Gu, W.; Yang, C.; Wang, S.; Ling, Q.; Qin, X.; Ding, Y. Comparison of yield components and plant type characteristics of high-yield rice between Taoyuan, a ‘special eco-site’ and Nanjing, China. Field Crops Res. 2009, 112, 214–221. [Google Scholar] [CrossRef]
- Jiang, P.; Xie, X.; Huang, M.; Zhou, X.; Zhang, R.; Chen, J.; Wu, D.; Xia, B.; Xiong, H.; Xu, F.; et al. Potential yield increase of hybrid rice at five locations in southern China. Rice 2016, 9, 11. [Google Scholar] [CrossRef]
- Jiang, P.; Xie, X.B.; Huang, M.; Zhou, X.F.; Zhang, R.C.; Chen, J.N.; Wu, D.D.; Xia, B.; Xu, F.X.; Xiong, H.; et al. Comparisons of yield performance and nitrogen response between hybrid and inbred rice under difference ecological conditions in south China. J. Integr. Agric. 2015, 14, 1283–1294. [Google Scholar] [CrossRef]
- Chen, Z.; Yang, X.; Song, W.; Khan, A.; Najeeb, U.; Li, P.; Cao, C. Water-saving cultivation plus super rice hybrid genotype improves water productivity and yield. Agron. J. 2020, 112, 1764–1777. [Google Scholar] [CrossRef]
- Chen, T.; Yang, X.; Fu, W.; Li, G.; Feng, B.; Fu, G.; Tao, L. Strengthened Assimilate Transport Improves Yield and Quality of Super Rice. Agronomy 2022, 12, 753. [Google Scholar] [CrossRef]
- Nagarajan, S.; Jagadish, S.V.K.; Prasad, A.H.; Thomar, A.K.; Anand, A.; Pal, M.; Agarwal, P.K. Local climate affects growth, yield and grain quality of aromatic and nonaromatic rice in northwestern India. Agric. Ecosyst. Environ. 2010, 138, 274–281. [Google Scholar] [CrossRef]
- Sheehy, J.E.; Mitchell, P.L.; Ferrer, A.B. Decreases in rice grain yields with temperature: Models and correlations can yield different estimates. Field Crops Res. 2006, 98, 151–156. [Google Scholar] [CrossRef]
- Chang, S.; Chang, T.; Song, Q. Architectural and Physiological Features to Gain High Yield in an Elite Rice Line YLY1. Rice 2020, 13, 60. [Google Scholar] [CrossRef]
- Welch, J.R.; Vincent, J.R.; Auffhammer, M. Rice yields in tropical/subtropical Asia exhibit large but opposing sensitivities to minimum and maximum temperatures. Proc. Natl. Acad. Sci. USA 2010, 107, 14562–14567. [Google Scholar] [CrossRef] [PubMed]
- Kanno, K.; Makino, A. Increased grain yield and biomass allocation in rice under cool night temperature. Soil Sci. Plant Nutr. 2010, 56, 412–417. [Google Scholar] [CrossRef]
- Peng, S.; Huang, J.; Sheehy, J.E.; Laza, R.C.; Visperas, R.M.; Zhong, X.; Centeno, G.S.; Khush, G.S.; Cassman, K.G. Rice yields decline with higher night temperature from global warming. Proc. Natl. Acad. Sci. USA 2004, 101, 9971–9975. [Google Scholar] [CrossRef] [PubMed]
- Kong, L.; Ashraf, U.; Cheng, S.; Rao, G.; Mo, Z.; Tian, H.; Pan, S.; Tang, X. Short-term water management at early filling stage improves early-season rice performance under high temperature stress in South China. Eur. J. Agron. 2017, 90, 117–126. [Google Scholar] [CrossRef]
- Mohammed, A.R.; Tarpley, L. High nighttime temperatures affect rice productivity through altered pollen germination and spikelet fertility. Agric. For. Meteorol. 2009, 149, 999–1008. [Google Scholar] [CrossRef]
- Guo, Y.P.; Zhou, H.F.; Zhang, L.C. Photosynthetic characteristics and protective mechanism against photooxidation during high temperature stress in two citrus species. Sci. Hortic. 2006, 108, 260–267. [Google Scholar] [CrossRef]
- Zhang, Y.; Tang, Q.; Zou, Y.; Li, D.; Qin, J.; Yang, S.; Chen, L.; Xia, B.; Peng, S. Yield potential and radiation use efficiency of “super” hybrid rice grown under subtropical conditions. Field Crops Res. 2009, 114, 91–98. [Google Scholar] [CrossRef]
- Ibrahim, M.; Peng, S.B.; Tang, Q.Y.; Huang, M.; Jiang, P.; Zou, Y.B. Comparison of yield and growth behaviors of hybrid rice under different nitrogen management methods in tropical and subtropical environments. J. Integr. Agric. 2013, 12, 621–629. [Google Scholar] [CrossRef]
- Kobata, T.; Nagano, T.; Ida, K. Critical factors for grain filling in low grain ripening rice cultivars. Agron. J. 2006, 98, 536–544. [Google Scholar] [CrossRef]
- Huang, M.; Xia, B.; Zou, Y.B.; Jiang, P.; Shi, W.J.; Hongthong, P.; Xie, X.B. Improvement in super hybrid rice: A comparative study between super hybrid and inbred varieties. Res. Crops 2012, 13, 1–10. [Google Scholar]
- Bueno, C.S.; Lafarge, T. Higher crop performance of hybrids than of elite inbreds in the tropics: 1. Hybrids accumulate more biomass during each phenological phase. Field Crops Res. 2009, 112, 229–237. [Google Scholar] [CrossRef]
- Song, X.F.; Agata, W.; Kawamitsu, Y. Studies on dry matter and grain production of F1 hybrid rice in China: I Characteristics of dry matter production. Jpn. J. Crop Sci. 1990, 59, 19–28. [Google Scholar] [CrossRef]
- Horie, T.; Ohnishi, O.; Angus, J.F.; Lewin, L.G.; Tsukaguchi, T.; Matano, T. Physiological characteristics of high–yielding rice inferred from cross–location experiments. Field Crops Res. 1997, 52, 56–67. [Google Scholar] [CrossRef]
- Yang, W.; Peng, S.; Laza, R.C.; Visperas, R.M.; Dionisio-Sese, M.L. Yield gap analysis between dry and wet season rice crop grown under high–yielding management conditions. Agron. J. 2008, 100, 1390–1395. [Google Scholar] [CrossRef]
- Laza, R.C.; Peng, S.B.; Akita, S.; Saka, H. Contribution of biomass partitioning and translocation of grain yield under sub–optimum growing conditions in irrigated rice. Plant Prod. Sci. 2003, 6, 28–35. [Google Scholar] [CrossRef]
- Deng, H.; Wang, X.; Deng, S. Silicon (Si) Application Improved the Antioxidant Response and Grain Yield Formation in rice Under High Temperature Conditions. Silicon 2023, 15, 4375–4385. [Google Scholar] [CrossRef]
Figure 1.
Biomass accumulation from transplanting to full heading (A,B) and crop growth rate (CGR) (C,D) during the growing seasons of two rice cultivars in two ecological regions in 2020 and 2021. The different lowercase letters indicate significant differences (p < 0.05) between the two rice varieties. The different capital letters indicate significant differences (p < 0.05) between the YONGSHENG and LONGHUI ecological regions. XLY-900, Xiangliangyou900; YLY-900, Yliangyou900.
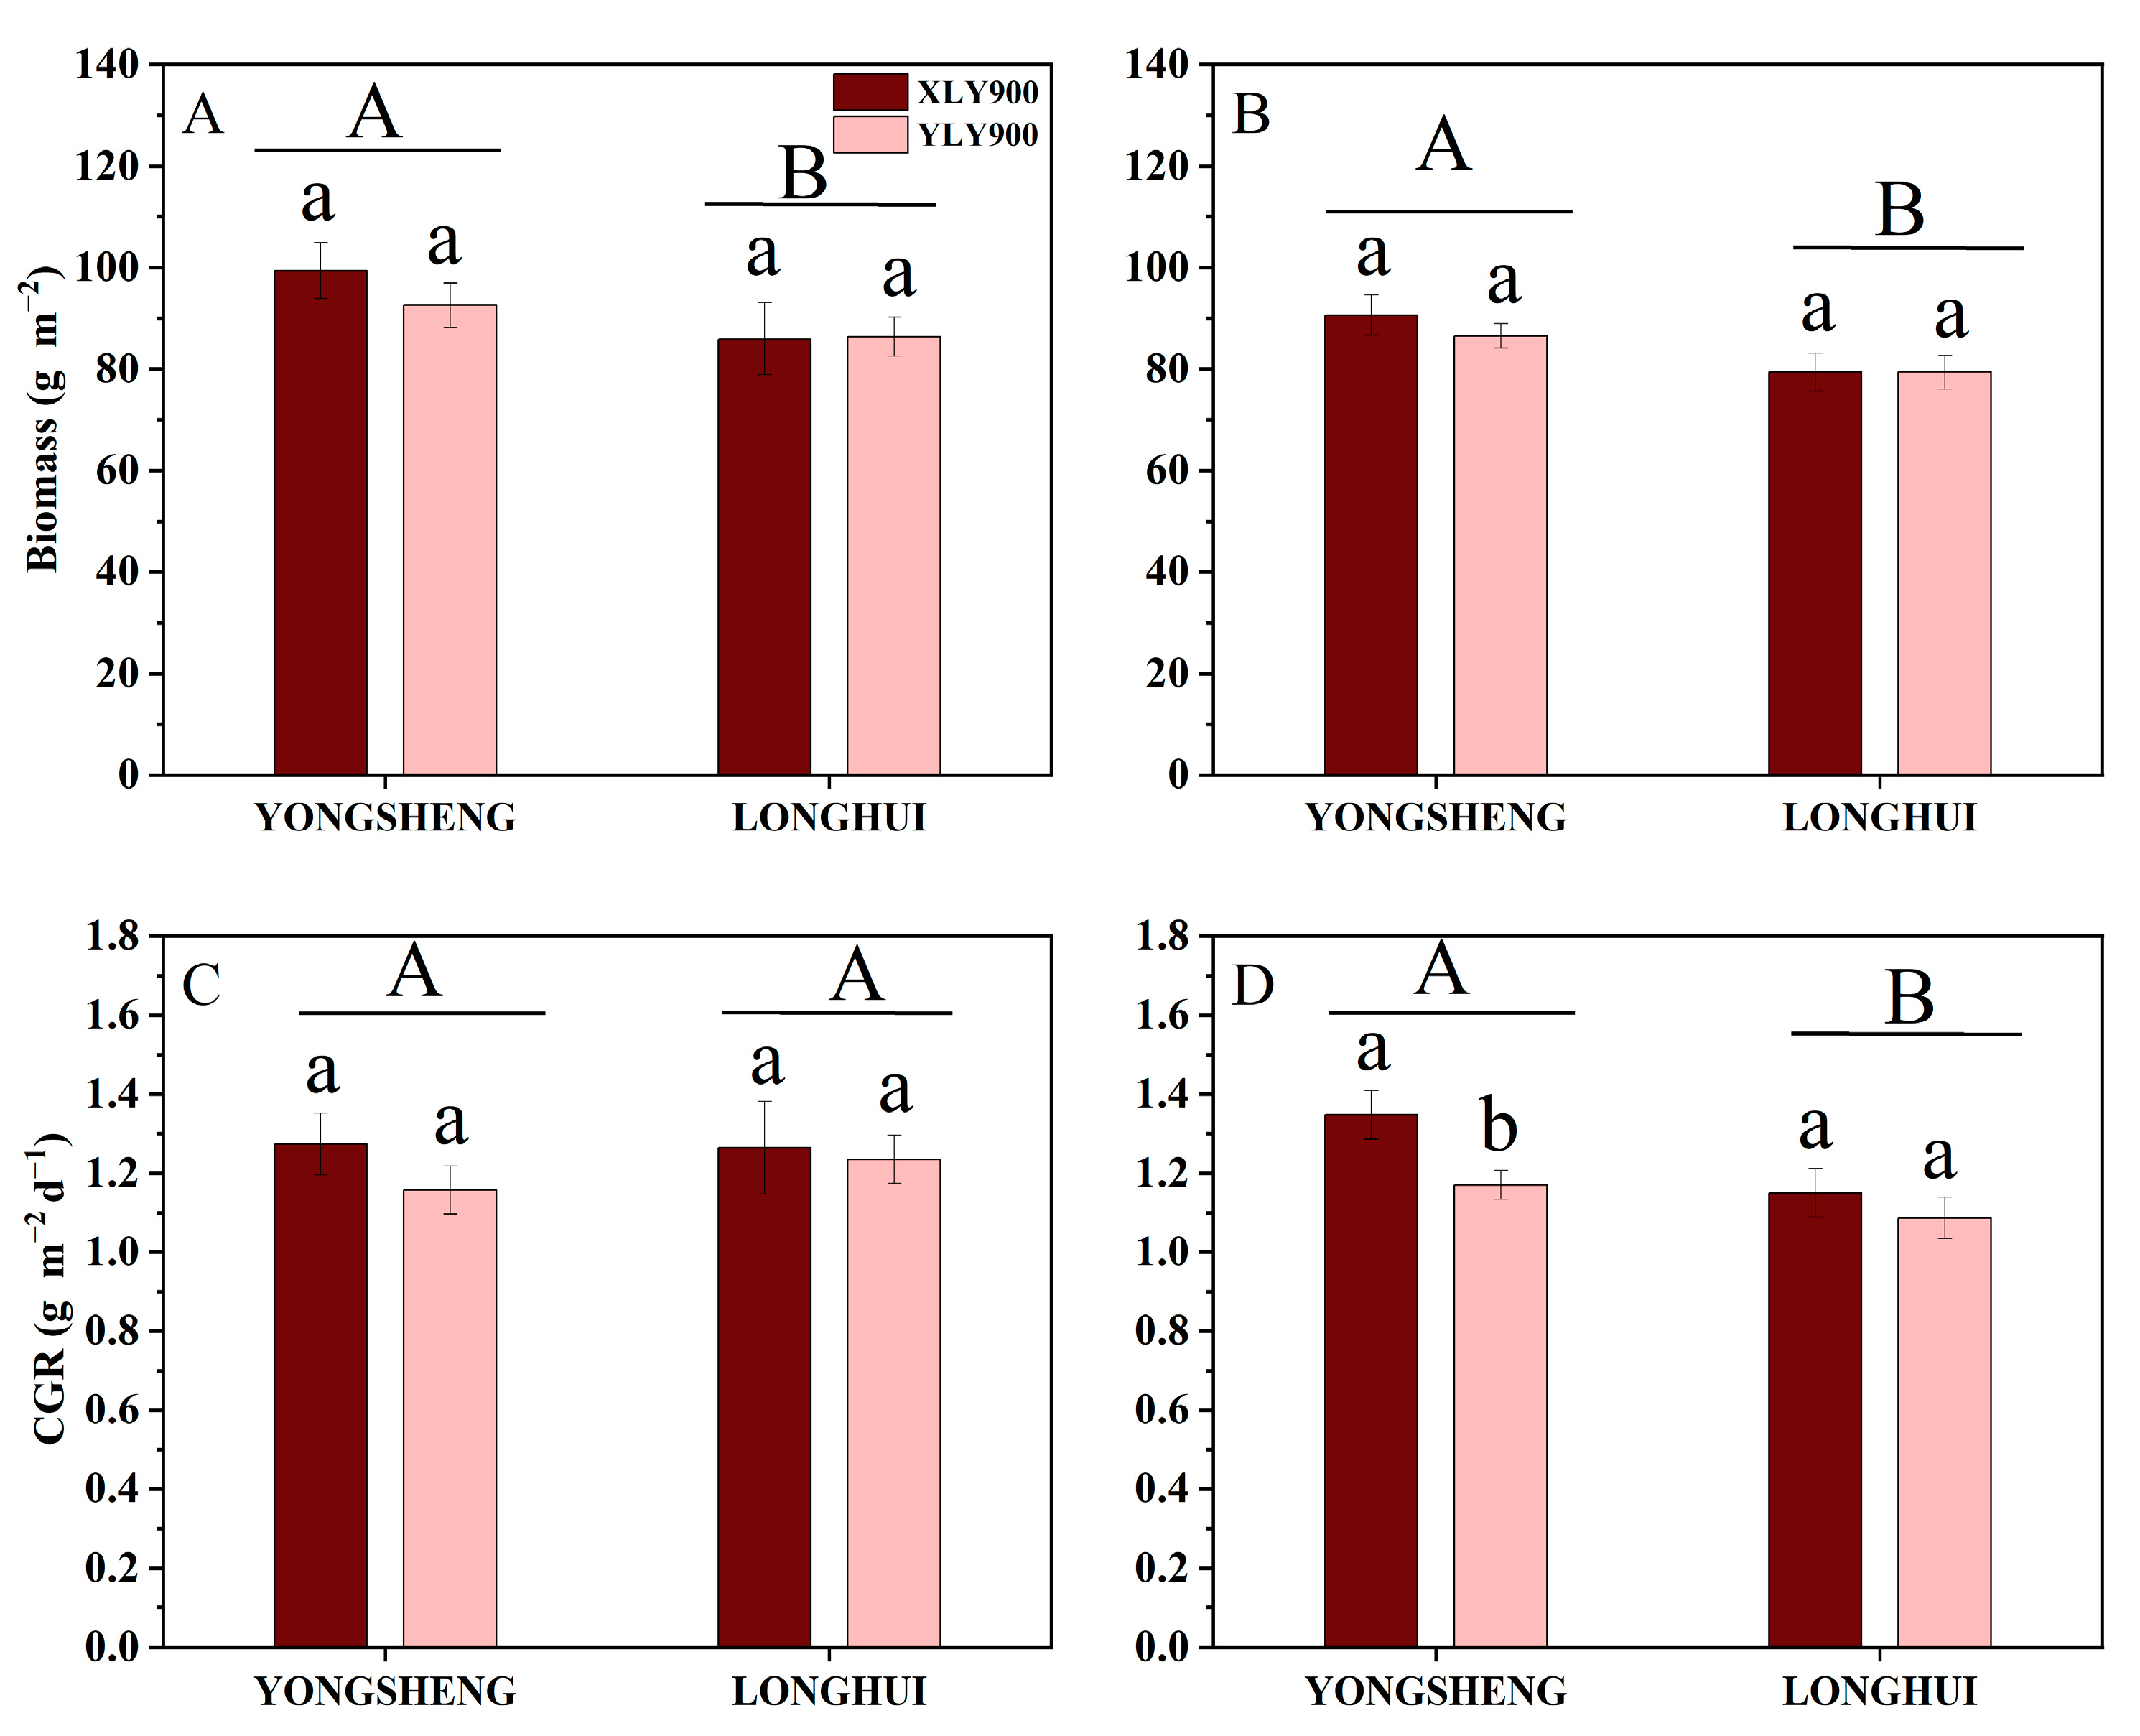
Figure 2.
Biomass accumulation from full heading to maturity (A,B) and crop growth rate (CGR) (C,D) during the growing seasons of two rice cultivars in two ecological regions in 2020 and 2021. The different lowercase letters indicate significant differences (p < 0.05) between the two rice varieties. The different capital letters indicate significant differences (p < 0.05) between the YONGSHENG and LONGHUI ecological regions. XLY-900, Xiangliangyou900; YLY-900, Yliangyou900.


Table 1.
Grain yield and yield components of two rice cultivars in two ecological regions in 2020 and 2021.
Table 1.
Grain yield and yield components of two rice cultivars in two ecological regions in 2020 and 2021.
| Year | Variety | Effective | Spikelets | Seed | 1000-Grain | Rice |
|---|---|---|---|---|---|---|
| /Location | Panicles | per | Setting | Weight | Yield | |
| × 104 ha−1 | Panicle | Rate (%) | (g) | (t ha−1) | ||
| 2020 | ||||||
| YONG | XLY900 | 208.50 a | 416.90 a | 89.39 a | 27.16 a | 19.19 b |
| SHENG | YLY900 | 223.30 a | 393.62 a | 89.91 a | 26.46 b | 20.10 a |
| Mean | 215.90 A | 405.26 A | 89.65 A | 26.81 A | 19.65 A | |
| LONGHUI | XLY900 | 208.56 a | 341.60 a | 91.58 a | 27.19 a | 15.27 a |
| YLY900 | 211.51 a | 345.40 a | 90.67 a | 26.40 b | 15.45 a | |
| Mean | 210.04 A | 343.50 B | 91.13 A | 26.80 A | 15.36 B | |
| 2021 | ||||||
| YONG | XLY900 | 192.60 b | 387.52 a | 91.20 a | 27.50 a | 18.90 a |
| SHENG | YLY900 | 217.10 a | 407.28 a | 88.94 a | 27.72 a | 18.81 a |
| Mean | 204.85 A | 397.40 A | 90.07 A | 27.61 A | 18.86 A | |
| LONGHUI | XLY900 | 205.50 a | 336.70 a | 90.44 a | 27.26 a | 15.34 a |
| YLY900 | 209.92 a | 343.30 a | 91.60 a | 26.56 b | 15.38 a | |
| Mean | 207.71 A | 340.00 B | 91.02 A | 26.91 B | 15.36 B | |
| Analysis of variance | ||||||
| L (Location) | ns | ** | ns | ** | ** | |
| Y (Year) | ns | ns | ns | ** | ns | |
| V (Variety) | ns | ns | ns | ** | ns | |
| L × Y | ns | ns | ns | ** | * | |
| L × V | * | ns | ns | * | ns | |
| Y × V | ns | ns | ns | ns | ns | |
| L × Y × V | ns | ns | ns | * | ns | |
The different lowercase letters indicate significant differences (p < 0.05) between the different rice varieties. The different capital letters indicate significant differences (p < 0.05) between the YONGSHENG and LONGHUI ecological regions. XLY-900: Xiangliangyou900; YLY-900: Yliangyou900; ns, not significant; * and ** represent statistical difference at p < 0.05 and p < 0.01, respectively.
Table 2.
Total biomass at maturity and harvest indices of two rice cultivars in two ecological regions in 2020 and 2021.
Table 2.
Total biomass at maturity and harvest indices of two rice cultivars in two ecological regions in 2020 and 2021.
| Year | Variety | Total | Harvest |
|---|---|---|---|
| Biomass (g m−2) | Index (%) | ||
| 2020 | YUNAN | ||
| XLY900 | 2817.80 a | 64.40 a | |
| YLY900 | 2829.50 a | 63.00 a | |
| Mean | 2823.7 A | 63.7 A | |
| YONGSHENG | |||
| XLY900 | 2418.00 a | 60.00 a | |
| YLY900 | 2456.40 a | 57.60 a | |
| Mean | 2437.2 B | 58.8 B | |
| 2021 | YUNAN | ||
| XLY900 | 2846.10 a | 63.40 a | |
| YLY900 | 2803.60 a | 64.00 a | |
| Mean | 2824.9 A | 63.7 A | |
| YONGSHENG | |||
| XLY900 | 2426.00 | 58.80 a | |
| YLY900 | 2500.20 | 57.80 a | |
| Mean | 2463.1 B | 58.3 B | |
| Analysis of variance | |||
| L (Location) | ** | ** | |
| Y (Year) | ns | ns | |
| V (Variety) | ns | ns | |
| L × Y | ns | ns | |
| L × V | ns | ns | |
| Y × V | ns | ns | |
| L × Y × V | ns | ns | |
The different lowercase letters indicate significant differences (p < 0.05) between the two rice varieties. The different capital letters indicate significant differences (p < 0.05) between the YONGSHENG and LONGHUI ecological regions. XLY-900: Xiangliangyou900; YLY-900: Yliangyou900; ns, not significant; ** represent statistical difference at p < 0.01.
Table 3.
Growth duration, average maximum temperature, and average minimum temperature during the growing season of two rice cultivars in two ecological regions in 2020 and 2021.
Table 3.
Growth duration, average maximum temperature, and average minimum temperature during the growing season of two rice cultivars in two ecological regions in 2020 and 2021.
| Year Site | Cultivar | Average Maximum Temperature (°C) | Average Minimum Temperature (°C) | Growth Duration (d) | ||||||
|---|---|---|---|---|---|---|---|---|---|---|
| TP-HS | HS-MS | TP-MS | TP-HS | HS-MS | TP-MS | TP-HS | HS-MS | TP-MS | ||
| 2020 | ||||||||||
| YONG | XLY900 | 30.41 | 29.88 | 30.14 | 19.83 | 18.55 | 19.19 | 88 | 50 | 50 |
| SHENG | YLY900 | 30.49 | 29.52 | 30.01 | 19.78 | 18.67 | 19.23 | 90 | 50 | 50 |
| Mean | 30.45 | 29.7 | 30.08 | 19.81 | 18.61 | 19.21 | 89 | 50 | 139 | |
| LONG | XLY900 | 31.43 | 30.06 | 30.74 | 23.16 | 21.08 | 22.12 | 68 | 44 | 44 |
| HUI | YLY900 | 31.49 | 29.49 | 30.49 | 23.18 | 20.73 | 21.96 | 70 | 44 | 44 |
| Mean | 31.46 | 29.78 | 30.62 | 23.17 | 20.91 | 22.04 | 69 | 44 | 113 | |
| 2021 | ||||||||||
| YONG | XLY900 | 30.3 | 28.18 | 29.26 | 20.4 | 18.58 | 19.49 | 81 | 52 | 52 |
| SHENG | YLY900 | 29.76 | 28.8 | 29.28 | 20.28 | 18.58 | 19.43 | 84 | 52 | 52 |
| Mean | 30.03 | 28.49 | 29.27 | 20.34 | 18.58 | 19.46 | 82.5 | 52 | 134.5 | |
| LONG | XLY900 | 30.26 | 32.75 | 31.5 | 21.26 | 22.34 | 21.8 | 69 | 46 | 46 |
| HUI | YLY900 | 30.31 | 32.74 | 31.53 | 21.29 | 22.2 | 21.75 | 73 | 49 | 49 |
| Mean | 30.29 | 32.75 | 31.52 | 21.28 | 22.27 | 21.78 | 71 | 47.5 | 118.5 | |
| Parameters | Intercept | 71.68 | 41.61 | 78.30 | 45.01 | 40.87 | 48.52 | - | - | - |
| Slope | −1.78 | −0.81 | −2.01 | −1.31 | −1.17 | −1.51 | - | - | - | |
| R2 | 0.25 | 0.41 | 0.57 | 0.71 | 0.87 | 0.97 | - | - | - | |
| F Value | 2.01 ns | 4.22 ns | 6.68 * | 15.01 ** | 39.16 ** | 211.48 ** | - | - | - | |
XLY-900, Xiangliangyou900; YLY-900, Yliangyou900; TP-HS, transplanting–heading stage; HS-MS, heading–maturity stage; TP-MS, transplanting–maturity stage; ns, not significant; * and ** represent statistical difference at p < 0.05 and p < 0.01, respectively.
Table 4.
Average daytime temperature, average night temperature, and average temperature during the growing season of two rice cultivars in two ecological regions in 2020 and 2021.
Table 4.
Average daytime temperature, average night temperature, and average temperature during the growing season of two rice cultivars in two ecological regions in 2020 and 2021.
| Year/Site | Cultivar | Average Daytime Temperature (°C) | Average Night Temperature (°C) | Average Temperature (°C) | ||||||
|---|---|---|---|---|---|---|---|---|---|---|
| TP-HS | HS-MS | TP-MS | TP-HS | HD-MS | TP-MS | TP-HS | HS-MS | TP-MS | ||
| 2020 | ||||||||||
| YONG | XLY900 | 26.91 | 25.58 | 26.24 | 22.45 | 20.16 | 21.3 | 24.68 | 22.87 | 23.77 |
| SHENG | YLY900 | 26.93 | 25.38 | 26.16 | 22.37 | 20.27 | 21.32 | 24.65 | 22.82 | 23.74 |
| Mean | 26.92 | 25.48 | 26.2 | 22.41 | 20.22 | 21.31 | 24.67 | 22.85 | 23.76 | |
| LONG | XLY900 | 28.76 | 26.9 | 27.83 | 24.44 | 22.25 | 23.35 | 26.6 | 24.58 | 25.59 |
| HUI | YLY900 | 28.85 | 26.33 | 27.59 | 24.48 | 21.84 | 23.16 | 26.66 | 24.08 | 25.37 |
| Mean | 28.81 | 26.62 | 27.71 | 24.46 | 22.05 | 23.26 | 26.63 | 24.33 | 25.48 | |
| 2021 | ||||||||||
| YONG | XLY900 | 27 | 24.69 | 25.83 | 22.4 | 20.01 | 21.19 | 24.67 | 22.35 | 23.51 |
| SHENG | YLY900 | 26.65 | 24.9 | 25.77 | 22.16 | 20.11 | 21.13 | 24.4 | 22.51 | 23.45 |
| Mean | 26.83 | 24.8 | 25.8 | 22.28 | 20.06 | 21.16 | 24.54 | 22.43 | 23.48 | |
| LONG | XLY900 | 27.56 | 29.38 | 28.47 | 22.77 | 23.63 | 23.2 | 25.16 | 26.5 | 25.83 |
| HUI | YLY900 | 27.61 | 29.28 | 28.44 | 22.8 | 23.5 | 23.15 | 25.21 | 26.39 | 25.8 |
| Mean | 27.59 | 29.33 | 28.46 | 22.79 | 23.57 | 23.18 | 25.19 | 26.45 | 25.82 | |
| Parameters | Intercept | 72.58 | 41.26 | 63.15 | 54.26 | 43.94 | 60.55 | 62.95 | 42.86 | 62.89 |
| Slope | −2.01 | −0.90 | −1.70 | −1.61 | −1.24 | −1.95 | −1.81 | −1.06 | −1.85 | |
| R2 | 0.65 | 0.62 | 0.86 | 0.51 | 0.81 | 0.94 | 0.58 | 0.72 | 0.92 | |
| F Value | 11.30 * | 9.84 * | 36.71 ** | 6.14 * | 26.20 ** | 101.34 ** | 8.23 * | 15.09 ** | 67.23 ** | |
XLY-900, Xiangliangyou900; YLY-900, Yliangyou900; TP-HS, transplanting–heading stage; HS-MS, heading–maturity stage; TP-MS, transplanting–maturity stage; * and ** represent statistical difference at p < 0.05 and p < 0.01, respectively.
Table 5.
Cumulative daily radiation during the growing season of two rice cultivars in two ecological regions in 2020 and 2021.
Table 5.
Cumulative daily radiation during the growing season of two rice cultivars in two ecological regions in 2020 and 2021.
| Year/Site | Cultivar | Cumulative Daily Radiation (MJ m−2) | ||
|---|---|---|---|---|
| TP-HS | HS-MS | TP-MS | ||
| 2020 | ||||
| YONGSHENG | XLY900 | 446.44 | 368.03 | 417.82 |
| YLY900 | 445.97 | 368.25 | 418.02 | |
| Mean | 446.21 | 368.14 | 417.92 | |
| LONGHUI | XLY900 | 369.71 | 325.75 | 352.44 |
| YLY900 | 371.58 | 312.22 | 348.66 | |
| Mean | 370.65 | 318.99 | 350.55 | |
| 2021 | ||||
| YONGSHENG | XLY900 | 432.09 | 384.5 | 413.46 |
| YLY900 | 428.15 | 385.14 | 411.58 | |
| Mean | 430.12 | 384.82 | 412.52 | |
| LONGHUI | XLY900 | 397.07 | 330.52 | 370.68 |
| YLY900 | 404.87 | 311.48 | 369.55 | |
| Mean | 400.97 | 321 | 370.12 | |
| Parameters | Intercept | −8.59 | −4.04 | −8.68 |
| Slope | 0.063 | 0.061 | 0.067 | |
| R2 | 0.84 | 0.83 | 0.92 | |
| F Value | 31.61 ** | 28.75 ** | 67.55 ** | |
XLY-900, Xiangliangyou900; YLY-900, Yliangyou900; TP-HS, transplanting–heading stage; HS-MS, heading–maturity stage; TP-MS, transplanting–maturity stage; ** represent statistical difference at p < 0.01.
Disclaimer/Publisher’s Note: The statements, opinions and data contained in all publications are solely those of the individual author(s) and contributor(s) and not of MDPI and/or the editor(s). MDPI and/or the editor(s) disclaim responsibility for any injury to people or property resulting from any ideas, methods, instructions or products referred to in the content. |
© 2024 by the authors. Licensee MDPI, Basel, Switzerland. This article is an open access article distributed under the terms and conditions of the Creative Commons Attribution (CC BY) license (https://creativecommons.org/licenses/by/4.0/).
Share and Cite
MDPI and ACS Style
Wei, Z.; Zhang, Y.; Jin, W. Yield Gap Analysis of Super High-Yielding Rice (>15 t ha−1) in Two Ecological Regions. Agriculture 2024, 14, 491. https://doi.org/10.3390/agriculture14030491
AMA Style
Wei Z, Zhang Y, Jin W. Yield Gap Analysis of Super High-Yielding Rice (>15 t ha−1) in Two Ecological Regions. Agriculture. 2024; 14(3):491. https://doi.org/10.3390/agriculture14030491
Chicago/Turabian StyleWei, Zhongwei, Yuzhu Zhang, and Wenyu Jin. 2024. "Yield Gap Analysis of Super High-Yielding Rice (>15 t ha−1) in Two Ecological Regions" Agriculture 14, no. 3: 491. https://doi.org/10.3390/agriculture14030491
Note that from the first issue of 2016, this journal uses article numbers instead of page numbers. See further details here.