
Potential Risk of Frost in the Growing Season in Poland
Department of Environmental Management, West Pomeranian University of Technology in Szczecin, ul. Słowackiego 17, 71-434 Szczecin, Poland
*
Author to whom correspondence should be addressed.
Agriculture 2024, 14(3), 501; https://doi.org/10.3390/agriculture14030501
Submission received: 18 November 2023
/
Revised: 8 March 2024
/
Accepted: 16 March 2024
/
Published: 20 March 2024
(This article belongs to the Section Crop Production)
Abstract
:Fruits, garden plants, and agricultural crops grown in Poland exhibit wide variations in their sensitivity to frost, particularly in early spring. In the case of frost, generally, the yield and quality are reduced, and sometimes, entire plants can be destroyed. This article characterizes the occurrence of ground frosts (at 5 cm agl) and air frosts (at 200 cm agl) in Poland gathered from 52 meteorological stations affiliated with IMGW-PIB between 1971 and 2020. To assess the real risk of frost to plants, the variability of this phenomenon was analyzed per thermal growing season (defined as air temperature >5 °C), rather than in traditional calendar terms as presented in most studies. In the climatic conditions of Poland, the growing season is characterized by a reported 28 days with ground frost and 13.3 days with air frost, approximately. In spring, the last ground frost disappears, on average, on a country scale, on May 14, and air frost on April 27. In turn, in autumn, the first ground frost is recorded, on average, on 1 October and air frost on 14 October. On the basis of the selected characteristics of frost and the growing season, four areas of potential risk of ground and air frost in the growing season, as well as in spring, were determined with the use of cluster analysis.
Keywords:
spring frost; autumn frost; the growing season; dates; frost-free period; cluster analysis; regions1. Introduction
The adverse effects of climate change are already affecting agriculture worldwide. Weather anomalies, increasing temperatures, the shifting boundaries of agroecosystems and increased incidence of extreme weather phenomena such as drought, hail, flood or hurricane necessitate adaptation. However, despite the observed global warming, many regions, for example in Switzerland, Germany, or Poland, face a non-decreasing risk of frost [1,2,3,4]. This is because climate change causes an acceleration of both the beginning of the growing season, as well as the occurrence of the last spring frosts. Thus, the increase or decrease in the risk of spring frosts depends on which of the aforementioned phenomena takes place first. If, in a given region, the dates of the beginning of the growing season occur increasingly earlier with respect to the dates of the last spring frosts, the risk will increase in the long term. In a reverse situation, the risk will decrease [5]. In principle, the severity of frost damage to crops is associated with the deceleration values between the beginning of the spring plant growth and the subsequent frost period [6].
Using satellite-derived phenological records and minimum temperature data sets from 1982 to 2012, Liu et al. [7] documented the number of frost days during the growing season (GSFDs, days with minimum temperature < 0 °C) in the Northern Hemisphere (with latitudes greater than 30° N). It was found that despite the warming trends in the last three decades, larger increases in the length of the growing season, found in particular regions, were accompanied by an increased number of frost days. According to the authors, in the last 30 years, there was a substantial increase in GSFD in ~43% of the hemisphere, Europe in spring in particular. A decrease in GSFDs was observed mainly in northern Siberia, the Tibetan Plateau, and north-western North America, mainly in autumn. Ma et al. [8] combined daily gridded climate data and 1489 k in situ phenological observations of 27 tree species from 5565 phenological observation sites in Europe and observed that the risk of spring frost damage with recent warming is highly dependent on geographical locations and species. It has been shown that in comparison with continental areas, maritime and coastal areas in Europe are at a greater risk of more frequent occurrence of frosts and that late spring frosts in these areas are more severe. Species whose phenology was particularly sensitive to climate warming were found to be more vulnerable to frost damage. According to Fu et al. [9], with the continuing warming, the phenological sensitivity of temperate trees to elevated temperatures is expected to decline.
Frosts are one of the most important factors contributing to heavy losses in fruit, horticultural, and agricultural production and, in extreme cases, can destroy the entire crop [10]. The nature of frost damage depends on the developmental phase of the affected plant. Generally, for most plants, the most critical moment is the flowering phase or the beginning of leaf formation. Therefore, late spring frosts are particularly dangerous as they may damage the flower buds, flowers, and fruit setting [11]. According to Doroszewski et al. [12], spring frosts which occurred at the beginning of May 2011 all over Poland, caused the greatest loss in crops in the Greater Poland voivodeship: gooseberry, sweet cherry, plum, and pears—more than 70%; apples, peach, apricot, and walnut—more than 80%. Similarly, as observed in the second half of April 2017, following the very warm period resulting in premature vegetation growth, cold Arctic air masses moving to Central and Western Europe caused severe damage to natural and cultivated vegetation across a wide area [1]. The reported losses reached historic levels—particularly for fruit and wine growers: economic losses were estimated at €3.3 bn, with approx. €600 m of this covered by insurance. The most affected countries were Italy, France, Germany, Poland, Spain, and Switzerland [5]. The frost in April 2021 caused heavy losses across Europe affecting vineyards, fruit trees, rapeseed, potatoes, and sugar beet. In France, 80% of national wine and fruit growing regions were affected, and the extent of damage was found to be significant in Italy, the Czech Republic, and the United Kingdom [13].
As estimated by Zohner et al. [14], ∼35% of the European, ∼26% of the Asian, and merely ∼10% of North American forest area in the temperate zones will suffer increased losses due to frost in the conditions of warming climate in the future. On the basis of the regional climate model simulation, Lhotka and Brönnimann [15], indicate the possible increased spring frost risk to plants in Switzerland in the foreseeable future. Vitasse et al. [2] advocate caution and consideration of frost risk when introducing new varieties of fruit trees or exotic species of forest trees adapted to a warmer and drier climate as well as when establishing new plantations at higher altitudes.
In Poland, frosts occur in every growing season. Spring frosts are recorded most often in April (particularly in the second decade), and autumn frosts in October (most frequently in the third decade) [3,4,10,11,16]. Ground frosts in spring disappear throughout most of the country, on average, between May 10 and May 25, and in autumn their occurrence is recorded between September 20 and October 5 [3]. Similarly, for more than 2 weeks, spatial variability is observed with respect to air frosts which, in comparison with ground frosts, disappear earlier and occur later. On average, the earliest end of air frosts i.e., before 20 April, is recorded on the coast, and the latest end i.e., after 5 May, in the Narew River basin. In turn, the average dates of the occurrence of the first autumn frosts fall in the first decade of October in the northeast of Poland, whereas along the coast, in the last pentad of the said month [4]. It is noteworthy that there is a marked, statistically significant trend of an earlier ending date of the last spring frosts and increasingly later occurrence in autumn which, in turn, results in the lengthening of the frost-free period. Multiannual variability of the aforementioned characteristics, both local as well as throughout the country, was confirmed by numerous authors [3,4,11,16,17,18,19,20,21,22,23].
The aim of the present paper is the assessment of the potential risk to crops in Poland due to ground and air frosts occurring in the growing season and in spring based on the selected features characterizing the phenomenon using the cluster analysis method.
2. Materials and Methods
The study is based on the results of the minimum and mean 24-h period air temperature taken at 200 cm agl, and the minimum air temperature at 5 cm agl obtained from 52 meteorological stations in Poland (Figure 1) for the period 1971–2020. The data were obtained from the Institute of Meteorology and Water Management—National Research Institute (IMGW-PIB). Mountain areas over 500 m above sea level (Sudetes and Carpathians) were excluded from the study as, generally, plants with high thermal requirements are not cultivated there.
A day with ground frost was identified when the minimum air temperature at 5 cm agl was below 0.0 °C, with the mean 24 h period air temperature 200 cm agl being above 0.0 °C. Conditions for determining air frost were: minimum air temperature at 200 agl below 0.0 °C with the mean 24-h period air temperature at the same altitude being above 0.0 °C.
For the purpose of presenting the real frost risk to plants, the variability of this phenomenon was analyzed per growing season and not in calendar terms as it is presented in most studies. Therefore, the first stage consisted of determining with the Gumiński method [24] the dates of the beginning and end of the periods with the mean 24 h period air temperature being above 5 °C with respect to individual stations and years under analysis. Once the growing season was determined in the aforementioned way, the occurrence of ground and air frosts was identified. In the present paper, frosts are presented in terms of the following features: the date of the latest occurrence of spring frost, the dates of the earliest autumn frosts, the number of days with frost in the growing season, the number of days with frost in the spring season (from the beginning of the growing season to June 30), the number of days with frost in the autumn season, frost-free period, absolute frost-free period, the series of days with frost, the probability of frost occurrence 20 days after the beginning of the growing season. The frost-free period, expressed in number of days, is the difference between the first autumn frost and the last spring frost. The absolute frost-free period should be understood as a period in which no frosts were recorded in any of the analyzed years (1971–2020). If there is no frost in spring or autumn, the date of the last spring frost and the first autumn frost is taken as the beginning and end date of the growing season, respectively, to calculate the frost-free period.
The potential risk to plants due to ground and air frost was determined using cluster analysis on the basis of the selected features of frost and the growing season. In the process of grouping the meteorological stations, the k-means method (Euclidean distance), belonging to non-hierarchical methods of cluster analysis was used [25,26,27]. The k-means algorithm consists of moving the objects from one cluster to another in order to maximize the variations between individual clusters and at the same time minimize the variations within the analyzed clusters. Eventually, in the resulting clusters, the similarity should be the highest and the individual clusters should exhibit maximum differences.
The potential risk was assessed on grounds of mean values from 1971 to 2020 and, additionally, from 2011 to 2020. On the basis of cluster analysis comprising the most important features of air and ground frosts, four groups of meteorological stations with comparable characteristics in the growing season and in spring were determined throughout the country. The input data for the cluster analysis are: the dates of the beginning and end of the growing season as consecutive days in the year, the dates of the last spring and first autumn frosts as the difference from the beginning of the growing season, the number of days with frost in spring, the number of days with frost in autumn, the number of days with frost during the growing season, frost-free period and the probability of frost occurrence 20 days after the beginning of the growing season. The identified groups of stations show differences in the magnitude of the features representing the level of risk to crops due to frost.
All statistical calculations were made using STATISTICA 13.3 software.
3. Results and Discussion
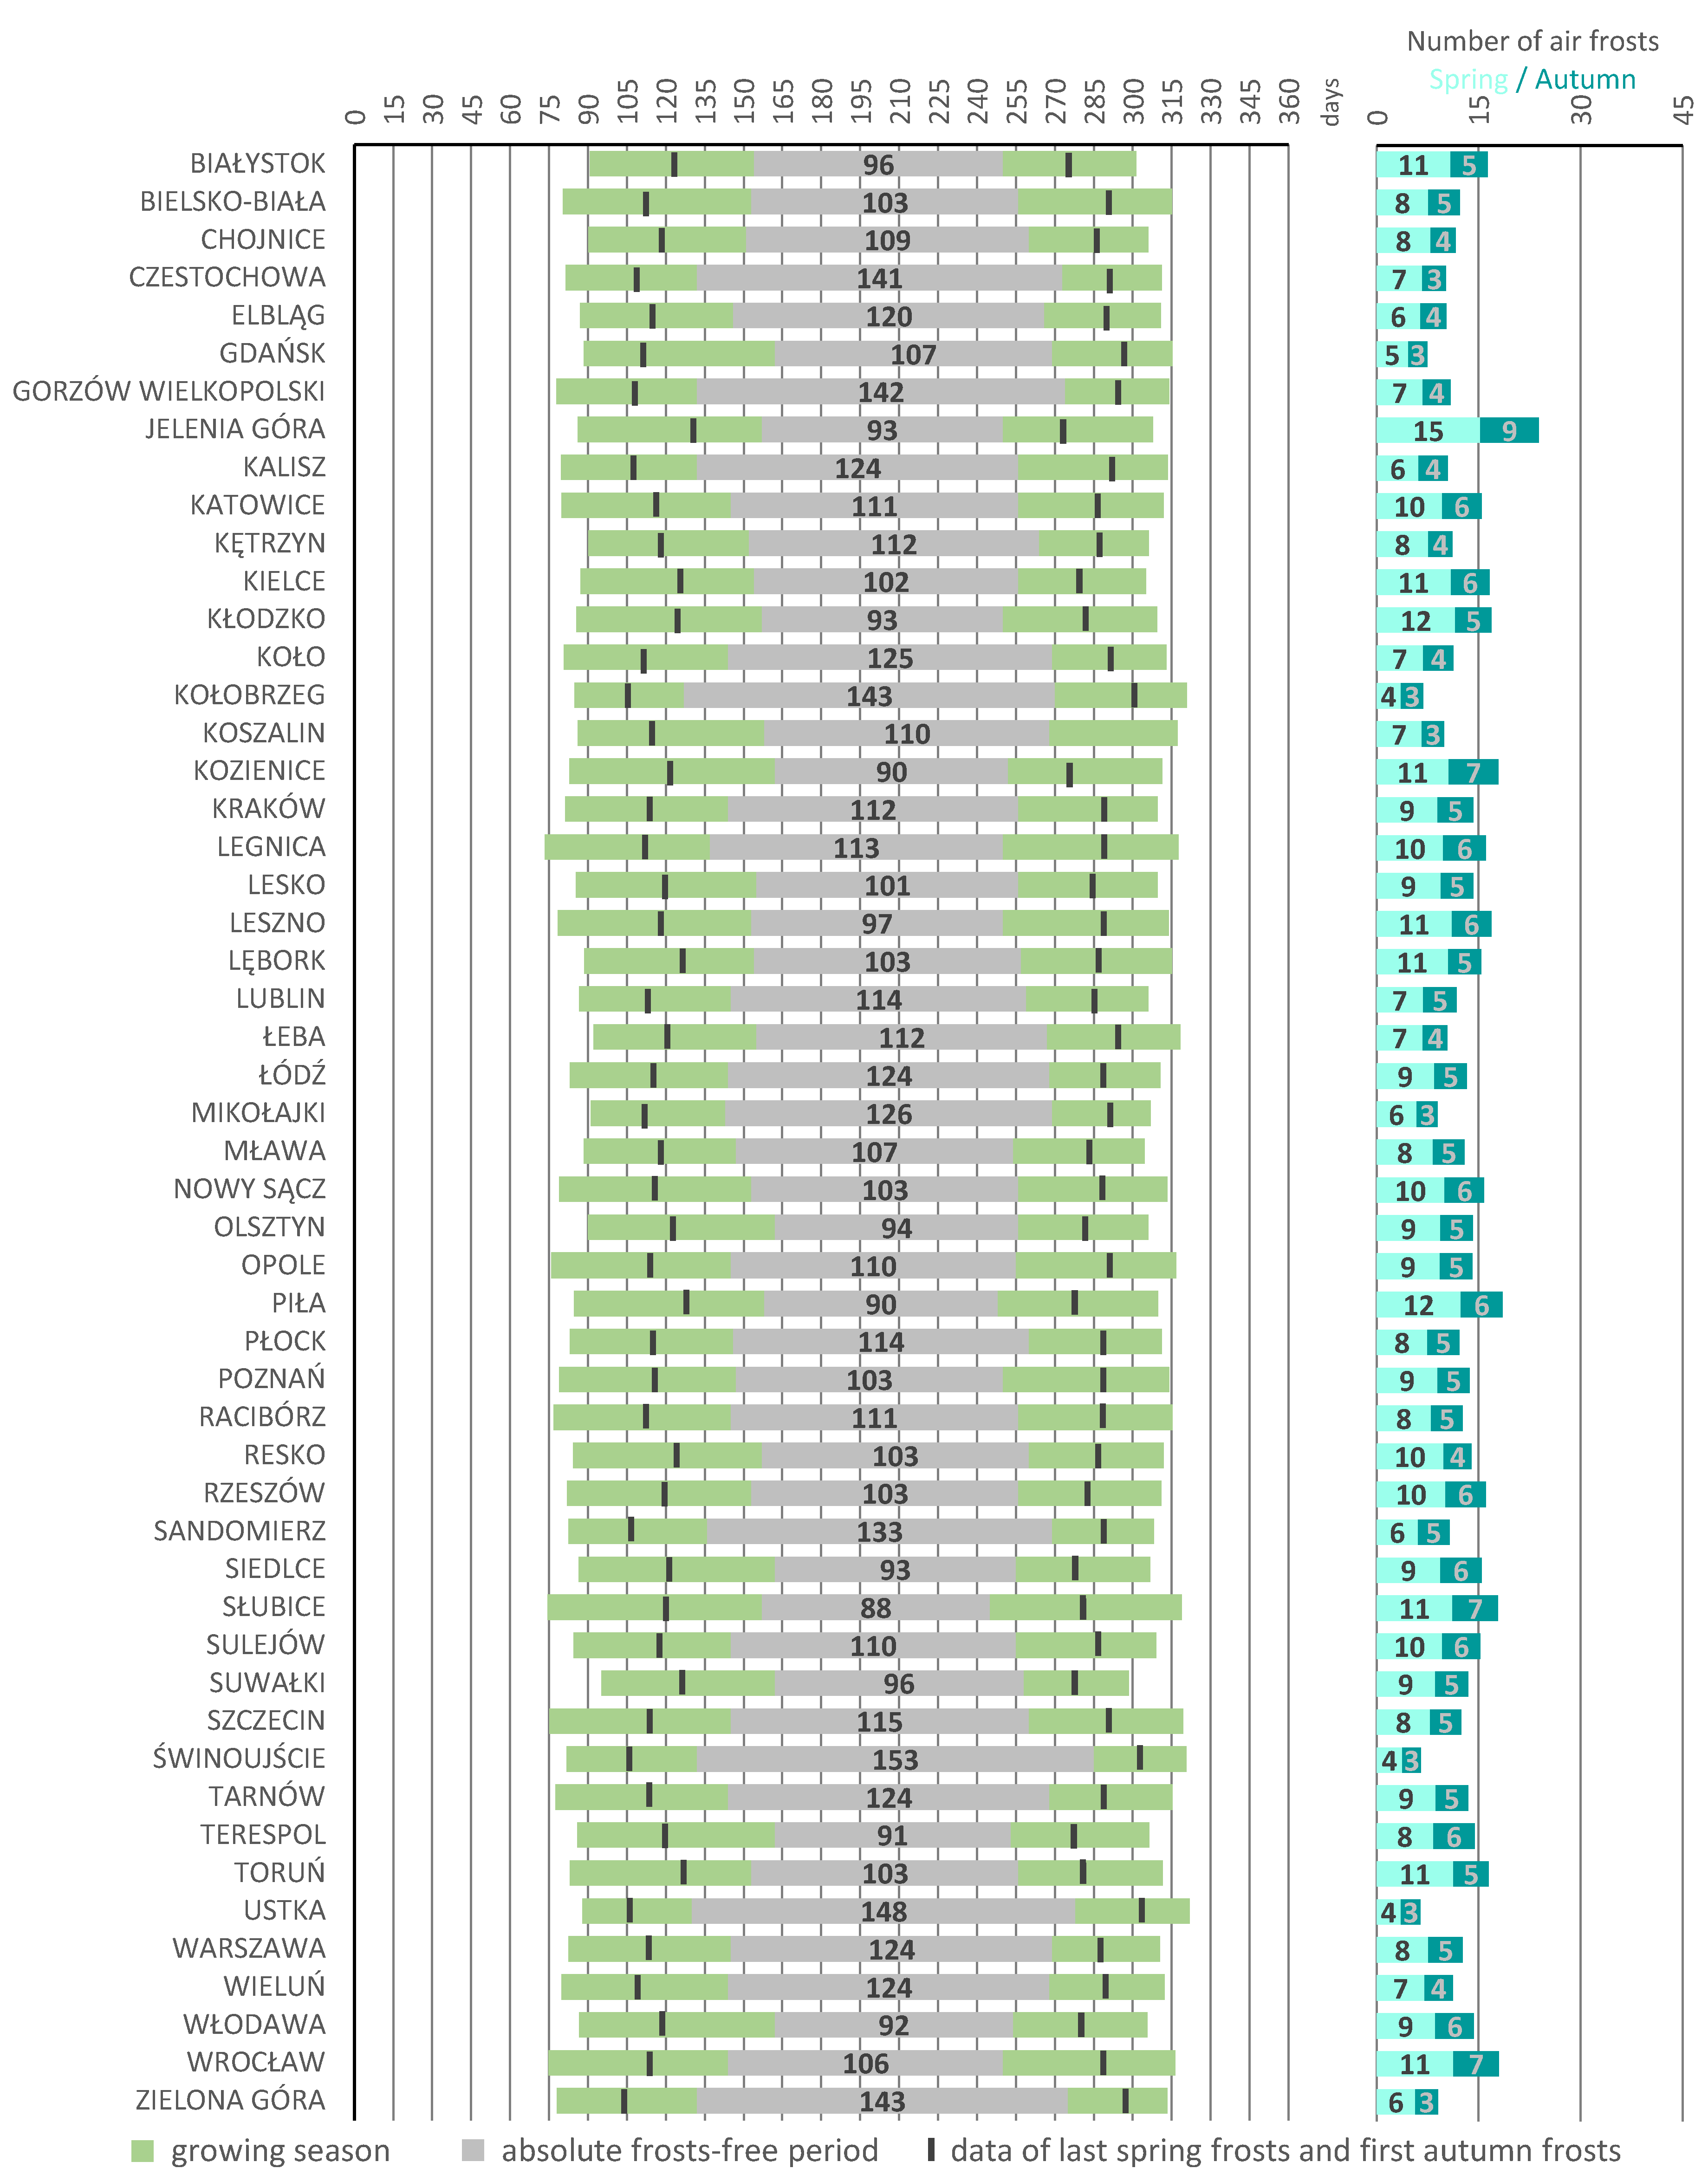
Figure 2 and Figure 3 allow determination, per individual meteorological station, of the beginning and end of the thermal growing season, the length of the growing season, the dates of the end of the spring frosts and the beginning of the autumn frosts—both air frosts and ground frosts, as well as the duration of the frost-free period. Additionally, the number of days with spring and autumn frosts is presented. The aforementioned features show high spatial variability in Poland. For example, the earliest occurrence of the thermal growing season is recorded in Lower Silesia on 16–17 March, and the latest date in the region of Suwałki—on average, April 6. In autumn, the earliest end of the said period is recorded in the north-eastern part of the country—the last pentad of October, and the latest end date is recorded in the coastal zone—after November 15. As a result, the longest duration of the growing season is recorded in the Silesian Lowland—on average, more than 240 days, and the shortest in the Suwałki Lake District—around 204 days. According to research, the trend of moving the starting date of the growing season has been consolidated with increasingly earlier occurrences. In the last 30 years (1991–2020), as compared with 1961–1990, there was an acceleration in the occurrence of the beginning of the thermal spring season (initiating the growing season) by as much as a month in the west, and by two weeks in the east of Poland [28]. Szyga-Pluta et al. [29] found an increase in the length of the growing season in Poland by an average of 4.8 days over 10 years between 1966 and 2020. A slightly higher rate of the said changes, on average by 6.2 days over the period of 10 years, however, for another multiannual period (1971–2020), was determined by Koźmiński et al. [4].
In the thermal growing season (air temperature > 5 °C), the average number of days with ground frosts in Poland amounts to 28 and ranges in spring from 10 to 26, and in autumn from 6 to 16 (Figure 2). As for air frosts, the average number of days in Poland is 13 and, depending on a given station, ranges from 4 to 15 in spring and 3 to 9 in autumn (Figure 3). Most importantly, on the grounds of data from the period 1971–2020, Koźmiński et al. [3] and Koźmiński et al. [4] demonstrated that the number of days with both ground as well as air frost in the conditions of the lengthening thermal growing season does not change, yet still poses a threat to agricultural and fruit crops. Most often, such frost events are of a mild nature with the minimum temperature ranging from –0.1 to –2.0 °C, whereas strong frosts (tmin < –6 °C) are recorded in Poland very rarely [3,4,18,30]. The frost events in Poland were recorded most frequently in anticyclonic situations, accompanied by arctic (PA), polar maritime old (PPms), and polar continental (PPk) air masses [17,31]. A study by Ustrnul et al. [32] shows the probability of late spring frost in Poland, including the last frost event in a given year, to be the highest with northerly advection and, occasionally, easterly advection. In turn, Tomczyk et al. [30] emphasize the relationship between the average conditions that favor strong and very strong frost events recorded in spring and autumn and higher than average air pressure recorded at sea level present over the prevailing part of the Euro-Atlantic sector that causes advection of cool air masses from the northern sector.
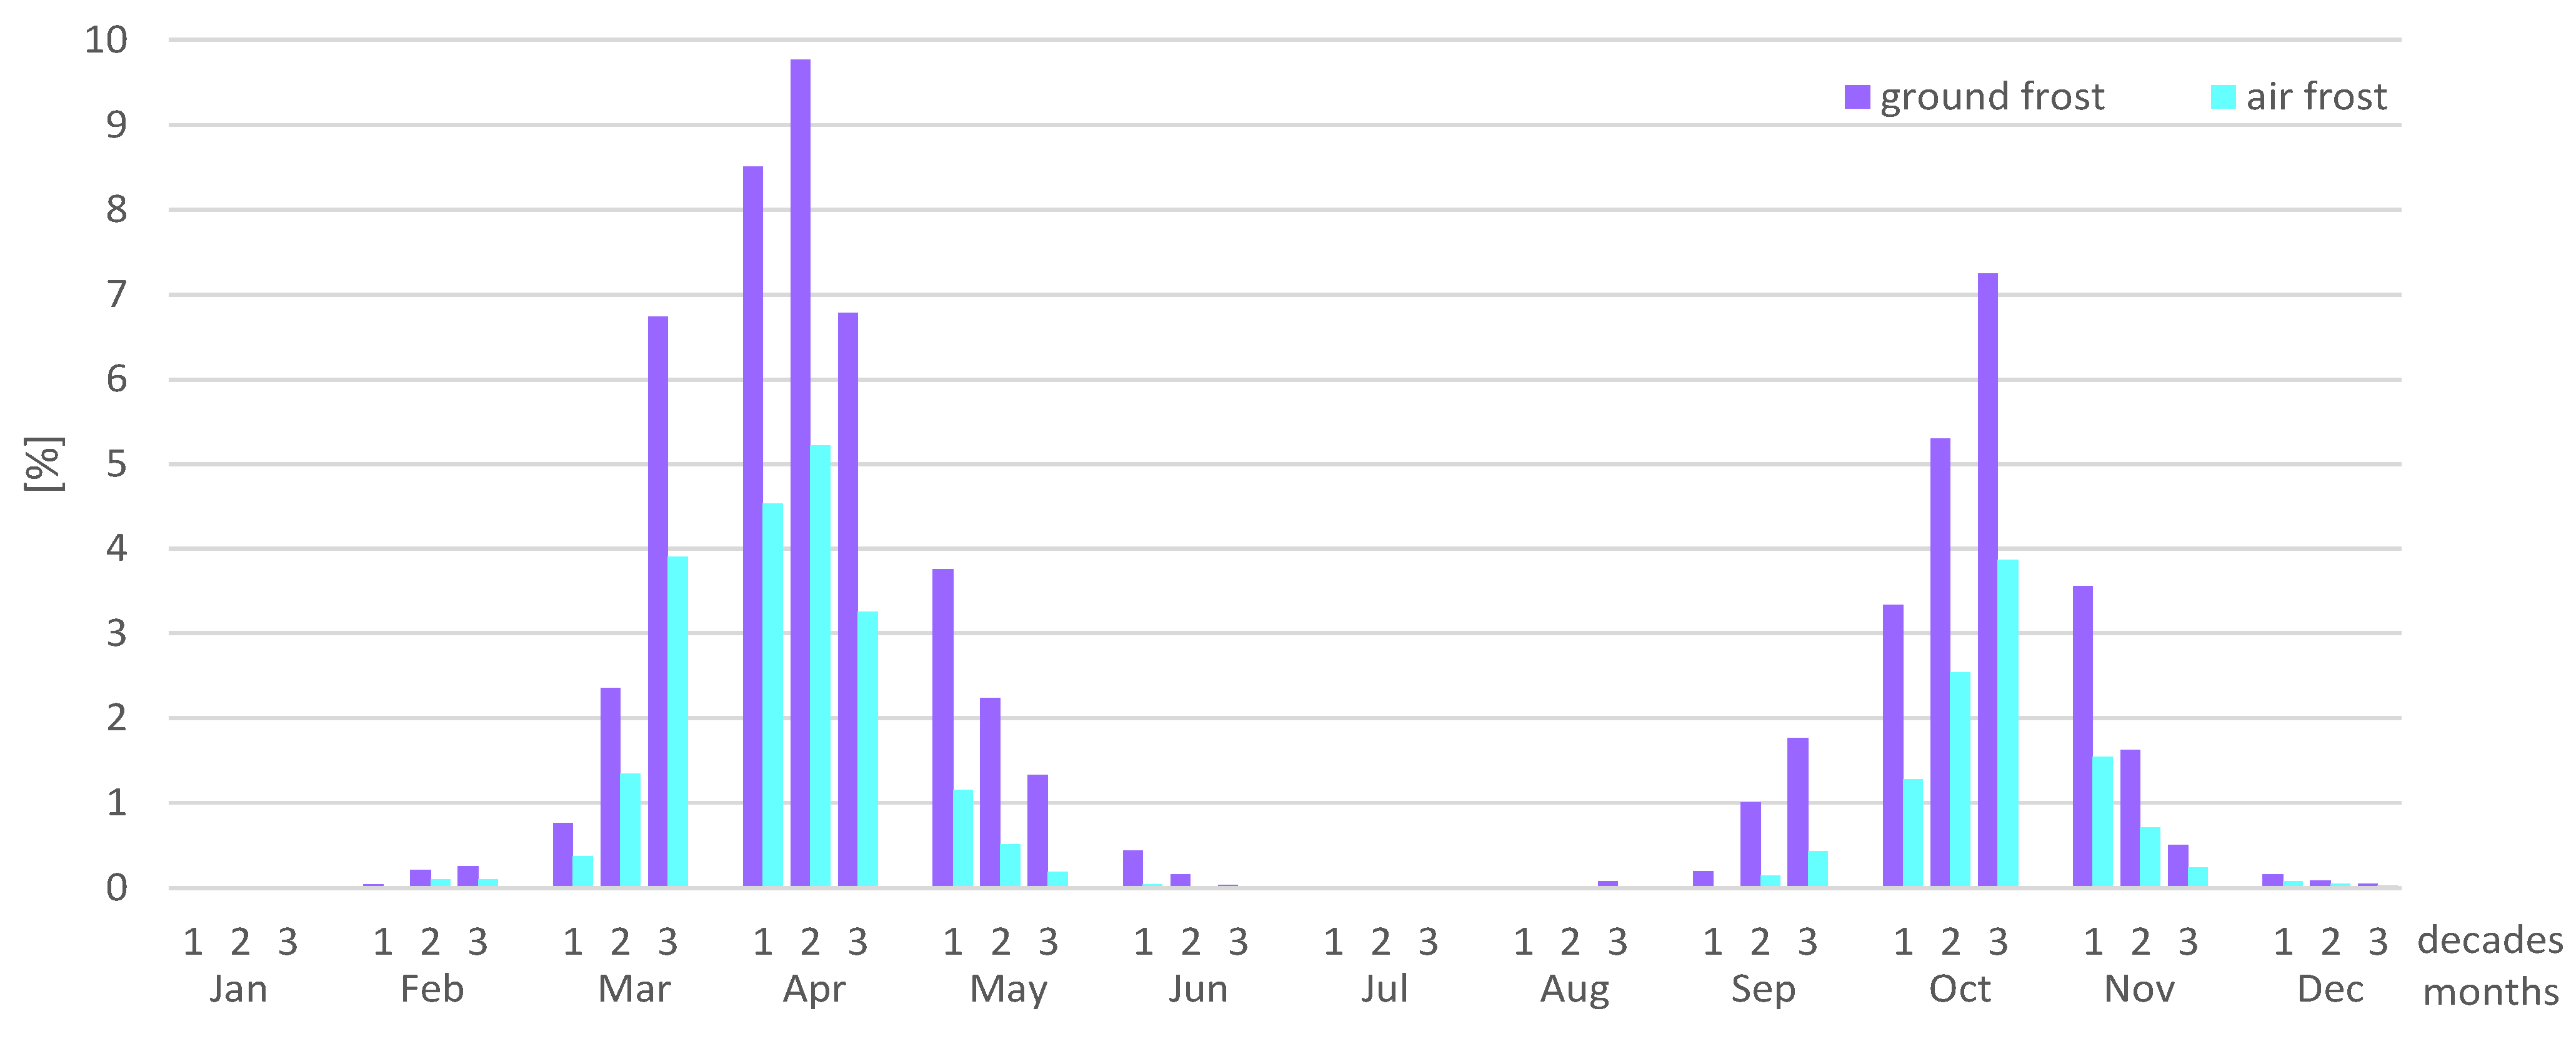
As is presented in Figure 4, in the growing seasons under analysis, the highest frequency of dates with frost was recorded in April, particularly in the second and first decade. In spring, the first frost in the growing season occurs as early as February, and the last ground frost events were recorded in the third decade of June. Autumn frosts (ground) occur sporadically in the third decade of August, reaching the highest frequency of occurrence only in the third decade of October. In the climatic conditions of Poland, there is a significant predominance—more than double, of ground frost over air frost and a markedly higher frequency of spring frost over autumn frost. Detailed temporal and spatial characteristics of ground and air frosts as per growing seasons covering the period of the last 50 years (1971–2020) are presented by Koźmiński et al. [3] and Koźmiński et al. [4].
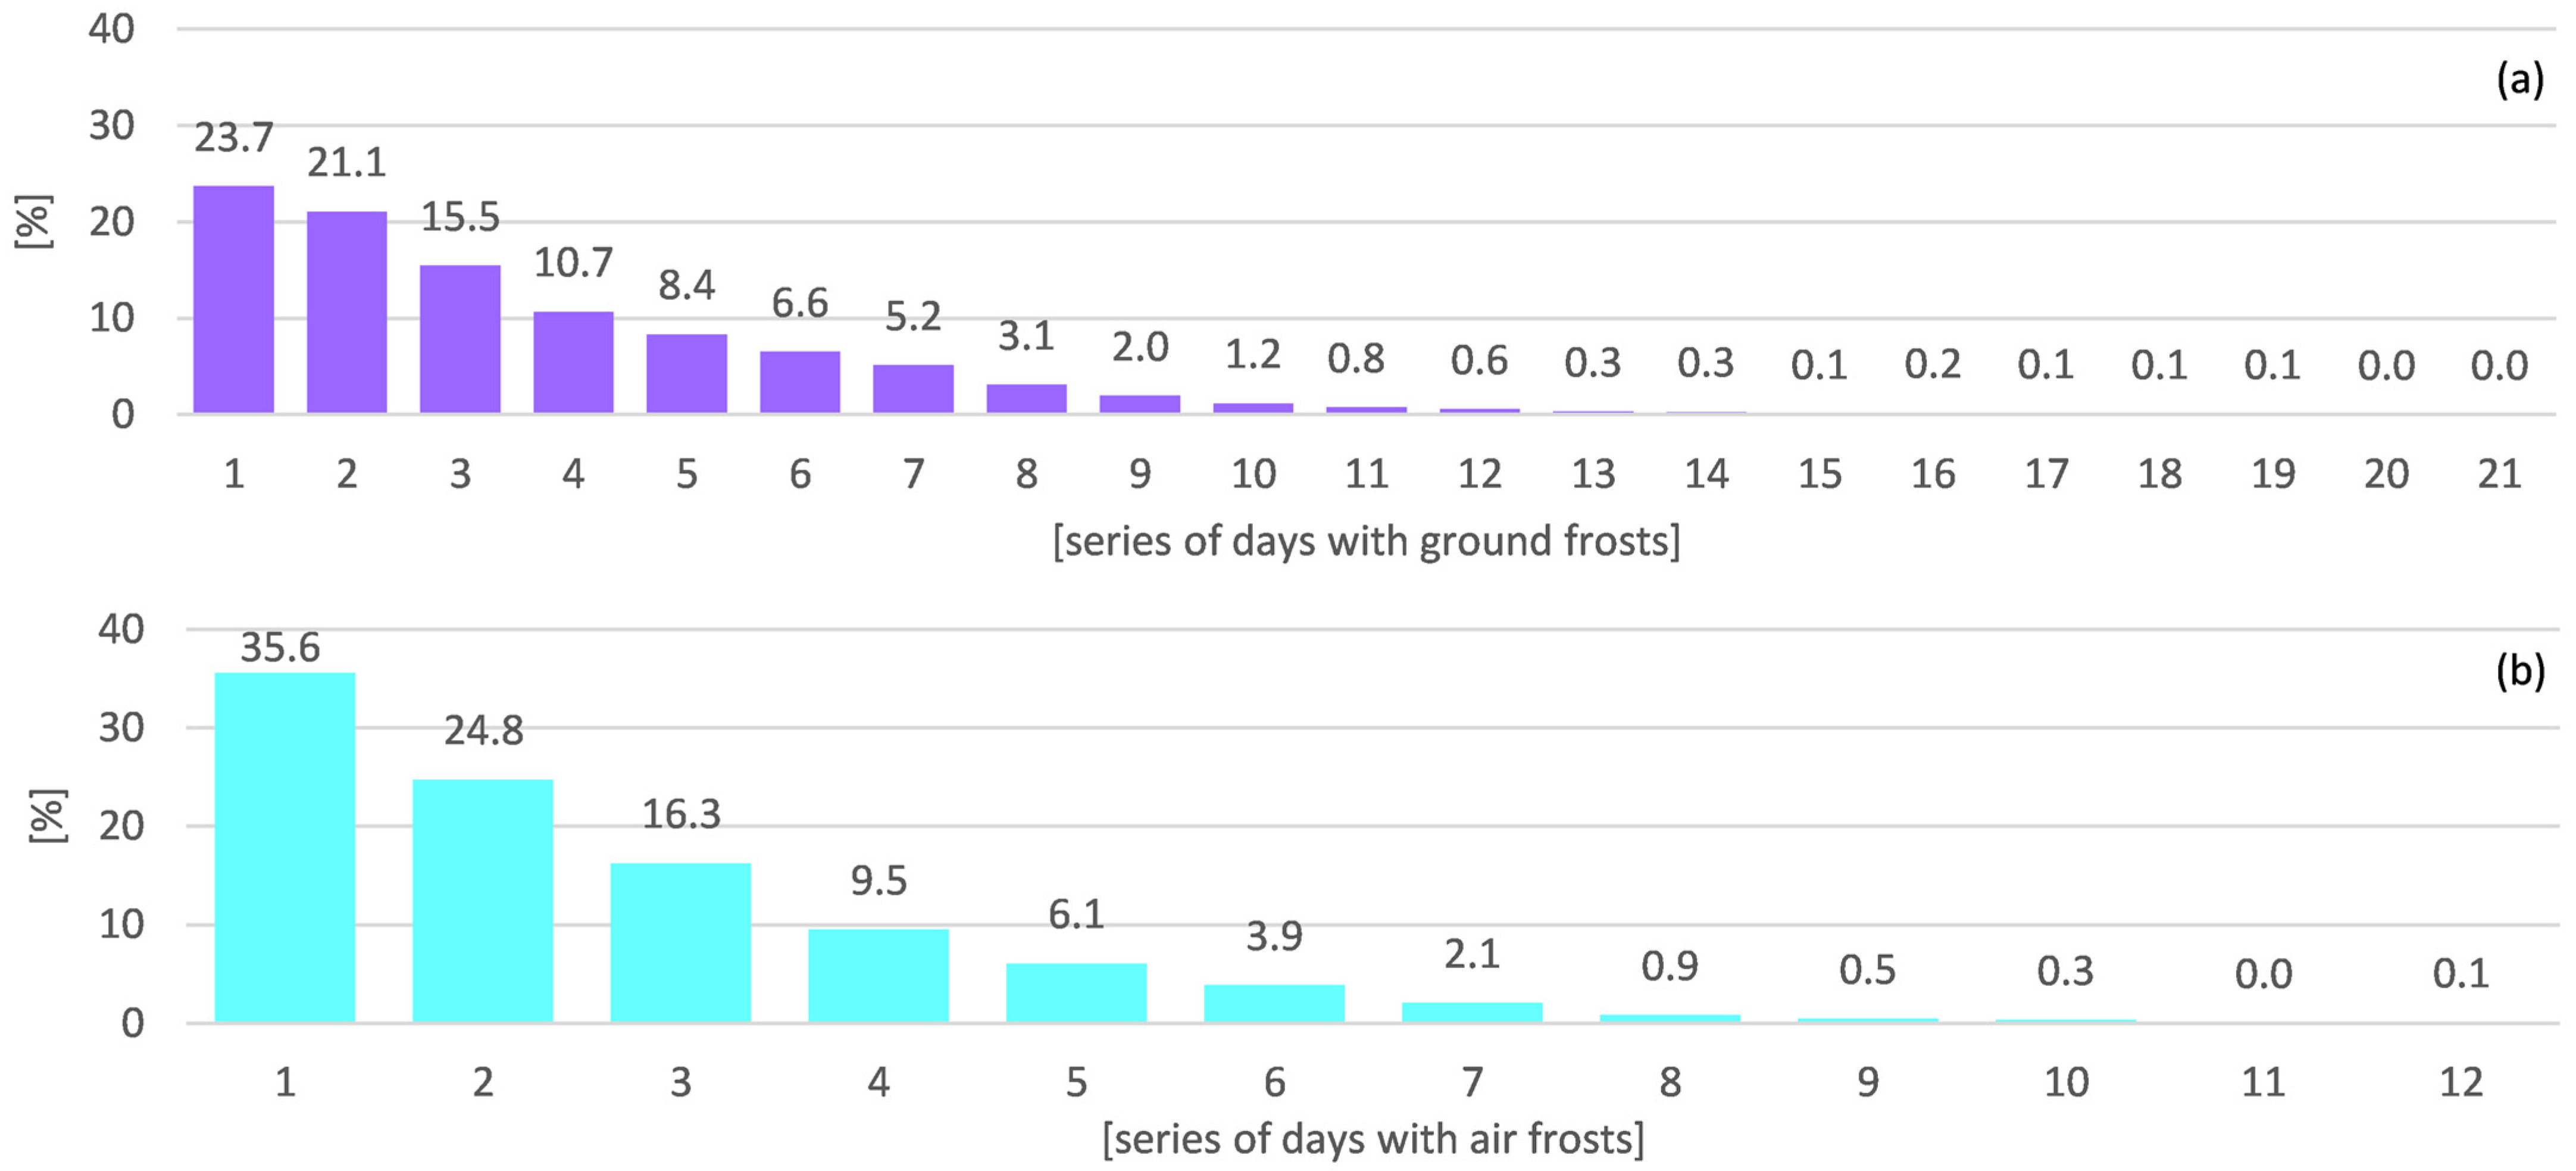
Generally, in the climatic conditions of Poland, ground frosts occur as a one-day-long event (23.7%) and in a series of two (21.1%) or three days (15.5%), yet ground frosts occur in a series of 4 days and show a higher frequency of occurrence than air frosts. Similarly, air frosts occur as one-day-long events (35.6%) and in a series of two (24.8%) and three days (16.3%), very rarely in a series of 7 days and more (Figure 5). The longest series of days with frost is recorded in the south of Poland, and the shortest in the coastal zone.
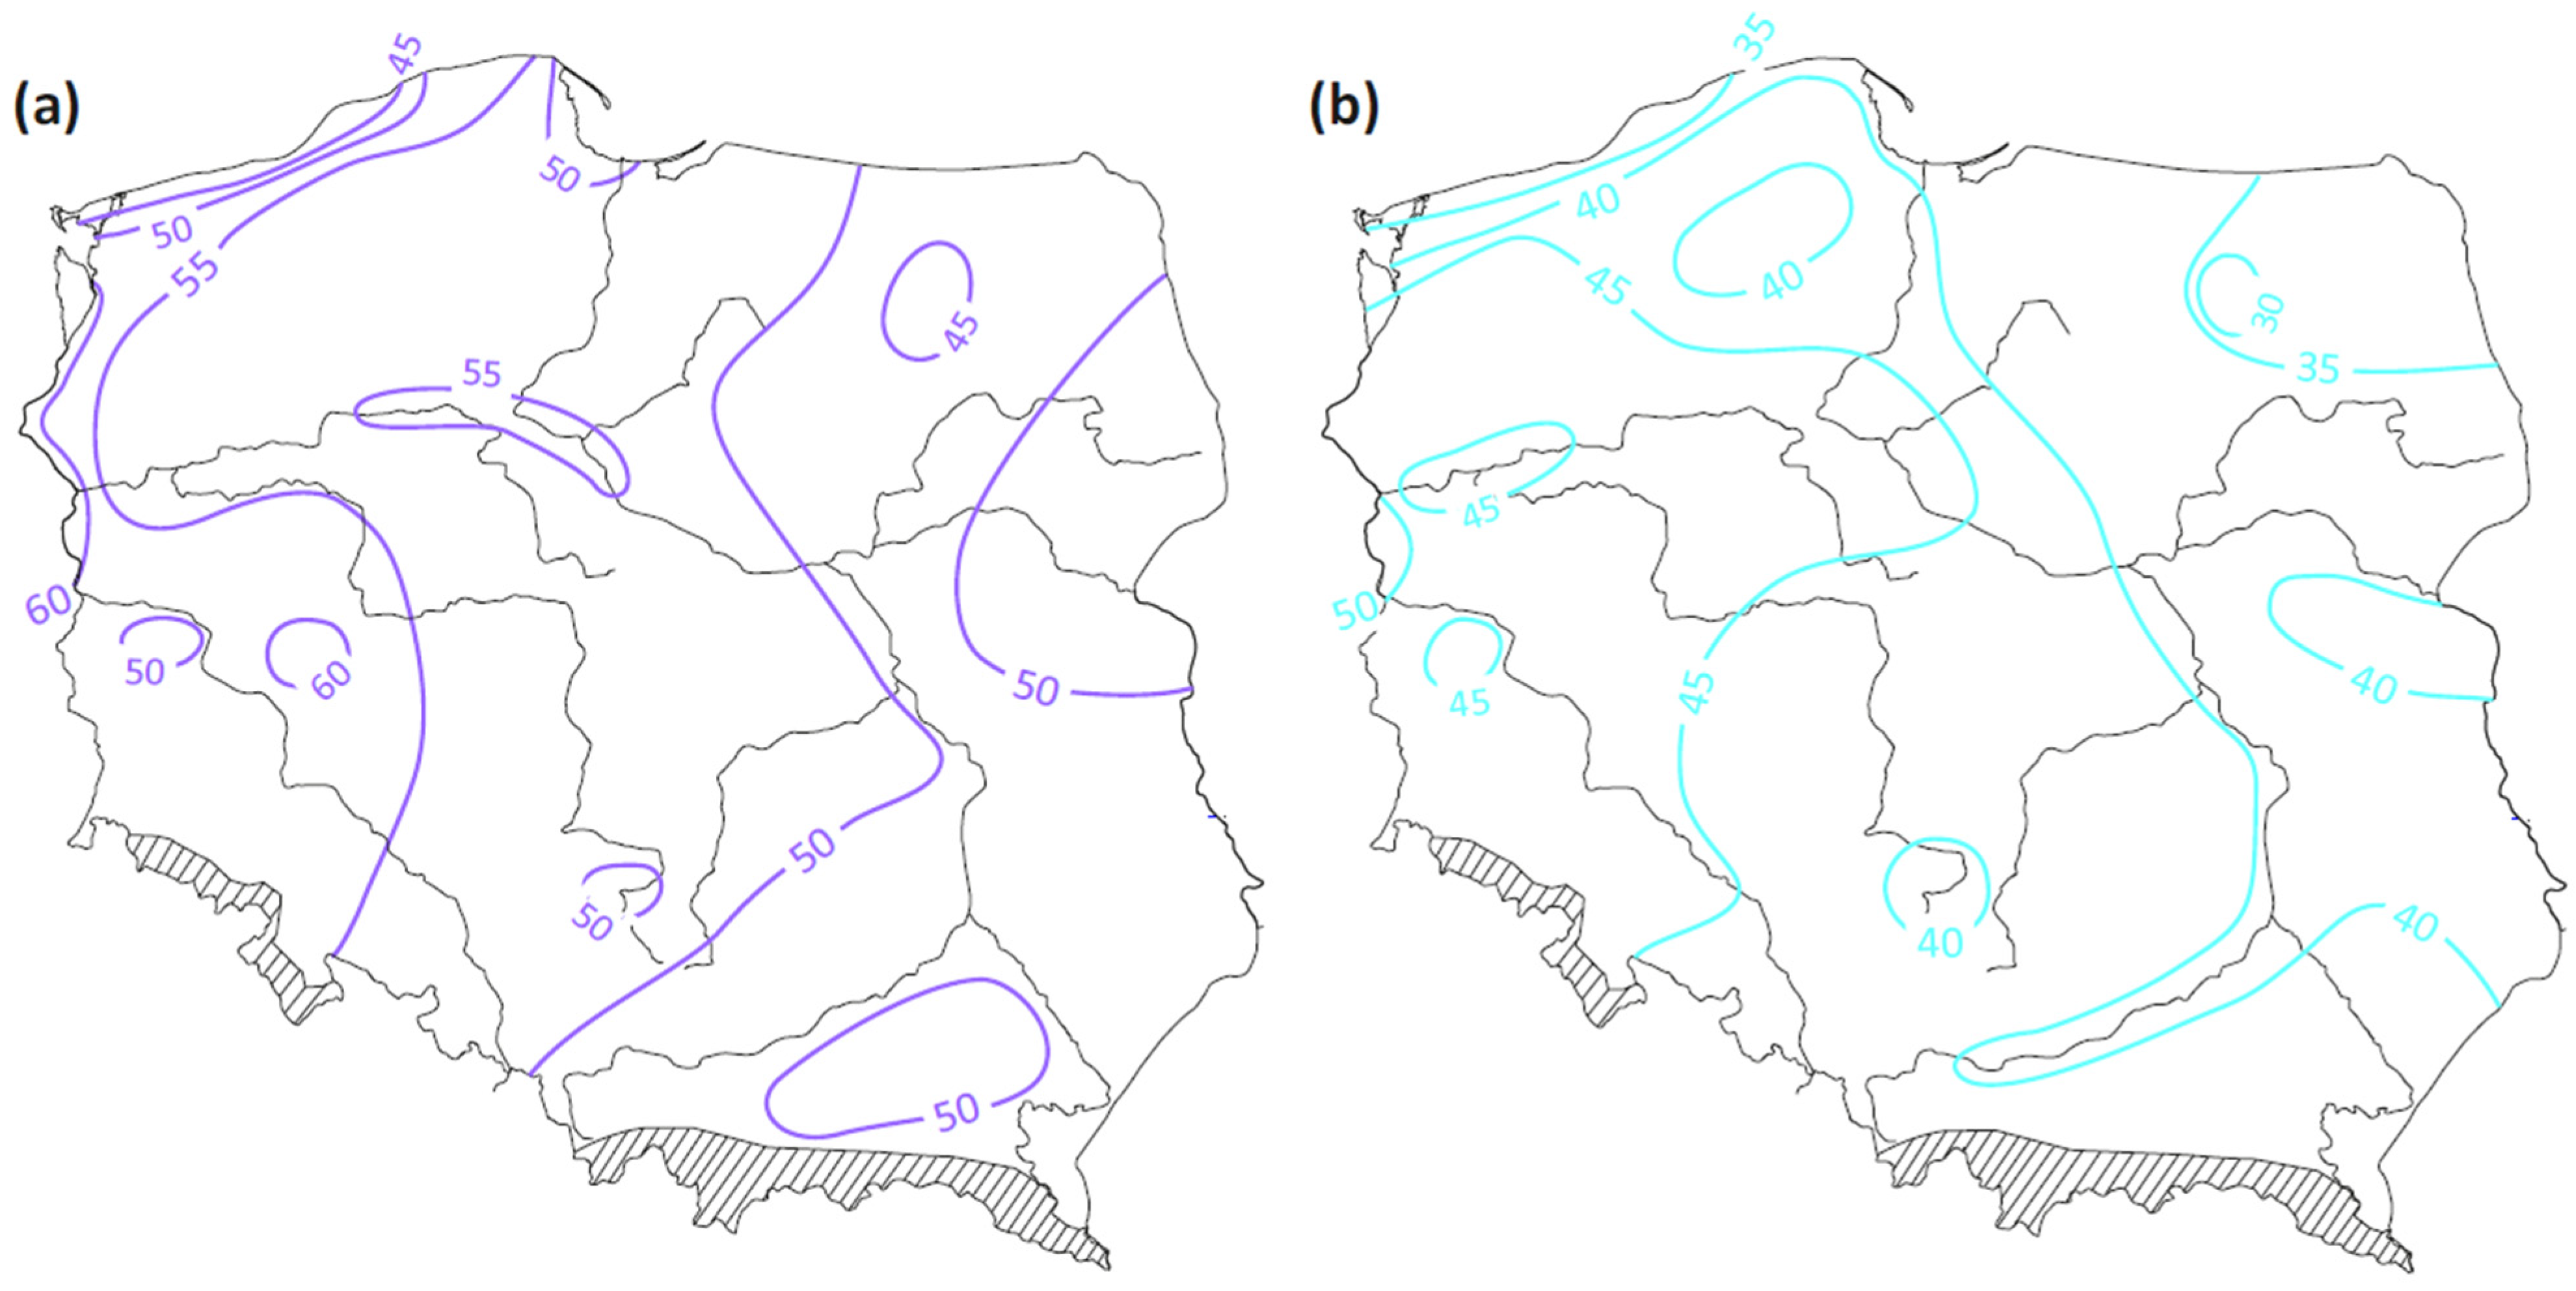
Figure 6 presents spatial variability of the probability of ground and air frost occurrence 20 days following the beginning of the growing season. As can be seen, the level of risk from frost varies across the country and is about 10% higher for ground frost. The occurrence of both ground and air frosts 20 days after the beginning of growing season is most likely in Szczecin (61 and 50%, respectively) and Słubice (63 and 58%, respectively). In turn, the west part of the Coast has the lowest probability values; for ground frosts, it is 40–43%, and for air frosts, it is 28–37%.
3.1. The Growing Season
Due to the ongoing warming, the length of the growing season (AT > 5 °C) in Poland has changed from, on average, 218 days in the first decade of the period 1971–1980 to 244 in the fifth decade (2011–2020), with mean length in the multiannual period under analysis (1971–2020) of 229 days (Figure 7). The greatest increase in the length of the growing season was found between the third and fourth decade—by 10 days, and between the fourth and fifth decade—by 12 days. In the last decade (2011–2020), the calculations show that the beginning of the growing season, on average, falls on March 18, the earliest—January 25, and the latest date of occurrence is April 14. The end of the growing season, as presented above, was recorded, on average, on November 17, the earliest—October 16, the latest date being December 30. It is noteworthy that with the lengthening growing season in Poland, there is an increase in the extremity of dates of the beginning and end of the growing season in particular years, which translates into a higher risk to the cultivation of thermophilic plants. According to Tomczyk and Szyga-Pluta [33], spatial variability of the duration of the growing season in Poland (1971–2010) ranged, on average, from 200 days in Suwałki to 237 days in Wrocław and was caused by the change in the date of the end of the growing season rather by the date of its beginning. This is confirmed by Koźmiński et al. [4] in a study covering a longer multiannual period (1971–2020) which shows that throughout Poland, the beginning of the growing season occurred earlier with a rate of 2.8 days over 10 years and the date of the end by 3.3 days over 10 years. Szyga-Pluta et al. [29] point to an increased intensity of the changes in both the beginning and end of the growing season in the long term, as compared with the short-term future. According to forecasts, the duration of the growing season outside the mountain areas is to vary from less than 255 day—the north-east regions—to more than 290 days—the south-west and west of Poland.
Horticulture and agriculture are particularly at risk of experiencing the effects of climate change. Most factors determining the success of agricultural production, such as the length of the growing season, the amount and distribution of precipitation, maximum and minimum temperature, frost occurrence, etc., are dependent on climate change. Gardeners and farmers have been facing new challenges and the need to adapt agricultural production to new conditions (e.g., selection of species/variety, sowing date, emerging risk due to plant diseases and pests, etc.) as well as develop and implement new solutions in rural areas, including improved water retention and flood protection [15,34,35,36,37,38].
3.2. Ground Frost at 5 cm agl
The determined high variability in the length of the growing season in individual years, particularly in spring, and significant changes in the dates of the occurrence of ground frosts, their intensity, and the number of days with ground frost increases the risk to cultivation. As is presented in Figure 8, days with ground frost are more frequently recorded in spring than in autumn, as manifested in the last 10 years. In the 50-year-long period under analysis, there was a decrease in the spring frost events till the fourth decade —from 18.9 to 16.2 days, followed by an increase in the last decade—18.2, with the mean for the said multiannual period 17.8. The number of days with ground frost in autumn shows less variability, the highest number of days was recorded in the third (10.6) and fourth (10.7) decades and the lowest in the fifth decade (9.3), with the mean for the entire multiannual period being 10.2 days. In spring, the last ground frost disappeared the earliest in the fifth decade (2011–2020), on average, 8 May—that is 12 days earlier than in the period 1971–1980. Similarly, in autumn, the first ground frosts occurred at the latest date in the fifth decade, on average 8 October, and at the earliest date on average 27 September—in the first 10 years. It is estimated by Koźmiński et al. [4] that the rate of increasingly earlier disappearance of ground frosts in spring, as observed in the last 50 years (1971–2020) in Poland, is 2.8 days over 10 days, and the increasingly later appearance of autumn frosts takes place at a rate of, on average, 3.0 days over 10 years. More importantly, the changes are statistically significant.
3.3. Air Frost at 200 cm agl
The average number of days with air frosts (200 cm agl) in spring shows a marked decrease in four consecutive decades—from 8.9 to 7.6—followed by an increase in the last decade—9.4 days. In turn, in autumn, the changes from one decade to another are small—from 4.6 to 5.3 (Figure 9). In spring, air frosts, similarly to ground frosts, were found to disappear at the latest date in the first decade (1971–1980)—on average, May 5, and in later years showed even earlier disappearance—in the period 2011–2020 on average April 25 (earlier by almost two weeks as compared with ground frosts). In autumn, the occurrence of air frost at the latest date in the 10-year-long period under analysis was recorded, on average, on October 18, that is, 10 days later than the ground frosts. Interestingly, there is an increase in the number of days with air frost in spring in the fifth decade and in autumn in the fourth decade (Figure 9), as is the case with ground frosts. Numerous authors point to the fact that the risk of frost, particularly of spring frost, is not decreasing and is in fact increasing despite the warming climate [1,2,6,7,8,14,39,40]. Updating the dates of the occurrence of frost in consecutive decades, just as in the case of ground frosts, it was found that there is a general acceleration in spring and deceleration in autumn together with an increase in span over particular years. According to Koźmiński et al. [4], in the period 1971–2020 in Poland, the earlier disappearance of the latest air frosts in spring was identified as 2 to 3 days over 10 years, and later occurrence of air frosts in autumn as 1 to 4 days over 10 years.
3.4. Frost-Free Period
Figure 10 presents the duration of air- and ground-frost-free period in the growing season. As the season transpires, the duration of the air-frost-free period in the analyzed 50-year-long period is, on average, 171 days, which is by as much as one month longer in comparison to the duration of the ground-frost-free period. In comparison, Bielec-Bąkowska et al. [17] found that in the period 1951–2015, the duration of the air-frost-free period in Poland was, on average, 166 days (averaged values from 20 stations). As for the 50-year-long period under analysis, the observed marked increase in the duration of the frost-free period, i.e., by approx. 3 weeks, with respect to both air as well as ground frost, is only consequential of increasingly earlier disappearance of frost in spring and increasingly later occurrence in autumn—as has already been discussed. The longest frost-free period was identified for the region of the Coast—more than 185 days without air frost, and more than 150 days without ground frost recorded in the growing season [3,4]. Generally, the length of the frost-free period was found to increase from the east to the west [16]. The length of the absolute frost-free period, which should be understood as the period in which there are no ground frosts or air frosts, was recorded in all of the analyzed years ranges in Poland, ranging from only 36 days (Jelenia Góra) to 115 days (Świnoujście) and for high frosts from 88 days (Słubice) to 153 days (Świnoujście), Figure 2 and Figure 3.
The shortest period without frost at 5cm agl, i.e., only 62 days, was recorded in 1983 in Łeba where the last spring frost was observed at a very late date—24 June, and the first autumn frost occurred as early as 26 August. In turn, the shortest period without air frost, i.e., 93 days, was recorded in 1991 in Kłodzko (the last spring frost on June 6 and the first autumn frost on 8 September). By far the longest frost-free period of the duration of 312 days, owing to lack of air frost altogether that year, was recorded in Świnoujście in 2006—the duration was determined by the dates of the beginning and end of the growing season—Figure 10. It is noteworthy that in 2006 in Świnoujście, ground frosts were in fact recorded at 10 frost events, and the frost-free period of 204 days in duration was the second-longest recorded period in that station in the 50-year-long period under analysis.
3.5. Potential Risk to Crops due to Ground Frost in the Growing Season
Low potential risk is identified, generally, in the central and western part of the coast and, additionally, in several meteorological stations (Gorzów, Zielona Góra, and Częstochowa) located in favorable physiographic conditions. The end of frost falls, on average, on May 3, and the beginning in autumn on October 15. The average number of days with ground frost throughout the growing season, for this group of clusters, amounts to 18.1 showing fluctuations between particular stations from 15.0 to 24.0 days. The average duration of the frost-free period is 166 days (Figure 11a, Table 1a).
Medium potential risk was identified mainly in the central and southern parts of Poland. In spring, ground frosts in this area disappear, on average, on 12 May, and in autumn, the beginning falls on 1 October with the average duration of the frost-free period being 142 days. The average number of days with frost in this group of stations is 25.7.
High potential risk due to ground frost in the growing season is mainly identified in Lower Silesia with the average number of days with frost being 33.9. In this cluster (marked in red), vegetation starts at the earliest, on average, on 18 March and the last frosts disappear at the latest, on average, 56 days after the beginning of vegetation.
Very high potential risk due to frost occurs in the north-east of Poland and, locally, in Pomerania and the Sudetic Foreland. The last spring frosts end, on average, on 24 May and begin in autumn on 23 September. The extreme dates in spring are between 16 May and 5 June and in autumn between 18 September and 26 September. The average duration of the frost-free period is only 120 days. The average number of days with frost is 32.3 and, within this group, it ranges from 26.9 to 42.0 (Figure 11a, Table 1a).
Table 1b presents additionally developed values of variables determining the potential risk due to ground frost during the growing season in the period of the last 10 years (2011–2020). As transpires from the data presented, in comparison with the main study period, i.e., 1971–2020, all clusters manifest earlier beginning of the growing season (from 6 to 9 days) as well as later disappearance of spring frost with respect to the beginning of the growing season (from 1 to 4 days).
3.6. Potential Risk to Crops due to Ground Frosts in Spring
The applied cluster method, with respect to ground frosts in spring, allowed for determining the 4 groups of stations with varied potential risks to crops due to ground frosts. Generally, the spatial distribution of the separated clusters, especially cluster III, is very similar to the above-described distribution for the entire growing season. The stations belonging to clusters of low-risk are markedly scattered throughout the area of Poland. The area with medium frost risk (marked in blue) occurs almost throughout the country (except for southwestern Poland) with the average number of days with the said phenomenon being 17 days. Stations with high risk are characterized, on average, by the earliest start of vegetation (March 19). The areas of very high frost risk (marked in black) are scattered and were mainly identified in the Pomerania and the Sudetic Foreland where the average number of days with ground frosts in spring amounts to 21.5 (Figure 11b and Table 2a).
Noteworthy is the almost identical number of days that elapse on average from the beginning of vegetation to the disappearance of the last spring frosts, the number of spring frosts, and the probability for areas III and IV. The risk in cluster III results primarily from the very early start of the vegetation period. In turn, the dispersion of stations in cluster IV reflects the influence of local topography, which in particular determines the occurrence of ground frost.
Table 2b presents a compilation of values determining the potential risk due to ground frost in spring in the last decade 2011–2020. The analysis of particular characteristics shows persistent threat due to frost in all identified areas.
3.7. Potential Risk to Crops due to Air Frosts in the Growing Season
Low potential risk (marked in green) due to air frosts in the growing season (Figure 11c, Table 3) is found along the coast and in stations located in favorable physiographic conditions such as on high ground—Zielona Góra. The beginning of the growing season identified in this cluster of stations falls, on average, on 24 March, the end—12 November. In turn, the last spring frosts end, on average, on 20 April, and the first autumn frosts start on 22 October, with the average number of days with frost in the entire growing season amounting to 8.7. The duration of the frost-free period is, on average, 189 days (Figure 11c, Table 3a).
Medium frost risk (marked in blue) was identified in stations located in the north-eastern, eastern, and central areas of Poland. The beginning of the growing season for this group of stations falls, on average, on 30 March, and ends on 4 November. The last spring frosts disappear on average on 29 April, and the first occurs on 11 October. The number of days with air spring and autumn frosts amounts to, on average, 12.5 days, however, in particular stations in this group of clusters it ranges from 8.3 to 16.2 days. The duration of the frost-free period is, on average, 166 days.
High potential frost risk (marked in red) was identified in the western and southern areas of Poland. The average beginning of the growing season falls on 19 March, and the end on 12 November. The last spring frost disappears on 26 April and the first autumn frosts occur, on average, on 15 October, yet the frost-free period lasts 172 days. The number of days with frost amounts to, on average, 14.7 days, and in this group of stations, the extreme values range from 11.9 to 17.8 days.
Very high potential risk due to frost (marked in black) occurs in the Sudetic Foreland and, locally, in unfavorable physiographic conditions such as river valleys (Lębork, Piła, Toruń). The beginning of the growing season is recorded, on average, on 27 March and the end on 7 November. On average, the last spring frosts end on 6 May (i.e., as much as 40 days after the beginning of the growing season) and the first autumn frosts occur on 7 October, thus the frost-free period lasts on average 154 days. The average number of days with frost is 17.2 (Figure 11c, Table 3a).
For the purpose of illustrating the most relevant threat, similarly to the aforementioned cases, air frost was developed in terms of variables characterizing the potential risk in the growing season during the period of the last 10 years—Table 3b. In all clusters, similarly to the case of ground frost, despite increasingly longer frost-free periods, air frost tends to disappear later in spring and their number remains at a comparable level (cluster I and II) or there is a slight increase in their occurrence (cluster III and IV) against the multiannual period of 1971–2020.
3.8. Potential Risk to Crops due to Air Frosts in Spring
The spatial distribution of the identified clusters of stations with different levels of potential risk due to spring air frost is very similar to the aforementioned distribution for the entire growing season. Features describing the variability of frosts, i.e., the dates of the last spring frosts expressed in the number of days from the beginning of the growing season, the number of days with spring frost, and the probability of frost occurrence 20 days after the beginning of the growing season, have the lowest values in the cluster with low risk and gradually increase in subsequent clusters (Figure 11d, Table 4a). It is noteworthy that the probability of frost occurrence in cluster III is high, almost identical to that in cluster IV. The beginning of the growing season shows a significant impact on the level of risk due to spring frost, with the earlier dates of the start of vegetation causing greater potential risk to crops with high thermal requirements.
Table 4b presents the potential risk due to spring air frost in the last decade (2011–2020) of the period under study. Again, despite the observed warming, the enduring risk due to frost is confirmed, and in the case of clusters III and IV, owing to the noticeable higher number of days with frost and increased probability, it can even be stated that the risk is increasing.
4. Conclusions
The observed acceleration of the dates of the beginning of the growing season (AT > °C) favors the earlier start of vegetation when the occurrence of frost in early spring is high. In the climatic conditions of Poland, in the years 1971–2020, frost is most frequently recorded in the second and the first decade of April in spring and in the third and second decade of October in autumn, with spring frost being recorded far more frequently than autumn frost. In the thermal growing season, on average, there are 28 days with ground frost and 13.3 days with air frost. Frosts occur mainly as one-day-long events and in a series of two or three days, very rarely in a series of more than 7 days. In spring, the last ground frost disappears, on average, on a country scale, on May 14—and air frost on 27 April. In turn, the first autumn ground frost is recorded, on average, on 1 October, and air frost on 14 October. Depending on the region of Poland, the last ground frosts disappear, on average, 32 to 64 days after the beginning of the growing season, and air frosts—from 19 to 45 days. In the multiannual period under analysis, there is an earlier disappearance of frost in spring and a later occurrence in autumn, which in turn leads to the extension of the frost-free period. The duration of the air-frost-free period amounts to, on average, 171 days and is by as much as a month longer in comparison with the frost-free period with respect to ground frost.
Varied of features of frost in the identified clusters represent different potential risks to agricultural crops due to frost.
High risk of frost, primarily due to a particularly early start of vegetation, is identified in the western and southern parts of Poland. The stations characterized by very high potential risk of frost are scattered throughout the country and their local topographic conditions are unfavorable, for example, river valleys (Lębork, Piła, Toruń) in the Sudeten Foothills. Very high risk in the growing season, but only due to ground frost, is also recorded in the north-east of Poland. The stations with medium potential risk constitute the largest group and, in the case of ground frost, their largest numbers are found in the central part of the country whereas in the case of air frosts—in the north-eastern part of Poland. Low potential risk is found in the central and western parts of the Coasts, as well as in stations located in favorable physiographic conditions such as water reservoirs, hill slopes, and favorable area exposure.
The obtained spatially coherent picture of the risk of frost in four variants, despite having taken into account different input data, confirms a strong consistency between air and ground frosts and allows the conclusion that the adopted classification methodology is correct.
Despite the ongoing warming of the climate, frosts remain a current risk to crops.
Author Contributions
Conceptualization, J.N.-L., A.M., C.K. and B.M.; Data curation, J.N.-L. and A.M.; Formal analysis, J.N.-L., A.M., C.K. and B.M.; Methodology J.N.-L. and A.M.; Resources, J.N.-L. and A.M.; Software, J.N.-L. and A.M.; Visualization, A.M., J.N.-L.; Writing—original draft J.N.-L., C.K. and B.M.; Writing—review and editing, J.N.-L. and A.M. All authors have read and agreed to the published version of the manuscript.
Funding
This research received no external funding.
Data Availability Statement
https://danepubliczne.imgw.pl/data/dane_pomiarowo_obserwacyjne/ (accessed on 15 April 2021).
Conflicts of Interest
The authors declare no conflicts of interest.
References
- Vitasse, Y.; Rebetez, M. Unprecedented risk of spring frost damage in Switzerland and Germany in 2017. Clim. Change 2018, 149, 233–246. [Google Scholar] [CrossRef]
- Vitasse, Y.; Schneider, L.; Rixen, C.; Christen, D.; Rebetez, M. Increase in the risk of exposure of forest and fruit trees to spring frosts at higher elevations in Switzerland over the last four decades. Agric. For. Meteorol. 2018, 248, 60–69. [Google Scholar] [CrossRef]
- Koźmiński, C.; Nidzgorska-Lencewicz, J.; Mąkosza, A.; Michalska, B. Ground Frosts in Poland in the Growing Season. Agriculture 2021, 11, 573. [Google Scholar] [CrossRef]
- Koźmiński, C.; Mąkosza, A.; Nidzgorska-Lencewicz, J.; Michalska, B. Air Frosts in Poland in the Thermal Growing Season (AT > 5 °C). Agriculture 2023, 13, 1228. [Google Scholar] [CrossRef]
- Faust, E.; Herbold, J. Spring frost losses and climate change—Not a contradiction in terms. Clim. Change 2018. Available online: https://www.munichre.com/topics-online/en/climate-change-and-natural-disasters/climate-change/spring-frost-losses-climate-change-2018.html (accessed on 1 September 2023).
- Augspurger, C.K. Reconstructing patterns of temperature, phenology, and frost damage over 124 years: Spring damage risk is increasing. Ecology 2013, 94, 41–50. [Google Scholar] [CrossRef]
- Liu, Q.; Piao, S.; Janssens, I.A.; Fu, Y.; Peng, S.; Lian, X.; Ciais, P.; Ranga, B.; Myneni, R.B.; Peñuelas, J.; et al. Extension of the growing season increases vegetation exposure to frost. Nat. Commun. 2018, 9, 426. [Google Scholar] [CrossRef] [PubMed]
- Ma, Q.; Huang, J.G.; Hänninen, H.; Berninger, F. Divergent trends in the risk of spring frost damage to trees in Europe with recent warming. Glob. Change Biol. 2019, 25, 351–360. [Google Scholar] [CrossRef] [PubMed]
- Fu, Y.; Zhao, H.; Piao, S.; Peaucelle, M.; Peng, S.; Zhou, G.; Ciais, P.; Huang, M.; Menzel, A.; Penuelas, J.; et al. Declining global warming effects on the phenology of spring leaf unfolding. Nature 2015, 526, 104–107. [Google Scholar] [CrossRef] [PubMed]
- Wieteska, S. The risk of frosts in the polish zone climate. Folia Oeconomica Acta Univ. Lodz. 2011, 259, 143–157. (In Polish) [Google Scholar]
- Graczyk, D.; Szwed, M. Changes in the Occurrence of Late Spring Frost in Poland. Agronomy 2020, 10, 1835. [Google Scholar] [CrossRef]
- Doroszewski, A.; Wróblewska, E.; Jóźwicki, T.; Mizak, K. Evaluation of damage to fruit and horticultural plants caused by frosts in May 2011. Acta Agrophys. 2013, 20, 269–281. (In Polish) [Google Scholar]
- Lamichhane, J.R. Rising risks of late-spring frosts in a changing climate. Nat. Clim. Change 2021, 11, 554–555. [Google Scholar] [CrossRef]
- Zohner, C.M.; Mo, L.; Renner, S.S.; Svenning, J.-C.; Vitasse, Y.; Benito, B.M.; Ordonez, A.; Baumgarten, F.; Bastin, J.-F.; Sebald, V.; et al. Late-spring frost risk between 1959 and 2017 decreased in North America but increased in Europe and Asia. Proc. Natl. Acad. Sci. USA 2020, 117, 12192–12200. [Google Scholar] [CrossRef]
- Lhotka, O.; Brönnimann, S. Possible increase of vegetation exposure to spring frost under climate change in Switzerland. Atmosphere 2020, 11, 391. [Google Scholar] [CrossRef]
- Tomczyk, A.; Szyga-Pluta, K.; Majkowska, A. Frost periods and frost free periods in Poland and neighbouring countries. Open Geosci. 2015, 7, 812–823. [Google Scholar] [CrossRef]
- Bielec-Bąkowska, Z.; Piotrowicz, K.; Krępa-Adolf, E. Trends in the frost-free season with parallel circulation and air mass statistics in Poland. Idojaras Q. J. Hung. Meteorol. Serv. 2018, 122, 375–392. [Google Scholar] [CrossRef]
- Dragańska, E.; Rynkiewicz, I.; Panfil, M. Frost frequency and intensity in north-eastern Poland in 1971–2000. Acta Agrophys. 2004, 3, 35–42. (In Polish) [Google Scholar]
- Flis-Olszewska, E. Days with high and ground frosts and frost-free periods in the context of air temperature changes in the period 1960–2019 in Lublin. Agron. Sci. 2022, LXXVII, 79–91. (In Polish) [Google Scholar] [CrossRef]
- Kolasiński, J. Przymrozki wiosenne i jesienne—Występowanie i tendencje zmian w okresie 1966–2005 (na przykładzie Falent). Prz. Geof. 2008, 53, 303–310. [Google Scholar]
- Wypych, A.; Ustrnul, Z.; Sulikowska, A.; Chmielewski, F.-M.; Bochenek, B. Spatial and temporal variability of the frost-free season in Central Europe and its circulation background. Int. J. Climatol. 2017, 37, 3340–3352. [Google Scholar] [CrossRef]
- Tomczyk, A. Spring and autumn frosts, and a frost-free period in the Great Poland Lowland in the years 1981–2010. In Współczesne Problemy i Kierunki Badawcze w Geografii; Instytut Geografii i Gospodarki Przestrzennej UJ Kraków: Kraków, Poland, 2015; Volume 3, pp. 245–256. (In Polish) [Google Scholar]
- Dudek, S.; Żarski, J.; Kuśmierek-Tomaszewska, R. Trends in the occurrence of ground frosts in the region of Bydgoszcz. Water Environ. Rural Areas 2012, 2, 93–106. (In Polish) [Google Scholar]
- Gumiński, R. Próba wydzielenia dzielnic rolniczo-klimatycznych w Polsce. Przegl. Met. I Hydr. 1948, 1, 7–20. [Google Scholar]
- Czarnecka, M.; Nidzgorska-Lencewicz, J. Application of cluster analysis in defining the meteorological conditions shaping the variability of PM10 concentration. Rocz. Ochr. Śr. 2015, 17, 40–61. [Google Scholar]
- Coe, D.; Barlow, M.; Agel, L.; Colby, F.; Skinner, C.; Qian, J. Clustering Analysis of Autumn Weather Regimes in the Northeast United States. J. Clim. 2021, 34, 7587–7605. [Google Scholar] [CrossRef]
- Piotrowicz, K.; Ciaranek, D. A selection of weather type classification systems and examples of their application. Theor. Appl. Climatol. 2020, 140, 719–730. [Google Scholar] [CrossRef]
- Kejna, M.; Pospieszyńska, A. Variability in the occurrence of thermal seasons in Poland in 1961–2020. Meteorol. Appl. 2023, 30, 2132. [Google Scholar] [CrossRef]
- Szyga-Pluta, K.; Tomczyk, A.M.; Piniewski, M.; Eini, M.R. Past and future changes in the start, end, and duration of the growing season in Poland. Acta Geophys. 2023, 71, 3041–3055. [Google Scholar] [CrossRef]
- Tomczyk, A.M.; Szyga-Pluta, K.; Bednorz, E. Occurrence and synoptic background of strong and very strong frost in spring and autumn in Central Europe. Int. J. Biometeorol. 2020, 64, 59–70. [Google Scholar] [CrossRef]
- Więcław, M. Daily course of air temperaturę in Bydgoszcz in days with spring and autumn frosts depending on kind of air mass. Pr. Stud. Geogr. 2011, 47, 425–431. [Google Scholar]
- Ustrnul, Z.; Wypych, A.; Winkler, J.A.; Czekierda, D. Late spring freezes in Poland in relation to atmospheric circulation. Quaest. Geogr. 2014, 33, 165–172. [Google Scholar] [CrossRef]
- Tomczyk, A.; Szyga Pluta, K. Growing seasons in Poland in the period 1971–2010. Prz. Geogr. 2016, 88, 75–86. (In Polish) [Google Scholar] [CrossRef]
- Rigby, J.R.; Porporato, A. Spring frost risk in a changing climate. Geophys. Res. Lett. 2008, 35, 12703. [Google Scholar] [CrossRef]
- Olesen, J.E.; Trnka, M.; Kersebaum, K.C.; Skjelvag, A.O.; Seguin, B.; Peltonen-Sainio, P.; Rossi, F.; Kozyra, J.; Micale, F. Impacts and adaptation of European crop production systems to climate change. Eur. J. Agron. 2011, 34, 96–112. [Google Scholar] [CrossRef]
- Wypych, A.; Sulikowska, A.; Ustrnul, Z. Variability of growing degree days in Poland in response to ongoing climate changes in Europe. Int. J. Biometeorol. 2017, 61, 49–59. [Google Scholar] [CrossRef] [PubMed]
- Karaczun, Z.M.; Swacha, P.; Herudziński, T. Polskie ogrodnictwo wobec wyzwań polityki klimatycznej—Percepcja, wiedza i działania sadowników rejonu sandomierskiego. Studia BAS 2023, 2, 171–190. [Google Scholar] [CrossRef]
- Piwowar, A. Water Shortage in Polish Agriculture and Its Eonomic Consequences. In Proceedings of the Hradec Economic Days 2023, Hradec Kralove, Czech Republic, 13–14 April 2023; pp. 519–526. [Google Scholar] [CrossRef]
- Meier, M.; Fuhrer, J.; Holzkämper, A. Changing risk of spring frost damage in grapevines due to climate change? A case study in the Swiss Rhone Valley. Int. J. Biometeorol. 2018, 62, 991–1002. [Google Scholar] [CrossRef]
- Zohner, C.M.; Rockinger, A.; Renner, S.S. Increased autumn productivity permits temperate trees to compensate for spring frost damage. New Phytol. 2019, 221, 789–795. [Google Scholar] [CrossRef]
Figure 1.
Location of meteorological stations in Poland.

Figure 2.
Basic characteristics of the growing season (AT > 5 °C) and ground frost at IMGW-PIB stations in Poland. Years 1971–2020.
Figure 2.
Basic characteristics of the growing season (AT > 5 °C) and ground frost at IMGW-PIB stations in Poland. Years 1971–2020.

Figure 3.
Basic characteristics of the growing season (AT > 5 °C) and air frost at IMGW-PIB stations in Poland. Years 1971–2020.
Figure 3.
Basic characteristics of the growing season (AT > 5 °C) and air frost at IMGW-PIB stations in Poland. Years 1971–2020.

Figure 4.
Frequency of ground and air frosts in Poland by decade in the growing season (AT > 5 °C). Years 1971–2020.
Figure 4.
Frequency of ground and air frosts in Poland by decade in the growing season (AT > 5 °C). Years 1971–2020.

Figure 5.
Series of days with ground (a) and air (b) frosts in Poland in the growing season (AT > 5 °C). Years 1971–2020.
Figure 5.
Series of days with ground (a) and air (b) frosts in Poland in the growing season (AT > 5 °C). Years 1971–2020.

Figure 6.
Probability of ground frosts (a) and air frosts (b) 20 days after the beginning of the growing season in Poland. Years 1971–2020.
Figure 6.
Probability of ground frosts (a) and air frosts (b) 20 days after the beginning of the growing season in Poland. Years 1971–2020.

Figure 7.
Dates of the beginning, end, and duration of the growing season (AT > 5 °C) in Poland by decades of the period 1971–2020.
Figure 7.
Dates of the beginning, end, and duration of the growing season (AT > 5 °C) in Poland by decades of the period 1971–2020.

Figure 8.
The average number of days and the dates of occurrence of ground frosts in the growing season (AT > 5 °C) by decades of the period 1971–2020.
Figure 8.
The average number of days and the dates of occurrence of ground frosts in the growing season (AT > 5 °C) by decades of the period 1971–2020.

Figure 9.
The average number of days and the dates of occurrence air frosts in the growing season (AT > 5 °C) by decades of the period 1971–2020.
Figure 9.
The average number of days and the dates of occurrence air frosts in the growing season (AT > 5 °C) by decades of the period 1971–2020.

Figure 10.
Duration of the frost-free period during growing season (AT > 5 °C) in Poland by decades of the period 1971–2020.
Figure 10.
Duration of the frost-free period during growing season (AT > 5 °C) in Poland by decades of the period 1971–2020.

Figure 11.
Spatial distribution of the potential risk of ground and air frosts during all growing seasons (AT > 5 °C) and spring. Years 1971–2020.
Figure 11.
Spatial distribution of the potential risk of ground and air frosts during all growing seasons (AT > 5 °C) and spring. Years 1971–2020.


Table 1.
Potential risk to crops due to ground frost in the growing season.
| (a) Years 1971–2020 | ||||||||
| Cluster | Start date of growing season AT > 5 °C | End date of growing season AT > 5 °C | End date of spring frosts (days) * | Start date of autumn frosts (days) * | Frost–free period | Number of days with frosts during the growing season | Cases (%) | |
| I | a b | 25 Mar 20–30 Mar | 14 Nov 8–19 Nov | 3 May (39) 25 Apr–7 May (32–48) | 15 Oct (204) 7–23 Oct (200–211) | 166 154–175 | 18.1 15.6–24.2 | 7 (13.5) |
| II | a b | 26 Mar 22 Mar–2 Apr | 7 Nov 2–14 Nov | 12 May (47) 1–19 May (38–54) | 1 Oct (189) 26 Sep–13 Oct (181–199) | 142 131–156 | 25.7 21.1–33.1 | 23 (44.2) |
| III | a b | 18 Mar 15–21 Mar | 13 Nov 10–16 Nov | 13 May (56) 6–23 May (49–63) | 1 Oct (197) 24 Sep–5 Oct (188–202) | 140 123–148 | 33.9 30.4–40.9 | 10 (19.2) |
| IV | a b | 30 Mar 25 Mar–6 Apr | 5 Nov 27 Oct–15 Nov | 24 May (55) 16 May–5 Jun (48–64) | 23 Sep (177) 18–26 Sep (168–182) | 120 111–129 | 32.3 26.9–42.0 | 12 (23.1) |
| (b) Years 2011–2020 | ||||||||
| Cluster | Start date of growing season AT > 5 °C | End date of growing season AT > 5 °C | End date of spring frosts (days) * | Start date of autumn frosts (days) * | Frost–free period | Number of days with frosts during the growing season | Cases (%) | |
| I | a b | 16 Mar 12–21 Mar | 23 Nov 16–30 Nov | 28 Apr (43) 22 Apr–4 May (36–54) | 24 Oct (223) 13 Oct–5 Nov (209–232) | 181 168–198 | 16.8 11.7–22.6 | 7 (13.5) |
| II | a b | 20 Mar 15–28 Mar | 15 Nov 9–24 Nov | 7 May (48) 22 Apr–16 May (35–60) | 7 Oct (202) 27 Sep–24 Oct (191–219) | 153 134–173 | 25.1 13.5–34.3 | 23 (44.2) |
| III | a b | 11 Mar 6–16 Mar | 22 Nov 17–26 Nov | 7 May (57) 2–18 May (51–66) | 10 Oct (213) 1–15 Oct (202–220) | 155 135–161 | 32.6 27.2–40.9 | 10 (19.2) |
| IV | a b | 23 Mar 19–31 Mar | 13 Nov 3–25 Nov | 20 May (58) 11 May–4 Jun (51–75) | 29 Sep (190) 22 Sep–11 Oct (180–202) | 131 122–140 | 33.6 27.9–41.0 | 12 (23.1) |
Potential risk in clusters: I Low, II Medium, III High, IV Very High; a mean; b min–max; * number of days counted from the begining of the growing season.
Table 2.
Potential risk to crops due to ground frosts in spring.
| (a) Years 1971–2020 | ||||||
| Cluster | Start date of growing season AT > 5 °C | End date of spring frosts (days) * | Number of days with frosts in spring | Probability of frosts occurrence 20 days after the start of the growing season | Cases (%) | |
| I | a b | 27 Mar 20 Mar–2 Apr | 4 May (38) 25 Apr–11 May (32–48) | 12.5 9.7–15.3 | 43.9 40.4–47.4 | 10 (19.2) |
| II | a b | 26 Mar 20 Mar–6 Apr | 17 May (48) 4–25 May (42–54) | 17.0 14.5–19.3 | 50.7 47.4–54.6 | 23 (44.2) |
| III | a b | 19 Mar 15–24 Mar | 14 May (56) 6–23 May (48–64) | 21.4 18.6–25.3 | 56.6 51.5–62.8 | 10 (19.2) |
| IV | a b | 28 Mar 25 Mar–3 Apr | 25 May (57) 18 May–5 Jun (53–63) | 21.5 19.1–26.0 | 56.3 54.2–59.5 | 9 (17.3) |
| (b) Years 2011–2020 | ||||||
| Cluster | Start date of growing season AT > 5 °C | End date of spring frosts (days) * | Number of days with frosts in spring | Probability of frosts occurrence 20 days after the start of the growing season | Cases (%) | |
| I | a b | 19 Mar 12–27 Mar | 28 Apr (41) 22 Apr–8 May (35–54) | 12.3 7.5–16.3 | 44.0 34.5–49.8 | 10 (19.2) |
| II | a b | 20 Mar 12–31 Mar | 9 May (50) 2–21 May (37–61) | 17.5 10.4–21.8 | 52.6 44.2–58.0 | 23 (44.2) |
| III | a b | 11 Mar 6–17 Mar | 7 May (57) 2–18 May (50–66) | 21.6 18.1–26.5 | 57.3 52.1–62.5 | 10 (19.2) |
| IV | a b | 21 Mar 17–27 Mar | 20 May (60) 10 May–4 Jun (52–75) | 23.0 18.6–27.1 | 60.3 54.5–68.4 | 9 (17.3) |
Potential risk in clusters: I Low, II Medium, III High, IV Very High; a mean; b min–max; * number of days counted from the begining of the growing season.
Table 3.
Potential risk to crops due to air frosts in the growing season.
| (a) Years 1971–2020 | ||||||||
| Cluster | Start date of growing season AT > 5 °C | End date of growing season AT > 5 °C | End date of spring frosts (days) * | Start date of autumn frosts (days) * | Frost–free period | Number of days with frosts during the growing season | Cases (%) | |
| I | a b | 24 Mar 20–30 Mar | 12 Nov 5–19 Nov | 20 Apr (26) 16–26 Apr (19–30) | 22 Oct (212) 16–30 Oct (205–220) | 189 180–204 | 8.7 5.6–11.0 | 12 (23.1) |
| II | a b | 30 Mar 25 Mar–6 Apr | 4 Nov 27 Oct–15 Nov | 29 Apr (31) 23 Apr–6 May (21–35) | 11 Oct (196) 1–21 Oct (181–205) | 166 149–181 | 12.5 8.3–16.2 | 18 (34.6) |
| III | a b | 19 Mar 15–23 Mar | 12 Nov 7–16 Nov | 26 Apr (38) 23–30 Apr (33–44) | 15 Oct (210) 7–18 Oct (205–215) | 172 161–177 | 14.7 11.9–17.8 | 13 (25.0) |
| IV | a b | 27 Mar 24–31 Mar | 7 Nov 2–12 Nov | 6 May (40) 30 Apr–12 May (37–45) | 7 Oct (194) 30 Sep–14 Oct (186–201) | 154 140–164 | 17.2 13.6–23.9 | 9 (17.3) |
| (b) Years 2011–2020 | ||||||||
| Cluster | Start date of growing season AT > 5 °C | End date of growing season AT > 5 °C | End date of spring frosts (days) * | Start date of autumn frosts (days) * | Frost–free period | Number of days with frosts during the growing season | Cases (%) | |
| I | a b | 16 Mar 12–21 Mar | 21 Nov 12–30 Nov | 16 Apr (31) 7–24 Apr (23–37) | 27 Oct (225) 15 Oct–12 Nov (211–240) | 197 178–217 | 8.6 5.7–12.7 | 12 (23.1) |
| II | a b | 23 Mar 17–31 Mar | 12 Nov 3–25 Nov | 27 Apr (35) 19 Apr–4 May (24–42) | 16 Oct (206) 2 Oct–7 Nov (194–226) | 175 160–194 | 12.9 7.1–17.5 | 18 (34.6) |
| III | a b | 12 Mar 6–17 Mar | 21 Nov 13–26 Nov | 25 Apr (44) 21–29 Apr (39–51) | 18 Oct (220) 11–26 Oct (212–229) | 176 167–186 | 16.0 11.6–18.9 | 13 (25.0) |
| IV | a b | 20 Mar 17–23 Mar | 15 Nov 9–23 Nov | 5 May (46) 25 Apr–11 May (39–50) | 11 Oct (205) 30 Sep–27 Oct (192–220) | 161 141–178 | 18.1 15.1–26.2 | 9 (17.3) |
Potential risk in clusters: I Low, II Medium, III High, IV Very High; a mean; b min–max; * number of days counted from the begining of the growing season.
Table 4.
Potential risk to crops due to air frosts in spring.
| (a) 1971–2020 | ||||||
| Cluster | Start date of growing season AT > 5 °C | End date of spring frosts (days) * | Number of days with frosts in spring | Probability of frosts occurrence 20 days after the start of the growing season | Cases (%) | |
| I | a b | 26 Mar 20 Mar–2 Apr | 21 Apr (26) 16–26 Apr (19–30) | 6.0 3.6–7.7 | 36.9 26.6–42.1 | 16 (30.8) |
| II | a b | 30 Mar 23 Mar–6 Apr | 30 Apr (32) 25 Apr–6 May (28–35) | 8.7 6.9–10.9 | 39.5 34.2–44.0 | 15 (28.8) |
| III | a b | 19 Mar 15–24 Mar | 26 Apr (38) 23–30 Apr (33–44) | 9.6 7.7–11.4 | 46.3 40.1–58.4 | 13 (25.0) |
| IV | a b | 27 Mar 25–31 Mar | 7 May (41) 3–12 May (38–45) | 11.6 9.9–15.3 | 46.7 43.0–50.2 | 8 (15.4) |
| (b) 2011–2020 | ||||||
| Cluster | Start date of growing season AT > 5 °C | End date of spring frosts (days) * | Number of days with frosts in spring | Probability of frosts occurrence 20 days after the start of the growing season | Cases (%) | |
| I | a b | 18 Mar 12–28 Mar | 17 Apr (30) 7–24 Apr (23–37) | 6.0 3.5–8.1 | 36.8 27.3–49.4 | 16 (30.8) |
| II | a b | 23 Mar 17–31 Mar | 29 Apr (37) 25 Apr–4 May (34–42) | 9.8 7.8–12.4 | 42.4 33.9–47.8 | 15 (28.8) |
| III | a b | 12 Mar 6–17 Mar | 25 Apr (44) 21–29 Apr (39–51) | 10.7 8.3–12.6 | 48.4 38.5–57.8 | 13 (25.0) |
| IV | a b | 20 Mar 17–23 Mar | 6 May (47) 30 Apr–6 May (41–50) | 13.2 11.4–17.1 | 52.5 48.7–56.8 | 8 (15.4) |
Potential risk in clusters: I Low, II Medium, III High, IV Very High; a mean; b min–max; * number of days counted from the begining of the growing season.
Disclaimer/Publisher’s Note: The statements, opinions and data contained in all publications are solely those of the individual author(s) and contributor(s) and not of MDPI and/or the editor(s). MDPI and/or the editor(s) disclaim responsibility for any injury to people or property resulting from any ideas, methods, instructions or products referred to in the content. |
© 2024 by the authors. Licensee MDPI, Basel, Switzerland. This article is an open access article distributed under the terms and conditions of the Creative Commons Attribution (CC BY) license (https://creativecommons.org/licenses/by/4.0/).
Share and Cite
MDPI and ACS Style
Nidzgorska-Lencewicz, J.; Mąkosza, A.; Koźmiński, C.; Michalska, B. Potential Risk of Frost in the Growing Season in Poland. Agriculture 2024, 14, 501. https://doi.org/10.3390/agriculture14030501
AMA Style
Nidzgorska-Lencewicz J, Mąkosza A, Koźmiński C, Michalska B. Potential Risk of Frost in the Growing Season in Poland. Agriculture. 2024; 14(3):501. https://doi.org/10.3390/agriculture14030501
Chicago/Turabian StyleNidzgorska-Lencewicz, Jadwiga, Agnieszka Mąkosza, Czesław Koźmiński, and Bożena Michalska. 2024. "Potential Risk of Frost in the Growing Season in Poland" Agriculture 14, no. 3: 501. https://doi.org/10.3390/agriculture14030501
Note that from the first issue of 2016, this journal uses article numbers instead of page numbers. See further details here.