Article

Combinations of Feature Selection and Machine Learning Models for Object-Oriented “Staple-Crop-Shifting” Monitoring Based on Gaofen-6 Imagery

1
College of Information Science and Technology, Shihezi University, Shihezi 832003, China
2
Geospatial Information Engineering Research Center, Xinjiang Production and Construction Crops, Shihezi 832003, China
*
Author to whom correspondence should be addressed.
Agriculture 2024, 14(3), 500; https://doi.org/10.3390/agriculture14030500
Submission received: 24 January 2024 / Revised: 17 March 2024 / Accepted: 18 March 2024 / Published: 20 March 2024
(This article belongs to the Special Issue Multi- and Hyper-Spectral Imaging Technologies for Crop Monitoring)

Abstract

:
This paper combines feature selection with machine learning algorithms to achieve object-oriented classification of crops in Gaofen-6 remote sensing images. The study provides technical support and methodological references for research on regional monitoring of food crops and precision agriculture management. “Staple-food-shifting” refers to the planting of other cash crops on cultivated land that should have been planted with staple crops such as wheat, rice, and maize, resulting in a change in the type of arable land cultivated. An accurate grasp of the spatial and temporal patterns of “staple-food-shifting” on arable land is an important basis for rationalizing land use and protecting food security. In this study, the Shihezi Reclamation Area in Xinjiang is selected as the study area, and Gaofen-6 satellite images are used to study the changes in the cultivated area of staple food crops and their regional distribution. Firstly, the images are segmented at multiple scales and four types of features are extracted, totaling sixty-five feature variables. Secondly, six feature selection algorithms are used to optimize the feature variables, and a total of nine feature combinations are designed. Finally, k-Nearest Neighbor (KNN), Random Forest (RF), and Decision Tree (DT) are used as the basic models of image classification to explore the best combination of feature selection method and machine learning model suitable for wheat, maize, and cotton classification. The results show that our proposed optimal feature selection method (OFSM) can significantly improve the classification accuracy by up to 15.02% compared to the Random Forest Feature Importance Selection (RF-FI), Random Forest Recursive Feature Elimination (RF-RFE), and XGBoost Feature Importance Selection (XGBoost-FI) methods. Among them, the OF-RF-RFE model constructed based on KNN performs the best, with the overall accuracy, average user accuracy, average producer accuracy, and kappa coefficient reaching 90.68%, 87.86%, 86.68%, and 0.84, respectively.

1. Introduction

Cultivated land is the basis for human survival, development, and prosperity and is also a key element in ensuring food security. The “staple-crop-shifting” of cultivated land will lead to a decline in total food production, which will have a direct impact on food security, and continuous monitoring of food-producing areas is therefore essential. To address this challenge, the China Government has issued a series of announcements, such as “The Opinions On Preventing The Degradation Of Cultivated Land And Stabilizing Grain Production”, which call for strict adherence to the red line of cultivated land and the prevention of the tendency to degradation of cultivated land [1,2]. Cultivated land protection is imperative, and real-time and accurate information on the dynamic changes in the cultivation status of cultivated land is the key to monitoring “staple-food-shifting”.
Timely and accurate information on staple crops is the basis for monitoring and management of “staple-crop-shifting” [3,4]. Because remote sensing images are characterized by large-scale observation, multispectral information, and multitemporal sequences, they are widely used in crop classification and identification, area statistics, and change monitoring studies [5,6]. Utilizing satellite remote sensing data is an important method to improve the accuracy of crop identification [7], and this technique has been widely used in the field of agricultural remote sensing and crop identification in wheat [8], maize [9,10], and cotton [4,11].
Pixel-level-based classification and object-oriented classification are the two main approaches to crop classification using remote sensing. Pixel-level classification only considers the features of individual pixels and is prone to category confusion, especially among crops with similar spectral features, leading to “salt and pepper noise” [12], and it is difficult to utilize the spatial relationship between pixels to capture information such as the shape and size of the objects or crops in the farmland. The object-oriented classification method uses segmented objects rather than pixels as processing units, which takes into account the spatial relationship between objects and can better capture the spatial information of farmland. By introducing features such as the shape, texture, and spectrum of an object, it is possible to reduce confusion between categories and improve classification accuracy [13]. Many studies have used various object-oriented supervised machine learning classification algorithms for crop identification from satellite remote sensing data [14,15]. Common algorithms include Random Forest (RF), Support Vector Machine (SVM), Decision Tree (DT), k-Nearest Neighbor (KNN), and Neural Networks [16,17,18,19]. For example, Luo et al. [20] conducted experiments on crop classification based on pixel-level and object-oriented methods in Heilongjiang farm areas, and the results showed that the overall accuracy of the object-oriented method was 3% higher than that of the pixel method, and the “salt and pepper noise” in crop mapping was significantly improved. Xue et al. [21] classified crops based on Google Earth Engine (GEE) and the results showed that the combination of Simple Non-Iterative Clustering (SNIC) multiscale segmentation and Random Forest Classification based on time-series radar and optical remote sensing images can effectively reduce the “ salt and pepper noise ” in the classification and improve the classification accuracy up to 98.66%, with a kappa coefficient of 0.98, as compared to the pixel-based method. Zhu et al. [22] used Sentinel-2 images combined with object-oriented and pixel-based methods to extract maize fall, and the results showed that the overall accuracy and kappa coefficient of multi-feature combined with object-oriented RF classification were 93.77% and 0.87, respectively, which were significantly higher than those of pixel-based methods. Wang et al. [23] fused multi-source domestic high-resolution imagery and object-oriented methods for remote sensing identification of crops in the south, and the results showed that object-oriented crop classification based on GF-2 was better than that based on pixels, in which the overall accuracy was about 1.35% higher.
In recent years, with the increase in the number of satellite remote sensing image types and improvement in spatial resolution, scholars have proposed a variety of classification methods that comprehensively utilize multiple features, such as image spectra, textures, geometries, and spectral indices, which significantly improve classification accuracy [24,25]. While object-oriented methods make up for the lack of pixel-based methods, they also lead to an increase in the dimensionality of the feature space. However, not all features have a positive impact on classification, and several studies have found that too many input features may reduce classification accuracy and increase computational effort [10,26]. The feature selection (FS) technique is an efficient method to reduce redundant information and aims to find the optimal subset of features that have the highest relevance to the object and the lowest redundancy. Various FS methods have been widely used in object-based classification. For example, the feature selection (FS) technique is an efficient method to reduce redundant information, which aims to find the optimal subset of features that have maximum relevance to the object and minimum redundancy. Various FS methods are widely used in object-based classification. Zhang et al. [27] constructed a feature selection method based on the optimal extraction cycle of features based on Sentinel-2 remote sensing images, which significantly improved the recognition accuracy of mountain rice, with the best overall classification accuracy and kappa coefficient of 86% and 0.81, respectively. Fu et al. [28] demonstrated that the Random Forest Recursive Feature Elimination (RF_RFE) algorithm can provide more useful features and improve the crop identification accuracy after feature selection by 1.43% to 2.19%, 0.60% to 1.41%, and 1.99% to 2.18% in 2002, 2014, and 2022, respectively, compared to crop identification without feature optimization. Jin et al. [3] used Decision Trees to construct the optimal feature space in order to achieve fine crop classification and used an object-oriented Random Forest classification algorithm to classify the multi-feature space, and the final overall accuracy and kappa coefficient were 90.18% and 0.877, which were greater than for the pixel-level and single-feature classification accuracies. In summary, there is no generalized FS method to obtain the optimal features for different machine learning classifiers, regions with different climatic conditions, and remote sensing data types. In addition, the impact of each FS method on the actual crop classification effect is still unclear, and the effectiveness of different algorithms for regional crop identification also needs to be further explored. Therefore, the utility and efficiency of FS methods need to be further investigated according to specific research objectives.
In the field of remote sensing, the application of satellite remote sensing data has become an important tool for land use/land cover (LULC) classification studies. High-resolution satellite data, especially panchromatic/multispectral sensor (PMS) images from China’s Gaofen-6 (GF-6) satellite, offer the possibility of precise surface feature identification due to their high spatial resolution and enhanced spectral resolution. Gaofen-6 (GF-6), which was successfully launched on 2 June 2018, is a satellite specially designed for monitoring agricultural applications [29], and it is mainly applied to industries such as precision agriculture observation and forestry resources survey. Regarding the research progress on LULC classification using GF-6 PMS data, several papers have reported the effectiveness of its application in urban land cover, agricultural monitoring, and forest resources survey [30,31,32,33]. These studies show the potential advantages of GF-6 satellite data in distinguishing fine-grained surface features, especially in the detailed delineation of farmland boundaries. In view of this, this study proposes an object-oriented multi-feature preference-based monitoring method for “non-food” monitoring of high-resolution imagery using GF-6 imagery, aiming to provide a new research idea for the accurate identification of food crops and cash crops. The specific objectives of this study are (1) to explore the methods applicable to the accurate identification of food crops in the northern border area, and to study the advantages of GF-6 remote sensing images in the identification; (2) to evaluate and compare key features and FS methods in grain crop identification; and (3) to explore the best combination of FS methods and machine learning classifiers to recognize various crop types.

2. Study Area and Data

2.1. Study Area

The study area is located in Shihezi Reclamation Area of the Eighth Division of Xinjiang Production and Construction Corps, with a longitude of 85°51′50″ E∼86°0′30″ E and a latitude of 44°20′30″ N∼44°15′13″ N (as shown in Figure 1) and covers an area of about 112.767 km2. The main staple crops grown are maize and wheat, and cash crops include cotton, grapes, and zucchini, etc. The study area is located in the Shihezi Reclamation Area of the Eighth Division of Xinjiang Production and Construction Corps. A few trees and roads exist between neighboring plots. The region has a temperate continental climate with abundant light, which is suitable for the growth of a wide range of crops. The terrain of the study area is relatively flat and the cultivated land is flat and continuous, which makes it suitable for high-frequency remote sensing image monitoring and precision agriculture research.

2.2. Gaofen-6 Imagery

Considering the crop types and cultivated land in the study area, this paper selected Gaofen-6 (GF-6) remote sensing images covering the study area on 18 September 2022 and 4 August 2020, with good image quality and no cloud occlusion, for crop classification. The GF-6 satellite was launched in 2018, and it provided panchromatic images at 2 m resolution and multispectral images at 8 m, including blue (0.45∼0.52 μm), green (0.52∼0.60 μm), red (0.63∼0.69 μm), and near-infrared (0.76∼0.90 μm) bands (as shown in Table 1). The image preprocessing was carried out using the ENVI 5.6 platform, and the radiometric calibration, atmospheric correction, and orthometric correction were performed on the panchromatic and multispectral data, respectively, and then the image fusion was performed on both of them to obtain the GF-6 multispectral image with a resolution of 2 m. The fused images were geometrically corrected using ground-truth control points and quadratic polynomial methods, and, finally, the images were mosaicked and cropped according to the vector boundaries of the study area to obtain the study area image.

2.3. Crop Field Survey

Field surveys and visual interpretation using Google Earth high-resolution image data were conducted to gain an understanding of the type and distribution of major crops grown in the study area. We conducted field surveys in the study area in May and August 2022 and accurately recorded the cultivation and vegetation types in the plots. Figure 2 shows the images of major crops grown taken during the survey. The main types of crops grown in the study area include cotton, maize, wheat, watermelon, grapes, and zucchini, among other crops. The results of the field survey showed that maize, wheat, and cotton are more widely grown in the study area. Of these, maize and wheat are staple crops and cotton is a cash crop. Considering that the objective of this study is to monitor the “staple-crop-shifting” of cultivated land, other crops were found sporadically planted in the study area, but the planted area was relatively small, and, to ensure the validity of the sample size, they were grouped together and collectively referred to as other crops.
In order to ensure sample balance, the number of samples was set according to the area share of each crop type. A total of 91,448 pixels were finally selected as training samples (including maize 4758, wheat 18,743, cotton 56,467, and other crops 11,480). In addition, ArcMap tool was used to randomly select 600 pixels as validation samples in the study area (of which maize 52, wheat 122, cotton 347, and other crops 79). In this study, maize and wheat were categorized as staple crop types and cotton and other crops were categorized as cash crop types, and the samples were uniformly randomly distributed throughout the study area.

3. Methods

In this paper, we first preprocess the multitemporal GF-6 image and then segment the image into objects based on the Multi-resolution Segmentation (MRS) algorithm and the scale parameter estimation tool Estimation of Scale Parameter2 (ESP2), and construct the initial 65 features from them, including the original spectral features, geometric features, spectral index features, and texture features. Then, the features are preferred based on six feature selection methods and combined with three object-oriented machine learning classification algorithms to classify and identify crops. Finally, a validation sample is used to determine the optimal “staple-crop-shifting” monitoring method by comparing classification accuracy and validation accuracy. The technology roadmap is shown in Figure 3.

3.1. Image Segmentation

In object-oriented classification methods, image segmentation is used to obtain image objects by dividing similar spatial and spectral features. In this study, MRS is used for image segmentation and MRS has three key parameters [34], including Segmentation scale (Scale parameter), Shape factor (Shape), and Compactness factor (Compactness), and Image Layer weights need to be set before segmentation. In this study, all the layer weights are set to one, and Shape and Compactness are determined using the fixed single factor method, and several segmentation experiments are conducted on the Shape and Compactness parameters with a step size of 0.1, covering a range of values from 0.1 to 0.9, and the optimal values of Shape and Compactness are finally determined to be 0.1 and 0.5, respectively. To determine the optimal segmentation scale, ESP2 was used to obtain multiple segmentation scale values, the essence of which is to maximize inter-segmentation heterogeneity and intra-segmentation homogeneity, and the optimal segmentation scale is the corresponding scale value when the ROC-LV curve peaks [34]. According to the ROC-LV curves and LV curves obtained by ESP2 (e.g., Figure 4), the optimal segmentation scale is between 110 and 180, as can be seen by observing the variance rate of change curve. Moreover, 112, 116, 128, 136, 165, and 173 were taken as alternative optimal segmentation scale parameters, and the segmentation experiments were performed sequentially, and 136 was finally selected as the optimal segmentation scale for this study. Figure 5 shows the local image segmentation effect under this optimal segmentation scale, and the segmentation effect is better without over-segmentation and under-segmentation.

3.2. Features Extraction

The key to improve the accuracy of crop classification is the effective selection of multiple feature variables [35] in order to find the features suitable for recognizing the main crops in the study area; this study used eCongnition 10.3 software to extract the spectral index, spectral, geometric, and texture information of the object to construct a set of four types of feature variables based on image segmentation, as shown in Table 2. These include 13 spectral index features, 10 spectral features, 10 geometric features, and 32 texture features, which can provide rich spectral, texture, and spatial features. Among them, the texture features are extracted based on the gray-level co-occurrence matrix (GLCM) of all dir. The formulae for DVI, GI, GNDVI, MCAIR, MSAVI, MSR, NDVI, RDVI, RVI, SAVI, TCARI, TVI, and Vl green in spectral index features are as follows:
D V I = ρ N I R ρ R
G I = ρ G ρ N I R
G N D V I = ( ρ N I R ρ G ) / ( ρ N I R + ρ G )
M C A I R = ( ( ρ N I R ρ R ) 0.2 × ( ρ N I R ρ G ) ) × ( ρ N I R / ρ R )
M S A V I = ( 2 ρ N I R + 1 2 ρ N I R + 1 2 8 ( ρ N I R ρ R ) ) / 2
M S R = ( ( ρ N I R / ρ R ) 1 ) / ( ρ N I R / ρ R + 1 )
N D V I = ( ρ N I R ρ R ) / ( ρ N I R + ρ R )
R D V I = ( ρ N I R ρ R ) / ( ρ N I R / ρ R )
R V I = ρ N I R / ρ R
S A V I = ( ρ N I R ρ R ) × ( 1 + 0.5 ) / ( ρ N I R + ρ R + 0.5 )
T C A R I = 3 × ( ρ N I R ρ R 0.2 × ρ N I R ρ G × ( ρ N I R / ρ R ) )
T V I = 0.5 × ( 120 × ρ N I R ρ G 200 × ρ R ρ G )
V I g r e e n = ρ G ρ R / ρ G + ρ R
where ρ N I R is the near-infrared band reflectance, ρ R is the red band reflectance, ρ B is the blue band reflectance, and ρ G is the green band reflectance.

3.3. Feature Selection

The participation of all features in classification not only increases model complexity and information redundancy but also causes “dimensionality catastrophe”, which leads to degradation of classification performance. In order to reduce the data redundancy of the initial features, it is necessary to optimize the initial features. The forms of feature selection include filter, wrapper, embedded, and hybrid [36]. First, three traditional feature selection methods (TFSM) are introduced, including Random Forest Feature Importance Selection (RF-FI), Random Forest Recursive Feature Elimination (RF-RFE), and XGBoost Feature Importance Selection (XGBoost-FI), where RF-FI and XGBoost-FI are embedded methods and RF-RFE is a hybrid method of embedded and wrapper. Based on TFSM, optimal feature selection method (OFSM) is proposed, which is a hybrid method combining filter, wrapper, and embedded.

3.3.1. Traditional Feature Selection Method (TFSM)

Random Forest Feature Importance Selection: RF-FI is a method of calculating the importance of features using the Random Forest algorithm and performing feature selection based on their importance [37]. Random Forest evaluates feature importance for the integration of multiple Decision Trees and determines the importance of a feature by measuring the split contribution of the feature in the Decision Tree. A higher feature importance indicates that the feature contributes more to the classification or regression task.
Random Forest Recursive Feature Elimination: RF-RFE first uses Random Forest to rank all the features, then eliminates the lowest ranked features and retrains the model, looping the process until a predefined stopping condition is reached [38]. Through this gradual elimination, RF-RFE generates an optimal subset of features to reduce the feature dimensionality to improve the performance of the model.
XGBoost feature importance selection method: XGBoost-FI is a feature selection method based on the Gradient Boosting Tree algorithm [39]. The XGBoost model evaluates the importance of features by measuring the split gain or the number of splits of the features in each Decision Tree. Features with larger splitting gain contribute more to the performance and predictive power of the model.

3.3.2. Optimal Feature Selection Method (OFSM)

In order to improve the efficiency of feature selection and to provide informative feature combinations for crop classification, a hybrid feature selection method, called optimal feature selection method (OFSM), was designed in this study with the aim of integrating the advantages of different feature selection strategies to improve the classification accuracy. The specific implementation steps of OFSM are as follows and are visually depicted in Figure 6. In the first step, we calculated Pearson correlation coefficients between input features and multi-category target labels. Given that Pearson correlation coefficients were originally designed to assess linear relationships between continuous variables, we used a One-vs-Rest approach to adjust the multi-category labels by converting them into a series of binary variables. That is, each category formed a binary comparison relative to the other categories, and the feature correlations were calculated separately for each category. We then take the average of the correlation coefficients of these binary scenarios to comprehensively assess the relevance of the features to the original multi-category labels. Features with correlation coefficients lower than 0.10 are eliminated according to a preset correlation threshold to ensure that the retained features have sufficient correlation with the target label. In the second step, by calculating the Pearson’s correlation coefficient between features, we identify and remove redundant features that are highly correlated (correlation coefficient greater than 0.95). This step helps to reduce the complexity of the model and increase the computational efficiency. In the third step, a nested loop model based on Random Forest-Recursive Feature Elimination (RF-RFE) is constructed. The model starts from the K features filtered in step 2 and gradually reduces to M features. In each iteration, we remove the features that are considered least important in the Random Forest model. At the end of the iterations, the remaining M features form what we call the optimal combination of features, i.e., the OF-RF-RFE method. Finally, we calculate the importance of the remaining K features using the Random Forest Feature Importance (RF-FI) and XGBoost Feature Importance (XGBoost-FI) methods and rank the features based on these importance scores. The top M features with the highest scores are selected to form the optimal feature combinations for the OF-RF-FI and OF-XGBoost-FI methods, respectively.
To validate the effectiveness of the selected feature combinations, a series of statistical tests are performed. These tests aim to assess the significance between the selected features and the classification results, and to compare the differences between different feature selection methods. The specific statistical methods and test results will be reported in detail in the Results section.

3.4. Crop Classification Based on Object-Oriented Multi-Features

3.4.1. Comparison Scheme

This study investigates the effects of object-oriented and multi-feature preferences on crop classification results by setting up four comparison schemes. These include scheme 1: pixel-level single-feature-based classification (Pixel-SF), scheme 2: pixel-level multi-feature-based classification (Pixel-MF), scheme 3: object-oriented single-feature-based classification (Object-SF), and scheme 4: object-oriented multi-feature-based classification (Object-MF). Pixel-level classification is performed in ENVI 5.6 and texture features are extracted using co-occurrence measures, and object-oriented classification is performed in eCognition 10.3. In this case, single features are the spectral features of the four bands of the image, and multi-features are the features optimized by the OFSM method.

3.4.2. Classification Model

In order to verify the advantages of different models in object-oriented classification, this study utilizes the K-Nearest Neighbor (KNN), Random Forest (RF), and Decision Tree (DT) models, which are commonly used in the eCognition software, to perform object-oriented multi-feature crop type classification. After optimization, the hyperparameters of KNN are the following: Use class description = Yes, n_neighbors = 5, Distance measurement = euclidean; the hyperparameters of RF are the following: Max categories = 16, Active variable = 0, Max tree number = 50, Termination criteria = 0, Termination criteria = 1, tree number = 50, Termination criteria type = Both, Number of features=square root, Impurity function = gini coefficient; DT hyperparameters are Depth = 0, Min sample count = 0, Use surrogates = No, and Max categories = 16.

3.5. Accuracy Assessment

To quantitatively analyze the extraction effect of different models and different feature combination schemes, User’s Accuracy (UA), Producer’s Accuracy, (PA), Overall Accuracy (OA), and kappa coefficients in the confusion matrix were used to evaluate the performance of the classifier. Among them, UA and PA can evaluate the classification accuracy of each category, while OA and kappa coefficient are used to describe the overall performance of the classifier. Their specific calculations are shown below:
U A i = N i i N i +
P A i = N i i N + i
O A = i = 1 K N i i N
K a p p a = N i = 1 K N i i i = 1 K N i + N + i N 2 i = 1 K N i + N + i
where N represents the total number of samples and K is the total number of categories. N i i is the number of samples assigned to the correct category. N + i and N i + are the true number of samples in category i and the number of samples predicted to be in category i, respectively.

4. Results

4.1. Selected Features Using Different FS Methods

4.1.1. Optimal Feature Selection Method

In this study, our proposed optimal feature selection method (OFSM) selects the combination of features that is most useful for crop classification from an initial set of 65 features. The process was divided into several steps as follows. First, the Pearson correlation coefficients between the features and the labels were calculated and the features with absolute values of correlation less than 0.1 were excluded (as shown in Figure 7, the features located below the red line were excluded). At the end of this step, 37 features were retained, which are listed in Table 2. By comparing the Pearson correlation coefficients between these 37 features (as shown in Figure 8b), we further removed redundant features with correlations greater than 0.95. After this step, the number of features was reduced to 27, which effectively reduces the redundancy of the data and the processing time. Compared to the initial 65 features (redundancy is shown in Figure 8a), the redundancy of these features is significantly reduced (as shown in Figure 8c).
Next, a nested-loop Random Forest Recursive Feature Elimination (RF-RFE) method was used to compute the contribution of the remaining twenty-seven features to the classification, and finally an optimal subset of eight features was identified, which included GI, NDVI, RVI, Brightness, Blue_Mean, Green_Mean, Blue_Std, and Red_Std. In addition, we scored and ranked the initial twenty-seven features using Random Forest Feature Importance (RF-FI) and XGBoost Feature Importance (XGBoost-FI), and also retained the eight features with the highest importance scores. Table 3 shows the results of the optimal feature combinations filtered using the RF-FI and XGBoost-FI methods. Combining the results of RF-RFE, RF-FI, and XGBoost-FI, we found that the spectral index features (GI, NDVI, and RVI) contributed significantly to crop classification, while the texture and geometric features contributed less to crop identification compared to the spectral index features.

4.1.2. Traditional Feature Selection Method

In the comparative study, we also used the Traditional Feature Selection Method (TFSM) to evaluate the initial 65 features and identify the features that contribute significantly to the classification. The process is summarized as follows: first, the contribution of each feature to the classification task is calculated by the Random Forest-Recursive Feature Elimination (RF-RFE) method. In this process, we obtained a subset of 27 features including DVI, GI, GNDVI, MCARI, MSAVI, MSR, NDVI, RDVI, RVI, SAVI, TCARI, TVI, VIgreen, Brightness, Blue_Mean, Green_Mean, Red_Mean, NIR_Mean, NIR_Mean, NIR_Mean, NIR_Mean, RDVI, Mean, NIR_Mean, Max.diff., Blue_Std, Green_Std, Red_Std, NIR_Std, Length/Width, Asymmetry, Blue_GLCMDis, and NIR_GLCMDis. Next, using RF-FI and XGboost-FI algorithms, importance scoring and ranking of all the features were performed and again the top 27 features were retained. Figure 9 and Figure 10 show the results of the feature importance scores for the RF-FI and XGBoost-FI algorithms. These results further emphasize the importance of spectral index features in classification as these features are generally high in the importance ranking. In contrast, geometric and texture features scored lower and ranked lower. Taken together, the feature variables were ranked in the following order of importance: spectral index features > spectral features > texture features > geometric features.
Figure 8d–f exhibit the correlations between the 27 features selected under TFSM, which are listed in Table 2. From the figure, it can be seen that the correlations between these features are still high, indicating that the traditional method may select features that have more redundant information with each other.
In summary, the traditional feature selection method selects features with higher correlations in the set of features; i.e., there is more redundancy among the features than in the OFSM method. Compared with the relatively independent 27 features selected via the OFSM method (see Figure 8c), the TFSM method may lead to less efficient model learning and an increased risk of overfitting.

4.2. Object-Oriented Multi-Feature Classification

4.2.1. Comparative Analysis of Feature Selection Methods

The results of object-oriented multi-feature classification are presented in detail in Table 4 and Figure 11. In this comparative analysis, we consider a number of different feature selection methods; TF-RF-FI(27), TF-RF-RFE(27), and TF-XGBoost(27) are the 27 preferred features selected through TFSM. TF-RF-FI(8) and TF-XGBoost(8) are the top eight features selected through TFSM. OF-RF-FI(8), OF-RF-RFE(8), and OF-XGBoost(8) are the features selected through OFSM. NO(65) is the original 65 features without feature selection. The experimental results show that the OFSM algorithm outperforms the original feature set overall without feature selection, which emphasizes the importance of preprocessing for feature selection before classification.
Method 5 (TF-XGBoost(8)) has the lowest average OA of 78.64% and an average kappa coefficient of 0.61. Method 2 (TF-RF-RFE(27)) achieves the highest average OA of 88.18% and an average kappa coefficient of 0.79 amongst all the feature selection methods. After OFSM optimization, method 7 (OF-RF- RFE(8)) achieves an average OA of 86.86% and an average kappa coefficient of 0.76. Compared to the other methods, method 7 achieves a significant percentage increase in average OA and kappa coefficient, as well as a significant reduction in the number of features, which improves the data processing efficiency. Although the average OA of method 7 is slightly lower than that of method 2, its significant reduction in the number of features reduces the model parameter burden and improves the efficiency of model operation. A comparison of the performance of the RF-RFE algorithm and the XGBoost-FI algorithm in TFSM and OFSM shows that the RF-RFE algorithm generally outperforms the XGBoost-FI algorithm with the same number of features and classification models. In addition, when the number of features and the selection algorithm are the same, the accuracy of OFSM is better than that of TFSM. The average OA of OF-RF-FI(8) is 86.61%, and the average kappa coefficient is 0.76, which is an improvement of 2.47% in average OA and 4.66% in average kappa coefficient compared with TF-RF-FI(8), while OF-XGBoost-FI(8) has an average OA of 82.31% and average kappa coefficient of 0.67, which is an improvement of 3.67% in average OA and 6.31% in average kappa coefficient compared to TF-XGBoost-FI(8).
Figure 12 shows the producer accuracy (PA) and user accuracy (UA) of different methods and different classification models on each crop type. Overall, all the classification models in methods 6 to 8 outperform the other schemes in terms of average PA and UA. Among all the classification results, cotton has the highest classification accuracy with PA and UA values ranging from 90.66% to 97.94% and 78.30% to 94.95%, respectively. Wheat and maize also showed high classification accuracy, with PA and UA values ranging from 79.25% to 94.74% and 53.61 to 92.45% (wheat), and from 75.86% to 81.08% and 85.71% to 96.55% (maize), respectively. The classification accuracy values of other crops were relatively low, with PA and UA values ranging from 15.38% to 78.13% and 58.62% to 85.23%, respectively.
In summary, it shows that the feature selection method in this paper effectively improves the classification accuracy, which is crucial for improving the performance of object-oriented multi-feature classification.

4.2.2. Comparative Analysis of Object-Oriented Models

Based on the nine preferred features, the KNN, RF, and DT models were used for crop classification comparison. According to Table 4 and Figure 11, it can be concluded that KNN accuracy is significantly higher than RF and DT, and KNN achieves the best OA and kappa coefficient with the same feature selection method. The average OA of KNN is 87.51% and the average kappa coefficient is 0.77, which is an increase of 3.40% and 4.15% in the average OA compared to RF and DT, and an increase of 7.00% and 7.85% in the average kappa coefficient, respectively. The KNN model obtained the highest OA of 90.68% on OF-RF-RFE(8), which is the highest accuracy among all the classification combinations of nine feature selection methods and three machine learning classification models, and only eight features were selected with a kappa coefficient of 0.84. For the RF model, the TF-RF-RFE (27) obtained the highest OA (87.84%) with a kappa coefficient of 0.78. For the DT model, TF-RF-RFE (27) also obtained the highest OA (87.90%) with a kappa coefficient of 0.78. In terms of individual feature classification accuracy (Figure 12), in comparison to RF and DT, KNN improved UA for cotton, maize, and other crops, ranging from 4.89% to 42.94%; meanwhile, KNN improved PA for cotton, wheat, and other crops, ranging from 0.16% to 62.94%. The KNN model had lower variance in PA and UA for the monitoring of four different crop types and was more stable compared to the other two models. This may be due to the fact that, in crop classification, the KNN model classifies each object by calculating its distance from the nearest neighbor samples, which is robust to outliers and noise, and shows strong stability when dealing with unbalanced category samples and noisy data [40]. Therefore, it usually produces better classification results when dealing with remote sensing image data. Overall, the three models showed better results in object-oriented classification in the study area. Without using any FS method, the OA value of KNN is 88.06%, which is 4.40% and 3.21% higher than that of RF and DT, further proving that the KNN algorithm can show good performance in crop identification.
The classification results based on different models of OF-RF-RFE(8) are shown in Figure 13, which shows that most of the areas can be accurately identified, and there is obvious distinction between different crops, and the final classification results have no fragmentation phenomenon and clear boundaries, which is in line with the actual situation of the study area, and good results have been achieved. After comparing the classification results with the Google Earth high-resolution images, it is found that, in the monitoring of “non-food” cultivated land in the study area, the main error is the misclassification of other crops and maize. The KNN model based on OF-RF-RFE(8) had a PA of 78.13% and 80.00% for other crops and maize, respectively (Figure 14), and a UA of 85.22% and 93.33%, respectively, while the PA of 95.59% and 92.98% for cotton and wheat, respectively, and a UA of 94.95% and 77.94%, respectively. It can also be seen from Figure 14 that the KNN model is significantly better than RF and DT for crop identification.

4.2.3. Comparative Analysis of Classification Schemes

In order to quantitatively investigate the effect of object-oriented and multi-feature optimization on the crop classification results, the experiment uses the RF classification model, the RF parameters of each scheme are set the same, and the classification results of different schemes are shown in Table 5 and Figure 15. According to the table data, it can be concluded that the Pixel-SF scheme has the worst classification effect, the OA is only 75.88%, and the kappa coefficient is only 0.65, while the Object-MF scheme has the best classification effect; the OA and the kappa coefficient are 85.34% and 0.72, respectively. From Figure 15, pixel-level classification can be observed based on the existence of a more serious “salt and pepper noise” phenomenon, while the results based on object-oriented classification show clearer plot boundaries, which are more in line with the actual planting structure and spatial distribution of crops. Comparing schemes 1–3 and schemes 2–4, it can be found that, compared with pixel-level classification, the object-oriented method can effectively improve the classification accuracy of crops, whether single-feature or multi-feature. The OA is improved by 7.49% and 6.95%, and the kappa coefficient is improved by 2.91% and 3.61%, respectively. Meanwhile, comparing Scenarios 1–2 and 3–4, it can also be found that multi-feature is also one of the effective methods to improve the crop classification accuracy compared to single-feature. The OA is improved by 2.51% and 1.98%, and the kappa coefficient is improved by 3.75% and 4.45%, respectively. In summary, the method based on object-oriented and multi-feature optimization is characterized by high accuracy, stability, and credibility and is a practical method for crop classification.
For different crop types, the results were evaluated for accuracy using PA and UA (shown in Table 6). As can be seen from Table 6, the constructed optimal feature spaces are all better for the classification of crops in the study area, and the object-oriented multi-feature-based classification method performs the best in terms of recognition accuracy for cotton, with 95.24% and 85.12% for PA and UA, respectively, followed by maize, with 89.14% and 81.82% for PA and UA, respectively, and also better for wheat, with 76.92% and 86.00% for PA and UA, respectively. Overall, for individual crop types, the PA values of object-oriented multi-feature-based classification are higher than those of other schemes, indicating that the method is able to effectively distinguish different crop types.

4.3. “Staple-Crop-Shifting” Monitoring

Combined with the actual situation, this paper considers that, when the crop type is transformed from the original staple crops to cash crops, all of them are regarded as the existence of the phenomenon of “staple-crop-shifting” cultivated land. The post-classification comparsion (PCC) method is a commonly used method for remote sensing change monitoring, which detects the change in features or land surface by comparing the classification results of remote sensing images at different time points. By comparing the classification results, the changes in the features can be visualized and understood. In addition, the method does not require an additional training process and can directly utilize the classification results for change detection, reducing computational and time costs.
In this study, the eight features preferred by the optimal feature selection algorithm (OF-RF-RFE) and the KNN model were applied to the two-period images (2020 and 2022) to extract the crop types using the post-classification comparison method based on an object-oriented strategy. By matching the supervised classification image results with the original images, the output matrix was obtained and the area of each crop in 2020 and 2022 was counted. The statistical area and change area of each specific crop are shown in Table 7, and the results of monitoring the change regarding each crop are shown in Figure 16.
According to the data in Table 7, the area of staple crops and cash crops in the study area in 2020 was 14.03 km2 and 68.26 km2 respectively, which accounted for 17.05% and 82.95% of the total crop area in the study area. In 2022, the area of staple crops and cash crops was 13.45 km2 and 76.22 km2 respectively, which accounted for 14.50% and 85.50% of the total crop area. The unchanged areas of maize, wheat, cotton, and other crops in the study area were 0.22 km2, 0.70 km2, 45.62 km2, and 6.07 km2, respectively. Among them, there was a decrease in the area of maize and other crops and an increase in the area of wheat and cotton. Specifically, the area converted from staple crop to cash crop was 8.48 km2, while the area converted from cash crop to staple crop was 6.73 km2. Taken together, there was a decrease in the area of staple crop by 0.58 km2, an increase in the area of cash crop by 7.96 km2 and an increase in the area of cultivated land in the study area by 7.38 km2.

5. Discussion and Future Work

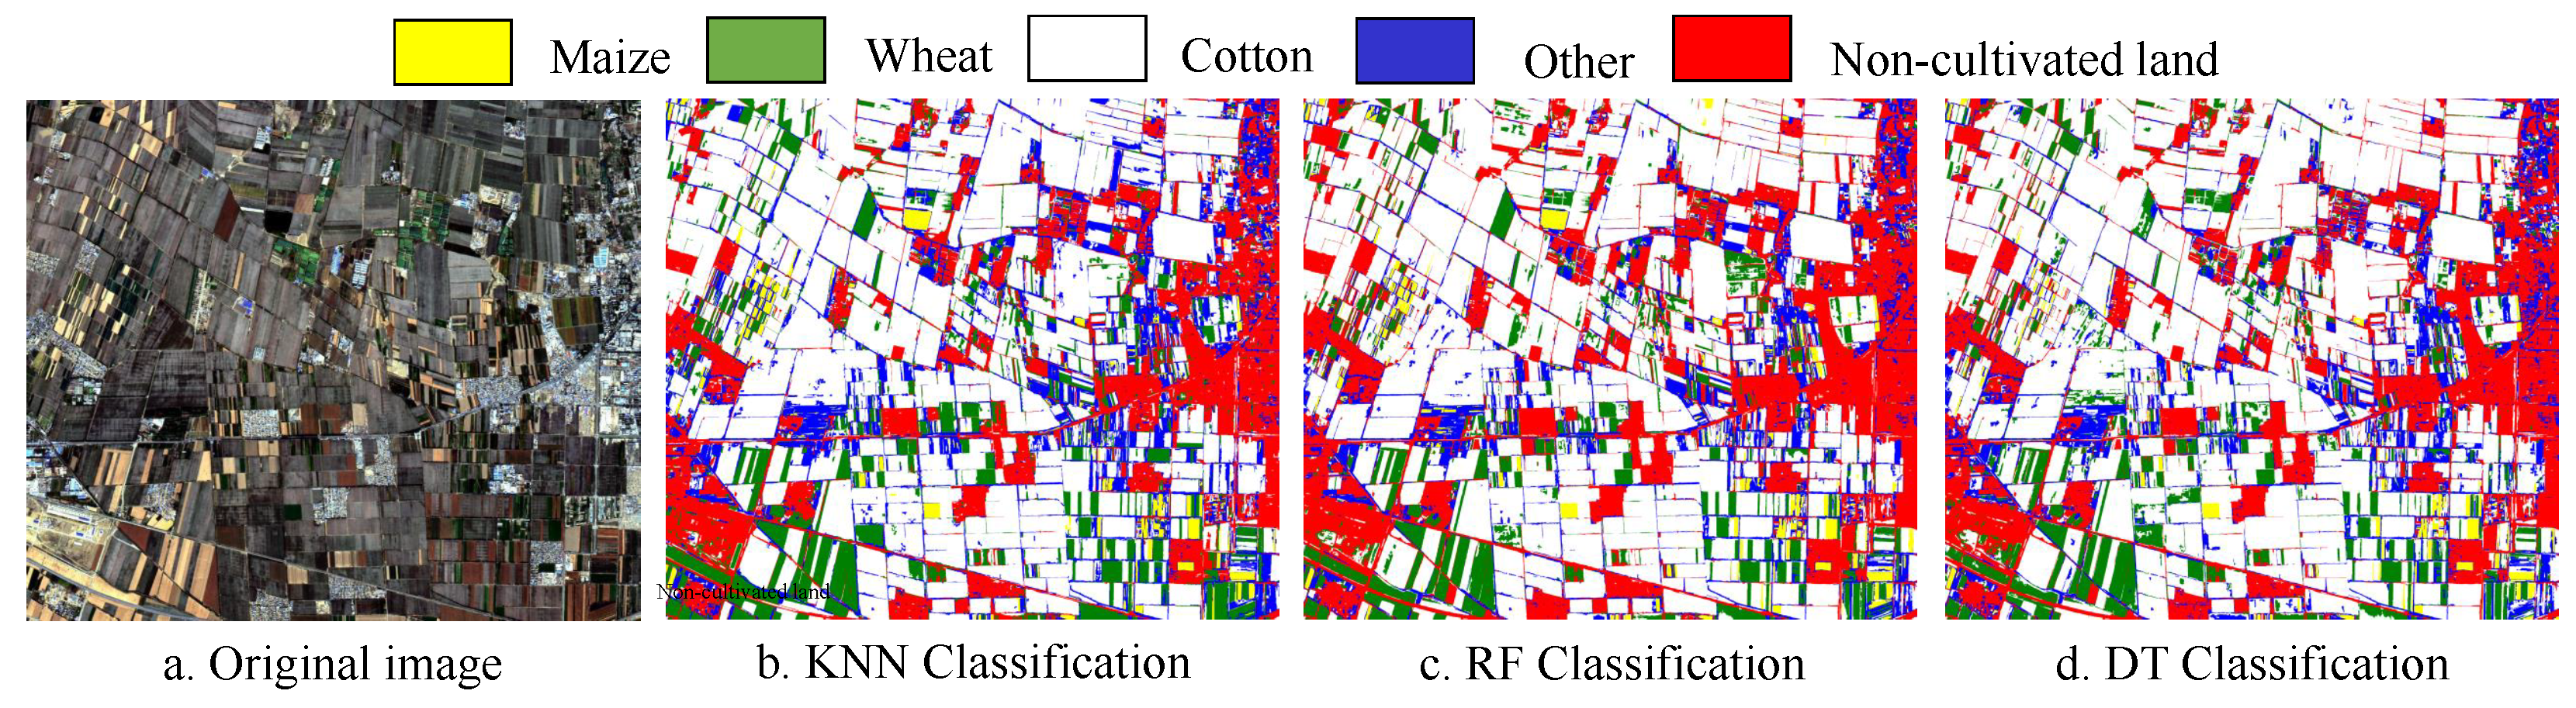
In terms of object-oriented classification, the KNN, RF, and DT models demonstrate superior performance. The KNN model achieves an OA value of 88.06% without the use of any FS method, surpassing the RF and DT models by 4.40% and 3.21%, respectively. This finding confirms the effectiveness of the KNN model in crop classification, as previously reported by Xiao et al. [41].
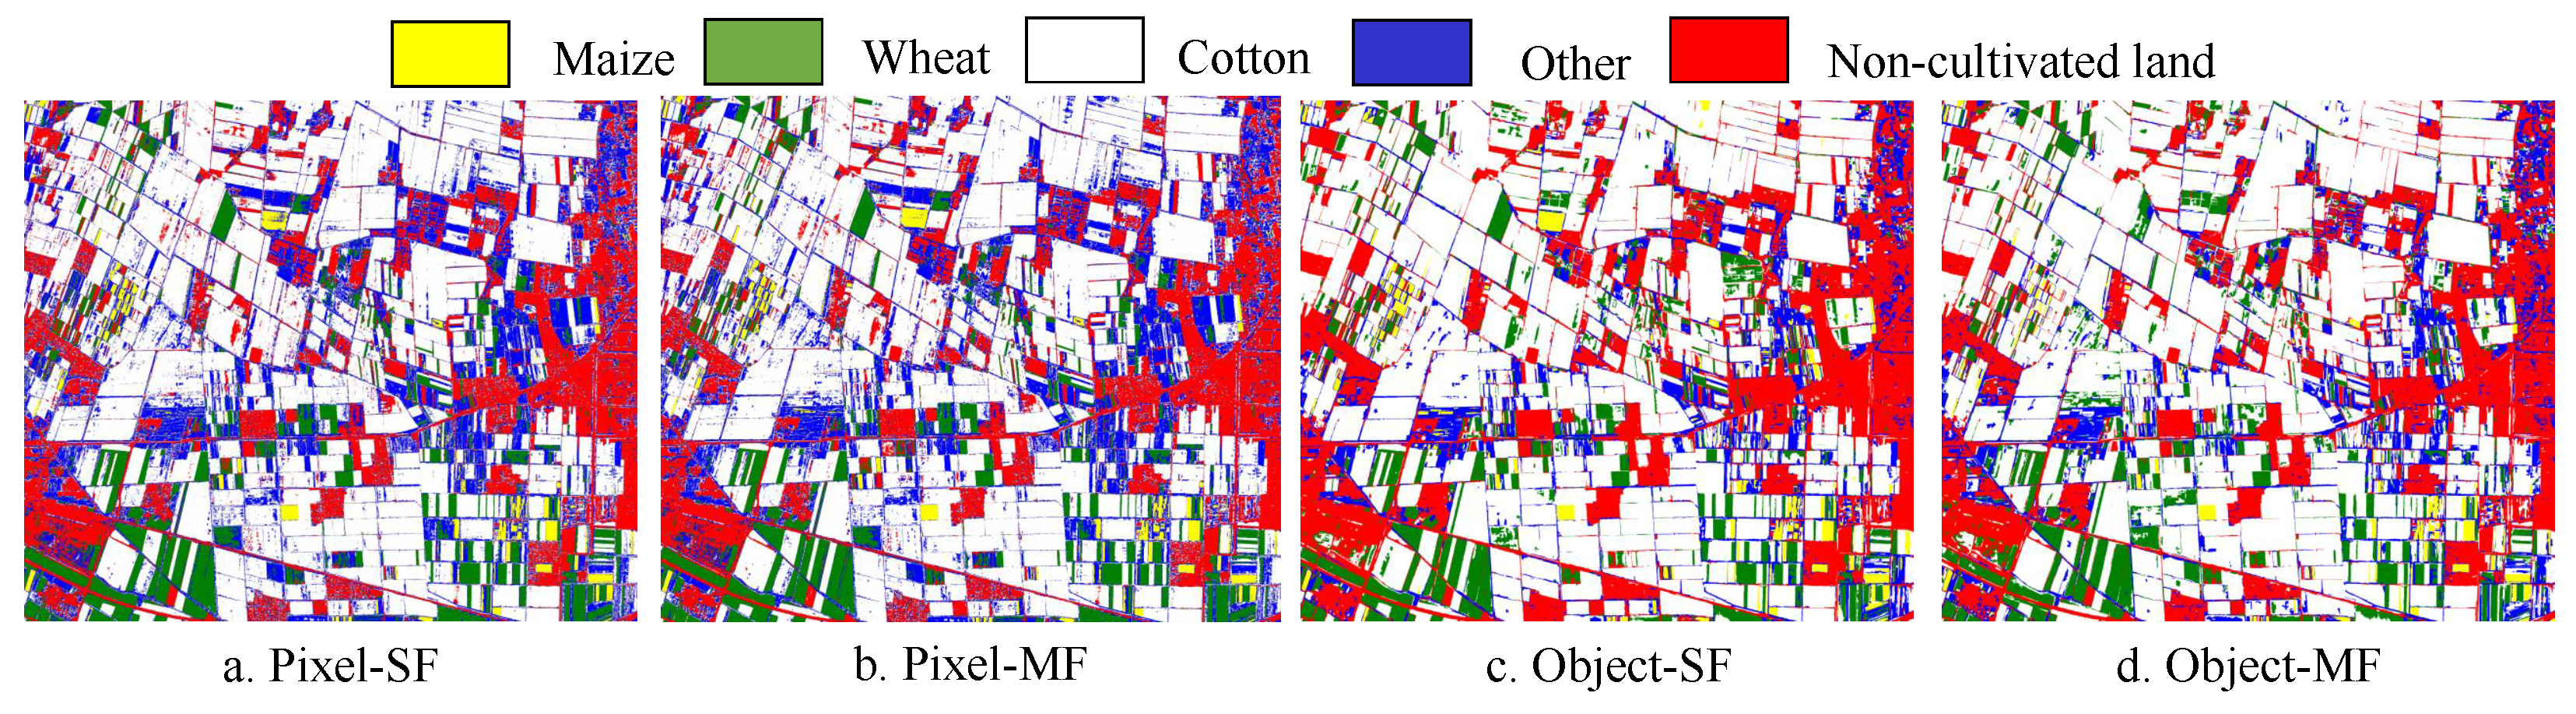
The results of this study confirm that FS methods play a crucial role in distinguishing crop types in different machine learning models, which is consistent with previous findings [42,43]. A robust FS method should be able to rank and reduce a large number of input features [
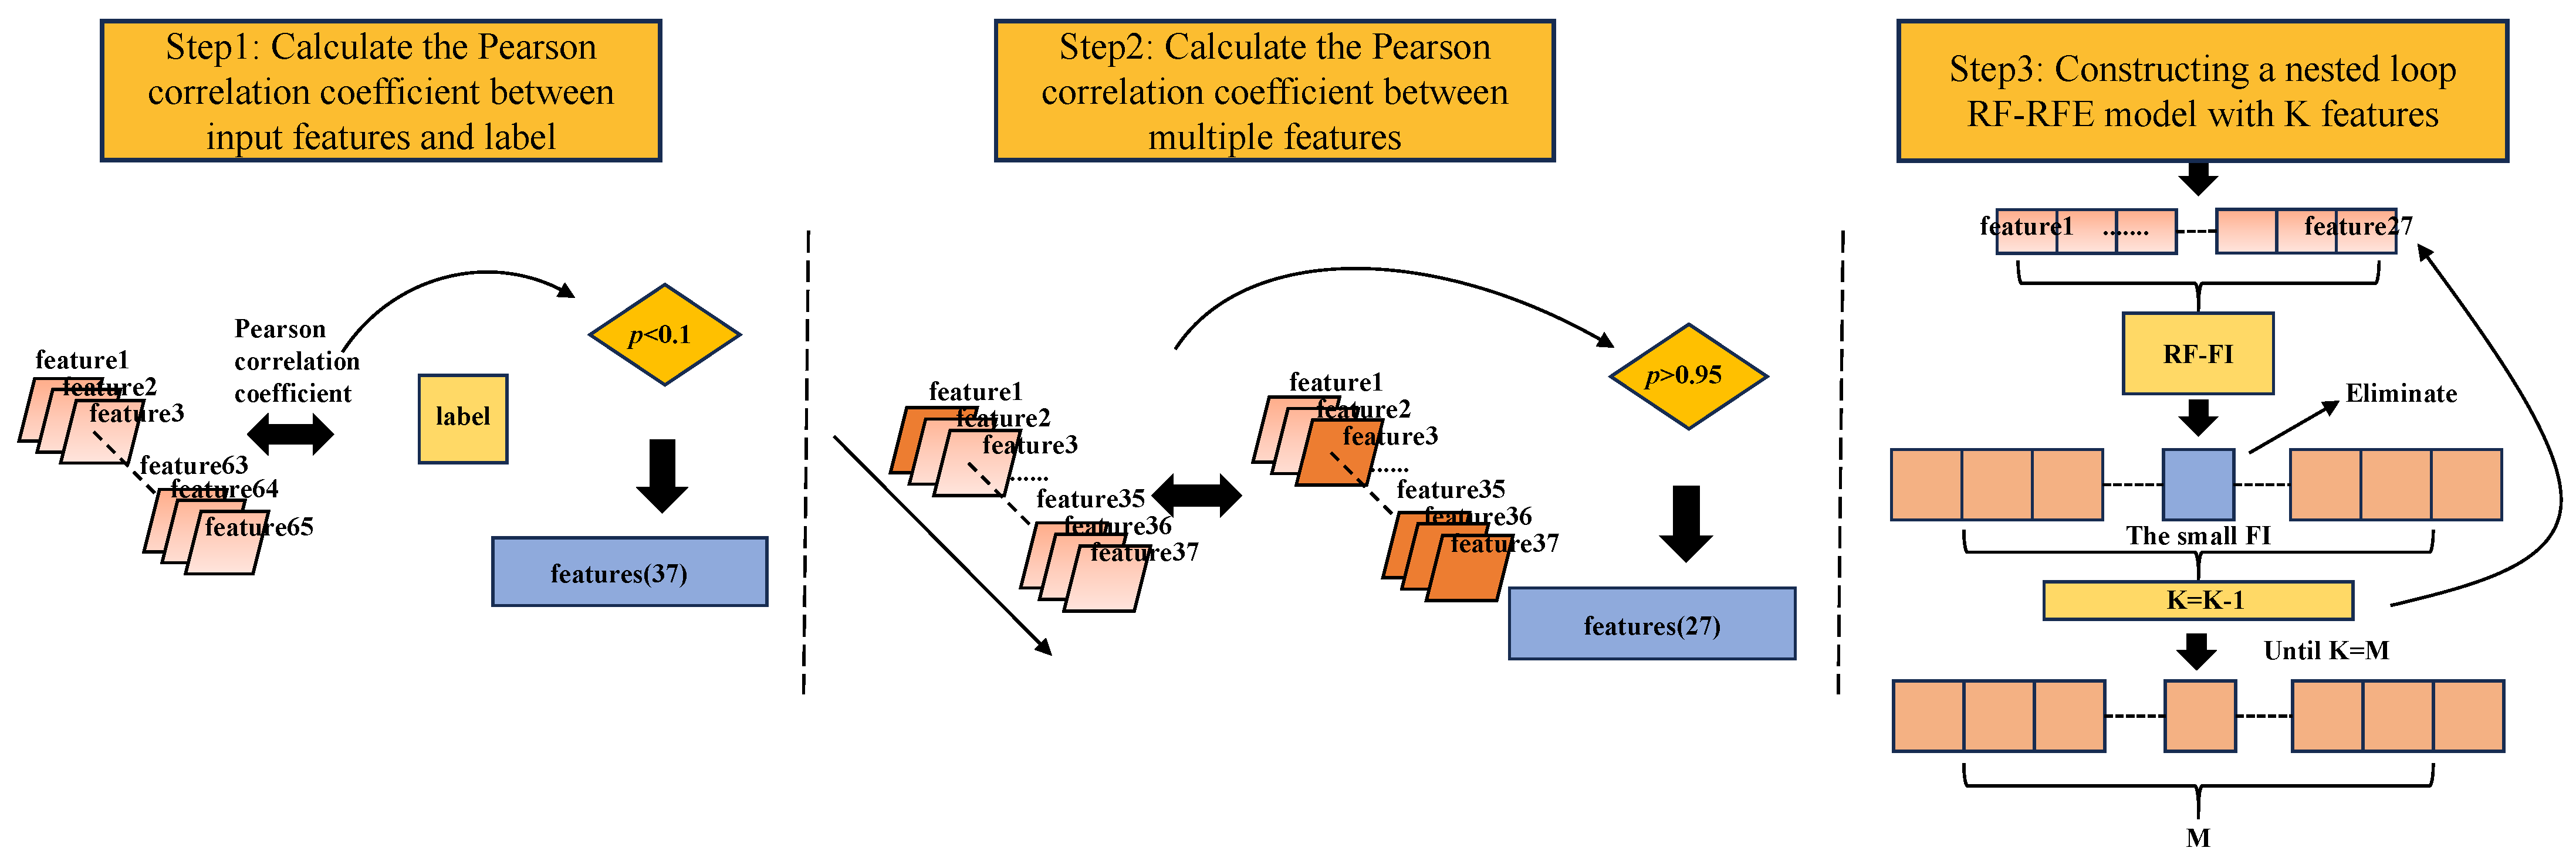
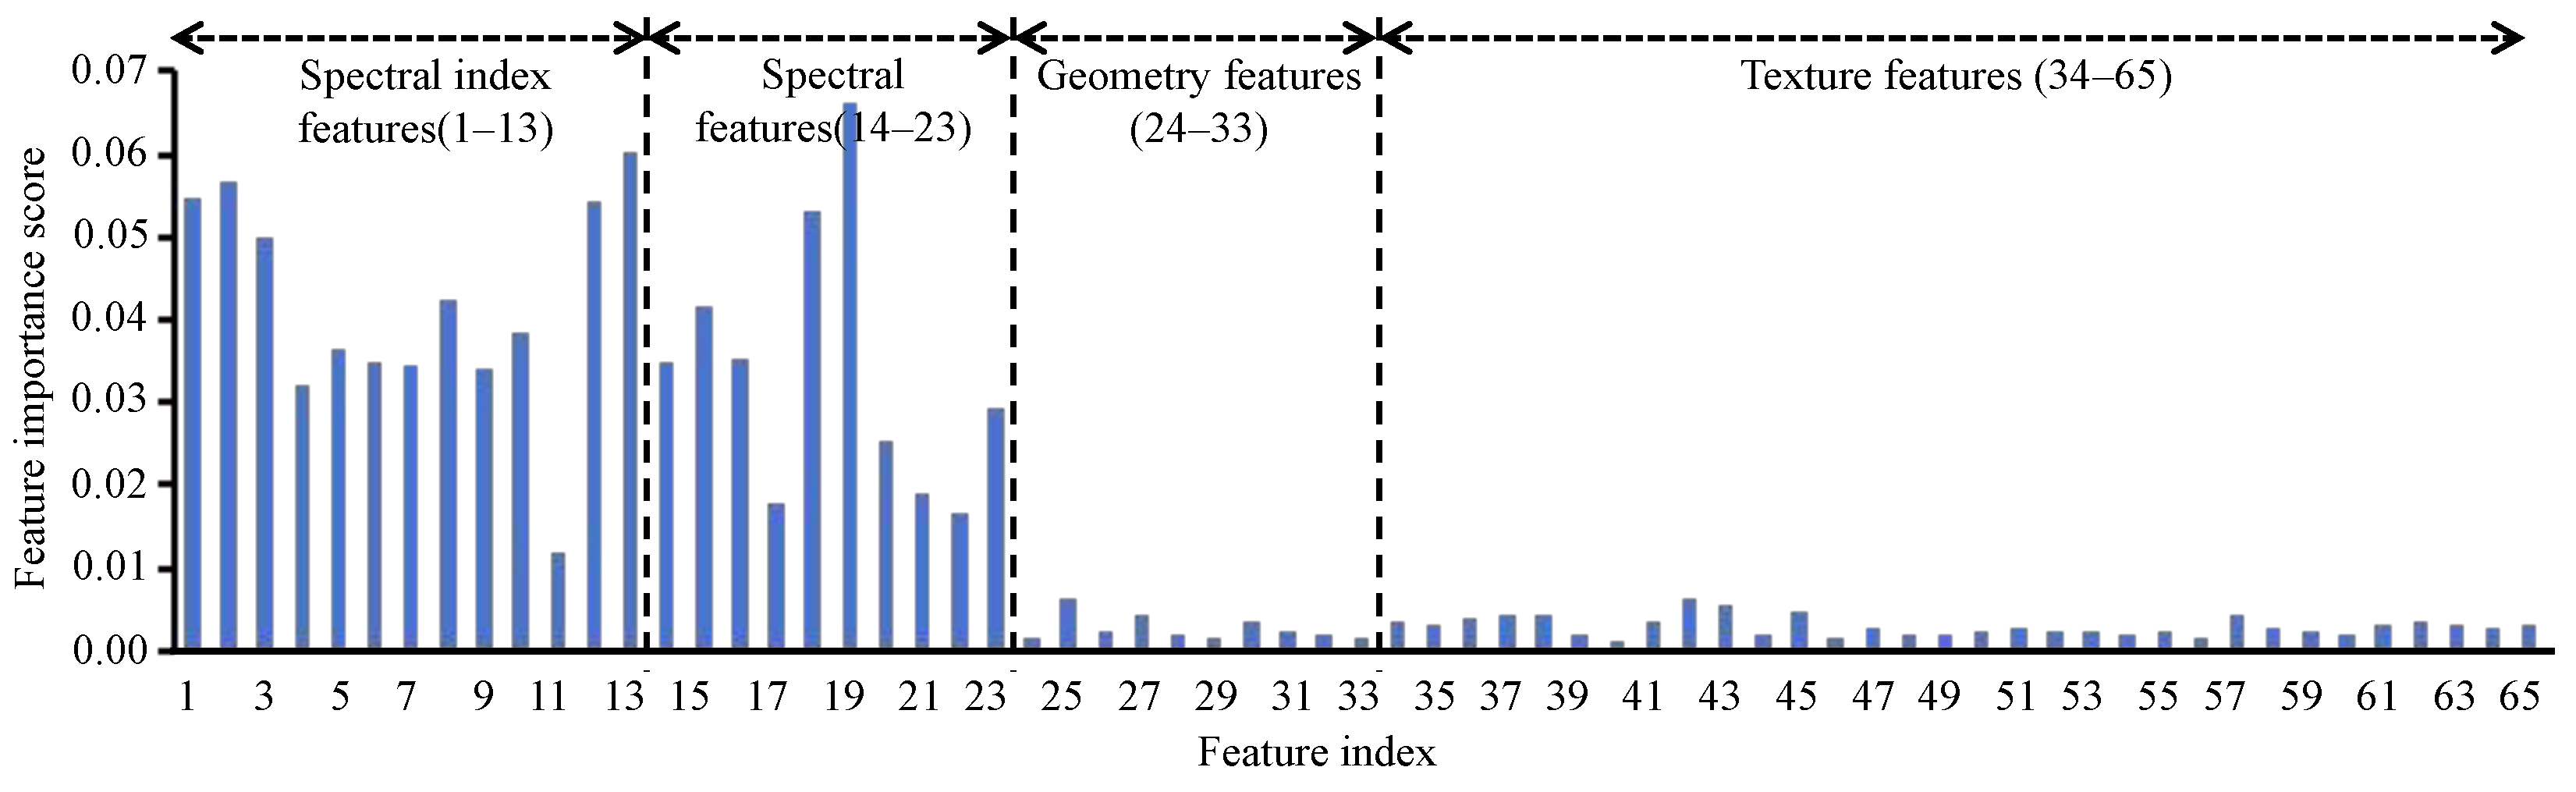
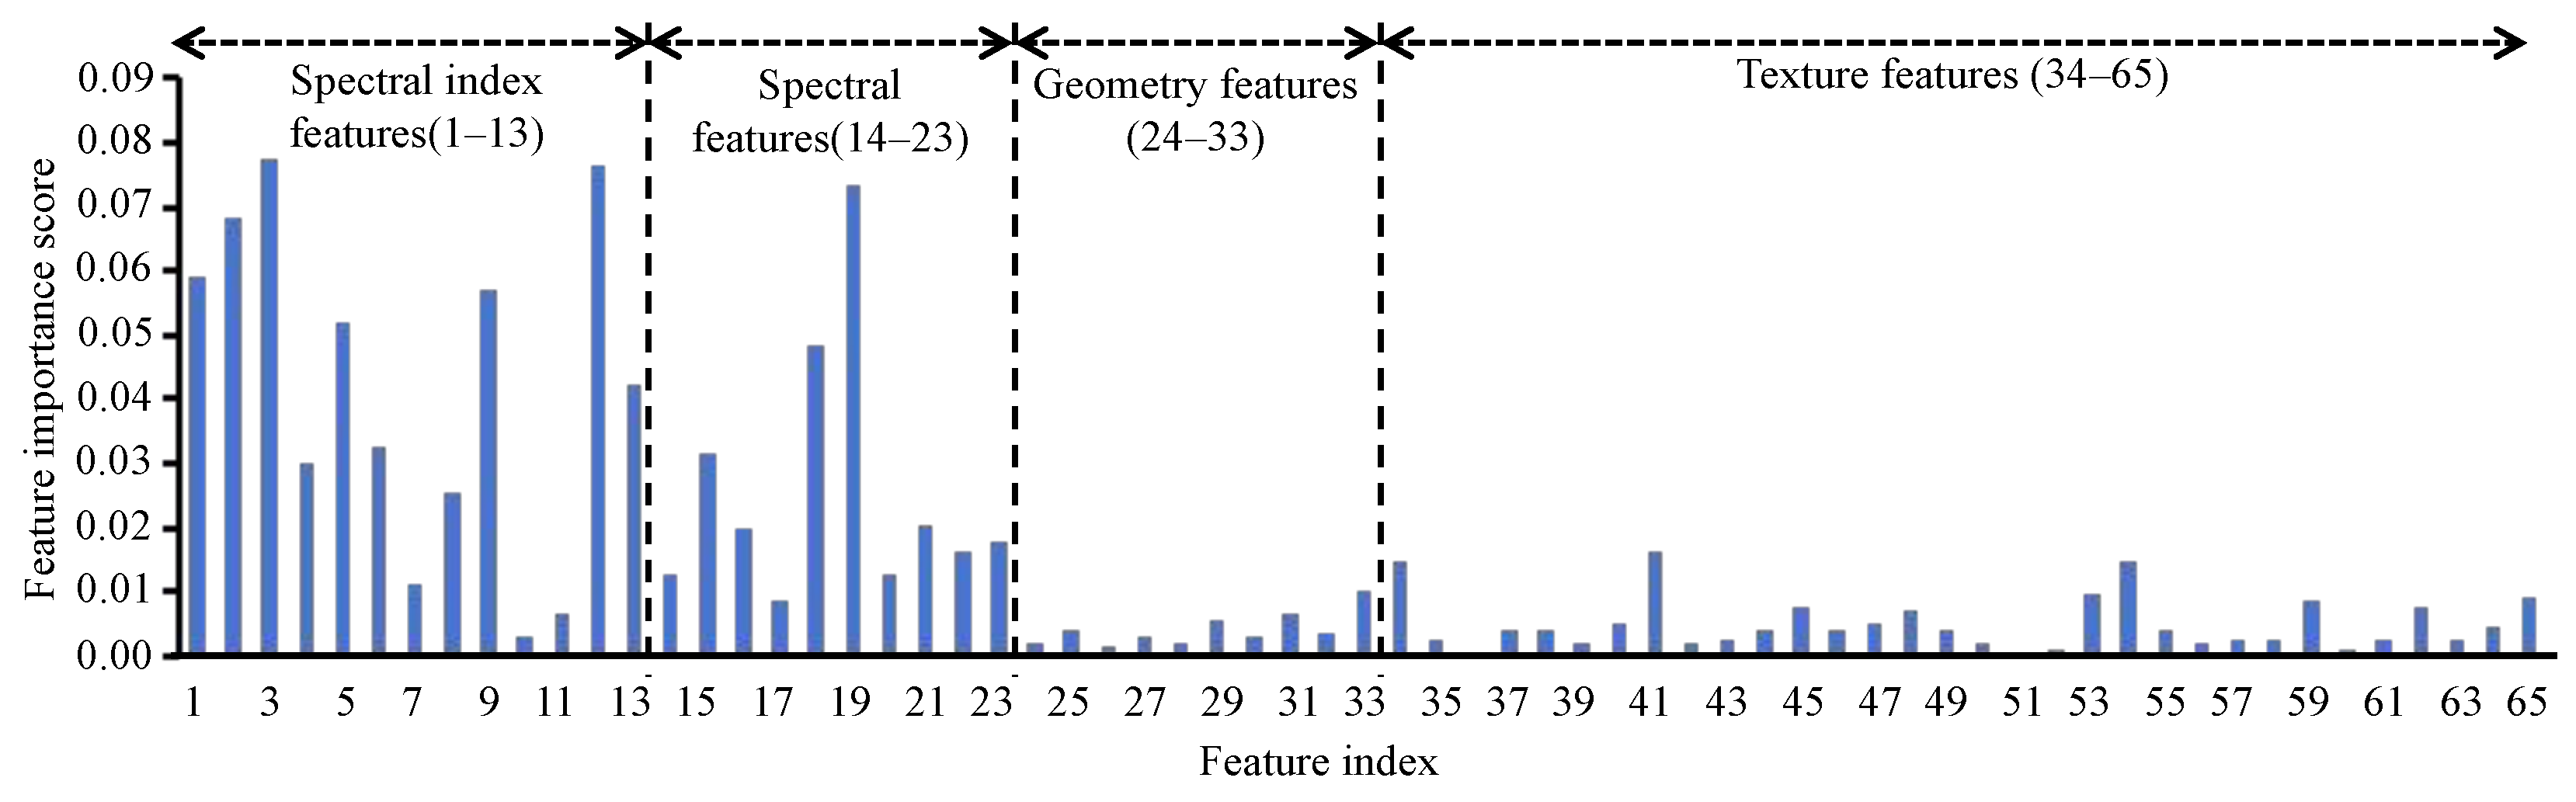
44]. In this study, we used the OF-RF-RFE method to select features and successfully reduced the initial sixty-five features to eight. Based on these eight features, the classification accuracy of the KNN model was improved by 2.60%. This indicates that the proposed OF-RF-RFE method is effective in crop classification. Compared with the OF-RF-FI algorithm and OF-XGBoost, the OF-RF-RFE algorithm performs better in feature selection for crop classification. GI, NDVI, RVI, Blue_Mean, Brightness, and Green_Mean are the features jointly selected by the three feature selection methods, which indicates that spectral and spectral index features have significant advantages in crop type identification [45].
Comparing our results with existing studies, Wang et al. [46] achieved the highest OA of 77.12% by classifying large-scale regional crop types by combining four machine learning models and two deep learning models with time-series satellite data. Fu et al. [28] constructed features based on multiscale segmentation and extracted crop information for the river valley area based on Landsat imagery. The OA was 86.97% and the kappa coefficient was 0.82. In comparison, this study used feature selection combined with the object-oriented KNN model to classify crops in Shihezi Reclamation Area with OA over 90.68% and kappa coefficient over 0.83. Our results show higher crop classification accuracy than previous studies, which suggests that the KNN model can be used to classify crops in Shihezi Reclamation Area by using the OF-RF-RFE method to optimize the feature subset and achieve better classification results.
In this study, we describe in detail the methodological framework adopted, including the selection of key algorithms, parameter settings, and the feature extraction and selection process. The methods were carefully designed to be adaptable to different regional datasets and environmental conditions. Our study area covers a wide range of crop types, including major food crops (maize and wheat) and important cash crops (cotton), which are grown globally, and thus our methods have good generalization capabilities and can be directly applied to other regions with similar crop types. Our proposed method is not only applicable to the mapping of large “non-food” areas but also significantly improves the accuracy of image classification, thus providing a new methodological reference for large-scale remote sensing monitoring, which is of great significance for the future monitoring of crop dynamics on arable land in other areas.
In this paper, some progress has been made in the monitoring research of “staple-crop-shifting” cultivated land by using GF-6 remote sensing images. It lays a foundation for future research, but there are still some important parts that need to be further explored and discussed in depth:
(1)
The KNN algorithm for object-oriented multi-feature selection based on GF-6 remote sensing images is used to carry out the study of “staple-crop-shifting” cultivated land, and it has achieved good recognition accuracy and stability. With the continuous development of information technology, deep-learning-based methods have achieved remarkable results in the field of image processing. Therefore, in future research, we can further explore the comparative analysis of deep learning algorithms and the algorithm of this study in order to explore a more accurate and efficient monitoring method of “staple-crop-shifting”.
(2)
This study focuses on the effects of different characteristic variables of cotton, maize, wheat, and other crops regarding the identification of “staple-crop-shifting” information of cultivated land in the study area, and the time span of identification is years. In future studies, we will focus on the contribution of different months of imagery data to crop type extraction in order to realize the integration of time series and features. In order to improve the applicability of the model, we will also conduct experimental work for more crop types and regions to validate and improve the model algorithm, and explore the temporal and spatial variations that affect the accuracy.

6. Conclusions

In this study, based on GF-6 remote sensing images, the best scale segmentation and optimal feature construction of the image are performed via the ESP2 algorithm and OFSM, crop classification is performed by combining KNN, RF, and DT classification models, and the results are evaluated for accuracy by using the validation dataset, and, finally, the optimal feature selection method (OF-RF-RFE) is combined with the optimal object-oriented model (KNN), which proposes a new crop classification method based on object-oriented multi-feature optimization to monitor crops in Shihezi Reclamation Area in terms of “staple-crop-shifting”. The main conclusions are as follows:
(1)
Feature optimization can significantly improve classification performance. The optimal feature space constructed in this study performs well in classifying the three main crops of cotton, maize, and wheat in the study area. It can effectively distinguish different crop types, and the producer accuracy of each crop type is higher than 76%. The use of the OF-RF-RFE(8) feature combination method can effectively improve the monitoring accuracy, with an average increase of 1.31% in OA and 2.68% in kappa coefficient compared to NO(65), while the number of feature variables was reduced from sixty-five to eight. Compared with other feature selection methods, such as TF-RF-FI(27), TF-XGBoost-FI(27), TF-RF-FI(8), TF-XGBoost-FI(8), OF-RF-FI(8), and OF-XGBoost-FI(8), the OA method is improved by 0.11%, 0.93%, 2.72%, 8.21%, 0.25%, and 4.55% on average, and the kappa coefficients are improved by 0.66%, 2.42%, 5.15%, 15.46%, 0.49%, and 9.15% on average, respectively.
(2)
The choice of classification model is crucial for improving the accuracy. When the OF-RF-RFE(8) feature combination method is used, the KNN model exhibits the highest classification accuracy and confidence, with OA reaching 90.68% and kappa coefficient reaching 0.8357. Compared with RF and DT, OA is improved by 5.55% and 5.92%, and the kappa coefficient is improved by 11.61% and 10.94%, respectively.
(3)
Object-oriented crop classification of remote sensing images is a feasible approach. Pixel-based classification results often show the phenomenon of “salt and pepper noise”, while the plot boundaries of object-oriented classification results are more obvious and more in line with the actual planting structure of the crop space. The object-oriented approach combined with multi-feature optimization for crop classification achieves the best results. Compared with the results based on pixel-level single-feature and multi-feature classification, OA is improved by 9.47% and 6.95%, and the kappa coefficient is improved by 7.36% and 3.61%, respectively.

Author Contributions

Y.C.: methodology, software, writing, editing, data analysis, result verification. J.D.: funding acquisition, methodology, supervision. G.Z.: data curation, supervision. M.X.: methodology, review. Z.J.: methodology, review. All authors have read and agreed to the published version of the manuscript.

Funding

This study was supported by program for talent research and the independent research project of Shihezi University in 2023 (ZZZC2023009).

Institutional Review Board Statement

Not applicable.

Data Availability Statement

The authors do not have permission to share data.

Conflicts of Interest

The authors declare no conflicts of interest.

References

  1. Circular of the General Office of the State Council on Resolutely Stopping the “Non-Agricultural” Conversion of Cultivated Land. 2020. Available online: http://www.gov.cn/zhengce/content/2020-09/15/content_5543645.htm (accessed on 17 March 2024).
  2. Notice of the State Council on Printing and Distributing the “14th Five-Year Plan” to Promote Agricultural and Rural Modernization. 2020. Available online: http://www.gov.cn/zhengce/content/2022-02/11/content_5673082.htm (accessed on 17 March 2024).
  3. Mengting, J.; Qüan, X.; Peng, G.; Baohua, H.; Jun, J. Crop Classification Method from UAV Images based on Object-Oriented Multi-feature Learning. Remote Sens. Technol. Appl. 2023, 38, 588–598. [Google Scholar]
  4. Zhang, P.; Hu, S. Fine crop classification by remote sensing in complex planting areas based on field parcel. Nongye Gongcheng Xuebao/Transactions Chin. Soc. Agric. Eng. 2019, 35, 125–134. [Google Scholar]
  5. Yao, J.; Wu, J.; Xiao, C.; Zhang, Z.; Li, J. The Classification Method Study of Crops Remote Sensing with Deep Learning, Machine Learning, and Google Earth Engine. Remote Sens. 2022, 14, 2758. [Google Scholar] [CrossRef]
  6. Ma, W.; Jia, W.; Su, P.; Feng, X.; Liu, F.; Wang, J.A. Mapping Highland Barley on the Qinghai–Tibet Combing Landsat OLI Data and Object-Oriented Classification Method. Land 2021, 10, 1022. [Google Scholar] [CrossRef]
  7. Tariq, A.; Yan, J.; Gagnon, A.S.; Riaz Khan, M.; Mumtaz, F. Mapping of cropland, cropping patterns and crop types by combining optical remote sensing images with decision tree classifier and random forest. Geo-Spat. Inf. Sci. 2023, 26, 302–320. [Google Scholar] [CrossRef]
  8. Yin, J.; Zhou, L.; Li, L.; Zhang, Y.; Huang, W.; Zhang, H.; Wang, Y.; Zheng, S.; Fan, H.; Ji, C.; et al. A comparative study on wheat identification and growth monitoring based on multi-source remote sensing data. Remote Sens. Technol. Appl. 2021, 36, 332–341. [Google Scholar]
  9. Su, T.; Zhang, S. Object-based crop classification in Hetao plain using random forest. Earth Sci. Inform. 2021, 14, 119–131. [Google Scholar] [CrossRef]
  10. Liang, J.; Zheng, Z.; Xia, S.; Zhang, X.; Tang, Y. Crop recognition and evaluationusing red edge features of GF-6 satellite. Yaogan Xuebao/J. Remote Sens. 2020, 24, 1168–1179. [Google Scholar] [CrossRef]
  11. Li, H.; Tian, Y.; Zhang, C.; Zhang, S.; Atkinson, P.M. Temporal Sequence Object-based CNN (TS-OCNN) for crop classification from fine resolution remote sensing image time-series. Crop J. 2022, 10, 1507–1516. [Google Scholar] [CrossRef]
  12. Ghosh, A.; Joshi, P.K. A comparison of selected classification algorithms for mapping bamboo patches in lower Gangetic plains using very high resolution WorldView 2 imagery. Int. J. Appl. Earth Obs. Geoinf. 2014, 26, 298–311. [Google Scholar] [CrossRef]
  13. Su, T. Object-based feature selection using class-pair separability for high-resolution image classification. Int. J. Remote Sens. 2020, 41, 238–271. [Google Scholar] [CrossRef]
  14. Li, D.; Ke, Y.; Gong, H.; Li, X. Object-Based Urban Tree Species Classification Using Bi-Temporal WorldView-2 and WorldView-3 Images. Remote Sens. 2015, 7, 16917–16937. [Google Scholar] [CrossRef]
  15. Bofana, J.; Zhang, M.; Nabil, M.; Wu, B.; Tian, F.; Liu, W.; Zeng, H.; Zhang, N.; Nangombe, S.S.; Cipriano, S.A.; et al. Comparison of Different Cropland Classification Methods under Diversified Agroecological Conditions in the Zambezi River Basin. Remote Sens. 2020, 12, 2096. [Google Scholar] [CrossRef]
  16. Puissant, A.; Rougier, S.; Stumpf, A. Object-oriented mapping of urban trees using Random Forest classifiers. Int. J. Appl. Earth Obs. Geoinf. 2014, 26, 235–245. [Google Scholar] [CrossRef]
  17. Shen, Y.; Zhang, J.; Yang, L.; Zhou, X.; Li, H.; Zhou, X. A Novel Operational Rice Mapping Method Based on Multi-Source Satellite Images and Object-Oriented Classification. Agronomy 2022, 12, 3010. [Google Scholar] [CrossRef]
  18. Tatsumi, K.; Yamashiki, Y.; Canales Torres, M.A.; Taipe, C.L.R. Crop classification of upland fields using Random forest of time-series Landsat 7 ETM+ data. Comput. Electron. Agric. 2015, 115, 171–179. [Google Scholar] [CrossRef]
  19. Kumar, P.; Gupta, D.K.; Mishra, V.N.; Prasad, R. Comparison of support vector machine, artificial neural network, and spectral angle mapper algorithms for crop classification using LISS IV data. Int. J. Remote Sens. 2015, 36, 1604–1617. [Google Scholar] [CrossRef]
  20. Luo, C.; Qi, B.; Liu, H.; Guo, D.; Lu, L.; Fu, Q.; Shao, Y. Using Time Series Sentinel-1 Images for Object-Oriented Crop Classification in Google Earth Engine. Remote Sens. 2021, 13, 561. [Google Scholar] [CrossRef]
  21. Xue, H.; Xu, X.; Zhu, Q.; Yang, G.; Long, H.; Li, H.; Yang, X.; Zhang, J.; Yang, Y.; Xu, S.; et al. Object-Oriented Crop Classification Using Time Series Sentinel Images from Google Earth Engine. Remote Sens. 2023, 15, 1353. [Google Scholar] [CrossRef]
  22. Zhu, H.; Luo, C.; Guan, H.; Zhang, X.; Yang, J.; Song, M.; Liu, H. Object-oriented extraction of maize fallen area based on multi-source satellite remote sensing images. Remote Sens. Technol. Appl. 2022, 37, 599–607. [Google Scholar]
  23. Wang, J.Y.; Cai, Z.W.; Wang, W.J.; Wei, H.D.; Wang, C.; Li, Z.X.; Li, X.N.; Hu, Q. Integrating Multi-Source Gaofen Images and Object-Based Methods for Crop Type Identification in South China. Sci. Agric. Sin. 2023, 56, 2474. [Google Scholar] [CrossRef]
  24. Zhu, Z.; Gallant, A.L.; Woodcock, C.E.; Pengra, B.; Olofsson, P.; Loveland, T.R.; Jin, S.; Dahal, D.; Yang, L.; Auch, R.F. Optimizing selection of training and auxiliary data for operational land cover classification for the LCMAP initiative. ISPRS J. Photogramm. Remote Sens. 2016, 122, 206–221. [Google Scholar] [CrossRef]
  25. Niu, Q.K.; Liu, L.I.; Huang, G.H.; Cheng, Q.Y.; Cheng, Y.M. Extraction of complex crop structure in the Hetao Irrigation District of Inner Mongolia using GEE and machine learning. Trans. Chin. Soc. Agric. Eng. Trans. CSAE 2022, 38, 165–174. [Google Scholar]
  26. Luo, H.; Li, M.; Dai, S.; Li, H.; Li, Y.; Hu, Y.; Zheng, Q.; Yu, X.; Fang, J. Combinations of Feature Selection and Machine Learning Algorithms for Object-Oriented Betel Palms and Mango Plantations Classification Based on Gaofen-2 Imagery. Remote Sens. 2022, 14, 1757. [Google Scholar] [CrossRef]
  27. Zhang, K.; Chen, Y.; Zhang, B.; Hu, J.; Wang, W. A Multitemporal Mountain Rice Identification and Extraction Method Based on the Optimal Feature Combination and Machine Learning. Remote Sens. 2022, 14, 5096. [Google Scholar] [CrossRef]
  28. Fu, X.; Zhou, W.; Zhou, X.; Hu, Y. Crop Mapping and Spatio–Temporal Analysis in Valley Areas Using Object-Oriented Machine Learning Methods Combined with Feature Optimization. Agronomy 2023, 13, 2467. [Google Scholar] [CrossRef]
  29. Zhou, Q.b.; Yu, Q.y.; Jia, L.; Wu, W.b.; Tang, H.j. Perspective of Chinese GF-1 high-resolution satellite data in agricultural remote sensing monitoring. J. Integr. Agric. 2017, 16, 242–251. [Google Scholar] [CrossRef]
  30. Zhang, X.; Wang, X.; Zhou, Z.; Li, M.; Jing, C. Spatial Quantitative Model of Human Activity Disturbance Intensity and Land Use Intensity Based on GF-6 Image, Empirical Study in Southwest Mountainous County, China. Remote Sens. 2022, 14, 4574. [Google Scholar] [CrossRef]
  31. Ye, Z.; Sheng, Z.; Liu, X.; Ma, Y.; Wang, R.; Ding, S.; Liu, M.; Li, Z.; Wang, Q. Using machine learning algorithms based on GF-6 and Google Earth engine to predict and map the spatial distribution of soil organic matter content. Sustainability 2021, 13, 14055. [Google Scholar] [CrossRef]
  32. Zou, C.; Chen, D.; Chang, Z.; Fan, J.; Zheng, J.; Zhao, H.; Wang, Z.; Li, H. Early Identification of Cotton Fields Based on Gf-6 Images in Arid and Semiarid Regions (China). Remote Sens. 2023, 15, 5326. [Google Scholar] [CrossRef]
  33. Li, X.s.; Li, H.; Chen, D.h.; Liu, Y.f.; Liu, S.s.; Liu, C.f.; Hu, G.q. Multiple classifiers combination method for tree species identification based on GF-5 and GF-6. Sci. Silvae Sin. 2020, 56, 93–104. [Google Scholar]
  34. Drǎguţ, L.; Tiede, D.; Levick, S.R. ESP: A tool to estimate scale parameter for multiresolution image segmentation of remotely sensed data. Int. J. Geogr. Inf. Sci. 2010, 24, 859–871. [Google Scholar] [CrossRef]
  35. Wang, N.; Li, Q.; Du, X.; Zhang, Y.; Zhao, L.; Wang, H. Identification of main crops based on the univariate feature selection in Subei. J. Remote Sens 2017, 21, 519–530. [Google Scholar] [CrossRef]
  36. Georganos, S.; Grippa, T.; Vanhuysse, S.; Lennert, M.; Shimoni, M.; Kalogirou, S.; Wolff, E. Less is more: Optimizing classification performance through feature selection in a very-high-resolution remote sensing object-based urban application. GIScience Remote Sens. 2018, 55, 221–242. [Google Scholar] [CrossRef]
  37. Ma, L.; Fu, T.; Blaschke, T.; Li, M.; Tiede, D.; Zhou, Z.; Ma, X.; Chen, D. Evaluation of Feature Selection Methods for Object-Based Land Cover Mapping of Unmanned Aerial Vehicle Imagery Using Random Forest and Support Vector Machine Classifiers. ISPRS Int. J. Geo-Inf. 2017, 6, 51. [Google Scholar] [CrossRef]
  38. Wang, C.; Pan, Y.; Chen, J.; Ouyang, Y.; Rao, J.; Jiang, Q. Indicator element selection and geochemical anomaly mapping using recursive feature elimination and random forest methods in the Jingdezhen region of Jiangxi Province, South China. Appl. Geochem. 2020, 122, 104760. [Google Scholar] [CrossRef]
  39. Zheng, H.; Yuan, J.; Chen, L. Short-Term Load Forecasting Using EMD-LSTM Neural Networks with a Xgboost Algorithm for Feature Importance Evaluation. Energies 2017, 10, 1168. [Google Scholar] [CrossRef]
  40. Zhang, S.; Li, X.; Zong, M.; Zhu, X.; Cheng, D. Learning k for kNN Classification. ACM Trans. Intell. Syst. Technol. 2017, 8, 43. [Google Scholar] [CrossRef]
  41. Xiao, X.; Lu, Y.; Huang, X.; Chen, T. Temporal Series Crop Classification Study in Rural China Based on Sentinel-1 SAR Data. IEEE J. Sel. Top. Appl. Earth Obs. Remote Sens. 2021, 14, 2769–2780. [Google Scholar] [CrossRef]
  42. Fei, H.; Fan, Z.; Wang, C.; Zhang, N.; Wang, T.; Chen, R.; Bai, T. Cotton Classification Method at the County Scale Based on Multi-Features and Random Forest Feature Selection Algorithm and Classifier. Remote Sens. 2022, 14, 829. [Google Scholar] [CrossRef]
  43. Kang, Y.; Hu, X.; Meng, Q.; Zou, Y.; Zhang, L.; Liu, M.; Zhao, M. Land Cover and Crop Classification Based on Red Edge Indices Features of GF-6 WFV Time Series Data. Remote Sens. 2021, 13, 4522. [Google Scholar] [CrossRef]
  44. Bakhshipour, A. Cascading Feature Filtering and Boosting Algorithm for Plant Type Classification Based on Image Features. IEEE Access 2021, 9, 82021–82030. [Google Scholar] [CrossRef]
  45. Hu, Y.; Zeng, H.; Tian, F.; Zhang, M.; Wu, B.; Gilliams, S.; Li, S.; Li, Y.; Lu, Y.; Yang, H. An Interannual Transfer Learning Approach for Crop Classification in the Hetao Irrigation District, China. Remote Sens. 2022, 14, 1208. [Google Scholar] [CrossRef]
  46. Wang, X.; Zhang, J.; Xun, L.; Wang, J.; Wu, Z.; Henchiri, M.; Zhang, S.; Zhang, S.; Bai, Y.; Yang, S.; et al. Evaluating the Effectiveness of Machine Learning and Deep Learning Models Combined Time-Series Satellite Data for Multiple Crop Types Classification over a Large-Scale Region. Remote Sens. 2022, 14, 2341. [Google Scholar] [CrossRef]
Figure 1. Area of study.
Agriculture 14 00500 g001
Figure 2. Pictures of three main crops planted.
Agriculture 14 00500 g002
Figure 3. Technology roadmap.
Agriculture 14 00500 g003
Figure 4. Variation curve of local variance and variance change rate.
Agriculture 14 00500 g004
Figure 5. Local region segmentation result.
Agriculture 14 00500 g005
Figure 6. The implementation process of optimal feature selection method.
Agriculture 14 00500 g006
Figure 7. Correlations between feature variables and labels.
Agriculture 14 00500 g007
Figure 8. Pearson correlation coefficient data between features of different feature selection methods: (a) 65 feature correlations, (b) OFSM Step 1:37 feature correlation, (c) OFSM Step 2:27 feature correlation, (d) 27 feature correlations of RF–FI, (e) 27 feature correlations of XGboost–FI, (f) 27 feature correlations of RF–RFE.
Agriculture 14 00500 g008
Figure 9. RF–FI feature variable importance scores.
Agriculture 14 00500 g009
Figure 10. XGBoost–FI feature variable importance scores.
Agriculture 14 00500 g010
Figure 11. Object-oriented multi-feature classification result graph.
Agriculture 14 00500 g011
Figure 12. Producer accuracy and user accuracy of each crop type. Note: UA is user accuracy and PA is producer accuracy.
Agriculture 14 00500 g012
Figure 13. Classification results of different classification models.
Agriculture 14 00500 g013
Figure 14. Precision results of each crop based on OF-RF-RFE (8).
Agriculture 14 00500 g014
Figure 15. Classification results of different schemes.
Agriculture 14 00500 g015
Figure 16. Monitoring results of “staple-crop-shifting” change in 2020–2022; A → B means that crop A has changed to crop B.
Agriculture 14 00500 g016
Table 1. Specifications of GF-6 satellite.
Band NameSpectral Range (μm)Spatial Resolution (m)Width (km)
Blue0.45∼0.52890
Green0.52∼0.608
Red0.63∼0.698
NIR 10.76∼0.908
PAN 20.76∼0.902
1 NIR is the near-infrared band; 2 PAN is the panchromatic band.
Table 2. Feature variable set.
Feature TypeCharacteristic Factors
Spectral index features (13)1. Difference Vegetation Index (DVI) 2. Greenness Index (GI) 3. Green Light Normalized Difference Vegetation Index (GNDVI) 4. Modified Chlorophyll Absorption in Reflectance Index (MCAIR) 5. Modified Soil Adjusted Vegetation Index (MSAVI) 6. Modified Simple Ratio (MSR) 7. Normalized Difference Vegetation Index (NDVI) 8. Renormalized Difference Vegetation Index (RDVI) 9. Ratio Vegetation Index (RVI) 10. Soil Adjusted Vegetation Index (SAVI) 11. Transformed Chlorophyll Absorption in Reflectance Index (TCARI) 12. Triangular Vegetation Index (TVI) 13. Green Vegetation Index (Vl green)
Spectral features (10)14. Brightness 15. Blue_Mean 16. Green_Mean 17. Red_Mean 18. NIR_Mean 19. Max.Diff 20. Blue_Standard Deviation (Blue_Std) 21. Green_Standard Deviation (Green_Std) 22. Red_Standard Deviation (Red_Std) 23. NIR_Standard Deviation (NIR_Std)
Geometry features (10)24. Area 25. Length/Width 26. Number of Pixels 27. Asymmetry 28. Border Index 29. Compactness 30. Density, 31. Rectangular Fit 32. Roundness 33. Shape Index
Texture features (32)34. Blue Homogeneity (Blue_Hom) 35. Green Homogeneity (Green_Hom) 36. Red Homogeneity (Red_Hom) 37. Near-Infrared Homogeneity (Nir_Hom) 38. Blue Contrast (Blue_Contrast) 39. Green Contrast (Green_Contrast) 40. Red Contrast (Red_Contrast) 41. Near-Infrared Contrast (Nir_Contrast) 42. Blue Dissimilarity (Blue_Dissimilarity) 43. Green Dissimilarity (Green_Dissimilarity) 44. Red Dissimilarity (Red_Dissimilarity) 45. Near-Infrared Dissimilarity (Nir_Dissimilarity) 46. Blue Entropy (Blue_Entropy) 47. Green Entropy (Green_Entropy) 48. Red Entropy (Red_Entropy) 49. Near-Infrared Entropy (Nir_Entropy) 50. Blue Second Moment (Blue_Second moment) 51. Green Second Moment (Green_Second moment) 52. Red Second Moment (Red_Second moment) 53. Near-Infrared Second Moment (Nir_Second moment) 54. Blue Mean (Blue_GCLMMean) 55. Green Mean (Green_GCLMMean) 56. Red Mean (Red_GCLMMean) 57. Near-Infrared Mean (Nir_GCLMMean) 58. Blue Variance (Blue_Variance) 59. Green Variance (Green_Variance) 60. Red Variance (Red_Variance) 61. Near-Infrared Variance (Nir_Variance) 62. Blue Correlation (Blue_Correlation) 63. Green Correlation (Green_Correlation) 64. Red Correlation (Red_Correlation) 65. Near-Infrared Correlation (Nir_Correlation)
Note: numbers in () are the number of features.
Table 3. Ranking of OFSM feature importance scores.
Order of ImportanceFeature Selection Algorithm
OF-RF-FI OF-XGBoost
1GIGI
2NDVINDVI
3RVIRVI
4Blue_MeanGreen_Var
5BrightnessBlue_Mean
6Green_MeanRed_Dis
7Blue_StdBrightness
8Red_MeanGreen_Mean
Table 4. Object-oriented multi-feature classification result table.
ModelAccuracyFeature Selection Method
1 2 3 4 5 6 7 8 9
TF-RF-FI (27) TF-RF-RFE (27) TF-XGBoost-FI (27) TF-RF-FI (8) TF-XGBoost-FI (8) OF-RF-FI (8) OF-RF-RFE (8) OF-XGBoost-FI (8) NO (65)
KNNOA/%88.3388.8087.7686.7282.8190.2790.6884.1688.09
Kappa0.790.800.770.760.690.830.840.700.78
RFOA/%87.4287.8486.1682.2177.4685.3485.1381.8083.68
Kappa0.770.780.740.660.570.720.720.660.70
DTOA/%84.5087.9083.8683.4875.6684.2184.7680.9884.87
Kappa0.700.780.690.700.560.710.730.640.72
Note: the beginning of TF is the traditional feature selection algorithm, the beginning of OF is the best feature selection method in this paper, and NO is the method without feature selection. The number in parentheses () represents the number of features that reach the corresponding OA value.
Table 5. Comparison of classification accuracy of different schemes with RF.
SchemeScheme NameOAKappa
1Pixel-SF 175.880.65
2Pixel-MF 278.390.69
3Object-SF 383.370.68
4Object-MF 485.340.72
Note: 1 pixel-level single-feature-based classification; 2 pixel-level-based multi-feature classification; 3 object-oriented single-feature-based classification; 4 object-oriented multi-feature-based classification.
Table 6. Evaluation of classification accuracy of different schemes.
AccuracyCropClassification Scheme
Pixel-SF Pixel-MF Object-SF Object-MF
PA (%)Maize87.5087.5088.5589.14
Wheat69.2369.2375.2576.92
Cotton91.0191.0192.5695.24
Other57.8957.8942.1241.07
UA(%)Maize94.5387.5095.8381.82
Wheat60.0060.0076.4786.00
Cotton84.3886.1777.4885.12
Other59.4664.7177.9778.95
Table 7. Statistical table of crop area based on object-oriented OF_RF-RFE and KNN classification results (km2).
CropStaple CropCrash CropNoC 1TotalChanged
Maize Wheat Cotton Other
Maize0.220.400.740.550.252.178.55
Wheat3.250.703.550.550.252.178.55
Cotton5.711.2145.625.463.0961.10−8.08
Other1.210.352.396.075.1115.140.12
NoC 10.320.660.711.2819.9722.947.38
Total10.723.3353.0215.2630.32112.64-
Changed−8.557.978.08−0.12−7.38--
Note: the horizontal data are 2020 data and the vertical data are 2022 data; 1 NoC: non-cultivated land.
Disclaimer/Publisher’s Note: The statements, opinions and data contained in all publications are solely those of the individual author(s) and contributor(s) and not of MDPI and/or the editor(s). MDPI and/or the editor(s) disclaim responsibility for any injury to people or property resulting from any ideas, methods, instructions or products referred to in the content.

