Article

Dynamic Energy Use Efficiency, Carbon Input, and Agricultural Benefits of Multiple Cropping in Southern China—A Case Study from Guangdong Province

1
State Key Laboratory for Conservation and Utilization of Subtropical Agro-Bioresources, College of Agriculture, South China Agricultural University, Guangzhou 510642, China
2
Institute of Facility Agriculture, Guangdong Academy of Agricultural Sciences, Guangzhou 510640, China
3
Guangdong Province Key Laboratory of Crop Genetic Improvement, Crops Research Institute, Guangdong Academy of Agricultural Sciences, Guangzhou 510640, China
4
Zhanjiang Research Institute of Agricultural Sciences, Zhanjiang 524094, China
5
Scientific Observing and Experimental Station of Crop Cultivation in South China, Ministry of Agriculture and Rural Affairs, Guangzhou 510642, China
6
Guangzhou Key Laboratory for Science and Technology of Fragrant Rice, Guangzhou 510642, China
*
Author to whom correspondence should be addressed.
These authors contributed equally to this work.
Agriculture 2024, 14(4), 641; https://doi.org/10.3390/agriculture14040641
Submission received: 18 March 2024 / Revised: 4 April 2024 / Accepted: 18 April 2024 / Published: 22 April 2024
(This article belongs to the Section Agricultural Systems and Management)

Abstract

:
Background: With the purpose of exploring the development of new quality productive forces in Guangdong, the present study hypothesized that reducing energy and carbon inputs was beneficial for increasing Guangdong’s multi-cropping agricultural energy output and economic returns. Methods: The energy use efficiency of crop production and the corresponding carbon input and agricultural benefit trends from 2011 to 2021 were examined by linear regression analysis for Guangdong Province, China. The corresponding development trends were also predicted using a grey model. Results: The results indicated that the total energy output increased by 12.50%, wherein the energy productivity levels of peanuts, vegetables, mulberry, and fruits increased greatly (51.27–106.17%), while the total energy input and the total carbon input decreased by 12.17% and 6.37%, respectively. Moreover, the energy input per carbon input decreased by 6.19%, while the energy output per carbon input increased by 20.15%. Both energy-related indicators and economic-related indicators all had substantially increased (28.08–44.97% and 83.86–120.91%, respectively). Grey model predictions show that the agricultural output value increased steadily under the current agricultural policy of reducing fossil energy input. Conclusions: The current low-carbon and high-output agricultural model is beneficial for increasing Guangdong’s multi-cropping agricultural economic returns and mitigating greenhouse effects.

1. Introduction

Analyzing the current state of the global food system—with a specific focus on crop planting development and stable yield assurance for staple crops—has emerged as a central and enduring field of scholarly interest in the context of global food provision. The priority task for the Chinese government is the formulation of measures to improve nutrition and achieve sustainable food production [1,2]. With the expansion of China’s population from 1.35 billion in 2011 to 1.41 billion in 2021, the demand for agricultural products has increased, while the required resources and environmental carrying capacity have followed the opposite trend [3,4]. In 2023, the Ministry of Agriculture and Rural Affairs initiated a nationwide effort with the goal to substantially enhance the per unit area yield of major crops, such as grain and oil, in accordance with China’s resource endowment and production conditions [5]. Moreover, China has the most extensive smallholder production economy with great potential for sustainable agricultural intensification [6,7,8]. It is imperative for China’s agricultural development to shift from a high-input agriculture type to a modern ecological high-value agriculture type.
Multiple cropping (i.e., the practice of growing two or more crops on the same piece of land during one year) has remained the mainstream of Chinese agriculture from ancient times to the present, and plays a key role in China’s food security [9]. In particular, South China provides sufficient water and heat resources as well as development opportunities for multiple cropping cultivation, and Guangdong Province is a typical demonstration province in this regard [10]. In addition to direct economic benefits obtained by increasing the number of harvests and the biomass extracted, multiple cropping can also improve the function of agricultural systems and reduce detrimental environmental consequences associated with crop production [11]. The intensification of global warming has triggered a northward shift of China’s entire agro-climatic belt, resulting in an expansion of multiple cropping areas and an increase in the multiple cropping indices [12]. However, over the past 30 years, the expansion of multiple cropping systems triggered by climate change has increased greenhouse gas emissions in the North China Plain and its surrounding areas [13]. Moreover, climate change is also a key factor driving the change of the multiple cropping indices in Southwest China [14]. The resulting excessive use of chemical fertilizers and pesticides at the family scale also hinders the restoration of the ecological environment in hilly and mountainous (and similar) areas [15]. To ensure the high yield of multiple cropping products, multiple cropping inevitably requires a high input of agricultural factors (such as chemical fertilizers, pesticides, and diesel), which poses a threat to sustainable agricultural development. Analyzing the energy use efficiency (EUE) of agricultural inputs to study sustainable agriculture is a common and practical method [16,17]. Estimating the dynamic trends of productivity and carbon emissions in the production system can provide constructive insights for multi-cropping-sustainable agricultural policy adjustments. Therefore, the multiple cropping agriculture development strategy of Guangdong Province provides an instructive lesson for other multiple cropping planting areas.
In agricultural production, the consumption of energy is closely related to the carbon emissions intensity [18]. The reasonable and effective reduction in the total energy consumption of agricultural production without sacrificing the development of the agricultural economy while realizing a decoupling of agricultural energy consumption and carbon emissions from agricultural economic development remains a major problem associated with efforts to promote sustainable agricultural development [19]. By studying the decoupling stability coefficient, Zhen et al. [20] found that the threat of high-carbon crop production in Guangdong Province has not been eliminated. Moreover, the economic development and carbon emissions of Guangdong Province are in a state of weak decoupling [21]. The development of the agricultural economy is the main driving factor for reductions of carbon emissions in Guangdong Province [22]. However, the high-quality development value of land use in certain areas of western and northern Guangdong Province is low, and the economic value of ecological land in this area needs to be further examined to improve the versatility of the land [23]. The decline of rural areas and uncertain rural resilience under intergenerational changes are not conducive to the government’s stimulation efforts of rural economic vitality [24].
The Guangdong–Hong Kong–Macao Greater Bay Area (GBA) holds an important strategic position in China’s new development pattern and has been projected to grow into one of the most promising growth poles of the world in the future [25]. Agricultural development and food safety guarantees form the basis of the efforts to enhance the international competitiveness of the GBA and for creating a high-quality bay area lifestyle [26]. Because of the lack of natural resources in Hong Kong and Macao, the history of mainland agricultural product supply to Hong Kong and Macao can be traced back to the 1960s [27]. Guangdong Province remains the main production and supply base of fresh agricultural products and food in both Hong Kong and Macao [28]. High-quality agricultural development is related to major strategic issues of the transformation and upgrading of China’s macroeconomic structure and the food structure and nutritional structure of its residents [29]. It is of great significance to study the future development trend of agriculture in Guangdong Province for the future construction of production-living-ecological spaces in the GBA. Owing to its special institutional environment of ‘One country, two systems, and three tariff zones’, the regional coordinated development of GBA encompasses multiple geographical scales and complex relationships among various entities [30]. The future trend of multiple cropping agricultural production driven by the rapid economic development of the GBA remains to be further explored.
Hence, this article hypothesized that scientifically reducing and converting energy-carbon inputs in multiple cropping agriculture areas into energy output can result in higher agricultural returns in Guangdong. Through a series of related indicators and grey prediction models, the interactions between energy input, energy output, carbon input, and economic return in the multiple cropping production system of Guangdong Province from 2011 to 2021 were investigated. The relationships between these factors are disclosed with the goal to analyze the matching degree of resources and environmental carrying capacity as well as the sustainability of agricultural economic development. In doing so, this paper provides a scientific reference for the new quality productive forces used in the development of Guangdong, the future construction of the GBA, and the comprehensive launch of the ‘14th Five-Year Plan’.

2. Materials and Methods

2.1. Data

The analysis focused on calculating the energy inputs for agricultural crop production, the energy output of crop yields, and the corresponding carbon inputs in Guangdong Province from 2011 to 2021. The data originate from the Guangdong Statistical Yearbook and Guangdong Rural Statistical Yearbook [31].

2.2. Data Calculation Methods

The data calculation methods were mainly based on [32,33,34]. Energy input was calculated from statistics on agricultural production factors, which included machinery, chemical fertilizers, plastic agricultural film, diesel, and pesticides. Energy output was calculated from statistics on the total production of rice, tubers, soybeans, sugarcane, peanuts, tobacco, vegetables, tea, mulberry, and fruits (which includes all major crops grown in Guangdong Province). To calculate the energy-related indicators and carbon input, the data were converted into energy input, output, and carbon input levels using equivalent energy values and emission coefficients for each commodity. Supplemental Table S1 provides the energy equivalents for inputs and outputs [33,35,36,37,38,39], Supplemental Table S2 provides the emission coefficients for carbon inputs [40,41,42,43,44], and Supplemental Table S3 provides the abbreviations of the indicators related to energy, carbon input, and economic return [45,46,47,48].

2.3. Grey Model GM (1,1) Prediction

The Grey Model GM (1,1) model [49,50,51,52] was applied and divided into five steps, and is represented by the values of nominal economic return in crop production (NEcR), nominal economic return on energy input (NEcRI), nominal economic return on energy output (NEcRO), nominal economic return per unit sowing area (NEcRA), and nominal economic return on carbon footprint in crop production (NEcRC) in the year 2011, denoting x 0 1 :
(1) The modeling original sequence is initialized and denoted as follows:
X ( 0 ) = x 0 1 , x 0 2 , , x 0 n
(2) The 1-AGO of the original sequence is generated and denoted as follows:
X ( 1 ) = x 1 1 , x 1 2 , , x 1 n
(3) The adjacent mean of the 1-AGO generated sequence is generated and denoted as follows:
x 1 k = i = 0 k x 0 i = x 1 k 1 + x 0 k , k = 1,2 , , n
(4) The development coefficient a and the grey action b of the grey model are calculated as follows:
Expressing the GM (1,1) equation as x 0 k + a z 1 k = b , a ^ = ( a , b ) T , the parameters satisfy the condition for the least squares solution as a ^ = ( B T B ) 1 B T Y n , where
B = z 1 2 1 z 1 3 1 z 1 ( n ) 1 Y n = x 0 2 x 0 3 x 0 ( n )
(5) The differential equation is solved to obtain the prediction simulation equation. The expression of the original sequence model is as follows:
x ^ 0 k + 1 = x ^ 1 k + 1 x ^ 1 k , k = 1,2 , , n
Based on this, simulated values can be calculated, followed by the calculation of the simulated error values, where k > n, x ^ 0 ( k ) represents the predicted value of the original sequence. Then, the magnitude of residuals between the original values and simulated values was calculated to assess model performance. A large residual indicates lower model accuracy, while a smaller residual indicates higher accuracy. The specific criteria for assessment are as follows: at a relative error of residuals of a ≤ 0.01, the accuracy of the model was considered high; for 0.01 < a ≤ 0.05, the accuracy of the model was relatively high; for 0.05 < a ≤ 0.10, the accuracy of the model was relatively low; and for 0.10 < a ≤ 0.20, the accuracy of the model was low. Overall, this predictive model demonstrates high or relatively high accuracy, with a ≤ 0.05, except for NEcRC in 2018 which had a value of 0.07 (Supplemental Table S4).

2.4. Statistical Analysis

The OriginPro 2021 (OriginLab Corporation, Northampton, MA, USA) was used to perform linear fitting, analyze linear regression equations, and make figures. The grey model was analyzed and established by Microsoft Excel 2021 (Microsoft Corporation, Redmond, NM, USA).

3. Results

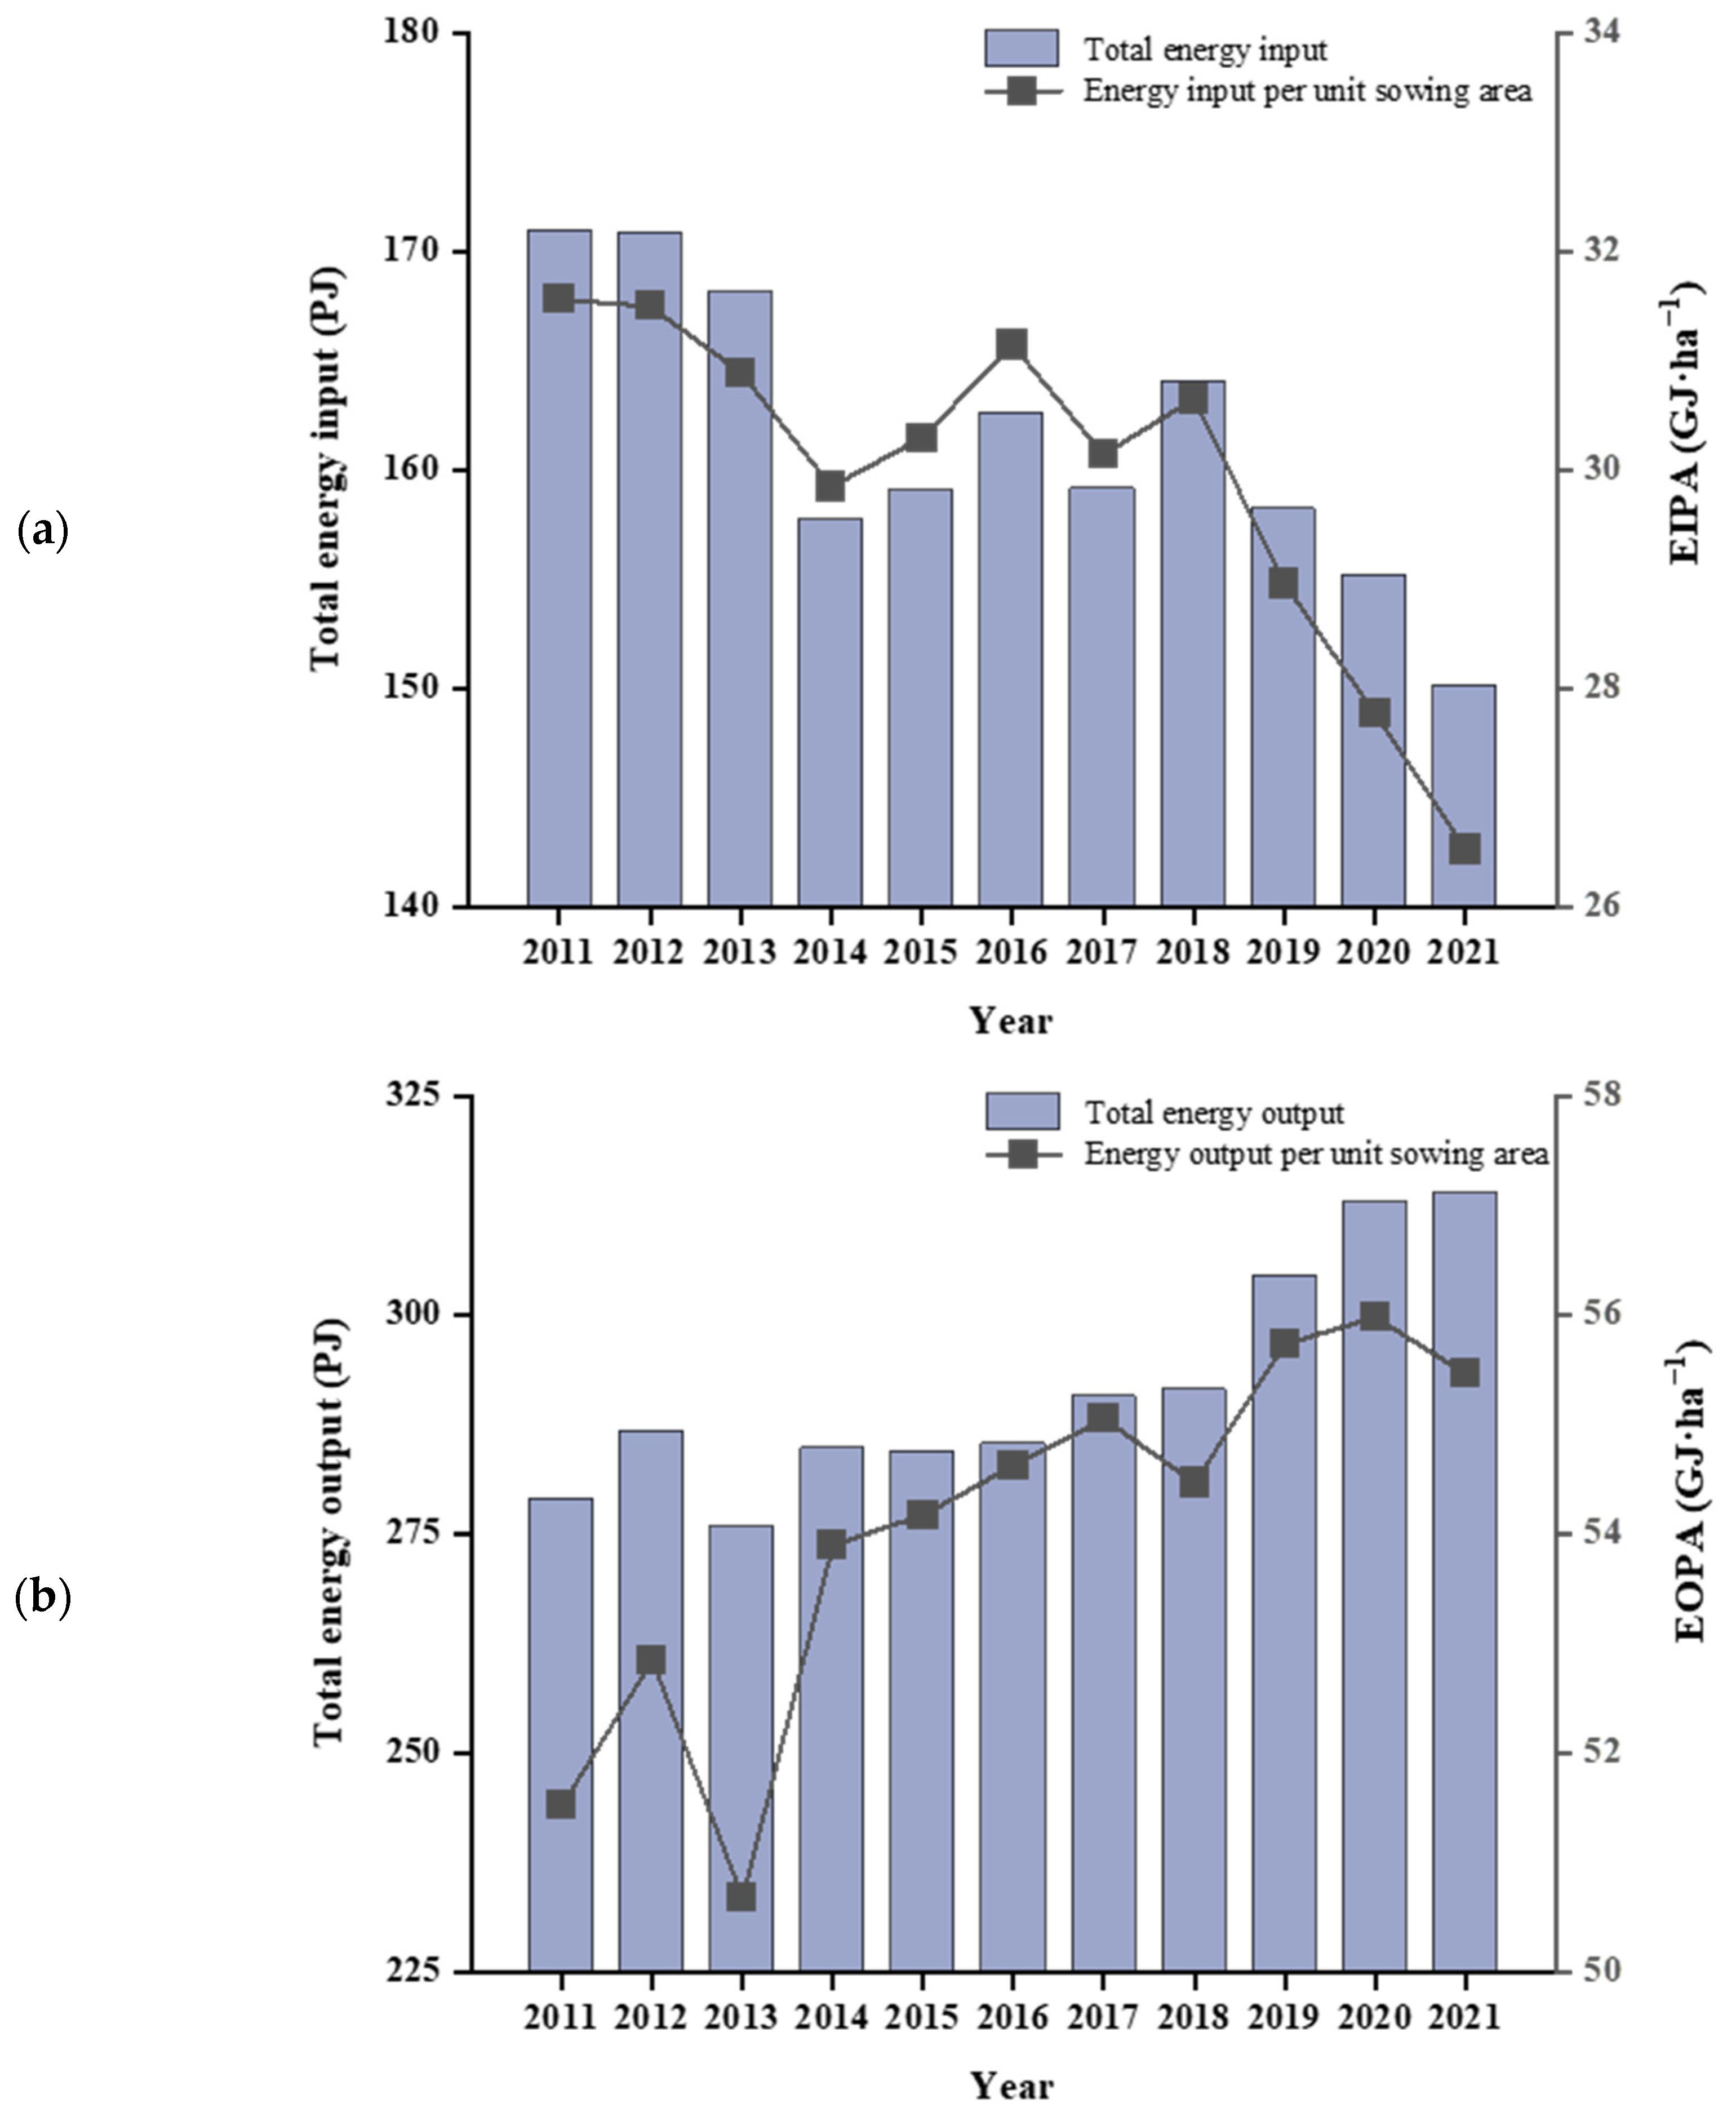
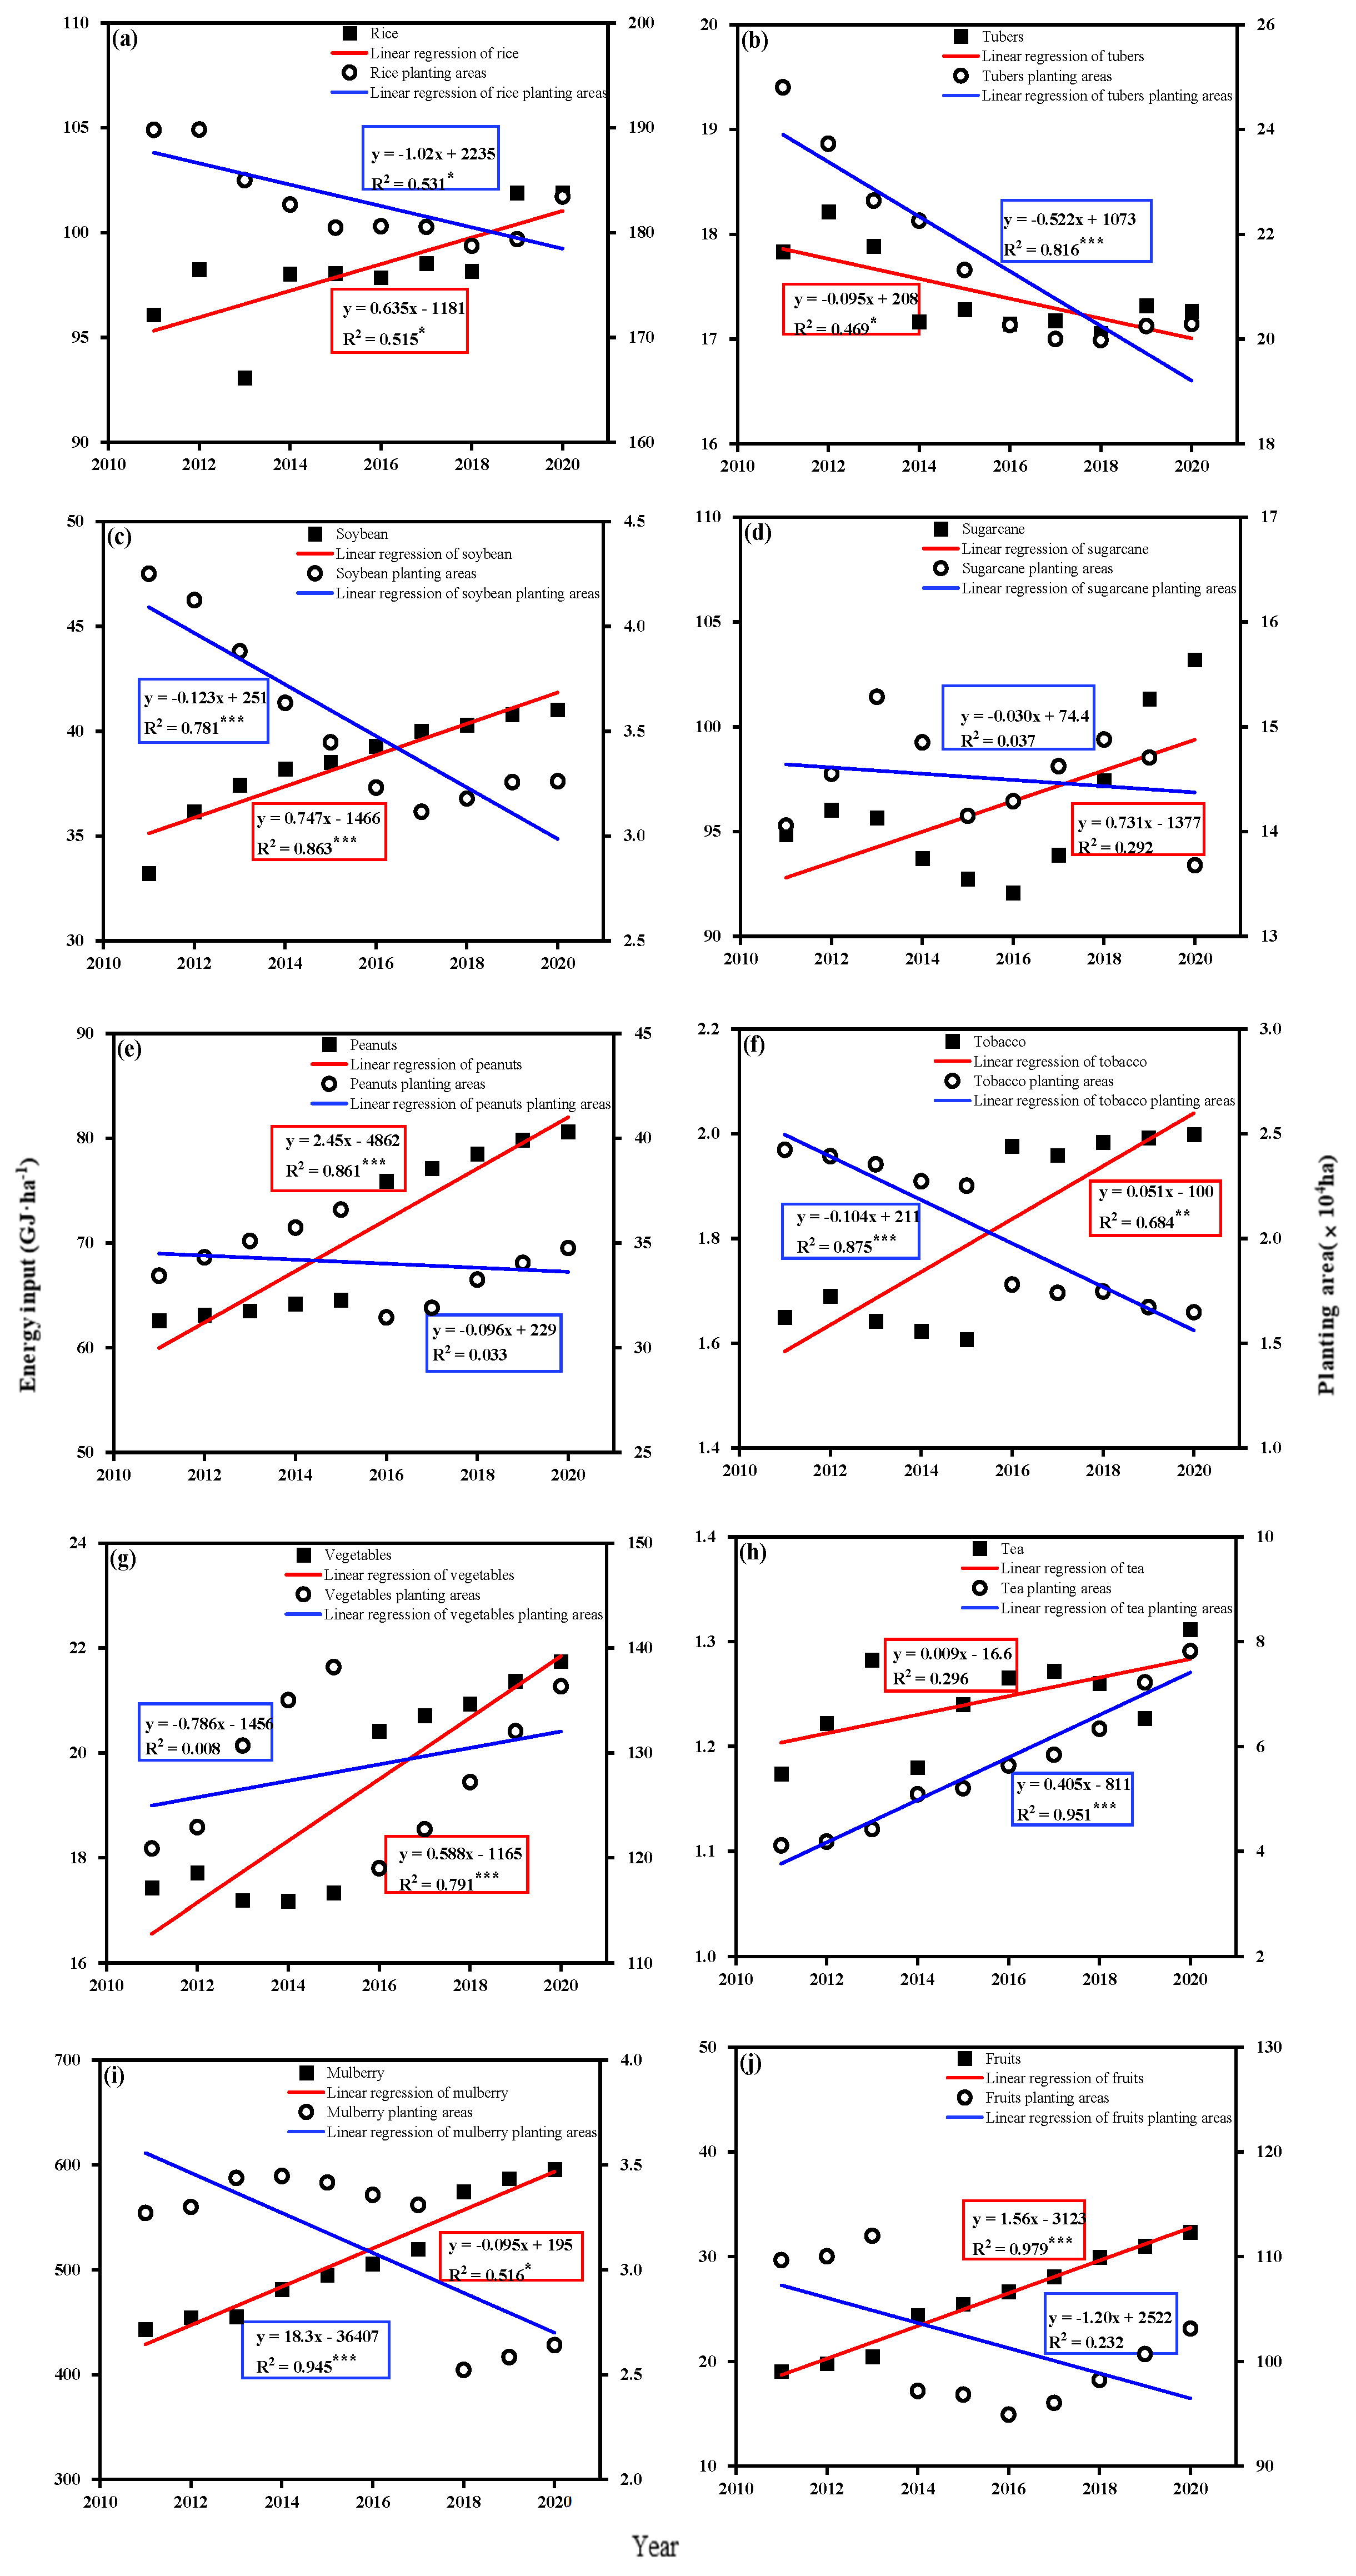
3.1. Analysis of Energy Input and Energy Output

The energy input change in crop production in Guangdong Province from 2011 to 2021 is shown in Figure 1a. The total energy input decreased by 12.17% from 170.97 PJ in 2011 to 150.12 PJ in 2021, with an average reduction value of 2.08 PJ over the sampled period. Energy input per unit sowing area (EIPA) decreased by 15.95%, from 31.56 GJ·ha−1 in 2011 to 26.53 GJ·ha−1 in 2021, with an average reduction value of 0.50 GJ·ha−1. As shown in Supplemental Figure S1, the examined categories of energy input include machinery power, chemical fertilizer, plastic agricultural film, diesel, and pesticides. The chemical fertilizers, pesticides, and diesel had significant linear trends with higher R2 values (0.813, 0.847, and 0.453, respectively) from 2011 to 2021. Additionally, chemical fertilizers, diesel, and pesticides accounted for a large proportion of energy input. During the study period, the proportion of chemical fertilizers and pesticides in energy inputs decreased by 3.16% and 4.61%, respectively, while the proportion of diesel increased by 7.73%. The chemical fertilizers studied include nitrogen, potassium, phosphorus, and compound fertilizers, which decreased according to a significant linear trend by 24.53%, 17.66%, and 10.59%, respectively (Supplemental Figure S2).
The energy output change in crop production in Guangdong Province from 2011 to 2021 is shown in Figure 1b. The total energy output increased by 12.50%, from 279.00 PJ in 2011 to 313.88 PJ in 2021, representing an average growth of 3.49 PJ over the studied period. Energy output per unit sowing area (EOPA) increased by 7.65%, from 51.52 GJ·ha−1 in 2011 to 55.46 GJ·ha−1 in 2021, with an average increase value of 0.39 GJ·ha−1 over this period. As shown in Figure 2, the categories of energy output studied include rice, tubers, soybean, sugarcane, peanuts, tobacco, vegetables, tea, mulberry, and fruits. In the study period, except for tubers, the energy output of other crops increased to varying degrees, and the energy outputs of rice, soybean, peanuts, tobacco, vegetables, mulberry, and fruits increased linearly by 6.94%, 17.21%, 32.37%, 18.69%, 27.14%, 42.79%, and 73.28%, respectively. On average, rice had the largest share (61.91%) of the total energy output, followed by fruits (9.15%), vegetables (8.62%), peanuts (8.40%), mulberry (5.36%), and sugarcane (4.77%), while the other four crops only had a share of 1.79%. The planting areas of vegetables and tobacco increased slightly, but those of other crops decreased to varying degrees.

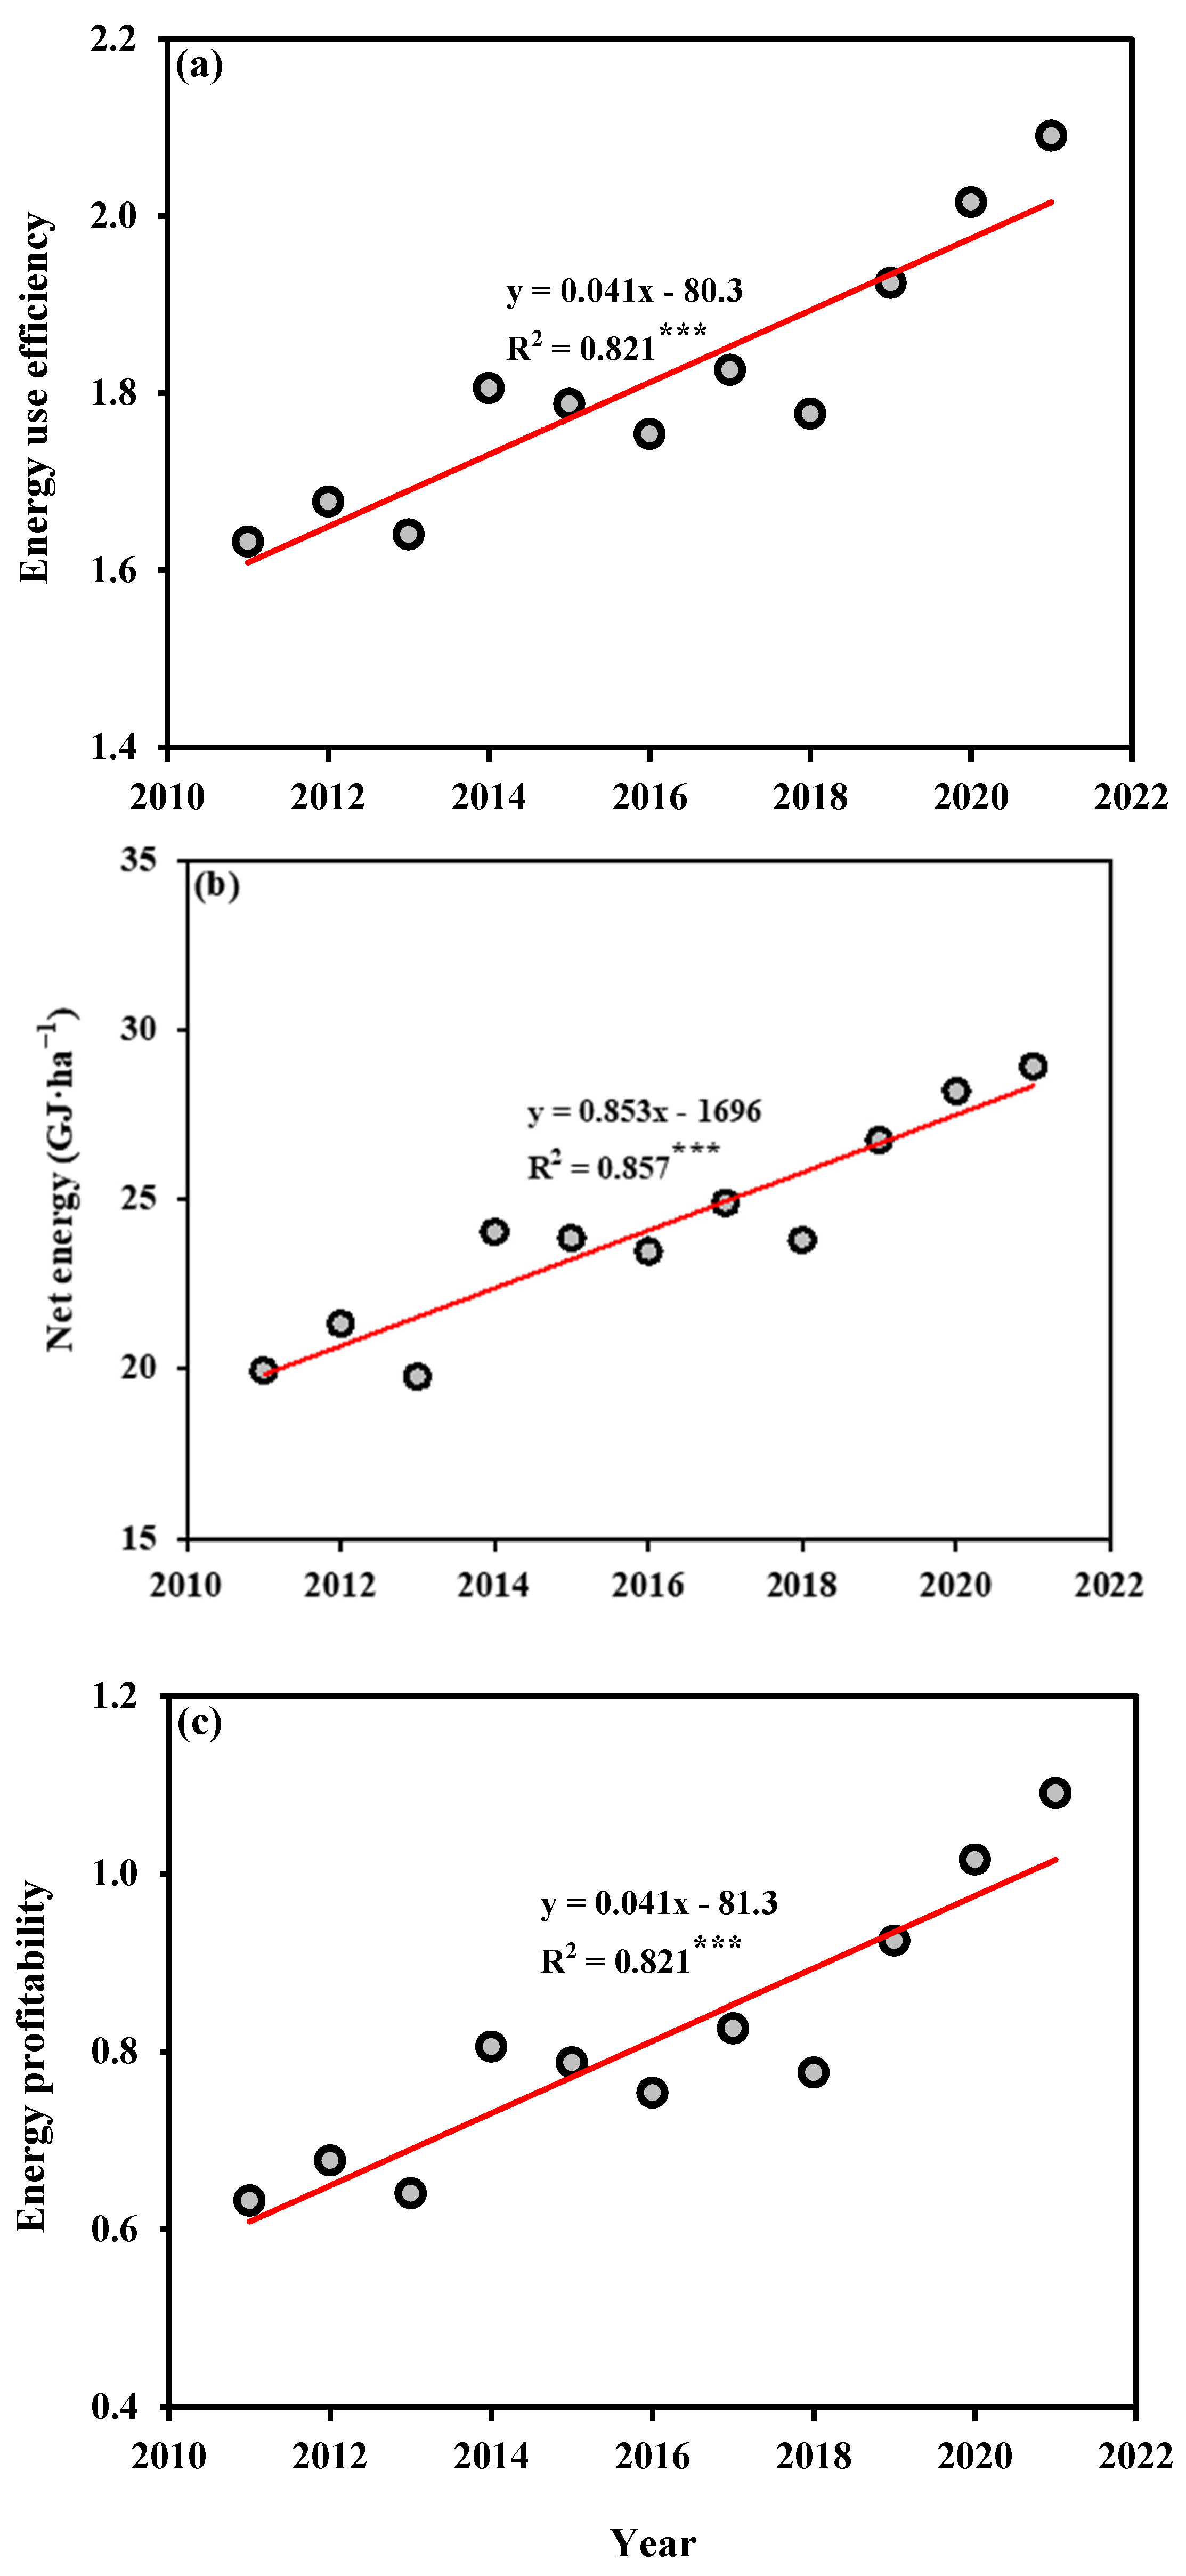
3.2. Energy-Related Indexes

The changing trend of EUE, NE, and EPF in Guangdong Province from 2011 to 2021 is shown in Figure 3. With significant linear trends over this period, EUE, NE, and EPF increased by 28.08%, 44.97%, and 72.49%, respectively. SE and EP in the production of different crop categories from 2011 to 2021 are tabulated in Supplemental Tables S5 and S6, respectively. Peanuts, vegetables, mulberry, and fruits had greater change ratios in SE and EP: The reduction ratios of SE were 36.51%, 33.90%, 41.14%, and 51.50%, respectively, and the growth ratios of EP were 57.50%, 51.27%, 69.89%, and 106.17%, respectively.

3.3. Analysis of Carbon Input

The carbon input change in crop production in Guangdong Province from 2011 to 2021 is shown in Figure 4a. The total carbon input decreased by 6.37%, from 7993.81 CO2e·kg in 2011 to 7484.78 CO2e·kg in 2021, with an average reduction of 50.90 CO2e·kg over this period. Carbon input per unit sowing area (CIPA) decreased by 7.01%, from 1187.88 (CO2e·kg)·ha−1 in 2011 to 1104.63 (CO2e·kg)·ha−1 in 2021, with an average reduction of 0.50 (CO2e·kg)·ha−1 over this period. As tabulated in Supplemental Table S7, the categories of carbon input studied include machinery power, nitrogen, potassium, phosphorus, plastic agricultural film, diesel, and pesticides. The main carbon input resources were chemical fertilizers, diesel, and pesticides. Among different kinds of chemical fertilizers, nitrogen was the most important. Although the proportion of diesel in carbon input increased from 39.71% to 46.79% during the study period, the proportion of chemical fertilizers and pesticides decreased.
An analysis of the combined energy with carbon input is shown in Figure 4b,c. The energy input per carbon input (EICI) decreased by 6.19%, from 21.38 MJ·(CO2e·kg)−1 in 2011 to 20.06 MJ·(CO2e·kg)−1 in 2021, which reflects an average reduction of 0.13 MJ·(CO2e·kg)−1 over this period. Energy input on carbon input per unit sowing area (EICIA) decreased by 10.24%, from 3.95 J·(CO2e·kg·ha)−1 in 2011 to 3.54 J·(CO2e·kg·ha)−1 in 2021, which is an average reduction of 0.04 J·(CO2e·kg·ha)−1. Simultaneously, the energy output per carbon input (EOCI) increased by 20.15%, from 34.90 MJ·(CO2e·kg)−1 in 2011 to 41.94 MJ·(CO2e·kg)−1 in 2021, which reflects an average growth of 0.70 MJ·(CO2e·kg)−1. Energy output on carbon input per unit sowing area (EOCIA) increased by 14.97%, from 6.45 J·(CO2e·kg·ha)−1 in 2011 to 7.41 J·(CO2e·kg·ha)−1 in 2021, reflecting an average growth of 0.10 J·(CO2e·kg·ha)−1.

3.4. Analysis of Agricultural Economic Return and Grey Model Prediction

The dynamic changes and grey model prediction in NEcR, NEcRI, NEcRO, NEcRA, and NEcRC in Guangdong Province from 2011 to 2021 are presented in Table 1. Over the study period, NEcR increased by 106.84%, from 1910.21 × 109 CNY in 2011 to 3951.14 × 109 CNY in 2021, which reflects an average growth of 204.09 × 10⁹ CNY. NEcRA increased by 97.93%, from 352,750.75 CNY·ha−1 in 2011 to 698,198.10 CNY·ha−1 in 2021, which reflects an average growth of 34,544.79 CNY·ha−1. From 2011 to 2021, NecRI, NecRO, and NecRC increased by 135.49%, 83.86%, and 120.91%, respectively, reflecting average growth values of 1514.37 CNY·GJ−1, 574.16 CNY·GJ−1, and 28.89 CNY·(CO2e·kg)−1, respectively. Table 1 also shows that the average relative error between the actual value and the predicted value does not exceed 2%, indicating that the accuracy of the grey model was relatively high. Therefore, if the current agricultural development model is followed in the future and fossil fuel investment is reduced, NEcR, NEcRI, NEcRO, NecRA, and NecRC will retain their growth trends.

4. Discussion

Based on the statistical data from the Guangdong Statistical Yearbook and Rural Statistical Yearbook from 2011 to 2021, this study examined the temporal variation characteristics of non-renewable energy inputs, main crop energy outputs, carbon inputs, and agricultural outputs of Guangdong Province, China. In addition, a series of related indicators were used to analyze the relationship between energy, carbon input, and agricultural economic returns during the studied period. This analysis provides references for the adjustment of multiple cropping structures, thus enabling the optimization of agricultural support policies in the GBA.
Although the period and scope of this study differed from those of [53], similar results were obtained. The data analyses showed the dynamic variation of the energy balance of the agricultural system in Guangdong Province from 2011 to 2021, indicating that the EUE followed an increasing trend (Figure 1 and Figure 3a). Chemical fertilizers contributed the most to the total energy input, followed in decreasing order by diesel, pesticides, and plastic agricultural film, while machinery power contributed the least (Supplemental Figure S1). Even if the energy input of diesel increased, the gross energy input of nitrogen fertilizer, potassium fertilizer, compound fertilizer, and pesticides decreased more. This development may have benefitted from agricultural technicians in Guangdong Province who integrated agronomic fertilization measures and agricultural machinery precision fertilization technology. They relied on new agricultural production and management entities, as well as specialized agrochemical service organizations to vigorously promote, and ultimately achieve, precision fertilization while reducing fertilization in crop cultivation to a large extent [54]. During the 13th Five-Year Plan period, the comprehensive mechanization rate of rice in Guangdong reached 75.3% [55]. The introduction of new multiple cropping types of economic crops has played an important role in improving crop production efficiency and land use efficiency, thus contributing to the development of a low-carbon agricultural economy in Guangdong Province [56]. Furthermore, several new environmentally friendly eco-farming techniques have also emerged in Guangdong Province, for example, combined rice/water mimosa intercropping and nitrogen fertilizer reduction, which achieved a reduction of approximately 40 kg·ha−1 of nitrogen fertilizer use [57]. This combination not only offers advantages in controlling the pests and diseases of rice but also reduces the use of pesticides and improves rice yields and food quality, thus increasing the income of workers in agricultural management. Therefore, the most important step towards improving the development of green agriculture is the effective transformation of the achievements of agricultural science and technological innovation into a real driving force that promotes crop production.
Currently, the pace of urbanization and agricultural modernization in China is accelerating, and the planting scales, planting methods, business entities, and organizational models of agricultural production are quietly undergoing profound changes [58]. Similar changes have taken place in agricultural production in Guangdong Province. According to the changes in energy output and cultivated land areas of different crops between 2011 and 2021, the planting scale and planting structure of crops in Guangdong Province have changed to varying degrees (Figure 2). During the study period, the total energy output and EOPA increased overall, showing fluctuations. In terms of the proportion of energy output, vegetables, fruits, tea, and peanuts increased by 2.28%, 3.57%, 0.02%, and 1.73%, respectively, while other crops decreased (among which rice decreased the most at 5.54%). Over the past 30 years, the crop planting structure in the GBA has gradually changed from grain to vegetables and fruits [59]. There is a positive spatial correlation in vegetable production in the GBA [60]. Fruit production in Guangdong Province is mainly based on subtropical orchards in hilly and mountainous areas. The gradual maturity of 5G technology and the rapid development of artificial intelligence technology provide new technical support and transformation space for the development of intelligent agricultural machinery and intelligent orchards [61]. Simultaneously, high-quality standardized ecological tea gardens have become a characteristic and profitable industry in Guangdong Province, helping to develop prosperous villages. The planting area of peanuts in Guangdong Province is stable while the yield per unit area increases year by year, resulting in a steadily increasing total yield; however, the small planting scale and low mechanization degree limit the peanut production space in Guangdong Province [62]. Furthermore, Guangdong Province established an echelon development pattern of modern agricultural parks, where most of the high-quality modern agricultural industrial parks are government-led and enterprise-operated since 2018 [63]. Although the allocation of resources for crop production still needs to be optimized further, the agricultural park model is meaningful for the accelerated transformation from traditional agriculture to modern agriculture and plays an important role in the increase in energy output in crop production. Therefore, regarding the further improvement of EUE in crop production, it is not only necessary to adjust agricultural production factors to obtain the maximum output, but also to update the agricultural development model to identify optimal solutions.
Regarding the assessment of EUE, other energy attributes such as NE, EPF, EP, and SE are meaningful indicators [64]. In multi-biological systems that contain heterotrophic organisms, the proportion of NE is a key determinant of the viability and complexity of the resulting community structure [65,66]. EPF is a further indicator of the EUE of this system [67]. SE shows the potential impact of agricultural production factors, and EP can be used to evaluate the effect of a reduced energy input [68]. In the studied period, NE, EPF, and EP all increased, while SE decreased (Figure 3, Supplemental Tables S5 and S6). As suggested by these results, crop production in Guangdong Province required lower energy inputs of agricultural production factors. This was achieved through policy adjustments and agricultural achievement transformation over the past decade, which in turn achieved higher crop energy outputs, thereby achieving higher EUE. Furthermore, lower energy inputs were accompanied by lower carbon inputs. During the study period, the greenhouse gas emissions of nitrogen fertilizer, potash fertilizer, plastic agricultural film, and pesticides showed a clear reduction (Supplemental Table S7), indicating the fluctuating decline of total carbon input (Figure 4). Moreover, Figure 4 also shows the relationship between energy balance and carbon input, wherein the EICI sustained a decrease and the EOCI increased (with fluctuations). Their change trends were not affected by the increase in planting area. Guangdong Province accelerated the transformation of industrial structures, developed low-carbon agriculture, and contributed to China’s emission reduction targets. Examples are the cultivation of high-quality crop varieties with high disease resistance and high carbon sink capacity, the promotion of new models of green agriculture, and the development of environmentally friendly fertilizers and pesticides [69,70,71]. With the rapid development of urban agglomerations in the GBA, the pressure and necessity of stringent nitrogen pollution control has received increasing attention. The synergistic control of cross-media nitrogen pollution was achieved via the promotion of fertilizer reduction and sludge land reuse [72]. These measures not only improved the quality and safety of agricultural products, but also (directly or indirectly) contributed to energy savings and emission reductions in crop production.
Additionally, in this study, for the time series of agricultural economic returns and energy changes or indicators related to carbon input from 2011 to 2021, only the changes in the related indicators and time were known, while information on other influencing factors still remains unknown. The grey prediction GM (1,1) model was applicable, and the accuracy of the model was relatively high, indicating that it is credible and effective in practice. The conducted data analysis and model predictions showed that changes in energy use and carbon inputs in the current agricultural system are conducive to improving economic returns from agricultural production (Table 1). This implies that in the case of increased production, reducing the energy investment ratio positively affects multiple cropping ecological environment security and improves multiple cropping agricultural economic returns. On the one hand, this is the result of the important role of crop selection for measuring and developing the potential of multiple cropping [72], while on the other hand, the per capita income of farmers is also an important factor affecting the intensity of multiple cropping in Southern China [73]. In recent years, the overall costs of the agricultural means of production in China have increased, which not only increases the cost of agricultural production and thus erodes the profit margin of agricultural products, but also affects the quality of agricultural production [74]. However, because of the continuous promotion of large-scale operations, agricultural socialization services, and agricultural new technology promotion, the application intensity of pesticides and fertilizers has decreased year by year, as the main focus was to improve quality and efficiency [75,76], which lead to cost reductions and increased economic benefits. For instance, Western Guangdong has become the largest sericulture production base in Guangdong Province under the implementation of the national ‘east mulberry move to westward’ strategic decision [77]. The sericulture industry has played an important role in the overall adjustment of the local agricultural industrial structure and the increase in farmers’ income. Li et al. [78] found that the three-cropping rotation mode of ‘economic crops–middle and late rice–winter potato’ used for sweet corn and other economic crops instead of early rice can achieve a smoother crop stubble connection. This has the advantages of improving soil physical and chemical properties, reducing pests and diseases, and enhancing system productivity, thus increasing the overall economic benefits of three-season crops. Overall, the changes in energy use and carbon inputs in the agricultural system of Guangdong Province greatly aid in the development of an ecologically high-value agriculture system, which is complementary to the high-quality development of the GBA.

5. Conclusions

Through an analysis of energy change, carbon inputs, agricultural output values, and their corresponding indicators from 2011 to 2021 in Guangdong Province, a comprehensive conclusion has been drawn. Energy inputs and carbon inputs for agricultural production continued to decrease (with fluctuations), while the crop energy outputs increased slowly and the agricultural economic return also followed an increasing trend. These findings and the grey prediction model analysis results align with our hypothesis. However, from a long-term perspective, there is still a need for the Guangdong government, enterprises, and farmers to form closer linkages so that they can effectively transform new agricultural technologies into productive agricultural practices, thus promoting the development of high-quality multiple cropping agriculture and strong food security in the GBA.

Supplementary Materials

The following supporting information can be downloaded at: https://www.mdpi.com/article/10.3390/agriculture14040641/s1, Table S1: Energy equivalent of inputs and outputs in various agricultural production systems; Table S2: Emission factors used to estimate greenhouse gas emissions from agricultural inputs; Table S3: Abbreviation for indicators related to energy, carbon input, and economic return; Table S4: Magnitude of residuals between original values and simulated values to assess model performance; Table S5: Changes in the specific energy in the production of different crop categories in Guangdong Province, China from 2011 to 2021 (kg·GJ−1); Table S6: Changes in the energy productivity in the production of different crop categories in Guangdong Province, China from 2011 to 2021 (GJ·kg−1); Table S7: Changes in greenhouse gas emissions from agricultural inputs in Guangdong Province, China from 2011 to 2021 ((CO2e·kg)·ha−1); Figure S1: Changes in the energy input categories, i.e., machinery (a), chemical fertilizers (b), plastic agricultural films (c), diesel (d), and pesticides (e) in crop production in Guangdong Province, China from 2011 to 2021 (GJ·ha−1); Figure S2: Changes in the energy input of fertilizers, i.e., nitrogen fertilizers (a), phosphorus fertilizers (b), potassium fertilizers (c), and compound fertilizers (d) in crop production in Guangdong Province, China from 2011 to 2021 (GJ·ha−1). References [33,35,36,37,38,39,40,41,42,43,44,45,46,47,48] are cited in supplementary materials.

Author Contributions

T.Z.: conceptualization, methodology, data curation, formal analysis, investigation, visualization, writing—original draft, writing—review and editing. S.D.: resources and data collection, writing—original draft, writing—review and editing. Y.L.: resources and data collection, writing—original draft, writing—review and editing. B.Q.: writing—original draft, writing—review and editing. W.L.: conceptualization and design, resources and data collection, writing—original draft, writing—review and editing. Z.M.: conceptualization and design, resources and data collection, writing—original draft, writing—review and editing. All authors have read and agreed to the published version of the manuscript.

Funding

This project was finically supported by the Shanwei City Provincial Science and Technology Innovation Strategy Special Project in 2022 (Shankezi [2022] No. 277, Project Number: 2022B002), the Provincial Science and Technology Project of Guangdong Province (2021A0505040002), the Modern Agroindustrial Technology System of Guangdong Province (2020KJ105), and the Guangzhou Science and Technology Plan project (202206010172).

Institutional Review Board Statement

Not applicable.

Data Availability Statement

Data will be made available on request.

Conflicts of Interest

The authors declare no conflict of interest.

References

  1. Yin, C.J. Food development and food security in the post-epidemic era. Agric. Econ. Issues 2021, 1, 4–13. [Google Scholar] [CrossRef]
  2. Lugo-Morin, D.R. Innovate or Perish: Food Policy Design in an Indigenous Context in a Post-Pandemic and Climate Adaptation Era. J. Open Innov. 2022, 8, 34. [Google Scholar] [CrossRef]
  3. Zhang, X.H.; Zhang, R.; Wu, J.; Zhang, Y.Z.; Lin, L.L.; Deng, S.H.; Li, L.; Yang, G.; Yu, X.Y.; Qi, H.; et al. An emergy evaluation of the sustainability of Chinese crop production system during 2000–2010. Ecol. Indic. 2016, 60, 622–633. [Google Scholar] [CrossRef]
  4. Hu, Q.L.; Shi, H.W.; Wang, L.; Wang, L.; Hou, Y.; Wang, H.L.; Lai, C.H.; Zhang, S. Mitigating environmental impacts using net energy system in feed formulation in China’s pig production. Sci. Total Environ. 2023, 856, 159103. [Google Scholar] [CrossRef] [PubMed]
  5. Wang, Z. The Ministry of Agriculture and Rural Affairs of the People’s Republic of China has deployed a nationwide campaign to increase the yield of major crops such as grain and oil. Agric. Equip. Technol. 2023, 49, 1. [Google Scholar]
  6. Society, T.R. Reaping the Benefits: Science and the Sustainable Intensification of Global Agriculture; Mccarthy; University of Reading: Reading, UK, 2009. [Google Scholar]
  7. Hunter Mitchell, C.; Smith Richard, G.; Schipanski Meagan, E.; Atwood Lesley, W.; Mortensen David, A. Agriculture in 2050: Recalibrating Targets for Sustainable Intensification. BioScience 2017, 67, 386–391. [Google Scholar] [CrossRef]
  8. Qiu, B.; Jian, Z.; Yang, P.; Tang, Z.; Zhu, X.; Duan, M.; Yu, Q.; Chen, X.; Zhang, M.; Tu, P.; et al. Unveiling grain production patterns in China (2005–2020) towards targeted sustainable intensification. Agric. Syst. 2024, 216, 103878. [Google Scholar] [CrossRef]
  9. Liu, X.H.; Chen, F.; Wu, Y. Multiple cropping: The principal part of China’s agriculture. Crops 2015, 6, 1–9. [Google Scholar] [CrossRef]
  10. Liang, Y.G.; Zhou, J.; Yang, Q.; Huang, H. Development status, function and prospect analysis of the multiple cropping in southern China. Crop Res. 2016, 30, 572–578. [Google Scholar] [CrossRef]
  11. Waha, K.; Dietrich, J.P.; Portmann, F.T.; Siebert, S.; Thornton, P.K.; Bondeau, A.; Herrero, M. Multiple cropping systems of the world and the potential for increasing cropping intensity. Glob. Environ. Chang. 2020, 64, 102131. [Google Scholar] [CrossRef]
  12. Liu, H.; Xiong, W.; Li, Y.C.; Yang, D. Advances of impacts and adaptation of climate change on crop rotations in China. Chin. J. Agrometeorol. 2017, 38, 613–631. [Google Scholar] [CrossRef]
  13. Zhang, X.Y. Multiple Cropping System Expansion: Increasing Agricultural Greenhouse Gas Emissions in the North China Plain and Neighboring Regions. Sustainability 2019, 11, 3941. [Google Scholar] [CrossRef]
  14. Zhang, C.J.; He, H.M.; Mokhtar, A. The Impact of Climate Change and Human Activity on Spatiotemporal Patterns of Multiple Cropping Index in South West China. Sustainability 2019, 11, 5308. [Google Scholar] [CrossRef]
  15. Tan, S.J.; Xie, D.T.; Ni, J.P.; Chen, F.X.; Ni, C.S.; Shao, J.G.; Zhu, D.; Wang, S.; Lei, P.; Zhao, G.Y.; et al. Characteristics and influencing factors of chemical fertilizer and pesticide applications by farmers in hilly and mountainous areas of Southwest, China. Ecol. Indic. 2022, 143, 109346. [Google Scholar] [CrossRef]
  16. Tao, J.; Fu, M.C.; Zheng, X.Q.; Zhang, J.J.; Zhang, D.X. Provincial level-based emergy evaluation of crop production system and development modes in China. Ecol. Indic. 2013, 29, 325–338. [Google Scholar] [CrossRef]
  17. Wang, Y.Y.; Cai, Y.P.; Liu, G.Y.; Zhang, P.; Li, B.; Li, B.; Jia, Q.P.; Huang, Y.P.; Shu, T.C. Evaluation of sustainable crop production from an ecological perspective based emergy analysis: A case of China’s provinces. J. Clean. Prod. 2021, 313, 127912. [Google Scholar] [CrossRef]
  18. Pramanick, B.; Mahapatra, B.; Datta, D.; Dey, P.; Singh, S.P.; Kumar, A.M.; Paramanik, B.; Awasthi, N. An innovative approach to improve oil production and quality of mustard (Brassica juncea L.) with multi-nutrient-rich polyhalite. Heliyon 2023, 9, e13997. [Google Scholar] [CrossRef] [PubMed]
  19. Hu, J.X.; Chi, L.; Xing, L.W.; Meng, H.; Zhu, M.S.; Zhang, J.; Wu, J.Z. Decomposing the decoupling relationship between energy consumption and economic growth in China’s agricultural sector. Sci. Total Environ. 2023, 873, 162323. [Google Scholar] [CrossRef] [PubMed]
  20. Zhen, W.; Qin, Q.; Kuang, Y.; Huang, N. Investigating low-carbon crop production in Guangdong Province, China (1993–2013): A decoupling and decomposition analysis. J. Clean. Prod. 2017, 146, 63–70. [Google Scholar] [CrossRef]
  21. Tao, A.X. Study on the path of coordinated development between carbon emission reduction and economy in Guangdong Province. Energy Rep. 2022, 8, 477–481. [Google Scholar] [CrossRef]
  22. Liu, L.H. Agricultural Carbon Emissions in Guangdong Province: Temporal Spatial Difference and Driving Factors. J. Agro-For. Econ. Manag. 2015, 14, 192–198. [Google Scholar] [CrossRef]
  23. Han, B.; Jin, X.B.; Zhao, Q.L.; Chen, H.F. Spatiotemporal patterns and mechanisms of land-use conflicts affecting high-quality development in China. Appl. Geogr. 2023, 155, 102972. [Google Scholar] [CrossRef]
  24. Wu, X.H.; Yuan, Z.J. Understanding the socio-cultural resilience of rural areas through the intergenerational relationship in transitional China: Case studies from Guangdong. J. Rural. Stud. 2023, 97, 303–313. [Google Scholar] [CrossRef]
  25. Sun, J.W.; Yin, S. Strategic Conception of High-quality Development of Guangdong-Hong Kong-Macao Greater Bay Area under the New Development Pattern of ‘Double Cycle’. Guangdong Soc. Sci. 2022, 4, 17–25. [Google Scholar]
  26. Wan, J.Y.; Han, Y.L. Comparison of the supply capacity of edible agricultural products and the function of agricultural industrial chain in Guangdong-Hong Kong-Macao Greater Bay Area. J. South China Technol. Univ. 2019, 21, 9–20. [Google Scholar] [CrossRef]
  27. Zhao, W.D. Research on Construction in Guangzhou of Guangdong-Hong Kong-Macao Greater Bay Area Agricultural Product Supply Chain Channel under Rural Revitalization Strategy. Logist. Technol. 2022, 41, 14–19, 64. [Google Scholar] [CrossRef]
  28. Li, L.; Wen, X.W.; Gu, L.T. Research on Quality and Safety Supervision Technology of Agricultural Products Supply Chain between Guangdong and Hong Kong. Sci. Technol. Manage. Res. 2016, 36, 119–123. [Google Scholar] [CrossRef]
  29. Jiang, H.; Zhang, C.; Jiang, H.P. Study on Effect and Mechanism of China’s Agricultural Economic Resilience on Agricultural High-quality Development. Agric. Econ. Manag. 2022, 1, 20–32. [Google Scholar] [CrossRef]
  30. Liu, Y.G.; Zhang, J.X.; Wang, F.L. Scalar traps in the coordinated development of the Guangdong-Hong Kong-Macao Greater Bay Area. Prog. Geogr. 2022, 41, 1677–1687. [Google Scholar] [CrossRef]
  31. Bureau of Statistics of Guangdong. Guangdong Statistical Yearbook 2012–2022. Available online: http://stats.gd.gov.cn/gdtjnj/ (accessed on 17 March 2024).
  32. Yuan, S.; Peng, S.B. Input-output energy analysis of rice production in different crop management practices in central China. Energy 2017, 141, 1124–1132. [Google Scholar] [CrossRef]
  33. Yuan, S.; Peng, S.B. Trends in the economic return on energy use and energy use efficiency in China’s crop production. Renew. Sustain. Energy Rev. 2017, 70, 836–844. [Google Scholar] [CrossRef]
  34. Jiang, Z.H.; Lin, J.D.; Liu, Y.Z.; Mo, C.Y.; Yang, J.P. Double paddy rice conversion to maize–paddy rice reduces carbon footprint and enhances net carbon sink. J. Clean. Prod. 2020, 258, 120643. [Google Scholar] [CrossRef]
  35. Esengun, K.; Gündüz, O.; Erdal, G. Input–output energy analysis in dry apricot production of Turkey. Energy Convers. Manag. 2007, 48, 592–598. [Google Scholar] [CrossRef]
  36. Sayin, C.; Nisa Mencet, M.; Ozkan, B. Assessing of energy policies based on Turkish agriculture. Energy Policy 2005, 33, 2361–2373. [Google Scholar] [CrossRef]
  37. Eskandari, H.; Attar, S. Energy comparison of two rice cultivation systems. Renew. Sustain. Energy Rev. 2015, 42, 666–671. [Google Scholar] [CrossRef]
  38. Naseri, H.; Parashkoohi, M.G.; Ranjbar, I.; Zamani, D.M. Energy-economic and life cycle assessment of sugarcane production in different tillage systems. Energy 2021, 217, 119252. [Google Scholar] [CrossRef]
  39. Gokdogan, O.; Oguz, H.I.; Baran, M.F. Energy Input-Output Analysis in Organic Mulberry (Morus spp.). Erwerbs-Obstbau 2017, 59, 326–330. [Google Scholar] [CrossRef]
  40. Dyer, J.A.; Desjardins, R.L. Carbon Dioxide Emissions Associated with the Manufacturing of Tractors and Farm Machinery in Canada. Biosyst. Eng. 2006, 93, 107–118. [Google Scholar] [CrossRef]
  41. Zhou, Y.J.; Ji, Y.; Zhang, M.; Xu, Y.Z.; Li, Z.; Tu, D.B.; Wu, W.G. Exploring a sustainable rice-cropping system to balance grain yield, environmental footprint and economic benefits in the middle and lower reaches of the Yangtze River in China. J. Clean. Prod. 2023, 404, 136988. [Google Scholar] [CrossRef]
  42. Yin, W.; Chai, Q.; Fan, Z.; Hu, F.; Fan, H.; Guo, Y.; Zhao, C.; Yu, A. Energy budgeting, carbon budgeting, and carbon footprints of straw and plastic film management for environmentally clean of wheat-maize intercropping system in northwestern China. Sci. Total Environ. 2022, 826, 154220. [Google Scholar] [CrossRef]
  43. Yadav, G.S.; Lal, R.; Meena, R.S.; Datta, M.; Babu, S.; Das, A.; Layek, J.; Saha, P. Energy budgeting for designing sustainable and environmentally clean/safer cropping systems for rainfed rice fallow lands in India. J. Clean. Prod. 2017, 158, 29–37. [Google Scholar] [CrossRef]
  44. Yang, X.L.; Gao, W.S.; Zhang, M.; Chen, Y.Q.; Sui, P. Reducing agricultural carbon footprint through diversified crop rotation systems in the North China Plain. J. Clean. Prod. 2014, 76, 131–139. [Google Scholar] [CrossRef]
  45. Deike, S.; Pallutt, B.; Christen, O. Investigations on the energy effiffifficiency of organic and integrated farming with specifific emphasis on pesticide use intensity. Eur. J. Agron. 2008, 28, 461–470. [Google Scholar] [CrossRef]
  46. Kuemmel, B.; Langer, V.; Magid, J.; De Neergaard, A.; Porter, J.R. Energetic, economic and ecological balances of a combined food and energy system. Biomass Bioenerg. 1998, 15, 407–416. [Google Scholar] [CrossRef]
  47. Chuai, X.W.; Lai, L.; Huang, X.J.; Zhao, R.Q.; Wang, W.J.; Chen, Z.G. Temporospatial changes of carbon footprint based on energy consumption in China. J. Geogr. Sci. 2012, 22, 110–124. [Google Scholar] [CrossRef]
  48. Arratibel, O.; Furceri, D.; Martin, R.; Zdzienicka, A. The effect of nominal exchange rate volatility on real macroeconomic performance in the CEE countries. Econ. Syst. 2011, 35, 261–277. [Google Scholar] [CrossRef]
  49. Huiping, W.; Zhun, Z. Forecasting the renewable energy consumption of Australia by a novel grey model with conformable fractional opposite-direction accumulation. Environ. Sci. Pollut. Res. Int. 2023, 30, 104415–104431. [Google Scholar]
  50. Chen, Q.S.; Wang, S.Y.; Chi, G.B.; Jing, C.X.; Dong, X.M. Prediction and evaluation of GM model by Excel. Chin. J. Dis. Control Prev. 2003, 5, 451–453. [Google Scholar]
  51. Ijlal, R.; Mujawar, M.N.; Rao, K.R.; Manoj, T.; Ibrahim Sobhy, M.; Ali, M.S.; Sabzoi, N. Forecasting of energy consumption by G20 countries using an adjacent accumulation grey model. Sci. Rep. 2022, 12, 13417. [Google Scholar] [CrossRef]
  52. Wang, X.J.; Wu, J.X.; Jiang, H.P. Dynamic assessment and trend prediction of rural eco-environmental quality in China. J. Nat. Res. 2017, 32, 864–876. [Google Scholar] [CrossRef]
  53. Chen, J.N.; Abou-Elwafa, S.F.; Huang, M. Dynamic changes in the fossil energy use efficiency in crop production: A case study from Hunan province of China. J. Clean. Prod. 2022, 371, 133627. [Google Scholar] [CrossRef]
  54. Gao, F.L.; Yu, J.H.; Xie, L.X.; Rao, G.L.; Xu, S.J. Practice and Discussion on Fertilizer Reduction and Efficiency Improvement—Taking Guangdong as an Example. Chin. Compr. Agric. Dev. 2021, 12, 25–30. [Google Scholar]
  55. Li, Y.L.; Cai, G.Y.; Tan, K.M.; Chen, X.W.; Wang, X.L. Emergy-based efficiency and sustainability assessments of diversified multi-cropping systems in South China. J. Clean. Prod. 2023, 414, 137600. [Google Scholar] [CrossRef]
  56. Hei, Z.W.; Xiang, H.M.; Zhang, J.; Liang, K.; Zhong, J.E.; Li, M.J.; Ren, X.Q. Intercropping of Rice and Water Mimosa (Neptunia oleracea Lour.): A Novel Model to Control Pests and Diseases and Improve Yield and Grain Quality while Reducing N Fertilizer Application. Agriculture 2022, 12, 13. [Google Scholar] [CrossRef]
  57. Chen, Y.T.; Liu, C.H.; Chen, J.; Hu, N.J.; Zhu, L.Q. Evaluation on environmental consequences and sustainability of three rice-based rotation systems in Quanjiao, China by an integrated analysis of life cycle, emergy and economic assessment. J. Clean. Prod. 2021, 310, 127493. [Google Scholar] [CrossRef]
  58. Feng, S.S.; Hu, Y.F.; Liu, X.; Liang, J.F. Spatial and temporal evolution of crop planting structure in Guangdong-Hong Kong-Macao greater bay area from 1990 to 2020. Guangdong Agric. Sci. 2023, 50, 13–27. [Google Scholar] [CrossRef]
  59. Liu, X.; Feng, S.S.; Hu, Y.F.; Liang, J.F.; Luo, Y.W.; Liu, S.X.; Huang, J.C.; Zhou, C.F. Analysis of Spatial-temporal Pattern Evolution and Influencing Factors of Vegetable Production in Guangdong-Hong Kong-Macao Greater Bay Area. Guangdong Agric. Sci. 2023, 50, 40–49. [Google Scholar] [CrossRef]
  60. Li, M.T. Present situation analysis and development suggestions of intelligent orchard and intelligent agricultural machinery in Guangdong Province. Guangdong Sci. Technol. 2020, 29, 15–20. [Google Scholar] [CrossRef]
  61. Li, S.X.; Hong, Y.B.; Chen, X.P.; Liang, X.Q. Present situation and development strategies of peanut production, breeding and seed industry in Guangdong. Guangdong Agric. Sci. 2020, 47, 78–83. [Google Scholar] [CrossRef]
  62. Yang, S.F. Achievements, Characteristics and Enlightenments of Guangdong Modern Agricultural Industrial Park Construction. Chin. J. Trop. Agric. 2023, 2, 5–12. [Google Scholar]
  63. Choudhary, V.K.; Kumar, P.S. Productivity, Water Use and Energy Profitability of Staggered Maize–Legume Intercropping in the Eastern Himalayan Region of India. Proc. Natl. Acad. Sci. USA India Sect. B Biol. Sci. 2016, 86, 547–557. [Google Scholar] [CrossRef]
  64. Liu, L.H.; Xin, H.P. Research on Spatial-Temporal Characteristics of Agricultural Carbon Emissions in Guangdong Province and the Relationship with Economic Growth. Adv. Mater. Res. 2014, 1010–1012, 2072–2079. [Google Scholar] [CrossRef]
  65. Marshall, Z.; Brockway, P.E. A Net Energy Analysis of the Global Agriculture, Aquaculture, Fishing and Forestry System. Biophys. Econ. Sustain. 2020, 5, 9. [Google Scholar] [CrossRef]
  66. Pervanchon, F.; Bockstaller, C.; Girardin, P. Assessment of energy use in arable farming systems by means of an agro-ecological indicator: The energy indicator. Agric. Syst. 2002, 72, 149–172. [Google Scholar] [CrossRef]
  67. Bakhtiari, A.A.; Hematian, A.; Sharifi, A. Energy analyses and greenhouse gas emissions assessment for saffron production cycle. Environ. Sci. Pollut. Res. Int. 2015, 22, 16184–16201. [Google Scholar] [CrossRef]
  68. Li, Q.; Zeng, F.; Mei, H.; Li, T.; Li, D. Roles of Motivation, Opportunity, Ability, and Trust in the Willingness of Farmers to Adopt Green Fertilization Techniques. Sustainability 2019, 11, 6902. [Google Scholar] [CrossRef]
  69. Tan, H.; Qi, X. Synergistic Interconstruction of the Green Development Concept in Chinese Rural Ecological Agriculture. Sustainability 2023, 15, 3961. [Google Scholar] [CrossRef]
  70. Wu, W.H. Guangdong develops low-carbon agriculture to accelerate the transformation of industrial structure. Guangdong Sci. Technol. 2017, 26, 8–13. [Google Scholar]
  71. Chen, C.; Wen, Z.G. Cross-media transfer of nitrogen pollution in the fast-urbanized Greater Bay Area of China: Trends and essential control paths. J. Environ. Manag. 2023, 326, 116796. [Google Scholar] [CrossRef]
  72. Xiang, M.T.; Yu, Q.; Li, Y.; Shi, Z.; Wu, W.B. Increasing multiple cropping for land use intensification: The role of crop choice. Land Use Policy 2022, 112, 105846. [Google Scholar] [CrossRef]
  73. Li, L.; Ao, Z.; Zhao, Y.L.; Liu, X.L. Impacts of Rapid Socioeconomic Development on Cropping Intensity Dynamics in China during 2001–2016. Int. J. Geo-Inf. 2019, 8, 519. [Google Scholar] [CrossRef]
  74. Li, M.Y.; Luo, S.; Luo, W. Research on the influencing factors and countermeasures of agricultural production price in China. Agric. Econ. 2022, 9, 122–124. [Google Scholar]
  75. Liu, J.F.; Luo, H.W.; Duan, H.Y.; Lin, Y.X. Study on the model of agricultural science and technology service based on the modern agricultural demonstration base. Guangdong Agric. Sci. 2017, 44, 158–163. [Google Scholar] [CrossRef]
  76. Liu, T.; Wu, G. Does agricultural cooperative membership help reduce the overuse of chemical fertilizers and pesticides? Evidence from rural China. Environ. Sci. Pollut. Res 2022, 29, 7972–7983. [Google Scholar] [CrossRef] [PubMed]
  77. Yu, P.; Tang, C.M.; Lin, Y.T.; Luo, G.Q.; Li, Z.Y.; Wang, Y.; Wang, Z.J. Development status, problems and suggestions of sericulture industry in Guangdong Province. Chin. J. Trop. Agric. 2022, 6, 5–11, 22. [Google Scholar]
  78. Li, X.B.; Suo, H.C.; Lai, Y.C.; Luo, H.M.; Deng, Y.B.; An, K.; Li, C.C.; Liu, X.J. Effects of replacing early rice with economic crops on fertilizer utilization, soil nutrients and economic benefits. J. Nucl. Agric. Sci. 2020, 34, 2080–2087. [Google Scholar] [CrossRef]
Figure 1. Trends in (a) energy input (PJ) and energy input per unit sowing area, and (b) energy output (PJ) and energy output per unit sowing area (GJ·ha−1) in crop production in Guangdong Province, China from 2011 to 2021.
Agriculture 14 00641 g001
Figure 2. Changes in the energy output (GJ·ha−1) and planting area (×104 ha) in the production of different crop categories, i.e., rice (a), tubers (b), soybean (c), sugarcane (d), peanuts (e), tobacco (f), vegetables (g), tea (h), mulberry (i), and fruits (j) in Guangdong Province, China from 2011 to 2021. “*”, “**” and “***” means p < 0.05, p < 0.01 and p < 0.001, respectively, the same below.
Agriculture 14 00641 g002
Figure 3. Dynamic changes in energy use efficiency (a), net energy (GJ·ha−1) (b), and energy profitability (c) in crop production in Guangdong Province, China from 2011 to 2021.
Agriculture 14 00641 g003
Figure 4. Trends in (a) carbon input (×106 CO2e·kg) and carbon input per unit sowing area ((CO2e·kg)·ha−1); (b) energy input per carbon input (MJ·(CO2e·kg)−1) and energy input on carbon input per unit sowing area (J·(CO2e·kg·ha)−1); and (c) energy output per carbon input (MJ·(CO2e·kg)−1) and energy output on carbon input per unit sowing area (J·(CO2e·kg·ha)−1) in crop production in Guangdong Province, China from 2011 to 2021.
Agriculture 14 00641 g004
Table 1. Dynamic changes and grey model predictions in nominal economic return in crop production (NEcR; ×109 CNY), nominal economic return on energy input (NEcRI; CNY·GJ−1), nominal economic return on energy output (NEcRO; CNY·GJ−1), nominal economic return per unit sowing area (NEcRA; CNY·ha−1), and nominal economic return on carbon footprint in crop production (NEcRC; CNY·(CO2e·kg)−1) in Guangdong Province, China from 2011 to 2021.
YearNEcRNEcRINEcRONEcRANEcRC
Actual
Value (×103)
Predicted
Value (×103)
Actual
Value (×104)
Predicted
Value (×104)
Actual
Value (×103)
Predicted
Value (×103)
Actual
Value (×105)
Predicted
Value (×105)
Actual
Value (×102)
Predicted
Value (×102)
20111.911.911.121.126.856.853.533.532.392.39
20122.062.031.211.207.197.413.803.892.592.55
20132.232.191.331.318.097.874.104.172.832.76
20142.362.361.491.438.288.364.464.463.082.99
20152.492.541.571.568.768.884.744.773.213.24
20162.762.741.701.709.699.445.295.113.513.51
20172.892.951.821.859.9410.035.475.473.743.80
20183.093.181.882.0110.6010.655.775.853.844.12
20193.533.432.232.1911.6011.326.466.264.544.46
20203.773.702.432.3912.0512.036.756.704.944.83
20213.953.992.632.6012.5912.786.987.175.285.23
2025 5.38 3.67 1.63 9.40 7.20
2030 7.84 5.63 2.20 13.19 10.74
Mean value
2011–20152.212.201.341.327.837.874.134.162.822.79
2016–20203.213.202.012.0310.7810.695.955.884.114.14
2021–2025 4.66 3.11 14.47 8.25 6.18
2026–2030 6.78 4.78 19.59 11.57 9.21
Disclaimer/Publisher’s Note: The statements, opinions and data contained in all publications are solely those of the individual author(s) and contributor(s) and not of MDPI and/or the editor(s). MDPI and/or the editor(s) disclaim responsibility for any injury to people or property resulting from any ideas, methods, instructions or products referred to in the content.

