

Walnut Recognition Method for UAV Remote Sensing Images

1
School of Information, Yunnan Normal University, Kunming 650500, China
2
Engineering Research Center of Computer Vision and Intelligent Control Technology, Department of Education of Yunnan Province, Kunming 650500, China
*
Author to whom correspondence should be addressed.
Agriculture 2024, 14(4), 646; https://doi.org/10.3390/agriculture14040646
Submission received: 21 March 2024
/
Revised: 14 April 2024
/
Accepted: 18 April 2024
/
Published: 22 April 2024
(This article belongs to the Special Issue Application of Vision Technology and Artificial Intelligence in Smart Farming—2nd Edition)
Abstract
:During the process of walnut identification and counting using UAVs in hilly areas, the complex lighting conditions on the surface of walnuts somewhat affect the detection effectiveness of deep learning models. To address this issue, we proposed a lightweight walnut small object recognition method called w-YOLO. We reconstructed the feature extraction network and feature fusion network of the model to reduce the volume and complexity of the model. Additionally, to improve the recognition accuracy of walnut objects under complex lighting conditions, we adopted an attention mechanism detection layer and redesigned a set of detection heads more suitable for walnut small objects. A series of experiments showed that when identifying walnut objects in UAV remote sensing images, w-YOLO outperforms other mainstream object detection models, achieving a mean Average Precision (mAP0.5) of 97% and an F1-score of 92%, with parameters reduced by 52.3% compared to the YOLOv8s model. Effectively addressed the identification of walnut targets in Yunnan, China, under the influence of complex lighting conditions.
1. Introduction
The walnut, scientifically known as Juglans regia, is a type of nut tree belonging to the Juglandaceae. Walnuts are rich in protein, unsaturated fatty acids, vitamins, and other minerals beneficial to human health [1]. Currently, there are 21 species of walnuts distributed across the West Indies, Southern Europe, Asia, Central America, North America, and western South America [2]. Among them, China is the world’s largest walnut producer, accounting for over half of the global walnut production. The main walnut-producing regions in China include Yunnan Province (880,000 tons), Xinjiang Uygur Autonomous Region (440,000 tons), Sichuan Province (300,000 tons), Shaanxi Province (200,000 tons), and others [3]. Taking Yunnan Province, the largest walnut-producing region, as an example, the primary variety is the Deep-ridged walnut, a unique variety in southwestern China. When Deep-ridged walnuts mature in autumn, their shells harden, change color, and the kernels complete their development. Farmers harvest them during the walnut’s ripe period to ensure optimal taste and flavor. However, the ripe period of walnuts is short, and ripe walnuts are prone to oxidation and spoilage. Additionally, overripe walnut kernels tend to stick tightly to the shell, which increases the difficulty of processing after harvesting. Currently, there are two main challenges in walnut production management: firstly, the primary method of walnut harvesting is manual, resulting in very low efficiency and causing many walnuts to overripe and rot on the trees. Secondly, most walnut trees in Yunnan are planted in hilly areas with complex terrain and uneven distribution, making manual counting of walnut fruits extremely difficult.
In recent years, agricultural digitization has continuously improved, promoting the rational utilization of modern production technologies and traditional agricultural production elements, which plays a crucial role in adjusting agricultural production methods and achieving precision agriculture [4,5]. Agricultural digitization refers to the use of advanced technologies such as big data [6], machine learning [7,8], the Internet of Things [9], and deep learning [10,11,12] in the agricultural production process. Shantam Shorewala et al. [13] proposed a semi-supervised decision method to identify the density and distribution of weeds from color images to locate weeds in fields. Validation results demonstrate that the method generalizes well to different plant species, achieving a maximum recall of 0.99 and a maximum accuracy of 82.13%. Cheng et al. used a deep residual network to detect pests in fields with complex backgrounds. Experimental results showed that the accuracy of this method was higher than support vector machines and backpropagation neural networks and higher than the recognition accuracy of traditional convolutional neural networks (CNNs). However, the network structure complexity of ResNet is relatively high, requiring more computation [14]. Behroozi-Khazaei et al. combined artificial neural networks (ANN) with genetic algorithms (GA) to segment grape clusters similar in color to the background and leaves. Although the improved algorithm can automatically detect grape clusters in images and effectively predict yields, it remains challenging to successfully detect when there is little color difference between grape clusters and leaves [15]. Juan Ignacio Arribas et al. segmented RGB images to separate sunflower leaves from the background and then used a Generalized Sensory Perceptron (GSP) neural network architecture combined with a Posterior Probability Model Selection (PPMS) algorithm to classify sunflower leaves and weeds. However, classification accuracy may be affected when lighting conditions are complex [16]. In summary, algorithms still face challenges such as high computational complexity. Additionally, when background and object features are too similar, models may struggle to meet expectations for crop detection.
With the development of deep learning, object detection algorithms have been widely applied in various fields including remote sensing [17,18], urban data analysis [19], agricultural production [20], embedded development [21] and multispectral image detection [22]. Object detection mainly includes two-stage and one-stage algorithms. Two-stage algorithms include R-CNN [23], Fast-RCNN [24], Faster-RCNN [25], Mask R-CNN [26], etc. These algorithms classify objects based on pre-generated candidate regions, and their detection accuracy is usually higher. However, due to the multi-stage processing required by two-stage algorithms, their complexity is relatively high, and real-time performance is poor, requiring higher hardware requirements. In order to optimize the cumbersome detection process of two-stage algorithms, one-stage detection algorithms have been proposed. Joseph Redmon et al. proposed a one-stage object detection algorithm called YOLO (You Only Look Once), which promoted the development of real-time object detection [27]. Subsequently, many researchers proposed improved one-stage detection algorithms, such as SSD [28], CenterNet [29], YOLOv3 [30], YOLOv7 [31], etc. Chen et al. proposed an improved YOLOv4 model for detecting and counting bayberry trees in images captured by UAVs. Experimental results show that the improved model achieves higher recall while ensuring accuracy [32]. Hao et al. improved the YOLOv3 algorithm for detecting green walnuts. This algorithm utilizes Mixup data augmentation and introduces the lightweight convolutional network MobileNet-v3. In the experiment for detecting green walnuts, the model size is 88.6 MB, and the accuracy reaches 93.3% [33]. Zhong et al. conducted research on walnut recognition in natural environments. They improved the YOLOX algorithm using the Swin Transformer multi-feature fusion module. The improved model achieved an AP50 of 96.72% in natural environments, with a model parameter of 20.55 M [34]. In Li et al.’s study, by improving the feature fusion structure of the YOLOX model, the model’s ability to interact with local information in UAV remote sensing images is enhanced, achieving stronger small object detection capabilities [35].
Considering the significant challenge of manually counting walnut fruits in hilly areas and recognizing the superiority of the YOLOv8s algorithm in object detection, we proposed the w-YOLO algorithm to address walnut fruit object detection in hilly terrain and under complex lighting conditions.
The contributions of our work can be summarized in the following points:
- We utilized UAVs to collect remote-sensing images of walnut trees and established a representative dataset of small walnut targets. The dataset consists of 2490 images with a resolution of 640 × 640, containing a total of 12,138 walnut targets. This work fills the gap in walnut datasets and provides valuable data for walnut target detection and recognition under complex lighting conditions.
- We made improvements to the YOLOv8s model and designed a w-YOLO model, which includes a lightweight feature extraction network, a better-performing feature fusion network, and a new detection layer. These improvements aim to reduce the model’s parameter count, and decrease the size of the model’s weight files for deployment on edge computing devices. At the same time, it enhances the model’s ability to capture walnut object features, making the model more suitable for walnut detection and recognition under different lighting conditions.
- The w-YOLO model we designed achieved the recognition of small walnut targets under complex lighting conditions. It significantly improves walnut detection accuracy, with a mAP0.5 of 97% and an F1-score of 92%. The parameter count decreased by 52.3%, and the model’s weight file size reduced by 50.7%. Its detection performance surpasses the baseline YOLOv8s and other mainstream object detection models, providing valuable references for walnut detection and management under complex lighting conditions.
The remaining structure of the paper is as follows. In Section 2, we provide an overview of our dataset and introduce the design details of the w-YOLO model. In Section 3, we conduct a series of experiments and analyze the results. Section 4 delves into a detailed discussion of some factors influencing the w-YOLO model. Finally, in the Section 5, we present our conclusions.
2. Materials and Methods
In this study, we collect a large amount of walnut image data and preprocess the remote sensing image data, first. Then, we improve YOLOv8s and continuously optimize the training parameters of the model to obtain the optimal walnut detection model, w-YOLO. The basic process of the detection model is illustrated in Figure 1. The input image undergoes data augmentation to increase data diversity, and then undergoes feature extraction through the backbone network. w-YOLO also incorporates BiFPN [36] as the feature fusion network, followed by prediction on the feature outputs. Using the w-YOLO model to compare with other mainstream models, we evaluated the walnut recognition performance under facing light, side light, and backlight. The w-YOLO model achieves both reliable accuracy and the best recall rate. Therefore, the effectiveness of this model can provide effective guidance and high-quality technical support for the management of walnut orchards.
2.1. Research Process
The process of our research work is illustrated in Figure 2. Firstly, we used a DJI Matrice-300-RTK (DJI, Shenzhen, China) equipped with a Zenmuse P1 lens and conducted data collection of walnut tree images using the “following terrain” flight mode. Then, we processed and cropped these images to create a dataset suitable for deep learning models. The dataset was divided into training (64%), validation (16%), and testing (20%) sets, and we trained a preliminary walnut detection model. Subsequently, we selected better parameter combinations to improve the detection performance of the model, resulting in the w-YOLO model. Finally, we evaluated the performance of the w-YOLO model through qualitative and quantitative analysis.
2.2. Study Area
The research site is located in Changning County (WGS 84: 25.024486° N, 99.773675° E), Baoshan City, Yunnan Province, China (Figure 3). Walnuts are a specialty of Changning County and are a Geographical Indication product of China. The area has an average altitude of 1875 m and belongs to a subtropical monsoon climate zone with abundant rainfall (annual precipitation ranging from 700 to 2100 mm), mild temperatures (annual average temperature of 14.8 to 21.3 °C), and long sunshine hours (annual average sunshine of 2335). The favorable climate in this area is very suitable for the growth of walnut trees.
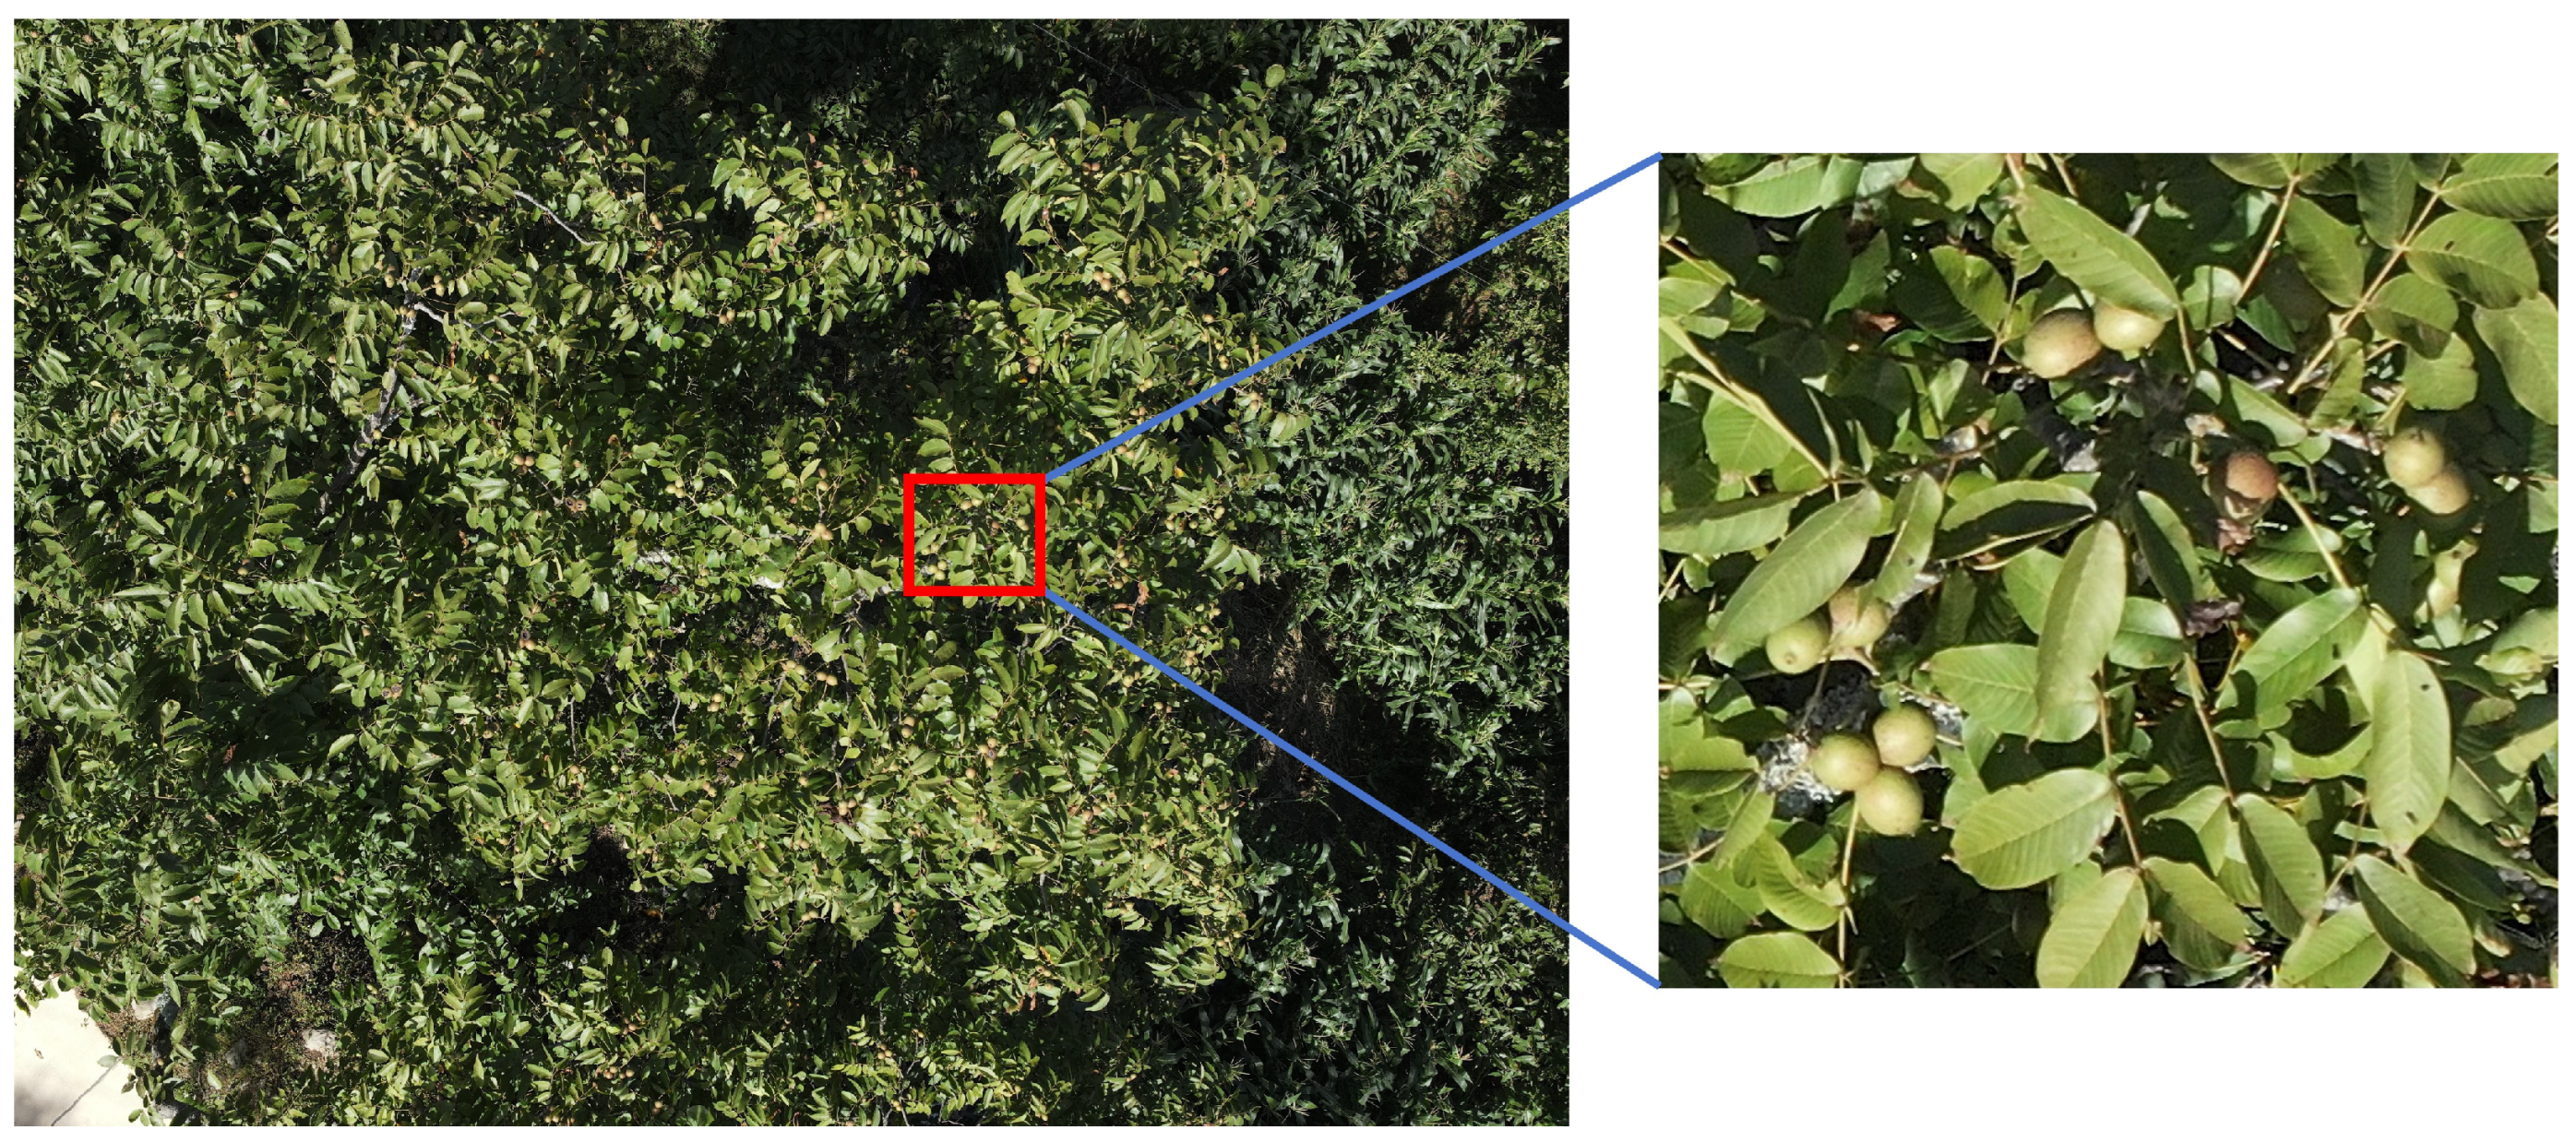
The average height of the walnut sample trees is 10.83 m, and the average base diameter is 39.81 cm. Both the training and testing visible light images in this study were captured using a DJI Matrice-300-RTK equipped with a Zenmuse P1 camera sensor. Both of these devices are manufactured by DJI. The images were taken between 17 August and 20 August 2022. During the flight mission, the preset flight altitude was 100 m, covering an area of 900 square meters. The Ground Sample Distance (GSD) in the horizontal and vertical directions was 0.00464 mm/pixel and 0.00521 mm/pixel, respectively. A total of 180 aerial images were captured, with an image size of 5472 × 3648 pixels (Figure 4), saved in .jpg format.
2.3. Dataset Production
We first used a sliding window to crop the 180 aerial images into sizes of 640 × 640 pixels. Then, we discarded some images that did not contain walnut trees, resulting in a dataset consisting of 2490 walnut images. Subsequently, we used the Labelimg to annotate the walnut fruit objects. The detailed information on the walnut dataset we established is shown in Table 1.
2.4. A Detection Algorithm for Small Walnut Objects—w-YOLO
In this study, our aim was to design a lightweight walnut detection model without sacrificing detection accuracy, as measured by metrics such as P, R, F1-score, and mAP0.5. Building upon the advantages of YOLOv8s, we made improvements to it, resulting in the w-YOLO model. It is more suitable for detecting small walnut objects in images and can provide technical support for future real-time walnut fruit detection tasks.
2.4.1. YOLOv8s Model
The YOLOv8s model is the latest version of YOLO open-sourced by Ultralytics [37]. YOLOv8s mainly consists of three parts: Backbone, Neck, and Head. The Backbone serves as the feature extraction network, similar to YOLOv5’s Backbone, both belonging to CSPDarknet. Here, the input image undergoes initial feature extraction to form an image feature set. The Neck is a feature fusion network, which utilizes a combination of Feature Pyramid Network (FPN) [38] and Path Aggregation Network (PAN) [39] structures to fuse feature maps from different layers of the Backbone, enhancing detection accuracy and robustness. In the Head, a decoupled head structure is used to separate the classification and detection heads, while employing an Anchor-Free approach different from YOLOv5.
2.4.2. w-YOLO
To obtain the w-YOLO model (Figure 5), we first replaced the feature extraction network and the C2f structure in the Neck of YOLOv8 to make it more lightweight. Secondly, we adopted a Weighted Bi-directional Feature Pyramid Network (BiFPN) in the feature fusion part to enhance the feature fusion capability of YOLOv8s. Thirdly, to address the challenge of capturing important feature information, which can be challenging due to multiple downsampling of feature maps, we introduced a self-attention dynamic detection head—DyHead [40]. Finally, considering the characteristics of small walnut objects, we added a detection head of size 160 × 160 and removed the detection head of size 20 × 20.
2.4.3. Lightweight Feature Extraction Backbone—Fasternet
Currently, there are several convolutional networks that enable deep learning models to become lightweight, such as MobileNet [41], ShuffleNet [42], and GhostNet [43]. They utilize depthwise convolution and group convolution to extract features, aiming to reduce computational complexity. However, operations like concatenation, shuffling, and pooling in these networks still contribute significantly to the runtime, which remains challenging for smaller models. Another lightweight network variant includes MobileViT [44] and MobileFormer [45], which combine depthwise convolution (DWConv) with attention mechanisms to reduce computational complexity. Nevertheless, DWConv remains a challenge for further lightweighting in such networks.
FasterNet (Figure 6) achieves lightweight by reducing memory access and computational redundancy in convolutions [46]. FasterNet consists mainly of Embedding layers, Merging layers, and FasterNet Blocks. The FasterNet Block relies on PConv (Partial Convolution) and PWConv (Point-Wise Convolution). PConv is an improvement over DWConv. While DWConv utilizes multiple filters to compute the output , its computational complexity is as shown in Equation (1). In contrast, PConv performs Conv only on a subset of input channels while keeping the rest unchanged. The computational complexity of PConv can be expressed as shown in Equation (2).
When the typical ratio , the computational complexity of PConv is only of DWConv.
To fully utilize information from all channels, PWConv is attached to PConv in a separable manner, as depicted in Figure 7. Its computational complexity can be expressed as
2.4.4. Multi-Scale Feature Fusion
In the feature fusion network of YOLOv8s, a combination of FPN and PAN is used, aiming to add a bottom-up aggregation pathway to the top-down basis of FPN (Figure 8a). However, this structure introduces a significant number of parameters and computations. We will replace it with the BiFPN structure (Figure 8b) as the feature fusion network for YOLOv8s. This structure learns the importance of different input features and adaptively fuses them. Additionally, the skip connections in BiFPN at the same scale can fuse more features without adding too much computational overhead. The expression of BiFPN can be represented by Equations (4) and (5).
We improved the Neck network’s C2f using the FasterNet Block from FasterNet, making it more lightweight. We refer to the improved C2f as C2f-Faster, and its structure is depicted in Figure 9.
2.4.5. Improved Detection Head
Due to the small number of pixels occupied by walnuts in the images, there is limited available feature information, making it difficult to locate small objects on the 80 × 80 feature map of YOLOv8s. Having larger feature maps would help the model capture detailed information about small objects. Therefore, we added a small object detection head with a size of 160 × 160. We also found that the 20 × 20 detection head in YOLOv8s did not perform well in detecting walnut objects, so we removed it to simplify the model.
After multiple downsampling operations, there may be information loss in the feature maps, making it difficult for the detection head to distinguish walnut objects from the background. Therefore, we replaced the detection head of YOLOv8s with the DyHead, which incorporates a self-attention mechanism. After the feature information is input from the Neck network to DyHead, it undergoes a three-dimensional feature tensor , consisting of scale-aware attention (), spatial-aware attention (), and task-aware attention (). DyHead integrates these three types of attention together, and its expression can be represented as:
3. Experimental Results
3.1. Experimental Setup
All experiments were conducted using the PyTorch 2.0.1 framework and a CUDA 11.7 server on a Quadro RTX 6000 GPU. The dataset images were all 640 × 640 pixels in size, with the training and validation sets divided in an 8:2 ratio, comprising 1594 and 398 images, respectively. During training, we utilized the stochastic gradient descent (SGD) optimizer to update the model parameters, with lr0 set to 0.01, lrf set to 0.07, weight decay set to 0.0005, momentum set to 0.917, batch size set to 32, and epochs set to 300. These settings were consistent across all experiments.
3.2. Evaluation Indicators
In this experiment, we use the metrics P (Precision), R (Recall), mAP (mean Average Precision), Parameters, and GFLOPs to evaluate the performance of the w-YOLO. The calculation formulas for P, R, and mAP are shown in Equations (7)–(9).
where TP represents true positives, FP represents false positives, and FN represents false negatives. mAP denotes the average precision across multiple classes and depends on both precision and recall. mAP0.5 represents the average precision at an IOU threshold of 0.5 for all classes, while mAP0.5:0.95 represents the average precision for all classes at IOU thresholds ranging from 0.5 to 0.95 with a step size of 0.05. In object detection tasks, a higher mAP value indicates better detection performance and is a commonly used and authoritative evaluation metric. F1-score (0 ≤ F1 ≤ 1) is used to measure the balance between precision and recall, as shown in Equation (10). It represents the harmonic mean of precision and recall, and a higher F1-score indicates better results.
The parameter count serves as a metric for evaluating the complexity and resource consumption of a model. Generally, a higher parameter count indicates a more complex model, requiring more computational resources and memory space for training and execution. GFLOPs represent the number of floating-point operations executed by the model per second during inference, and can be used to assess the model’s complexity.
3.3. Experimental Results
3.3.1. Experimental Results of w-YOLO on the Walnut Dataset
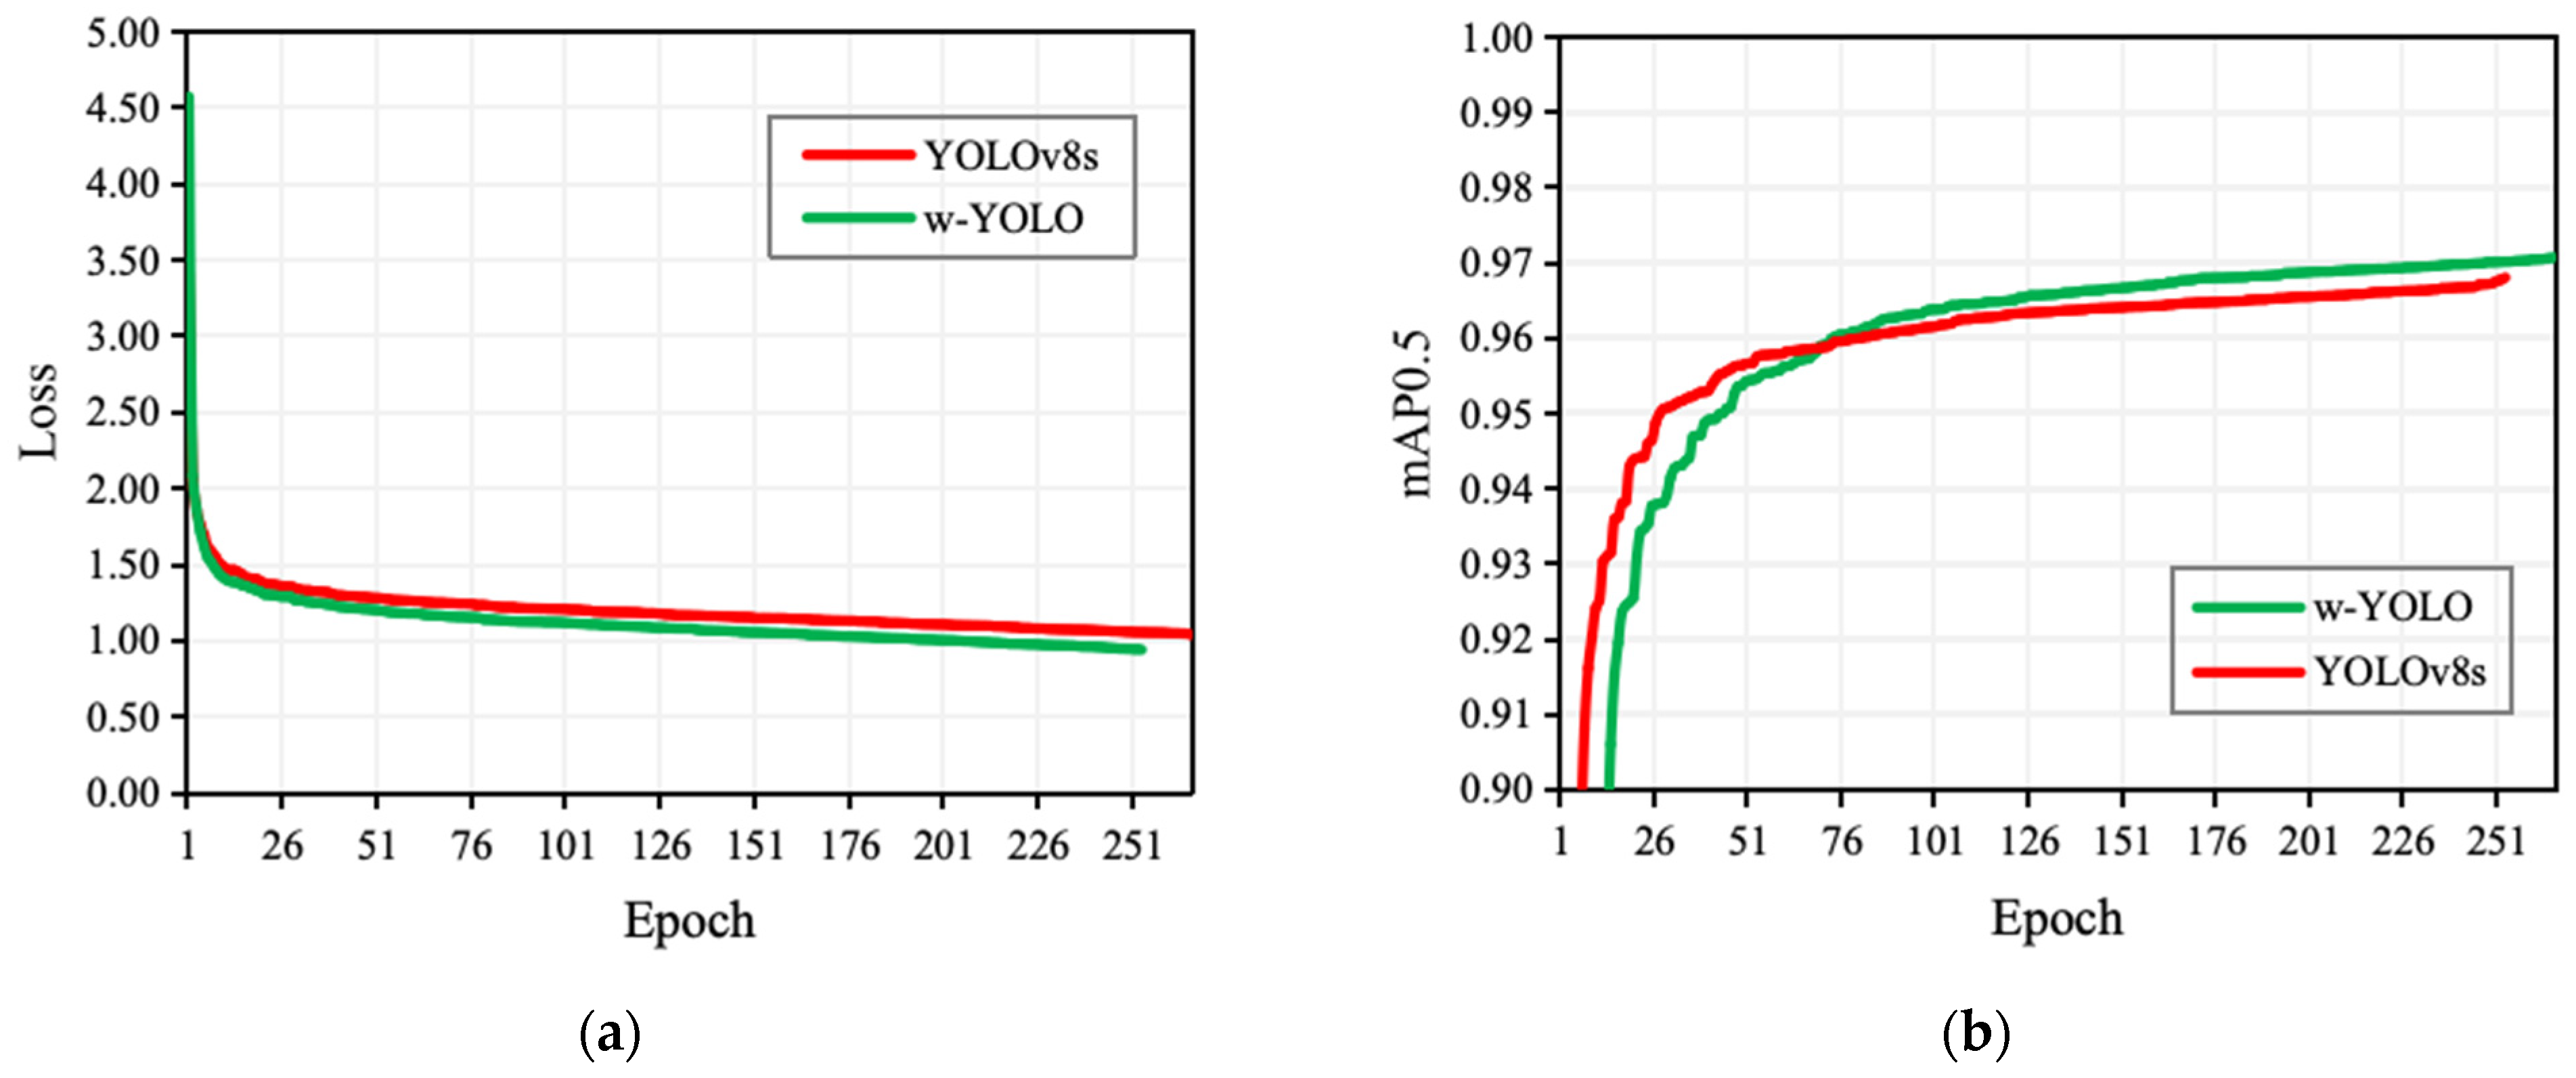
We trained YOLOv8s and the w-YOLO model, and the training curves are shown in Figure 10. The training results of both YOLOv8s and w-YOLO are the best results obtained when the training converges. From the localization loss curve, it can be observed that the curve of w-YOLO converges faster, indicating that it learns better in the task of walnut localization. This suggests that w-YOLO has a better predictive ability for the location information of walnuts. Additionally, in terms of the detection accuracy metric mAP0.5, w-YOLO achieved 0.970, which is 0.004 higher than YOLOv8s (0.966). This indicates that the feature extraction network, feature fusion network, and detection layer of YOLOv8s were improved, enhancing the detection effectiveness for walnut objects in the w-YOLO model. In actual walnut target detection tasks, although there is only a slight improvement in the mAP0.5 metric with w-YOLO, it signifies that we can ensure overall detection performance and reliability while reducing the model size. Especially for small objects like walnuts, even a small improvement can have a significant impact. The ability of the walnut detection system to perform detection tasks accurately and reliably is crucial for practical deployment and application.
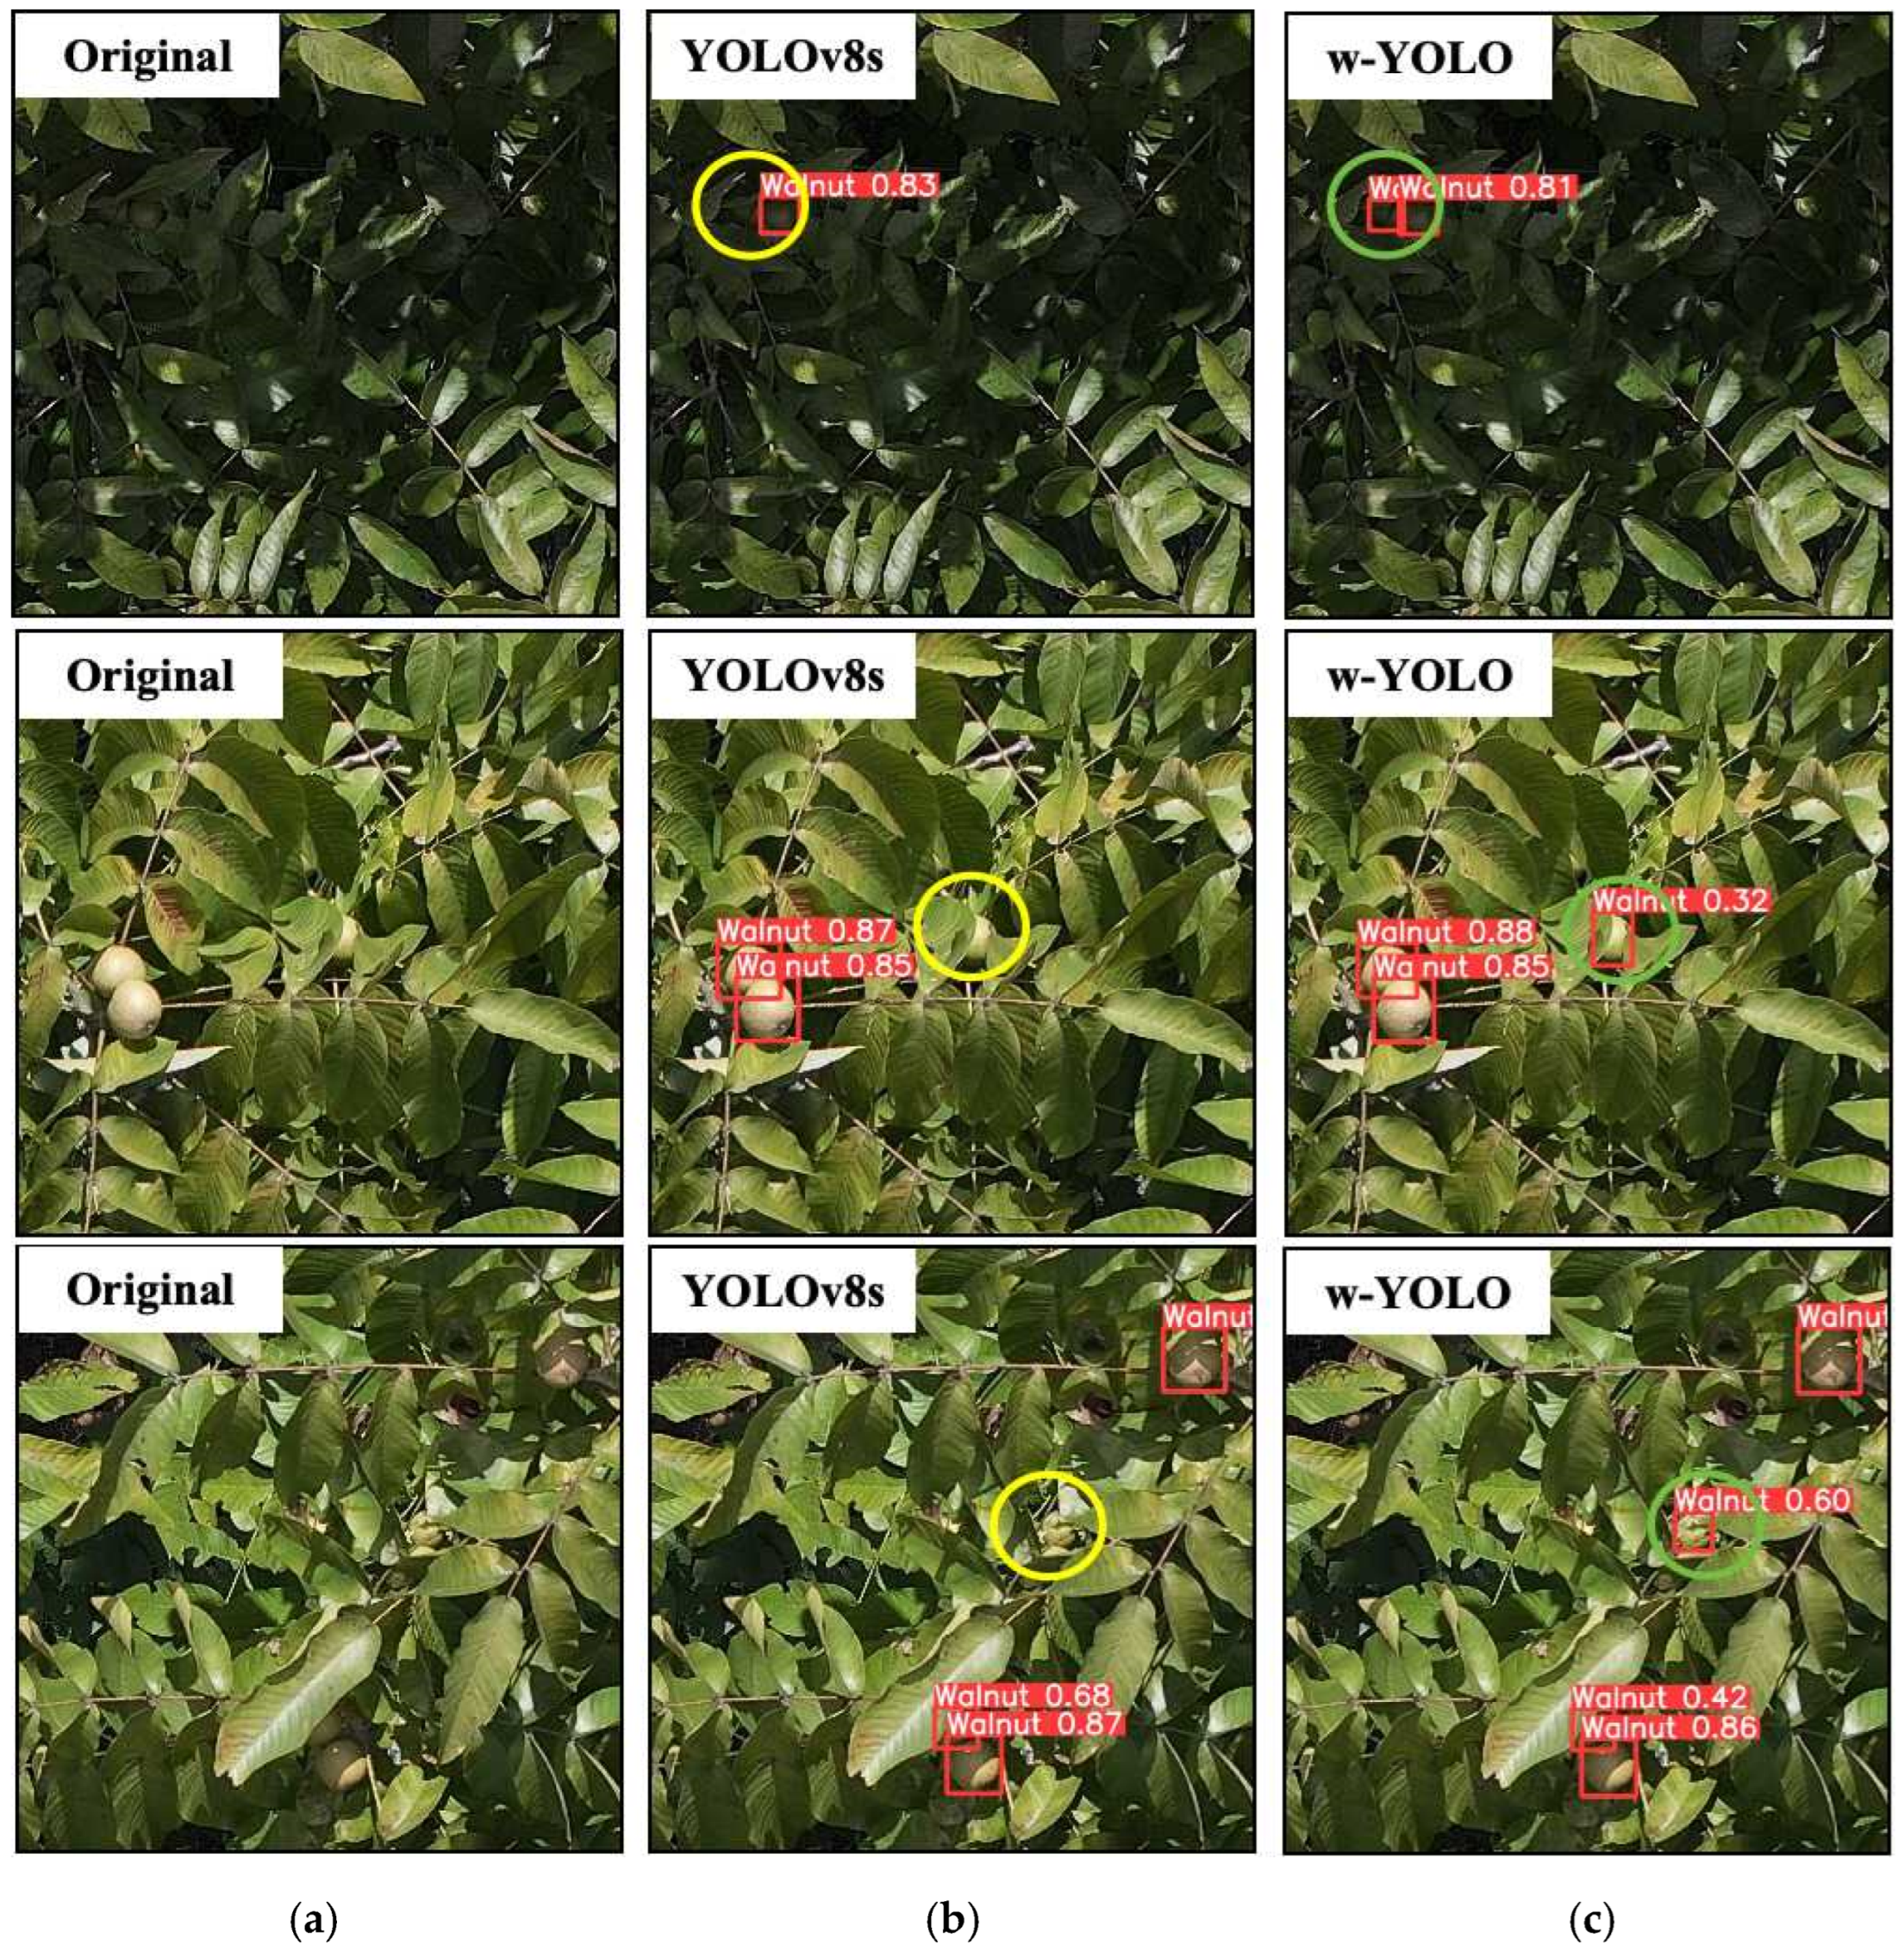
We tested YOLOv8s and w-YOLO using 165 walnut test images. Detailed information about these walnut test images is presented in Table 2. We subdivided the complex lighting conditions into facing light, side light, and backlight, and examples of walnuts in the test dataset under facing light, side light, and backlight are shown in (a–c) of Figure 11, respectively. Figure 12 illustrates the visual comparison of the detection results between YOLOv8s and w-YOLO. In the first row, it can be observed that YOLOv8s missed detections when walnuts were in backlighting conditions, whereas w-YOLO, after improvements, maintained stable accuracy even in such extreme lighting environments. In the second row, the circled walnuts are partially occluded and illuminated from the front. Due to the enhanced feature-capturing capability of w-YOLO, its detection performance is notably better than that of YOLOv8s. When the lighting on the walnut surface is uneven (third row), YOLOv8s struggles to distinguish between the features of leaves and walnuts, while w-YOLO still ensures accurate detection under such complex lighting conditions.
Taking into account the lightweight design and detection performance of the model, we applied some lightweight optimizations to w-YOLO, significantly reducing the model’s parameter count while improving detection accuracy. The comparison results between YOLOv8s and w-YOLO on metrics including P, R, F1-Score, Weighted file size, and Parameters are presented in Table 3. Thanks to the lightweight backbone network and C2f-Faster in the Neck, the Weighted file size of w-YOLO (11.1 MB) was reduced by 50.7%, and Parameters (5.31 M) decreased by 52.3%. w-YOLO achieves a good balance between model size and detection performance, which holds scientific value for future research in edge computing.
3.3.2. Comparison with Other Popular Models
To demonstrate the superiority of w-YOLO in walnut detection under complex lighting conditions, we compared it with many other mainstream object detection models, including YOLOv3, YOLOv3-spp, YOLOv5s, YOLOv5m, YOLOv7, YOLOv7-Tiny, YOLOv8s, and YOLOv8m. The results of the comparative experiments are shown in Table 4. Compared to other models, w-YOLO exhibits the best detection performance and also has significant advantages in terms of model size.
In terms of the F1-Score metric, w-YOLO belongs to the top tier, achieving a score of 0.92, similar to larger models such as YOLOv3, YOLOv3-spp, and YOLO5m, indicating that w-YOLO exhibits stronger generalization ability. Combined with mAP0.5, it can be observed that w-YOLO effectively balances recall and precision. Compared to the baseline model YOLOv8s and models with larger parameter counts, w-YOLO demonstrates higher detection accuracy and recall for walnut target detection tasks. In terms of parameters and weighted file size, w-YOLO has only 5.31 M parameters and a weight file size of only 11.1 MB. Compared to models such as YOLOv3, YOLOv3-spp, YOLOv5s, YOLOv5m, YOLOv7, YOLOv7-Tiny, YOLOv8s, and YOLOv8m, w-YOLO also has a significant advantage in model lightweightness, making it more suitable for deployment on edge computing devices.
3.3.3. Comparison of Detection Visualization with Other Models
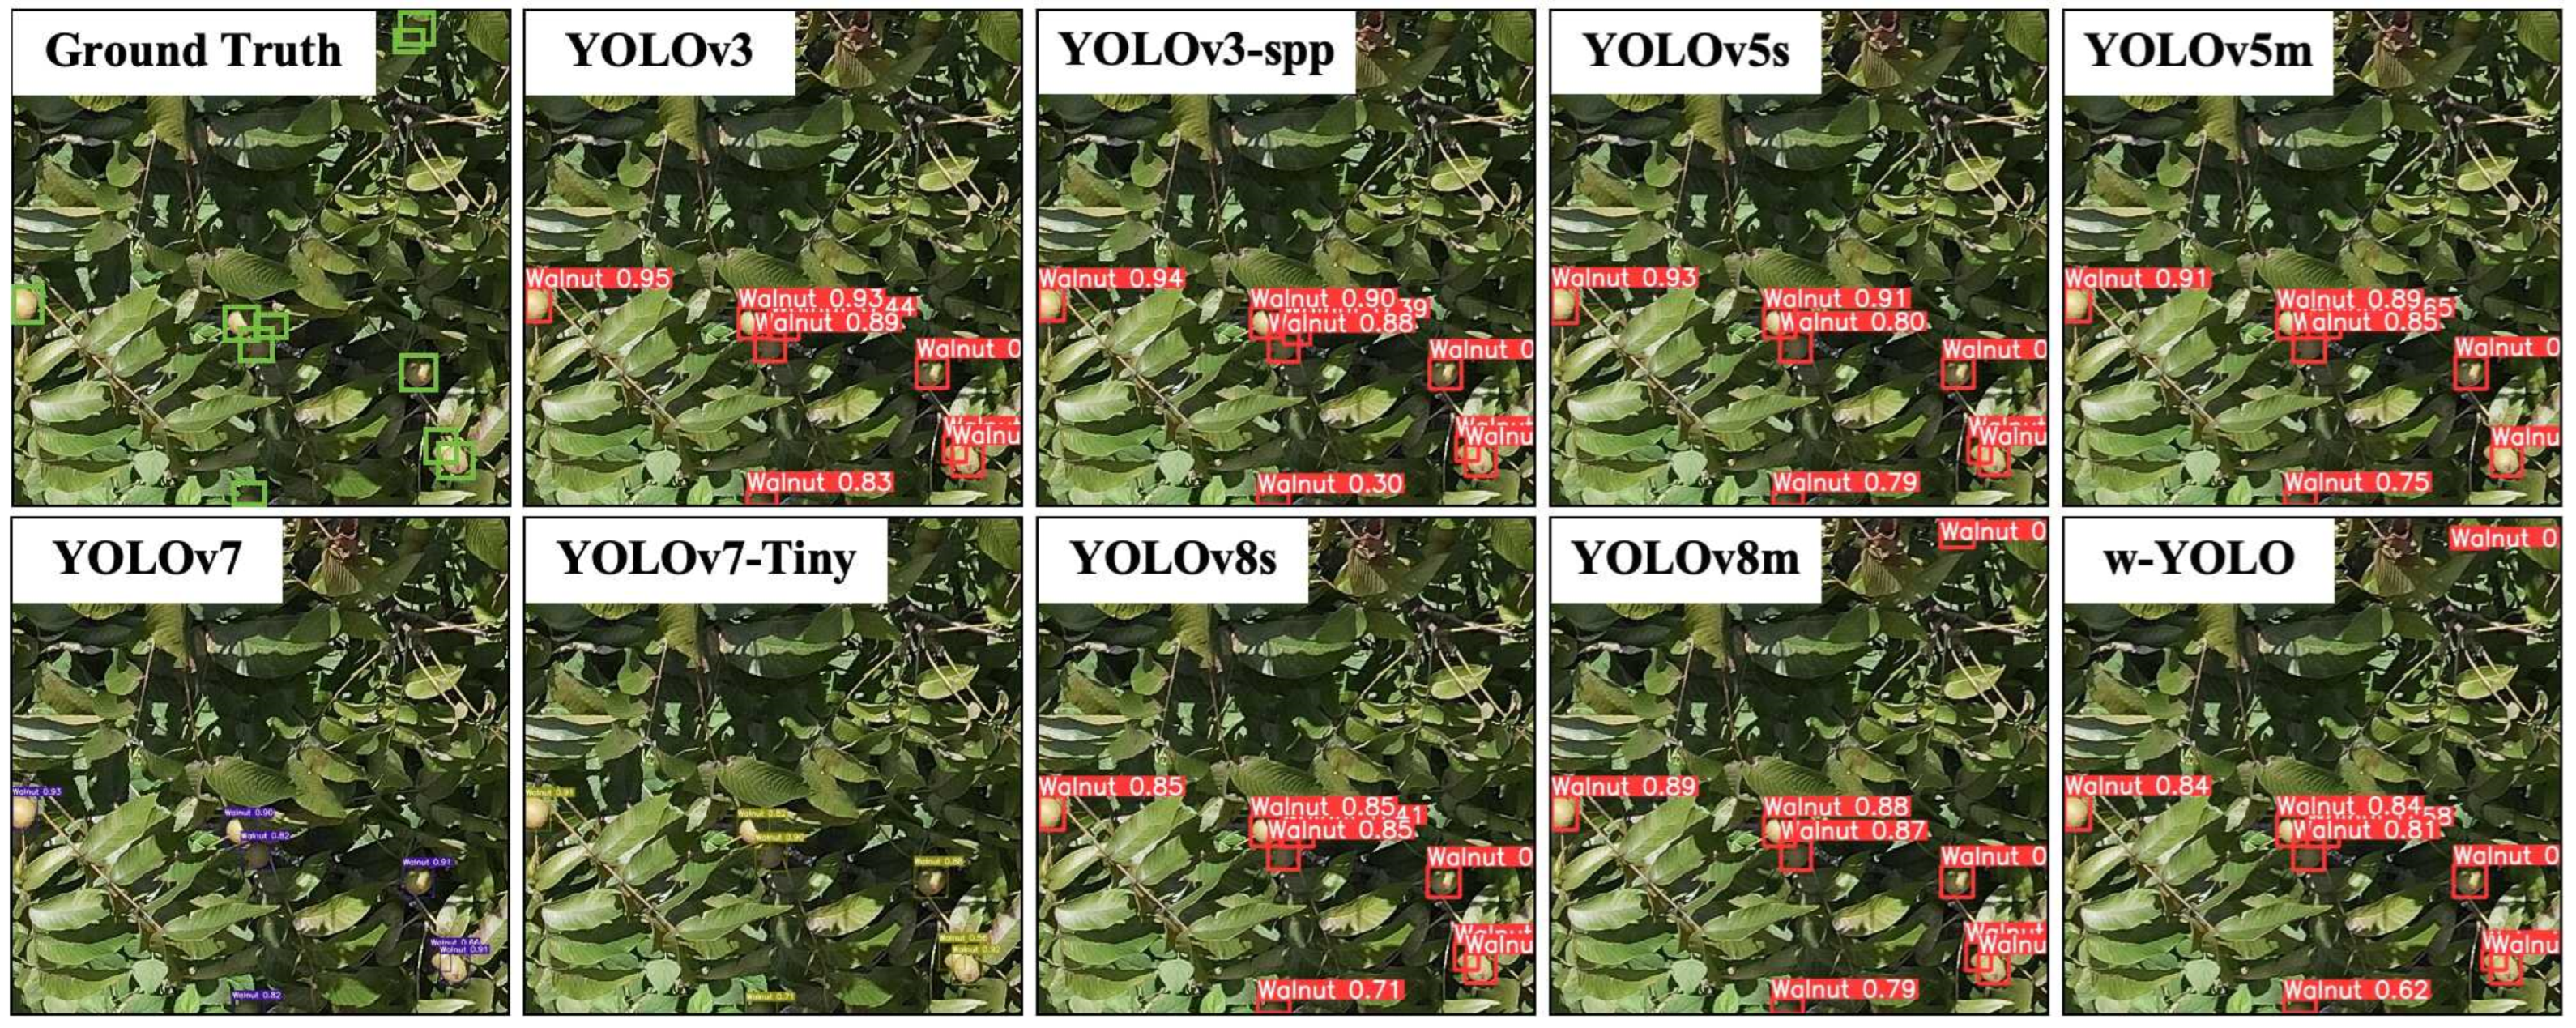
In Section 3.3.2, we conducted a quantitative analysis. In this section, qualitative analysis is performed to visually demonstrate the detection capability of w-YOLO (Figure 13). In the images to be detected, there are a total of 10 walnut targets, with 5 in backlight, 3 in facing light, and 2 receiving only partial illumination.
From the perspective of walnut target detection under different lighting conditions, all models except YOLOv5m identified three walnut fruits illuminated by facing light and two under partial illumination. When detecting walnut targets in backlight conditions, YOLOv5s, YOLOv7, and YOLOv7-Tiny missed three targets, YOLOv3, YOLOv3-spp, YOLOv5m, and YOLOv8s missed two targets, while YOLOv8m and w-YOLO only missed one target.
3.3.4. Ablation Experiment
In this section, we discuss in detail the role of each module in the YOLOv8s model. A series of ablation experiments were conducted using YOLOv8s as the baseline model. The results of the ablation experiments are shown in Table 5. During the experiments, we sequentially introduced C2f-Faster, BiFPN, FasterNet, DyHead, and S2 to the model. Here, S2 refers to the operation of adding a 160 × 160 detection head and removing the 20 × 20 detection head.
Group A represents the baseline model YOLOv8s. After improving the Neck with C2f (Group B), the model’s Parameters and Weighted file size slightly decreased, but it did not negatively affect the walnut object detection accuracy. In experimental Group C, the BiFPN feature fusion structure further reduced the size of the model. Although the mAP0.5 decreased by 0.001 compared to Group B, it still maintained the initial performance. Building on Group C, we replaced the model’s backbone network with the FasterNet structure (Group D). At this point, the model improved significantly in terms of parameters and weighted file size, decreasing by 2.53 M and 5.1 MB, respectively. To mitigate the negative impact of lightweighting, we enhanced the model’s detection head. In experimental Group E, with the effect of DyHead and S2, the model’s mAP0.5 increased by 0.007, while there was only a slight increase in model size.
4. Discussion
4.1. The Impact of Data Augmentation Parameters on the Model
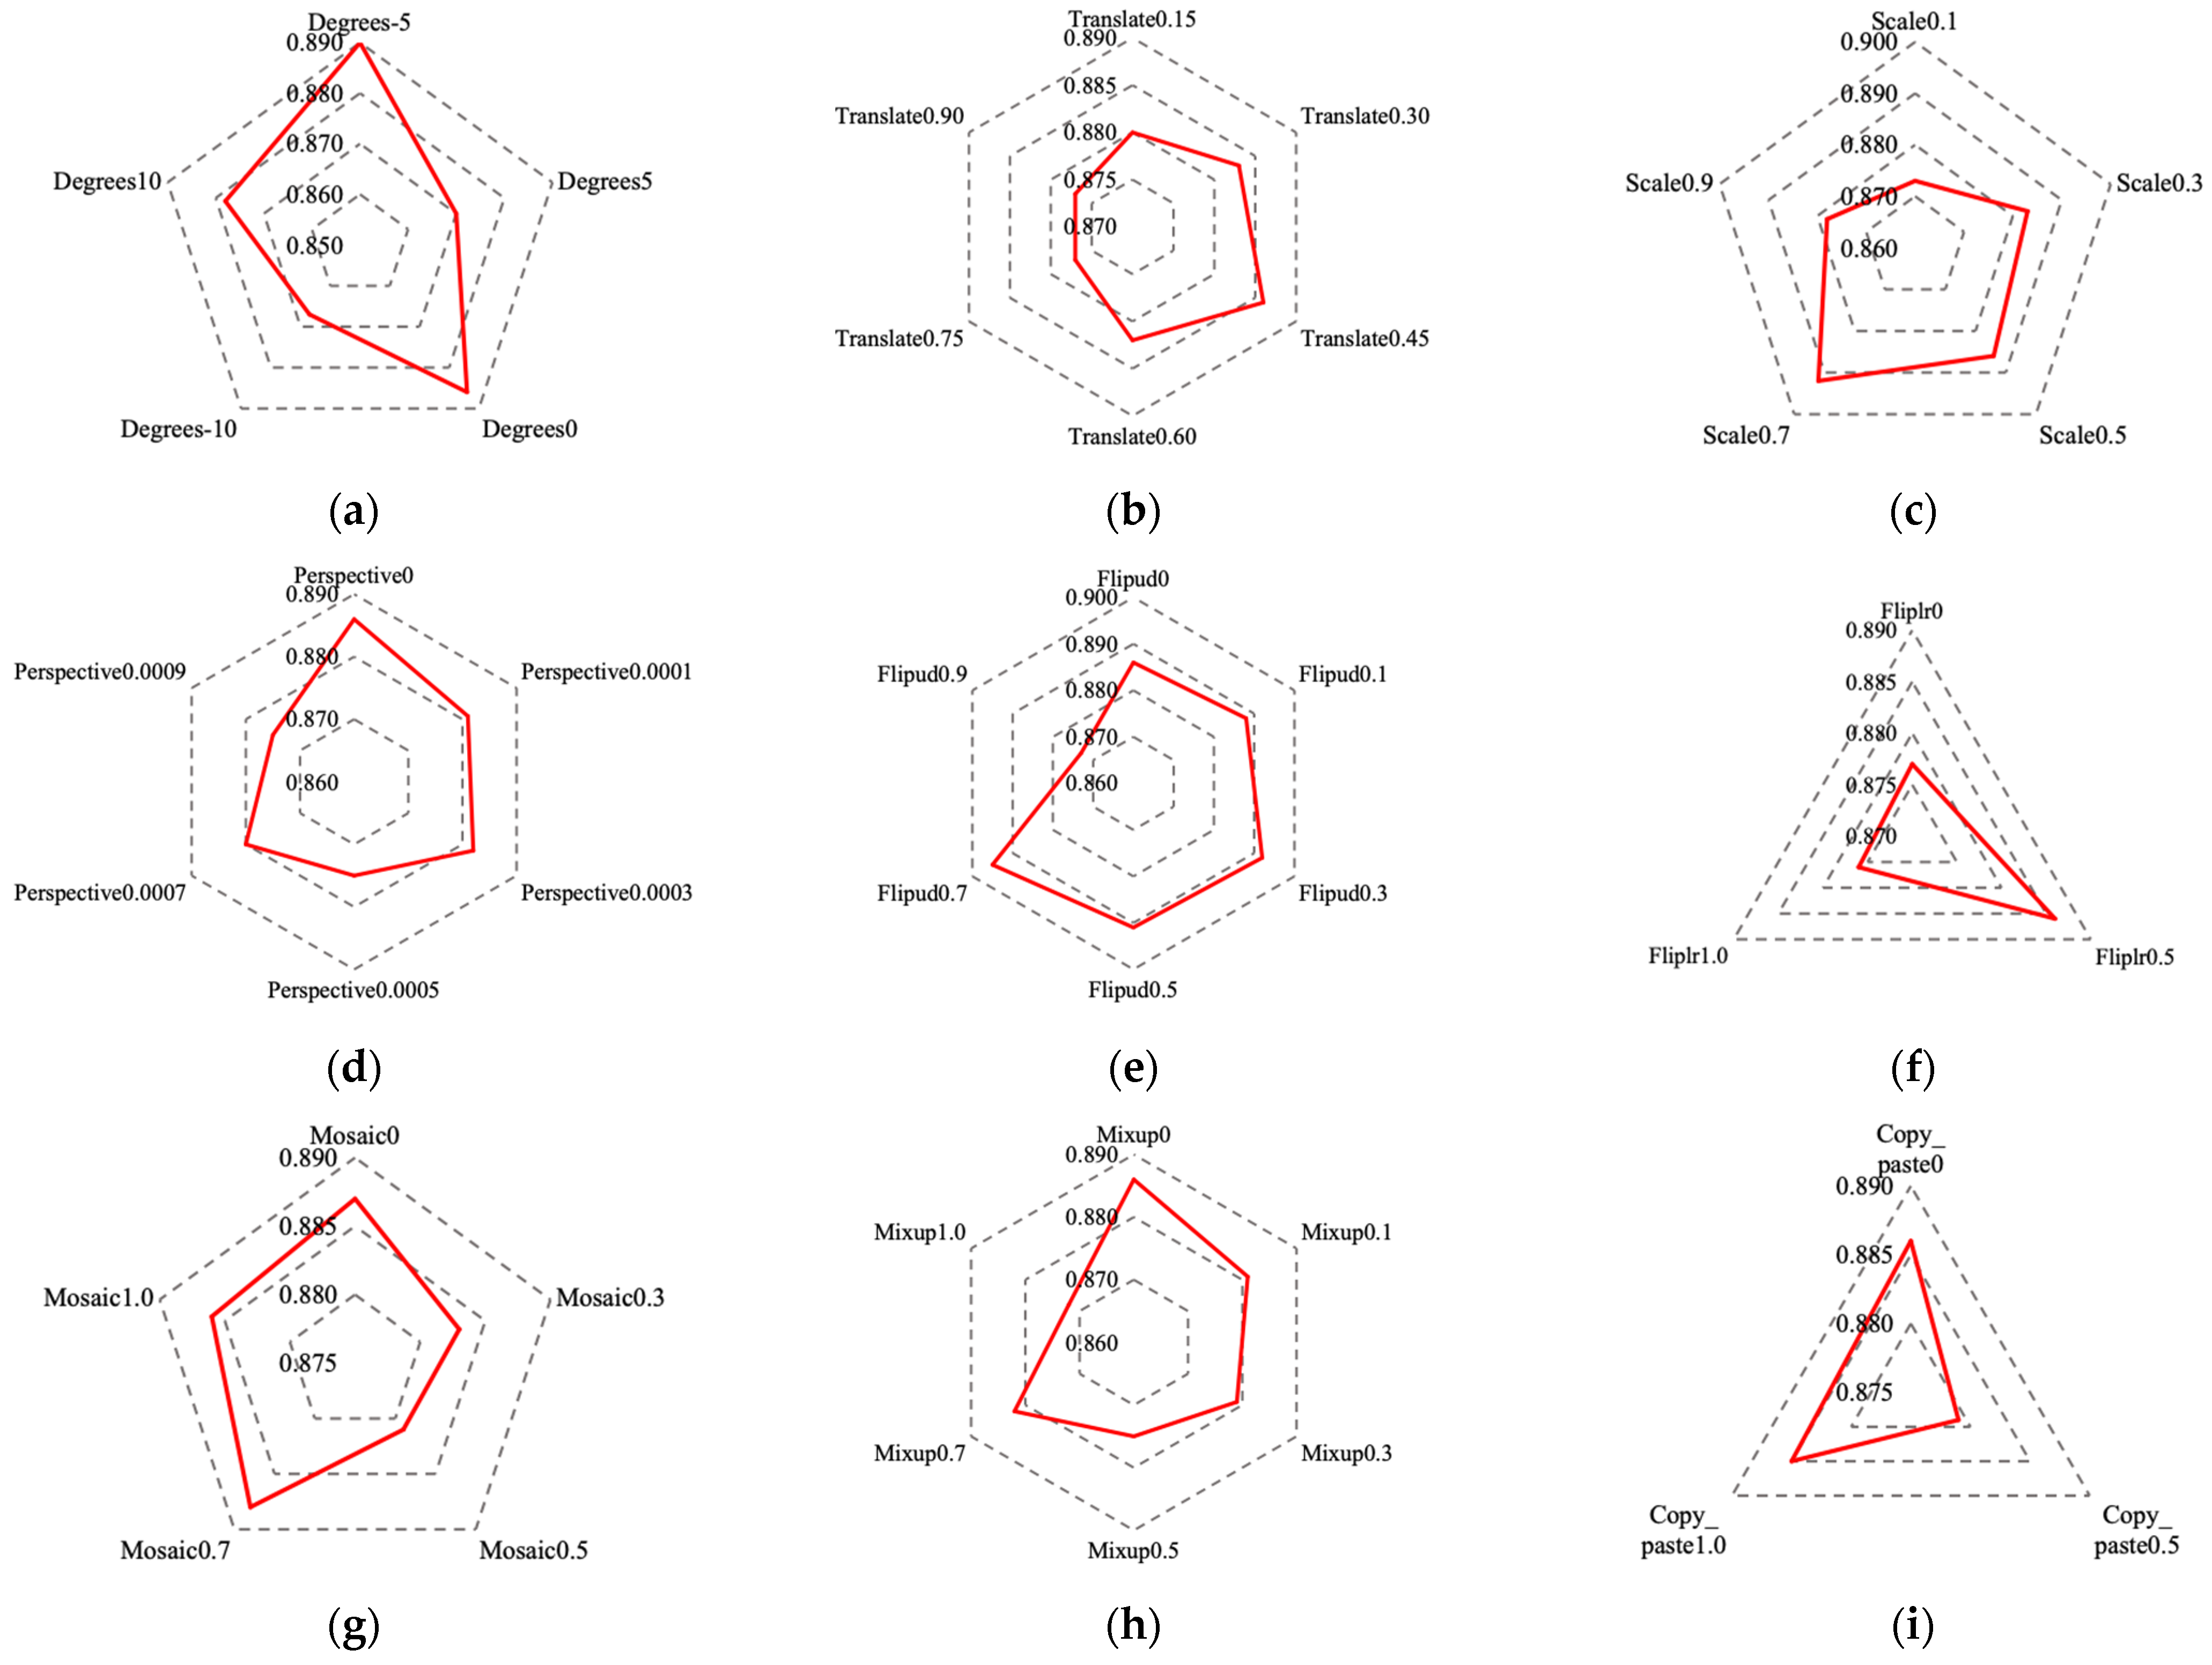
After the images are inputted into the w-YOLO model, they first pass through the data augmentation module. Geometry-based data augmentation is equivalent to introducing variations in viewpoint and spatial position within the dataset, thereby enhancing the model’s robustness in these aspects and improving testing accuracy [47]. Therefore, To delve deeper into the impact of the data augmentation module on the detection performance of w-YOLO, we analyzed the following parameters: image rotation (Degree), image translation (Translate), image scale (Scale), image perspective (Perspective), image flip up–down (Flipud), image flip left–right (Fliplr), image mosaic (Mosaic), image mixup (Mixup), and segment copy–paste (Copy_paste). The corresponding experimental results are shown in Figure 14a–i. From the figures, it can be observed that when Degree, Translate, Scale, Flipud, Fliplr, and Mosaic are set to −5, 0.45, 0.7, 0.7, 0.5, and 0.7, respectively, they have a beneficial effect on the model. However, using Perspective, Mixup, and Copy_paste may have a negative impact on the model.
4.2. Detection Layer Analysis
One of the drawbacks of the detection head in the YOLO algorithm is that, since the detection head typically operates at the final layer of the network, it may miss some low-level detailed information. This can result in lower detection accuracy, particularly for small objects or in complex scenes [48,49]. Therefore, we redesigned the detection head of YOLO and thoroughly analyzed the performance of the detection head in w-YOLO.
4.2.1. Effect of the Number of Dyhead Blocks on Model Performance
To explore the impact of the number of DyHead blocks (Block_num) on the detection performance of w-YOLO, experiments were conducted by adding 1, 2, 3, 4, and 5 DyHead blocks. From Table 6, it can be observed that as the number of DyHead blocks increases, the model’s complexity also increases. When the number is 1, the model achieves the optimal mean Average Precision (mAP0.5) value (0.970), with the lowest values observed for Layer, Parameters, GFLOPs, and Weighted file size indicators. This indicates that adding more DyHead blocks does not necessarily imply stronger feature-capturing capability for the model. Therefore, increasing the depth of the model could have a negative impact on walnut detection.
4.2.2. Effect of S2 Structure on Model Performance
The walnut target detection in UAV remote sensing images falls under the small object detection category. Therefore, in the design of w-YOLO, an additional detection layer specifically tailored for small objects with dimensions of 160 × 160 was added to address the detection of smaller walnut targets. To further compress the size of w-YOLO, the detection layer with dimensions of 20 × 20, suitable for larger targets, was removed.
In this section, we provide a detailed comparison of the experimental results regarding different combinations of detection head sizes to investigate their impact on the model’s detection performance and parameter count. Using YOLOv8s as the baseline, the experimental results are presented in Table 7. From the table, it is evident that the metrics P (0.928) and mAP0.5 (0.968) in Group C outperform those in Groups A and B, while the values of layers and GFLOPs increased by only 13 and 5.7, respectively. Overall, the size configuration of Group C effectively balances the model’s detection performance and complexity.
4.3. Analysis of Other Model Parameters
Optimizers and learning rates play crucial roles in the model training process. Choosing different optimizers can have varied effects on the model’s performance. Utilizing appropriate optimizers can facilitate faster and more stable model convergence during training. Similarly, learning rates play a significant role, and setting them scientifically (Table 8) enables the model to converge to the optimal solution more quickly, accelerating the training process. Figure 15 depicts the training loss curves obtained with different optimizers. From the zoomed-in plots, it can be observed that SGD converges notably faster, followed by Adamax. At the convergence point towards the end of the curves, w-YOLO trained with the SGD optimizer stops training early around 200 epochs, while the curve for Adamax continues to descend. The training loss for w-YOLO using Adamax is lower, which is advantageous for detecting walnut objects.
4.4. Model Performance Advantages and Limitations
Although w-YOLO achieves a certain degree of lightweight design without sacrificing detection accuracy, our research still has the following limitations: (1) The GFLOPs of the detection head in the original size are only 28.4, and in the design of S2 (34.1), we focus more on parameter count and mAP0.5, but this increases the computational load of the model. (2) Despite w-YOLO outperforming YOLOv3, YOLOv3-spp, YOLOv5s, YOLOv5m, YOLOv7, YOLOv7-Tiny, and YOLOv8s in detecting walnut targets under backlight conditions, there are still cases of missed detections. (3) Although we made some progress in walnut object detection tasks under facing light, side light, and backlight conditions, we did not further analyze the detection of occluded walnuts. In future research, we will strive to investigate the impact of walnut occlusion on object detection more deeply and continuously optimize the detection performance of w-YOLO to make it applicable to a wider range of walnut detection tasks.
5. Conclusions
In walnut agriculture production, yield prediction is a crucial step, and traditional manual counting methods face significant challenges in hilly areas. Given the advantages of deep learning models and low-altitude remote sensing technology in agricultural production, in this study, we constructed a walnut small object dataset using high-resolution aerial images captured by UAVs, addressing the problem of data scarcity in this research field. The dataset consists of 2490 images, totaling 12,138 walnut targets. In hilly areas, the complex lighting conditions experienced by walnut fruits during UAV data collection to some extent affect the accuracy of the model. Therefore, based on the YOLOv8s model, we made a series of improvements to obtain w-YOLO, including the utilization of FasterNet, C2f-Faster, and BiFPN to simplify the model’s feature extraction and fusion networks, reducing parameters by 6.37 M and shrinking the weight file size to 9.8 MB. Additionally, we employed a DyHead detection layer with attention mechanisms and redesigned a detection head combination more suitable for walnut object identification. In the walnut recognition task in complex lighting conditions of UAV remote sensing images, w-YOLO achieved a mAP0.5 of 97%, an increase of 0.4% compared to YOLOv8s, with parameters and weight file size reduced by 52.3% and 50.7%, respectively. It is worth noting that our study focuses on model lightweight and enabling w-YOLO to adapt to walnut fruit detection under different lighting conditions. The detection performance of w-YOLO under backlighting was significantly improved compared to the original model, but there are still instances of missed detections, making walnut identification under backlighting conditions challenging. Furthermore, w-YOLO has shown excellent detection results under facing and side lighting. We believe that the lightweight w-YOLO can provide valuable assistance for walnut production management and support the development of edge hardware devices for walnut detection.
However, we recognize that there is still significant room for improvement in the robustness of walnut recognition models. Therefore, our walnut dataset still needs to be further expanded, such as adding walnut data in different occlusion scenarios and multispectral walnut image data. In future research, we will also conduct radar-based three-dimensional modeling of walnut forests and calculate vegetation indices to provide more valuable resources for walnut agriculture production research.
Author Contributions
Conceptualization, M.W. and L.Y.; methodology, M.W.; software, M.W.; validation, M.W., Y.X. and Z.C.; formal analysis, C.X.; investigation, C.X.; resources, M.W. and L.Y.; data curation, M.W. and C.X.; writing—original draft preparation, M.W.; writing—review and editing, M.W.; visualization, M.W.; supervision, L.Y.; funding acquisition, L.Y. All authors have read and agreed to the published version of the manuscript.
Funding
This study was supported by Key Project of Yunnan Basic Research Program, grant number 202401AS070034.
Institutional Review Board Statement
Not applicable.
Data Availability Statement
The data used in this study is available by contacting the corresponding author.
Conflicts of Interest
The authors declare no conflicts of interest.
References
- Regueiro, J.; Sánchez-González, C.; Vallverdú-Queralt, A.; Simal-Gándara, J.; Lamuela-Raventós, R.; Izquierdo-Pulido, M. Comprehensive identification of walnut polyphenols by liquid chromatography coupled to linear ion trap–Orbitrap mass spectrometry. Food Chem. 2014, 152, 340–348. [Google Scholar] [CrossRef] [PubMed]
- Aradhya, M.K.; Potter, D.; Gao, F.; Simon, C.J. Molecular phylogeny of Juglans (Juglandaceae): A biogeographic perspective. Tree Genet. Genomes 2007, 3, 363–378. [Google Scholar] [CrossRef]
- Li, H.; Han, J.; Zhao, Z.; Tian, J.; Fu, X.; Zhao, Y.; Wei, C.; Liu, W. Roasting treatments affect oil extraction rate, fatty acids, oxidative stability, antioxidant activity, and flavor of walnut oil. Front. Nutr. 2023, 9, 1077081. [Google Scholar] [CrossRef] [PubMed]
- Tang, Y.; Chen, M. The impact of agricultural digitization on the high-quality development of agriculture: An empirical test based on provincial panel data. Land 2022, 11, 2152. [Google Scholar] [CrossRef]
- Zhang, X.; Fan, D. Can agricultural digital transformation help farmers increase income? An empirical study based on thousands of farmers in Hubei Province. Environ. Dev. Sustain. 2023, 1–27. [Google Scholar] [CrossRef] [PubMed]
- Momoh, O.Y.; Akpoko, J.G.; Akinola, M.O. Impact of agricultural services and training centre project on tomato farmers’ livelihood in Plateau State, Nigeria. J. Agric. Ext. 2018, 22, 35–43. [Google Scholar] [CrossRef]
- Zheng, Y.; Sarigul, E.; Panicker, G.; Stott, D. Vineyard LAI and canopy coverage estimation with convolutional neural network models and drone pictures. In Proceedings of the Sensing for Agriculture and Food Quality and Safety XIV. SPIE, Orlando, FL, USA, 3–7 April 2022; Volume 12120, pp. 29–38. [Google Scholar]
- Li, X.; Ba, Y.; Zhang, M.; Nong, M.; Yang, C.; Zhang, S. Sugarcane nitrogen concentration and irrigation level prediction based on UAV multispectral imagery. Sensors 2022, 22, 2711. [Google Scholar] [CrossRef] [PubMed]
- Weyler, J.; Quakernack, J.; Lottes, P.; Behley, J.; Stachniss, C. Joint plant and leaf instance segmentation on field-scale UAV imagery. IEEE Robot. Autom. Lett. 2022, 7, 3787–3794. [Google Scholar] [CrossRef]
- Reddy, S.R.G.; Varma, G.P.S.; Davuluri, R.L. Optimized convolutional neural network model for plant species identification from leaf images using computer vision. Int. J. Speech Technol. 2023, 26, 23–50. [Google Scholar] [CrossRef]
- Prasad, A.; Mehta, N.; Horak, M.; Bae, W.D. A two-step machine learning approach for crop disease detection using GAN and UAV technology. Remote Sens. 2022, 14, 4765. [Google Scholar] [CrossRef]
- Reedha, R.; Dericquebourg, E.; Canals, R.; Hafiane, A. Transformer neural network for weed and crop classification of high resolution UAV images. Remote Sens. 2022, 14, 592. [Google Scholar] [CrossRef]
- Shorewala, S.; Ashfaque, A.; Sidharth, R.; Verma, U. Weed density and distribution estimation for precision agriculture using semi-supervised learning. IEEE Access 2021, 9, 27971–27986. [Google Scholar] [CrossRef]
- Cheng, X.; Zhang, Y.; Chen, Y.; Wu, Y.; Yue, Y. Pest identification via deep residual learning in complex background. Comput. Electron. Agric. 2017, 141, 351–356. [Google Scholar] [CrossRef]
- Behroozi-Khazaei, N.; Maleki, M.R. A robust algorithm based on color features for grape cluster segmentation. Comput. Electron. Agric. 2017, 142, 41–49. [Google Scholar] [CrossRef]
- Arribas, J.I.; Sánchez-Ferrero, G.V.; Ruiz-Ruiz, G.; Gómez-Gil, J. Leaf classification in sunflower crops by computer vision and neural networks. Comput. Electron. Agric. 2011, 78, 9–18. [Google Scholar] [CrossRef]
- Zhao, W.; Ding, H.; Na, J.; Li, M. Height estimation from single aerial imagery using contrastive learning based multi-scale refinement network. Int. J. Digit. Earth 2023, 16, 2346–2364. [Google Scholar] [CrossRef]
- Song, W.; Yan, D.; Yan, J.; Hu, C.; Wu, W.; Wang, X. Ship detection and identification in SDGSAT-1 glimmer images based on the glimmer YOLO model. Int. J. Digit. Earth 2023, 16, 4687–4706. [Google Scholar] [CrossRef]
- Hartmann, M.C.; Purves, R.S. Seeing through a new lens: Exploring the potential of city walking tour videos for urban analytics. Int. J. Digit. Earth 2023, 16, 2555–2573. [Google Scholar] [CrossRef]
- Yang, K.; Ye, Z.; Liu, H.; Su, X.; Yu, C.; Zhang, H.; Lai, R. A new framework for GEOBIA: Accurate individual plant extraction and detection using high-resolution RGB data from UAVs. Int. J. Digit. Earth 2023, 16, 2599–2622. [Google Scholar] [CrossRef]
- Huang, F.; Chen, S.; Wang, Q.; Chen, Y. Using deep learning in an embedded system for real-time target detection based on images from an unmanned aerial vehicle: Vehicle detection as a case study. Int. J. Digit. Earth 2023, 16, 910–936. [Google Scholar] [CrossRef]
- Tu, X.; Yuan, Z.; Liu, B.; Liu, J.; Hu, Y.; Hua, H.; Wei, L. An improved YOLOv5 for object detection in visible and thermal infrared images based on contrastive learning. Front. Phys. 2023, 11, 354. [Google Scholar] [CrossRef]
- Girshick, R.; Donahue, J.; Darrell, T.; Malik, J. Rich feature hierarchies for accurate object detection and semantic segmentation. In Proceedings of the IEEE Conference on Computer Vision and Pattern Recognition, Columbus, OH, USA, 23–28 June 2014; pp. 580–587. [Google Scholar]
- Girshick, R. Fast r-cnn. In Proceedings of the IEEE International Conference on Computer Vision, Santiago, Chile, 7–13 December 2015; pp. 1440–1448. [Google Scholar]
- Ren, S.; He, K.; Girshick, R.; Sun, J. Faster R-CNN: Towards real-time object detection with region proposal networks. IEEE Trans. Pattern Anal. Mach. Intell. 2016, 39, 1137–1149. [Google Scholar] [CrossRef]
- He, K.; Gkioxari, G.; Dollár, P.; Girshick, R. Mask r-cnn. In Proceedings of the IEEE International Conference on Computer Vision, Venice, Italy, 22–29 October 2017; pp. 2961–2969. [Google Scholar]
- Redmon, J.; Divvala, S.; Girshick, R.; Farhadi, A. You only look once: Unified, real-time object detection. In Proceedings of the IEEE Conference on Computer Vision and Pattern Recognition, Las Vegas, NV, USA, 27–30 June 2016; pp. 779–788. [Google Scholar]
- Liu, W.; Anguelov, D.; Erhan, D.; Szegedy, C.; Reed, S.E.; Fu, C.-Y.; Berg, A. Ssd: Single shot multibox detector. In Proceedings of the Computer Vision–ECCV 2016: 14th European Conference, Amsterdam, The Netherlands, 11–14 October 2016; Proceedings, Part I 14. Springer International Publishing: Cham, Switzerland, 2016; pp. 21–37. [Google Scholar]
- Duan, K.; Bai, S.; Xie, L.; Qi, H.; Huang, Q.; Tian, Q. Centernet: Keypoint triplets for object detection. In Proceedings of the IEEE/CVF International Conference on Computer Vision, Seoul, Republic of Korea, 27 October–2 November 2019; pp. 6569–6578. [Google Scholar]
- Redmon, J.; Farhadi, A. Yolov3: An incremental improvement. arXiv 2018, arXiv:1804.02767. [Google Scholar]
- Wang, C.Y.; Bochkovskiy, A.; Liao, H.Y.M. YOLOv7: Trainable bag-of-freebies sets new state-of-the-art for real-time object detectors. In Proceedings of the IEEE/CVF Conference on Computer Vision and Pattern Recognition, Vancouver, BC, Canada, 17–24 June 2023; pp. 7464–7475. [Google Scholar]
- Chen, Y.; Xu, H.; Zhang, X.; Gao, P.; Xu, Z.; Huang, X. An object detection method for bayberry trees based on an improved YOLO algorithm. Int. J. Digit. Earth 2023, 16, 781–805. [Google Scholar] [CrossRef]
- Hao, J.; Bing, Z.; Yang, S.; Yang, J.; Sun, L. Detection of green walnut by improved YOLOv3. Trans. Chin. Soc. Agric. Eng. 2022, 38, 183–190. (In Chinese) [Google Scholar]
- Zhong, Z.; Yun, L.; Yang, X.; Chen, Z. Research on Walnut Recognition Algorithm in Natural Environment Based on Improved YOLOX. J. Henan Agric. Sci. 2024, 53, 152–161. (In Chinese) [Google Scholar]
- Li, Q.; Luo, Z.; He, X.; Chen, H. LA_YOLOx: Effective Model to Detect the Surface Defects of Insulative Baffles. Electronics 2023, 12, 2035. [Google Scholar] [CrossRef]
- Tan, M.; Pang, R.; Le, Q.V. Efficientdet: Scalable and efficient object detection. In Proceedings of the IEEE/CVF Conference on Computer Vision and Pattern Recognition, Seattle, WA, USA, 13–19 June 2020; pp. 10781–10790. [Google Scholar]
- Jocher, G. Ultralytics YOLOv8. 2023. Available online: https://github.com/ultralytics/ultralytics (accessed on 17 January 2024).
- Lin, T.Y.; Dollár, P.; Girshick, R.; He, K.; Hariharan, B.; Belongie, S. Feature pyramid networks for object detection. In Proceedings of the IEEE Conference on Computer Vision and Pattern Recognition, Honolulu, HI, USA, 21–26 July 2017; pp. 2117–2125. [Google Scholar]
- Liu, S.; Qi, L.; Qin, H.; Shi, J.; Jia, J. Path aggregation network for instance segmentation. In Proceedings of the IEEE Conference on Computer Vision and Pattern Recognition, Salt Lake City, UT, USA, 18–23 June 2018; pp. 8759–8768. [Google Scholar]
- Dai, X.; Chen, Y.; Xiao, B.; Chen, D.; Liu, M.; Yuan, L.; Zhang, L. Dynamic head: Unifying object detection heads with attentions. In Proceedings of the IEEE/CVF Conference on Computer Vision and Pattern Recognition, Nashville, TN, USA, 20–25 June 2021; pp. 7373–7382. [Google Scholar]
- Sandler, M.; Howard, A.; Zhu, M.; Zhmoginov, A.; Chen, L.-C. Mobilenetv2: Inverted residuals and linear bottlenecks. In Proceedings of the IEEE Conference on Computer Vision and Pattern Recognition, Salt Lake City, UT, USA, 18–23 June 2018; pp. 4510–4520. [Google Scholar]
- Zhang, X.; Zhou, X.; Lin, M.; Sun, J. Shufflenet: An extremely efficient convolutional neural network for mobile devices. In Proceedings of the IEEE Conference on Computer Vision and Pattern Recognition, Salt Lake City, UT, USA, 18–23 June 2018; pp. 6848–6856. [Google Scholar]
- Han, K.; Wang, Y.; Tian, Q.; Guo, J.; Xu, C.; Xu, C. Ghostnet: More features from cheap operations. In Proceedings of the IEEE/CVF Conference on Computer Vision and Pattern Recognition, Seattle, WA, USA, 13–19 June 2020; pp. 1580–1589. [Google Scholar]
- Mehta, S.; Rastegari, M. Mobilevit: Light-weight, general-purpose, and mobile-friendly vision transformer. arXiv 2021, arXiv:2110.02178. [Google Scholar]
- Chen, Y.; Dai, X.; Chen, D.; Liu, M.; Dong, X.; Yuan, L.; Liu, Z. Mobile-former: Bridging mobilenet and transformer. In Proceedings of the IEEE/CVF Conference on Computer Vision and Pattern Recognition, New Orleans, LA, USA, 18–24 June 2022; pp. 5270–5279. [Google Scholar]
- Chen, J.; Kao, S.; He, H.; Zhuo, W.; Wen, S.; Lee, C.-H.; Chan, G. Run, Don’t Walk: Chasing Higher FLOPS for Faster Neural Networks. In Proceedings of the IEEE/CVF Conference on Computer Vision and Pattern Recognition, Vancouver, BC, Canada, 17–24 June 2023; pp. 12021–12031. [Google Scholar]
- Ma, D.; Tang, P.; Zhao, L.; Zhang, Z. Review of data augmentation for image in deep learning. J. Image Graph. 2021, 26, 0487–0502. (In Chinese) [Google Scholar]
- Ge, Z.; Liu, S.; Wang, F.; Li, Z.; Sun, J. Yolox: Exceeding yolo series in 2021. arXiv 2021, arXiv:2107.08430. [Google Scholar]
- Wu, M.; Yun, L.; Wang, Y.; Chen, Z.; Cheng, F. Detection algorithm for dense small objects in high altitude image. Digit. Signal Process. 2024, 146, 104390. [Google Scholar] [CrossRef]
Figure 1.
The basic flowchart of the w-YOLO model. Unlike YOLOv8, this model utilizes FasterNet for feature extraction and BiFPN for feature fusion. The blue dashed lines represent the transmission of feature information from the backbone network to the neck network, while the blue solid lines indicate the direction of feature information transmission within the neck network.

Figure 2.
The workflow of the research in this paper. Walnut tree images are captured using UAVs in the nadir view, and after preprocessing, they form the dataset and labels. These images are then used to train the walnut detection model, and the best parameter combination is utilized to achieve optimal detection performance.

Figure 3.
The study area and its location in this paper.

Figure 4.
Walnut tree images from the perspective of a UAV.

Figure 5.
The structure of the w-YOLO model.

Figure 6.
The structure of FasterNet and Partial Convolution.

Figure 7.
The combination approach of Partial Convolution and Point-Wise Convolution.

Figure 8.
The structure of the model’s feature fusion network. (a) The PAN + FPN structure. (b) The BiFPN structure.
Figure 8.
The structure of the model’s feature fusion network. (a) The PAN + FPN structure. (b) The BiFPN structure.

Figure 9.
The structure of C2f-Faster.

Figure 10.
Comparison of the training curves of YOLOv8s and the w-YOLO model. (a) Loss curves of YOLOv8s and the w-YOLO model; (b) mAP0.5 curves of YOLOv8s and the w-YOLO model.
Figure 10.
Comparison of the training curves of YOLOv8s and the w-YOLO model. (a) Loss curves of YOLOv8s and the w-YOLO model; (b) mAP0.5 curves of YOLOv8s and the w-YOLO model.

Figure 11.
Walnuts under complex lighting conditions. The walnuts in the red circles represent examples of walnuts under different lighting conditions. (a) Facing light. (b) Side light. (c) Backlight.
Figure 11.
Walnuts under complex lighting conditions. The walnuts in the red circles represent examples of walnuts under different lighting conditions. (a) Facing light. (b) Side light. (c) Backlight.

Figure 12.
Visualization comparison of detection results between YOLOv8s and w-YOLO. The walnuts circled in yellow represent the walnuts missed by YOLOv8s, while those circled in green represent the detection results of w-YOLO for the walnuts missed by YOLOv8s. (a) Original image; (b) Detection result of YOLOv8s; (c) Detection result of w-YOLO.

Figure 13.
The visual detection results of w-YOLO compared to other mainstream models. The green boxes in the Ground Truth represent all walnut targets in this test image.
Figure 13.
The visual detection results of w-YOLO compared to other mainstream models. The green boxes in the Ground Truth represent all walnut targets in this test image.

Figure 14.
mAP0.5 values of w-YOLO under different parameters of various data augmentation methods. (a–i) represent the experimental results of image rotation, image translation, image scale, image perspective, image flip up–down, image flip left–right, image mosaic, image mixup, and segment copy–paste, respectively.

Figure 15.
Training loss curves of different optimizers.


Table 1.
The detailed information of the walnut dataset.
| Label Name | Images Number (pcs) | Target Number (pcs) |
|---|---|---|
| Walnut | 2490 | 12,138 |
Note: pcs is the abbreviation for pieces.
Table 2.
The total number of targets in the test images and the number of targets under different lighting conditions.
Table 2.
The total number of targets in the test images and the number of targets under different lighting conditions.
| Target Number (pcs) | Facing Light (pcs) | Side Light (pcs) | Backlight (pcs) |
|---|---|---|---|
| 391 | 137 | 118 | 136 |
Note: pcs is the abbreviation for pieces.
Table 3.
Comparison Results between YOLOv8s and w-YOLO.
| Model | P | R | F1-Score | Weighted File Size (MB) | Parameters (M) |
|---|---|---|---|---|---|
| YOLOv8 | 0.886 | 0.99 | 0.91 | 22.5 | 11.13 |
| w-YOLO | 0.900 | 0.99 | 0.92 | 11.1(−50.7%) | 5.31(−52.3%) |
Table 4.
The comparative experimental results between w-YOLO and other mainstream models.
| Model | F1-Score | mAP0.5 | Parameters (M) | Weighted File Size (MB) |
|---|---|---|---|---|
| YOLOv3 | 0.92 | 0.956 | 61.50 | 123.5 |
| YOLOv3-spp | 0.92 | 0.960 | 62.55 | 125.6 |
| YOLOv5s | 0.91 | 0.959 | 7.01 | 14.4 |
| YOLOv5m | 0.92 | 0.964 | 20.85 | 42.2 |
| YOLOv7 | 0.91 | 0.962 | 37.20 | 71.3 |
| YOLOv7-Tiny | 0.88 | 0.936 | 6.01 | 11.7 |
| YOLOv8s | 0.91 | 0.966 | 11.13 | 22.5 |
| YOLOv8m | 0.91 | 0.969 | 25.84 | 52.0 |
| w-YOLO | 0.92 | 0.970 | 5.31 | 11.1 |
Table 5.
Ablation experiment.
| Group | C2f-Faster | BiFPN | FasterNet | DyHead | S2 | mAP0.5 | Parameters (M) | Weighted File Size (MB) |
|---|---|---|---|---|---|---|---|---|
| A | 0.966 | 11.13 | 22.5 | |||||
| B | √ | 0.967(+0.001) | 9.75(−1.38) | 19.8(−2.7) | ||||
| C | √ | √ | 0.966(−0.001) | 7.29(−2.46) | 14.9(−4.9) | |||
| D | √ | √ | √ | 0.963(−0.003) | 4.76(−2.53) | 9.8(−5.1) | ||
| E | √ | √ | √ | √ | √ | 0.970(+0.007) | 5.31(+0.55) | 11.1(+1.3) |
Table 6.
Comparison Experiment of Different Numbers of DyHead Blocks.
| Block_Num | mAP0.5 | Layer | Parameters (M) | GFLOPs | Weighted File Size (MB) |
|---|---|---|---|---|---|
| 1 | 0.970 | 349 | 5.31 | 41.3 | 11.1 |
| 2 | 0.968 | 373 | 5.80 | 43.5 | 12.1 |
| 3 | 0.968 | 397 | 6.30 | 45.6 | 13.1 |
| 4 | 0.967 | 421 | 6.79 | 47.7 | 14.1 |
| 5 | 0.965 | 445 | 7.29 | 49.8 | 15.1 |
Table 7.
Ablation experiment of different detection layers.
| Group | 20 × 20 | 40 × 40 | 80 × 80 | 160 × 160 | P | mAP0.5 | Layer | GFLOPs | Parameters (M) |
|---|---|---|---|---|---|---|---|---|---|
| A | √ | √ | √ | 0.886 | 0.966 | 168 | 28.4 | 11.13 | |
| B | √ | √ | √ | √ | 0.917 | 0.967 | 207 | 36.6 | 10.63 |
| C | √ | √ | √ | 0.928 | 0.968 | 181 | 34.1 | 7.40 |
Table 8.
Results of mAP0.5 under different final learning rate values.
| Value | mAP0.5 |
|---|---|
| 0.03 | 0.967 |
| 0.05 | 0.968 |
| 0.07 | 0.970 |
| 0.10 | 0.967 |
Disclaimer/Publisher’s Note: The statements, opinions and data contained in all publications are solely those of the individual author(s) and contributor(s) and not of MDPI and/or the editor(s). MDPI and/or the editor(s) disclaim responsibility for any injury to people or property resulting from any ideas, methods, instructions or products referred to in the content. |
© 2024 by the authors. Licensee MDPI, Basel, Switzerland. This article is an open access article distributed under the terms and conditions of the Creative Commons Attribution (CC BY) license (https://creativecommons.org/licenses/by/4.0/).
Share and Cite
MDPI and ACS Style
Wu, M.; Yun, L.; Xue, C.; Chen, Z.; Xia, Y. Walnut Recognition Method for UAV Remote Sensing Images. Agriculture 2024, 14, 646. https://doi.org/10.3390/agriculture14040646
AMA Style
Wu M, Yun L, Xue C, Chen Z, Xia Y. Walnut Recognition Method for UAV Remote Sensing Images. Agriculture. 2024; 14(4):646. https://doi.org/10.3390/agriculture14040646
Chicago/Turabian StyleWu, Mingjie, Lijun Yun, Chen Xue, Zaiqing Chen, and Yuelong Xia. 2024. "Walnut Recognition Method for UAV Remote Sensing Images" Agriculture 14, no. 4: 646. https://doi.org/10.3390/agriculture14040646
Note that from the first issue of 2016, this journal uses article numbers instead of page numbers. See further details here.