Article

Genetic Characterization of Gardenia jasminoides Ellis Genotypes Derived from Seeds and Selection Based on Their Morphological Traits and Flower Aromatic Substances

by
Vasiliki Anastasiadi
1,
Stefanos Hatzilazarou
1,
Emmanouil-Nikolaos Papadakis
2,
Aikaterini-Angeliki Kotoula
1,
Nikolaos Tsalouchos
3,
Taxiarchis Labis
4,
Athanasios Economou
1 and
Stefanos Kostas
1,*
1
Laboratory of Floriculture, School of Agriculture, Aristotle University, 54124 Thessaloniki, Greece
2
Pesticide Science Laboratory, School of Agriculture, Aristotle University, 54124 Thessaloniki, Greece
3
N. Tsalouchos Nurseries, 37300 Volos, Greece
4
Labis Bros. Nurseries, 37300 Volos, Greece
*
Author to whom correspondence should be addressed.
Agriculture 2024, 14(5), 650; https://doi.org/10.3390/agriculture14050650
Submission received: 20 February 2024 / Revised: 3 April 2024 / Accepted: 19 April 2024 / Published: 23 April 2024

Abstract

:
Gardenia jasminoides Ellis is an evergreen shrub with white fragrant flowers, and it is cultivated for its ornamental, aromatic and medicinal value. The present study aimed to select desirable genotypes for potential commercial exploitation as pot plants or use in perfumery. Thus, 32 genotypes of G. jasminoides plants derived from seedlings, whose seeds were obtained from Australia and the USA, were evaluated for their genetic diversity in relation to four commercial cultivars (‘Pelion’, ‘Joy’, ‘Grandiflora’ and ‘Kimberly’, used as reference cultivars) using ISSR and SCoT markers. A cluster analysis separated the gardenia genotypes into the following three clusters: one cluster comprised the 16 genotypes originating from Australia, one included the 16 genotypes originating from the USA, and the third cluster contained the four reference cultivars. In other words, there was a clear demarcation of the genotypes investigated according to their geographical origin. In addition, the gardenia genotypes were evaluated for their morphological and chemical characteristics. Thus, flower- and leaf-related traits with ornamental value were measured, while the volatile compounds of flower extracts were identified with GC-MS analysis. Genotype 29-5 was selected for its acceptable morphological traits and genotype 51-8 for its rich volatile compounds. The major volatile compounds responsible for the floral aroma of the various gardenia genotypes examined were α-farnesene, benzyl tiglate, cis-3-hexenyltiglate, jasminelactone and linalool.

1. Introduction

Gardenia jasminoides Ellis is an ornamental, aromatic and medicinal plant belonging to the Rubiaceae family. It is an evergreen shrub with dark green, glossy leaves and strongly fragrant white flowers. Depending on the variety, the flowers are either single or double and 6–10 cm in diameter [1,2]. Because of its attractive foliage and aromatic flowers, gardenia is extensively cultivated in warm, temperate and subtropical regions as a garden plant, as well as an ornamental pot plant indoors [3,4]. Gardenia plants can also be used for cut flowers [5] or cut foliage [6,7]. Plants of gardenia commercial cultivars available on international flower markets are vegetatively propagated from terminal shoot cuttings taken from certified stock plants [3].
So far, sufficient research has been conducted to illustrate the genetic diversity of G. jasminoides Ellis using various molecular markers, such as ISSR (Inter-Simple Sequence Repeat), SSR (Simple Sequence Repeat), AFLP (Amplified Fragment-Length Polymorphism) and RAPD (Random Amplified Polymorphic DNA) [3,8,9,10,11,12]. An ISSR analysis was used to evaluate the genetic relationship of G. jasminoides ‘Radicans’ and ‘Grandiflora’ [8]. In addition, ISSR and AFLP molecular markers were employed to assess the genetic stability of gardenia plants produced from artificial seeds and micropropagation, respectively [9,10]. RAPD markers were used to detect genetic diversity in plants of G. jasminoides ‘Pelion’ grown as pot plants in Greece [3]. RAPD markers were also used to genetically characterize gardenia ‘Grandiflora’ plants collected from different regions of China [11]. In addition, SCAR (Sequence Characterized Amplified Region) markers, derived from the molecular cloning of RAPD fragments, were developed by Mei et al. [12] specifically for the identification of G. jasminoides cultivars.
ISSR is a molecular marker technology based on the principle of microsatellite repeats. It is highly polymorphic and has been applied to studies of genetic diversity and mapping, gene tagging and evolutionary biology without previous information genome sequencing [13,14]. SCoT (Start Codon Targeted) polymorphism is a novel and promising molecular marker, first described by Collard and Mackill [15], which is based on the short conserved region surrounding the targeting start codon (ATG) in plant genes. SCoT primers can be used for genetic analysis, quantitative trait loci (QTL) mapping and DNA fingerprinting in various plants [15,16,17,18,19]. In principle, SCoT primers are similar to those of the ISSR because the same single primer is used as the forward and reverse primers [15]. Simplicity, high reproducibility and reliability, accuracy and cost-effectiveness are some of the advantages of both molecular markers [13,14,20,21].
The study of morphological traits is a rapid and common method of germplasm identification and characterization through phenotype [22]. The morphological traits play an important role in plant improvement, as well as in the selection of genotypes for use in floriculture. Some desirable traits of G. jasminoides Ellis, which could be exploited for the selection of genotypes as pot plants, are plant robustness, large and numerous flowers with a pleasant aroma and attractive leaves. However, the desired traits may differ depending on the use of gardenia plants, e.g., pot plant or garden plant [23].
The sweet and refreshing aroma of gardenia flowers is one of the main reasons for growing gardenia as a pot plant. Phytochemical studies of gardenia flowers have reported the isolation of flavonoids, iridoids, phenylpropanoids, diterpenes, triterpenes, phenolic acids and organic acid esters [24,25,26,27,28]. The chemical composition of gardenia flowers has been extensively studied by several research groups using GC-MS [29,30,31,32,33]. Their studies demonstrated that the main volatile components were α-farnesene, cis-3-hexenyltiglate, indole, isoeugenol, jasminelactone, linalool and 4-decanolide. Moreover, studies have been conducted that focus on the chemical composition of gardenia flower essential oil. Zhang et al. [34] extracted the essential oil of G. jasminoides flowers by hydrodistillation and cited linalool, α-farnesene, α-terpineol, cembrene A, cis-3-hexenyltiglate, geraniol and hexyl tiglate as the main volatile ingredients. According to Yu et al. [28], the aroma and active components of gardenia flowers are influenced by the variety and part of the flower (petals, stamens and pistils), as well as the method of processing.
The objective of the current study was, in the first step, to assess the genetic variation in 32 gardenia genotypes derived from seeds of various cultivars in relation to four commercial cultivars available from major flower markets. In the next step, the aim was to evaluate these seed-derived genotypes based on their morphological traits and the content of the aromatic substances in their flowers to select suitable genotypes either for commercial cultivation as pot plants for the flower market or for their valuable aromatic substances for the perfumery market.

2. Materials and Methods

2.1. Plant Material

The G. jasminoides plants used in the experiments were produced through seed propagation. The seeds of G. jasminoides were purchased online from more than 30 suppliers around the world. Of these suppliers, the seeds of only four suppliers located in Australia and the USA germinated. These seeds belonged to the cultivars ‘Hedge Flower’ (coded from 29-1 to 29-8, Internet store: The Seed Vine) and ‘New Magnifica’ (coded from 70-1 to 70-8, Internet store: O’ Neill Seeds) from Australia and also to cultivars ‘Long Lasting’ (coded from 36-1 to 36-8, Internet store: Flower Paradise) and ‘Blanco Arbusto’ (coded from 51-1 to 51-8, Internet store: Seed Ville) from the USA. Thus, the total number of genotypes derived from the seeds was more than 100 (18–47 per supplier), and, of these, 8 genotypes per supplier with the best ornamental characteristics (leaf size, vigorous growth, large flowers, etc.) were selected for further study. In addition to these 32 genotypes, ‘Pelion’, ‘Joy’, ‘Grandiflora’ and ‘Kimberly’, known in Europe as pot plant commercial cultivars of G. jasminoides, were obtained from the nurseries of N. Tsalouchos and Labis Bros. (Volos, Greece) and added to this study as reference cultivars. The plants of the 32 genotypes were propagated vegetatively with shoot cuttings in a fog system using the rooting regulator K-IBA (potassium salt of 3-indolebutyric acid) at a concentration of 0.5 g/L to obtain more plants per genotype for the experiments. These plants were cultivated in 1.5 L pots containing a substrate of peat and perlite (3:1 v/v) at pH 5.6. The experimental plants grew for one year in a glass greenhouse of the Floriculture Laboratory of the Aristotle University (Thessaloniki, Greece), under a natural photoperiod, temperatures of 25 ± 3 °C (day) and 18 ± 3 °C (night) and a fertilizing regime in accordance with standard cultivation techniques [3].

2.2. Genetic Assessment

2.2.1. DNA Extraction

Genomic DNA (gDNA) was extracted from the leaves of the 32 genotypes of G. jasminoides, as well as the 4 reference cultivars, according to the modified CTAB protocol of Doyle and Doyle [35], as briefly described by Tsaktsira et al. [36]. DNA concentration and purity were estimated through 260/280 nm absorbance measurements using a Nanodrop 2000 Spectrophotometer (Thermo Electron Corporation, Waltham, MA, USA), and the quality of the extracted DNA was evaluated by running the samples on 0.8% agarose gel electrophoresis. The absorbance ratio ranged from 1.80 to 2.00, which is an indication of highly pure genomic DNA. The gel was run for 20 min on 100 mL 1× TAE buffer and stained with 5 μL ethidium bromide. λ-DNA-Hind III was used as a DNA marker of known molecular weight. The DNA was then diluted to produce a final concentration of 20 ng/μL.

2.2.2. Molecular Markers and PCR Amplification

The DNA samples were subjected to PCR (Polymerase Chain Reaction) with the molecular markers ISSR and SCoT. Among a series of primers initially tested, 10 ISSR and 2 SCoT primers (Integrated DNA Technologies, Coralville, IA, USA) provided reproducible results and were selected for further use (Table 1). The PCR amplification was carried out on a total of 15 μL of reaction mixture containing 0.12 μL KAPA Taq DNA Polymerase (5 U/μL), 0.3 μL KAPA dNTP Mix (10 μM each) and 1.5 μL KAPA Taq Buffer A (10×) from the Kapa Biosystems Taq PCR Kit (Kapa Biosystems, Inc. Boston, MA, USA) and 1.5 μL of each primer (10 ng/μL), 1.5 μL of 20 ng/μL genomic DNA and 10.08 μL sterile distilled water (ddH2O). The amplification reactions were performed in an Applied Biosystems SimpliAmpTM Thermal Cycler (Thermo Electron Corporation, Waltham, MA, USA) using the following cycling profile: initial denaturation at 95 °C for 3 min, followed by 35 cycles of denaturation at 95 °C for 30 s, annealing at a specific temperature for each primer for 30 s and extension at 72 °C for 2 min, as well as a final extension at 72 °C for 2 min. PCR products were loaded onto 1.4% agarose gel for electrophoresis with 1× TAE buffer, stained with 5 mL ethidium bromide along with 1 kb DNA Ladder (Kapa Biosystems, Boston, MA, USA) and photographed under ultraviolet light. PCR amplification reactions were performed twice to check the reproducibility of each primer. Only primers that generated abundant and clear bands were used to estimate the genetic diversity of the 36 genotypes tested.

2.2.3. Data Analysis

Each ISSR and SCoT band was recorded as present (1) or absent (0) in binary code, and then the data were analyzed by genetic analysis in Excel with the cross-platform package GenAlEx 6.501 [37]. To detect relationships among the 32 genotypes and the 4 reference genotypes, the data were converted by cluster analysis based on the Nei genetic distance [38], and the results are presented as a principal coordinate analysis (PCoA). Nei’s distance is known as the standard genetic distance used to estimate the average heterozygosity among individuals. In addition, a dendrogram was generated with the Unweighted Pair Group Method of clustering (UPGMA) using MEGA 4 v.4.1 software [39]. Finally, to evaluate the overall genetic structure of the G. jasminoides genotypes, the data were analyzed, using a clustering approach based on a Bayesian model, with the Structure 2.3.4 software package [40]. In this respect, 3 independent runs were performed for each K, with the number of clusters (K) set from 1 to 8; the burn in time and MCMC (Markov Chain Monte Carlo) replication number both set to 100,000; and a model for admixture and correlated allele frequencies. The analyzed data were then exported to the STRUCTURE HARVESTER program [41] following the method of Evanno et al. [42] to determine the most likely number of K genetic clusters, where the K value was estimated by the posterior probability and an ad hoc statistic, ΔK. In this method, genotypes are separated by vertical columns and identified by colors. Genotypes with the same color belong to the same genetic cluster, and different colors in the same genotype indicate the probability of belonging to different clusters.

2.3. Morphological Traits

Eight phenotypic traits of ornamental value, consisting of seven quantitative and one qualitative, were recorded for the morphological characterization of the 32 gardenia genotypes compared to those of the 4 reference cultivars. These flower- and leaf-related traits of ornamental interest included flower form, flower weight and diameter, number of petals (corolla), petal length and width and leaf length and width (lamina) (Table 2). For flower-related traits, fully opened flowers with expanded petals were randomly collected in June 2022. After the measurements, the flowers were stored at −80 °C for the upcoming chemical analysis of their volatile compounds. For leaf-related traits, mature leaves were selected and measured on the same date to avoid differences due to the environmental conditions or developmental stages of the plant. The flower weight was measured with an electronic balance of 0.001 g precision.

2.4. Extraction and GC-MS Analysis of Volatile Compounds from Flowers

Gardenia flower petal extracts were obtained using the n-hexane solvent, following the Rusanov et al. [43] method with some modifications. In particular, 0.6 g of petals, stored at −80 °C, was ground into powder and homogenized in liquid nitrogen using a porcelain mortar and pestle and then transferred to a 4 mL glass vial. The extraction was performed by adding 1.8 mL of n-hexane to glass vials containing 2.5 μg/mL of tetradecane (C-14), as an internal standard for GC-MS analysis. Each glass vial was subjected to an extensive vortex for 3 h and 30 min, at 2000 rpm, at room temperature. After dehydration with 500 mg anhydrous sodium sulfate, the vortex continued for an additional 15 min to remove the remaining water. The samples were then centrifuged at 3500 rpm at 5 °C for 10 min. Finally, 1.5 mL of the supernatant was transferred to a 2 mL glass vial through a 0.22 μm hydrophobic PTFE syringe filter, followed by storage at −20 °C until chemical analysis.
The volatile compounds of the gardenia extracts were analyzed using a TRACE GC Ultra gas chromatography system with a Polaris Q mass spectrometer (Thermo Electron Corporation, Milan, Italy). The chromatographic analysis was performed on a capillary column Omega wax 250 (Supelco, Bellefonte, PA, USA), with a length of 30 m, an inner diameter of 0.25 mm and a film thickness of 0.25 μm. Helium was used as the mobile phase with a flow of 1 mL/min. The injector temperature was 220 °C, and 1μL injections were performed in the splitless mode. The temperature program of the analysis was as follows: an initial column oven temperature of 40 °C, which remained constant for 7 min, followed by a linear rise to 230 °C at a rate of 5 °C/min and, finally, to 260 °C at 10 °C/min, after which the temperature remained constant for 5 min.
The eluted compounds were detected with an ion trap mass detector using electron ionization (EI). The collection and trapping of ions were performed in a mass range/charge (m/z) range of 40–550 amu, and the signal acquisition was conducted in the full scan mode. Analyte identification was based on the Kovats Retention Index and mass spectra comparisons to the NIST (National Institute of Standards and Technology, Gaithersburg, MD, USA) library.

2.5. Statistical Analysis

For the statistical analysis of each morphological trait examined, six samples were used, randomly taking two flowers or leaves from each of the three randomly selected plants per genotype. All chemical analyses of the volatile compounds were performed on three single-flowered samples, each of which was obtained from the three randomly selected plants per genotype. One-way analysis of variance (ANOVA) was applied for the statistical analysis of the data of each morphological trait and volatile compound, using the statistical package SPSS 27 (IBM, Armonk, NY, USA). The comparisons of the means were based on Tukey’s multiple comparison test at p < 0.05.

3. Results and Discussion

3.1. Genetic Analysis

3.1.1. ISSR and SCoT Polymorphism

The twelve primers tested on the extracted gDNA of the thirty-two genotypes and four reference cultivars of G. jasminoides were evaluated for the number of both amplified and polymorphic bands, as well as the rate of polymorphism (Table 3). The size of the amplified fragments ranged from 200 to 1600 bp for the ISSR and 200 to 1700 bp for the SCoT markers. Regarding the ISSR profiles, a total of 182 bands were produced, all of which were polymorphic, ranging from 12 to 22, with an average of 18.2 bands per primer. The primer UBC 808 had the lowest number of bands, whereas the primer UBC 834 had the largest (Table 3, Figure 1). All ISSR markers displayed 100% polymorphism. In the SCoT markers, the number of amplified bands ranged from 17 for primer SCoT 333 to 19 for SCoT 313, and the polymorphism rates were 94.1% and 100%, respectively (Table 3). The high rate of polymorphism found in this study indicates that both ISSR and SCoT molecular markers have great potential in estimating the genetic variation among the studied gardenia genotypes.
In addition, the analysis of molecular variance (AMOVA) revealed moderate genetic differences within and among the cultivars at p < 0.001, and the fixation index (Φst = 0.488) supports the results on the genetic diversity. From the total genetic diversity, 49% and 51% were attributed to among-cultivar differentiation and within-genotype variability, respectively (Table S1 in Supplementary Materials). Moreover, within the cultivars the heterozygosity was low, indicating high genetic similarity, with the lowest value of 0.124 being recorded in ‘Long Lasting’ (Table S2).

3.1.2. Principal Coordinate Analysis (PCoA)

A PCoA was performed to investigate the genetic relationships among the thirty-two G. jasminoides genotypes, as well as the four reference cultivars. On the basis of the combined data from the ISSR and SCoT markers, the PCoA illustrated 40.60% of the total variation, of which coordinates 1 and 2 accounted for 25.85% and 14.76%, respectively (Figure 2). The cluster analysis classified the tested genotypes into three distinct clusters. The first cluster, in a blue circle, included the 16 genotypes from the ‘Hedge Flower’ and ‘New Magnifica’ cultivars, which originated in Australia. Although these 16 genotypes are clustered in the same location in the PCoA, they are scattered, which leads to genetic differentiation. The second cluster, in a red circle, contained the eight genotypes of the ‘Blanco Arbusto’ cultivar and the eight genotypes of the ‘Long Lasting’ cultivar, both originating in the USA. The third cluster, in a pink circle, consisted of the four reference cultivars. Of these, the ‘Joy’ cultivar was found to be the most closely related to the gardenia genotypes that originated in Australia and to belong to the ‘Hedge Flower’ and ‘Long Lasting’ cultivars (Figure 2).

3.1.3. Unweighted Pair Group Method with Arithmetic Mean (UPGMA)

Similar results were observed in the form of a dendrogram, in which the thirty-two genotypes and the four reference cultivars were grouped into three clusters. The first cluster (a’) included the 16 genotypes that originated from Australia, whereas the second one (b’) included the 16 genotypes from the USA. The third smallest cluster (c’) consisted of the reference cultivars (Figure 3).

3.1.4. STRUCTURE Analysis

Based on the STRUCTURE analysis and the highest value of ΔK (K = 3) detected, the thirty-two genotypes, plus the four reference cultivars, were also divided into three clusters (Figure 4A,B). The first cluster (in green) consisted of the 16 genotypes from the USA, and the second cluster (in red) consisted of the 16 genotypes from Australia. The reference cultivars were genetically differentiated from the other 32 genotypes and, thus, formed a third cluster (in blue) (Figure 4B).
These findings reveal that the genotypes studied can be segregated into different clusters based on their geographical origin, suggesting the existence of genetic heterogeneity. The 16 genotypes from the two Australian cultivars were located in the same area of the PCoA, on the same cluster of the dendrogram and had the same color in the STRUCTURE analysis. The above findings highlight that these 16 genotypes share the same genetic material, and their mother cultivars (‘Hedge Flower’ and ‘New Magnifica’) may be derived from similar genetic material. The same applies to the 16 genotypes of the two cultivars of USA origin, and they also share the same genetic material with each other but different from that of the cultivars from Australia. In addition, among the 16 genotypes from the USA, a similar pattern of genetic similarity and clustering was observed with that of genotypes from Australia. The main difference between the two clusters was the genetic distance of the genotypes, which was greater in the genotypes from the USA, as they appeared more distant and scattered compared to genotypes from Australia.
Significant genetic variation among cultivars from different geographic locations was also observed by employing RAPD molecular markers [11]. Furthermore, Mei et al. [12] developed improved RAPD markers (G. jasminoides-specific SCAR markers) which can identify G. jasminoides from other plant species and also distinguish G. jasminoides ‘grandiflora Nakai’ from other cultivars of G. jasminoides.
To the best of our knowledge, the use of combined data from ISSR and SCoT markers has not previously been applied to the assessment of the genetic diversity of G. jasminoides. However, there are several reports of their use on various plant species, such as Pistacia vera [44], Laurus nobilis [45], Diospyros sp. [46] and Rosa damascena [47]. According to our results, both ISSR and SCoT markers successfully estimated the genetic diversity in the G. jasminoides genotypes studied, thus being useful and reliable tools for assessing plant genetic relationships.

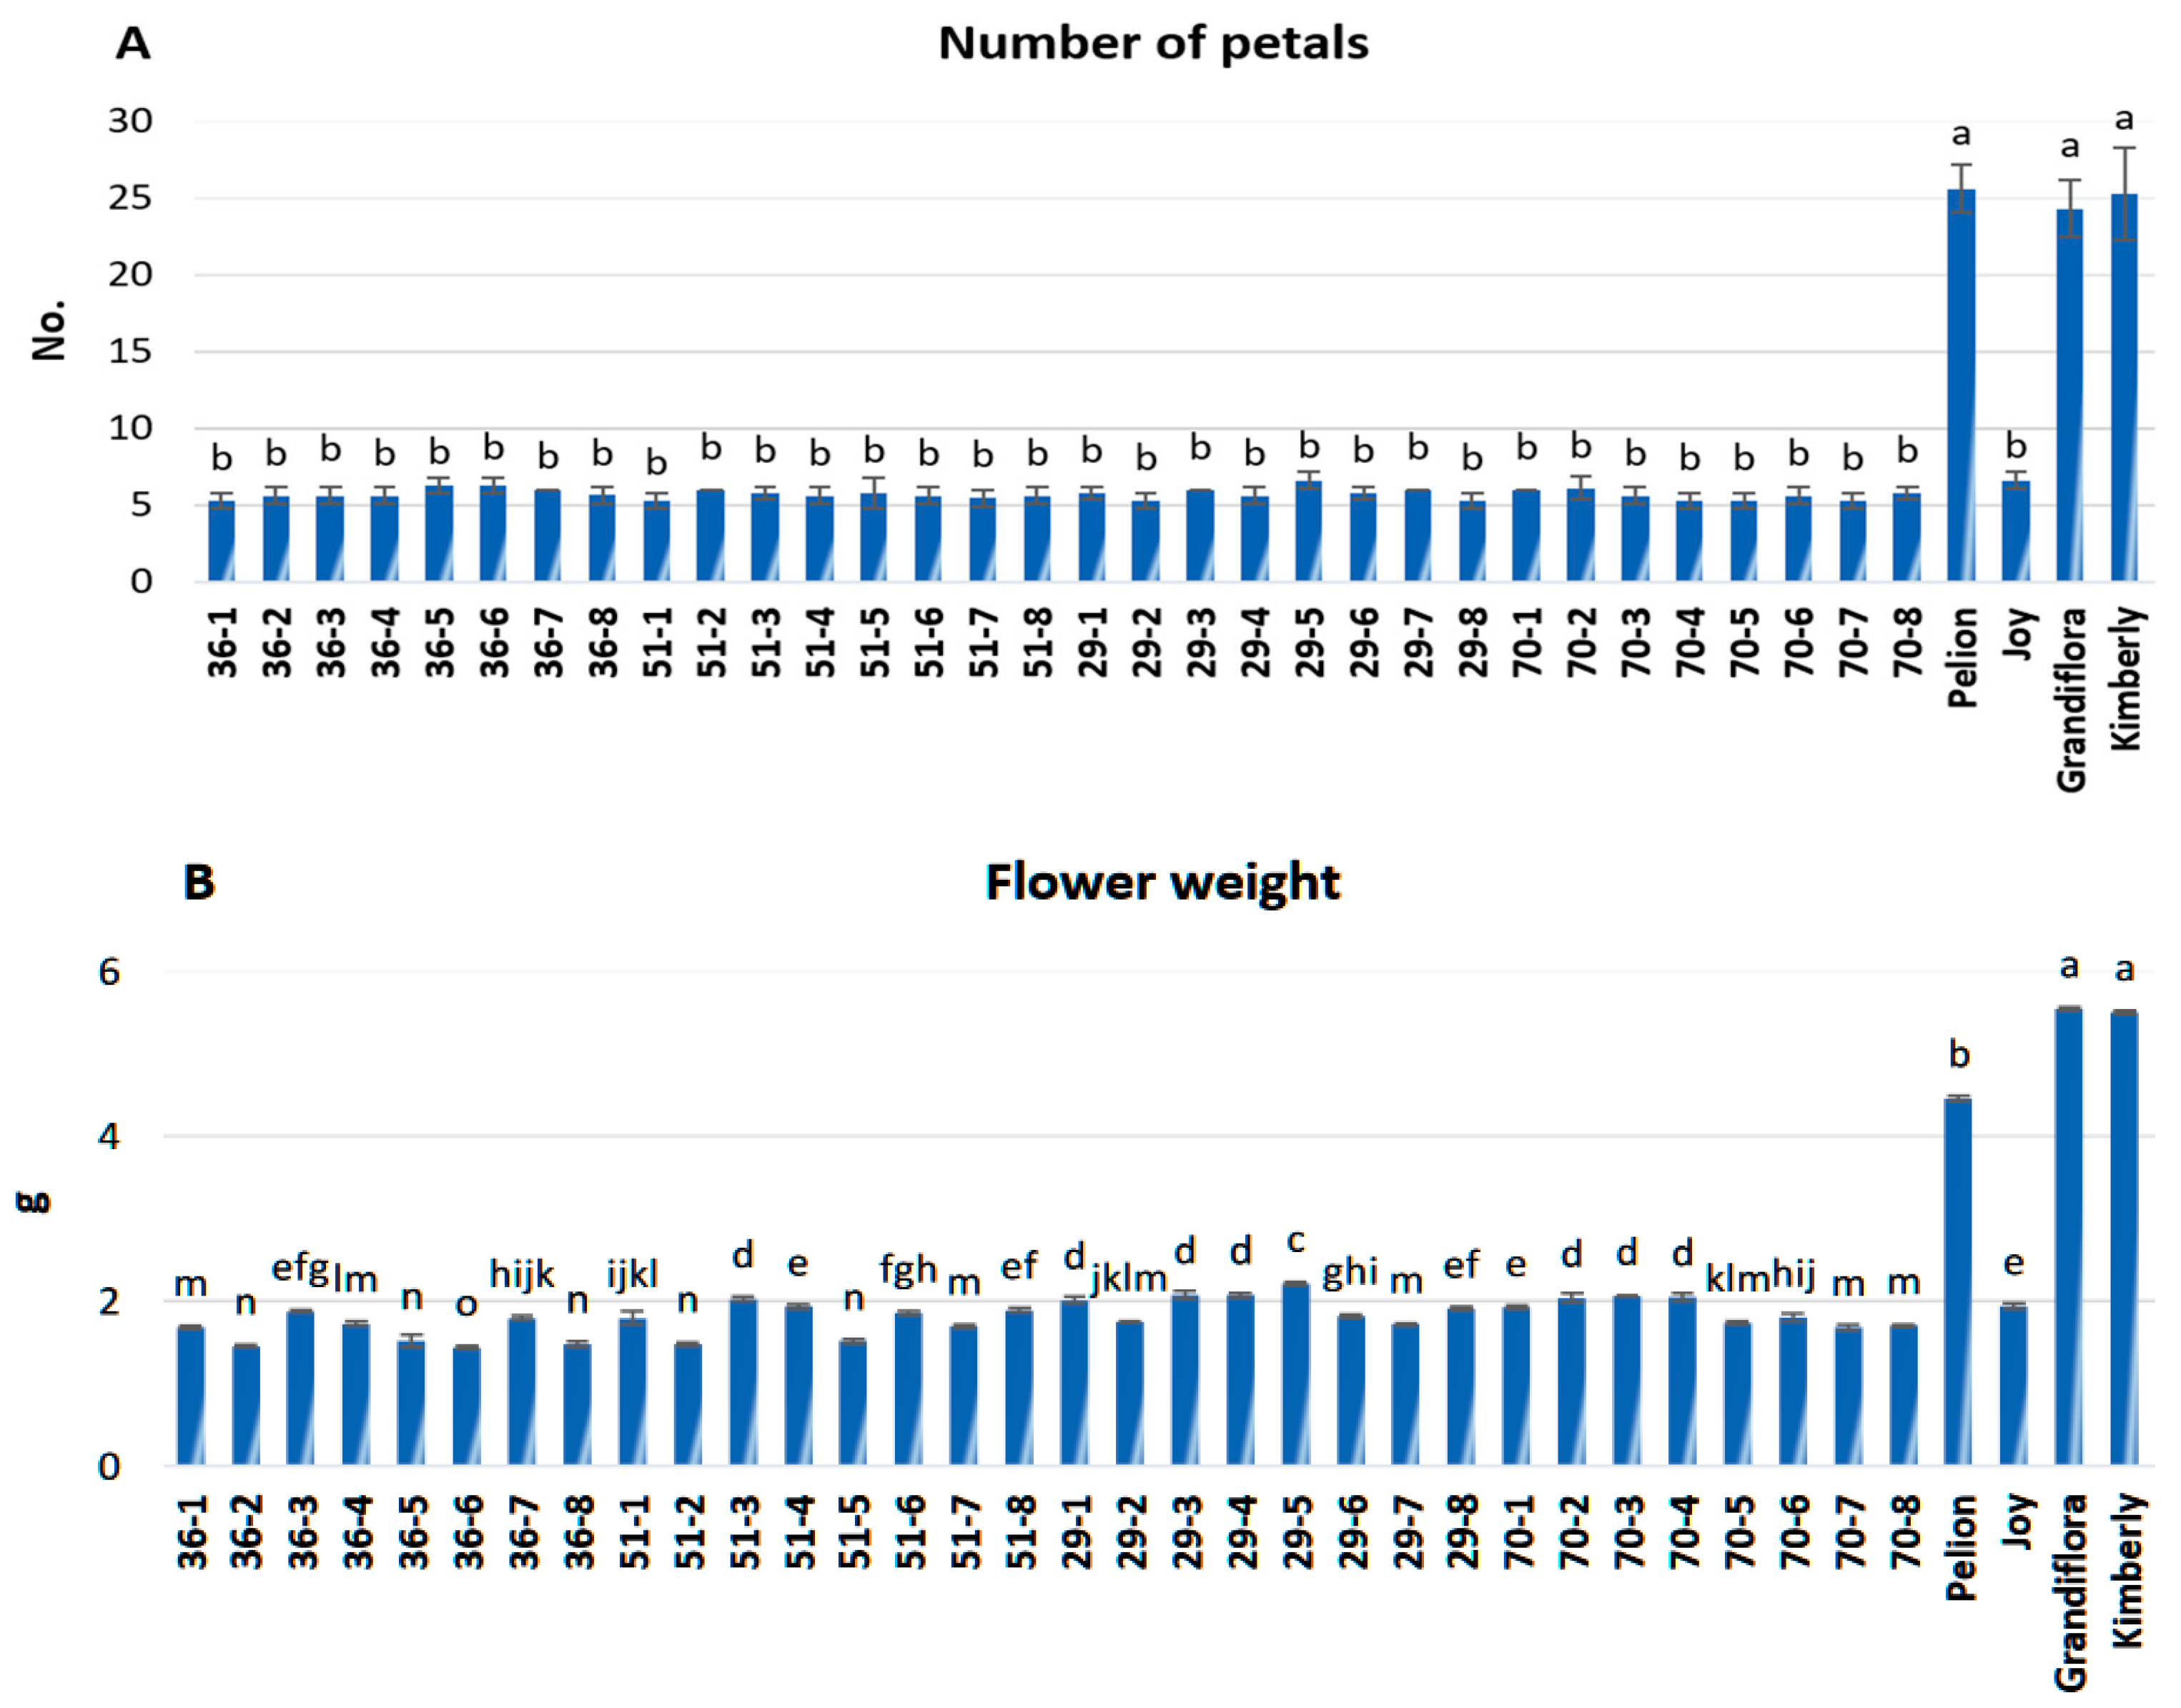
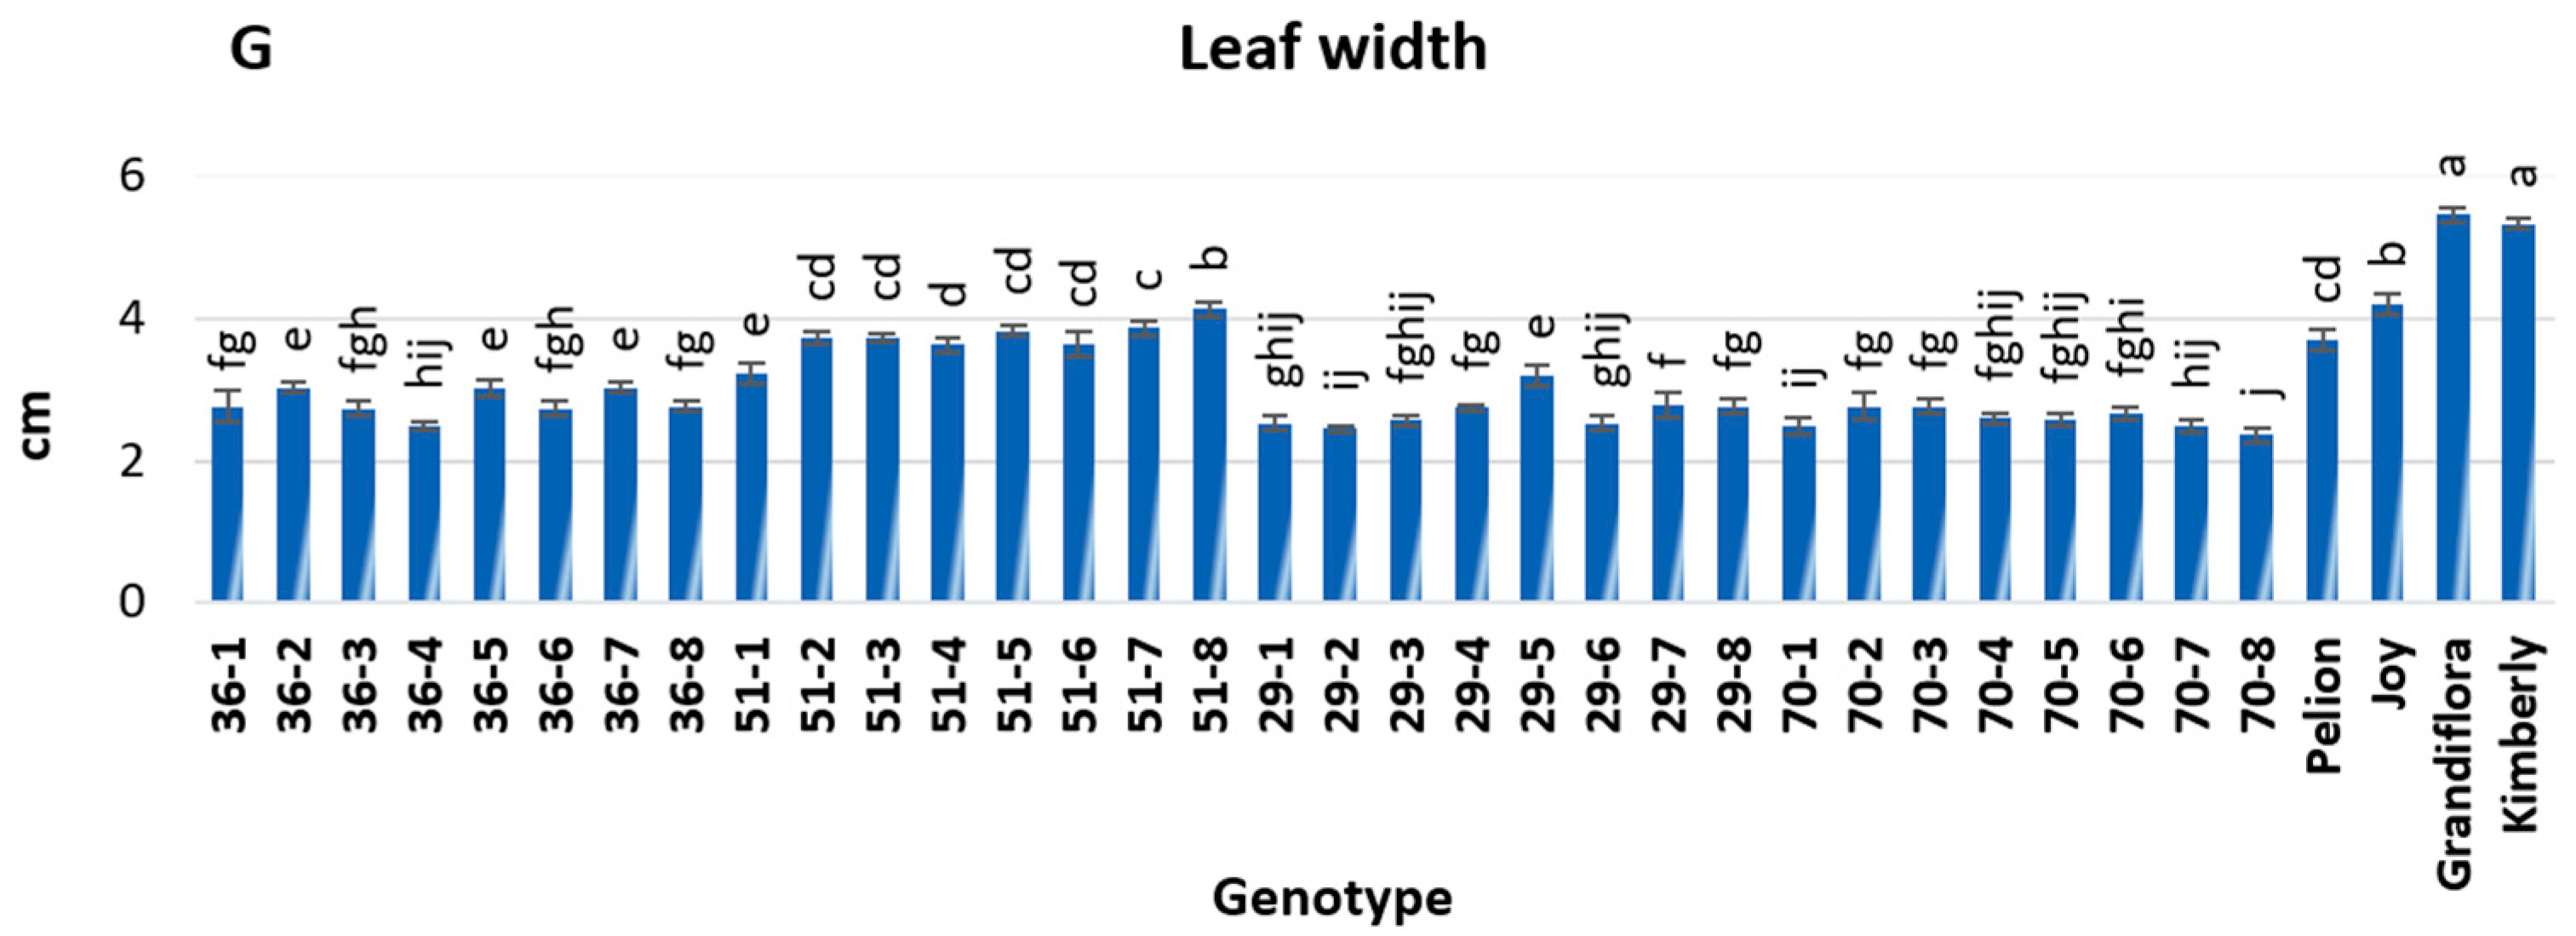
3.2. Evaluation of Morphological Traits

According to the morphological analysis of the traits, significant variation was observed among the thirty-two genotypes examined and the four reference cultivars regarding the flower form, flower weight and number of petals (Figure 5 and Figure 6A,B, Table S3). The reference cultivars, except ‘Joy’, had double flowers and, therefore, had more petals, numbering up to 25. In addition, ‘Grandiflora’ and ‘Kimberly’ recorded the highest values for flower weight, which were 5.55 g and 5.51 g, respectively (Figure 6B, Table S3). On the other hand, single-flowered genotypes were found to have 5-7 petals (Figure 6A, Table S3). The highest values for both the number of petals and the weight of the flowers were observed in genotype 29-5, whose flowers had 6.67 petals and weighed 2.22 g (Figure 6A,B, Table S3). Genotype 29-5 also had the largest flower diameter, which was 8.40 cm (Figure 6C, Table S3). As for the dimensions of the petals, the lengths varied from 2.63 to 4.10 cm and the widths from 1.35 to 2.47 cm (Figure 6D,E, Table S3). Genotype 29-5 appears to have the longest petals (4.10 cm) and ‘Grandiflora’ and ‘Kimberly’ the widest (2.47 and 2.40 cm, respectively), whereas genotype 36-6 had the narrowest petals (1.35 cm) (Figure 6D,E, Table S3). The lengths of the leaves ranged from 7.18 to 10.38 cm and the widths from 2.37 to 5.47 cm (Figure 6F,G, Table S3). The largest leaves, in terms of length and width, were recorded in the cultivars ‘Grandiflora’ and ‘Kimberly’ (Figure 5 and Figure 6F,G, Table S3). Among the 32 genotypes derived from seeds, genotype 29-5 had the longest leaf, and genotype 51-8 had the widest leaf (Figure 5 and Figure 6F,G, Table S3). On the basis of the results, of the thirty-two genotypes derived from seeds, the one with the overall best morphological traits appears to be genotype 29-5. In addition, genotype 29-5 scored the highest values for flower diameter and weight and petal length, as well as leaf length, desirable commercial traits that make it a potential genotype for cultivation as a pot plant or for ornamental use. Some other genotypes derived from seeds in this study can be exploited for specific uses; for example, genotype 36-6 could be used for the production of miniature potted plants due to its small leaves and flowers, as well as its small canopy size.
Thus far, there are a limited number of reports on the phenotypic evaluation of G. jasminoides. Núñez-Galindo et al. [48] reported that fully opened white gardenia flowers weighed 2.73 g and were 5.85 cm in diameter. In addition, Mousa et al. [49] recorded flower diameters ranging from 4.50 to 7.40 cm and flower weights from 2.06 to 3.31 g in gardenia plants grown in three different growing substrates (peat moss, clay and rice straw), with the highest values for both traits achieved in peat moss. Compared to our findings, both of these previous studies reported lower values for flower diameters, whereas flower weights were higher than those measured for the 32 genotypes we examined. Shahin et al. [50] achieved a flower diameter of more than 4.92 cm only when the foliage of G. jasminoides plants was sprayed with natural leaf extracts of Moringa oleifera, Thymus vulgaris and Marjorana hortensis. The weights of the flowers and the numbers of petals also increased significantly with sprays of these natural extracts compared to control plants [50].

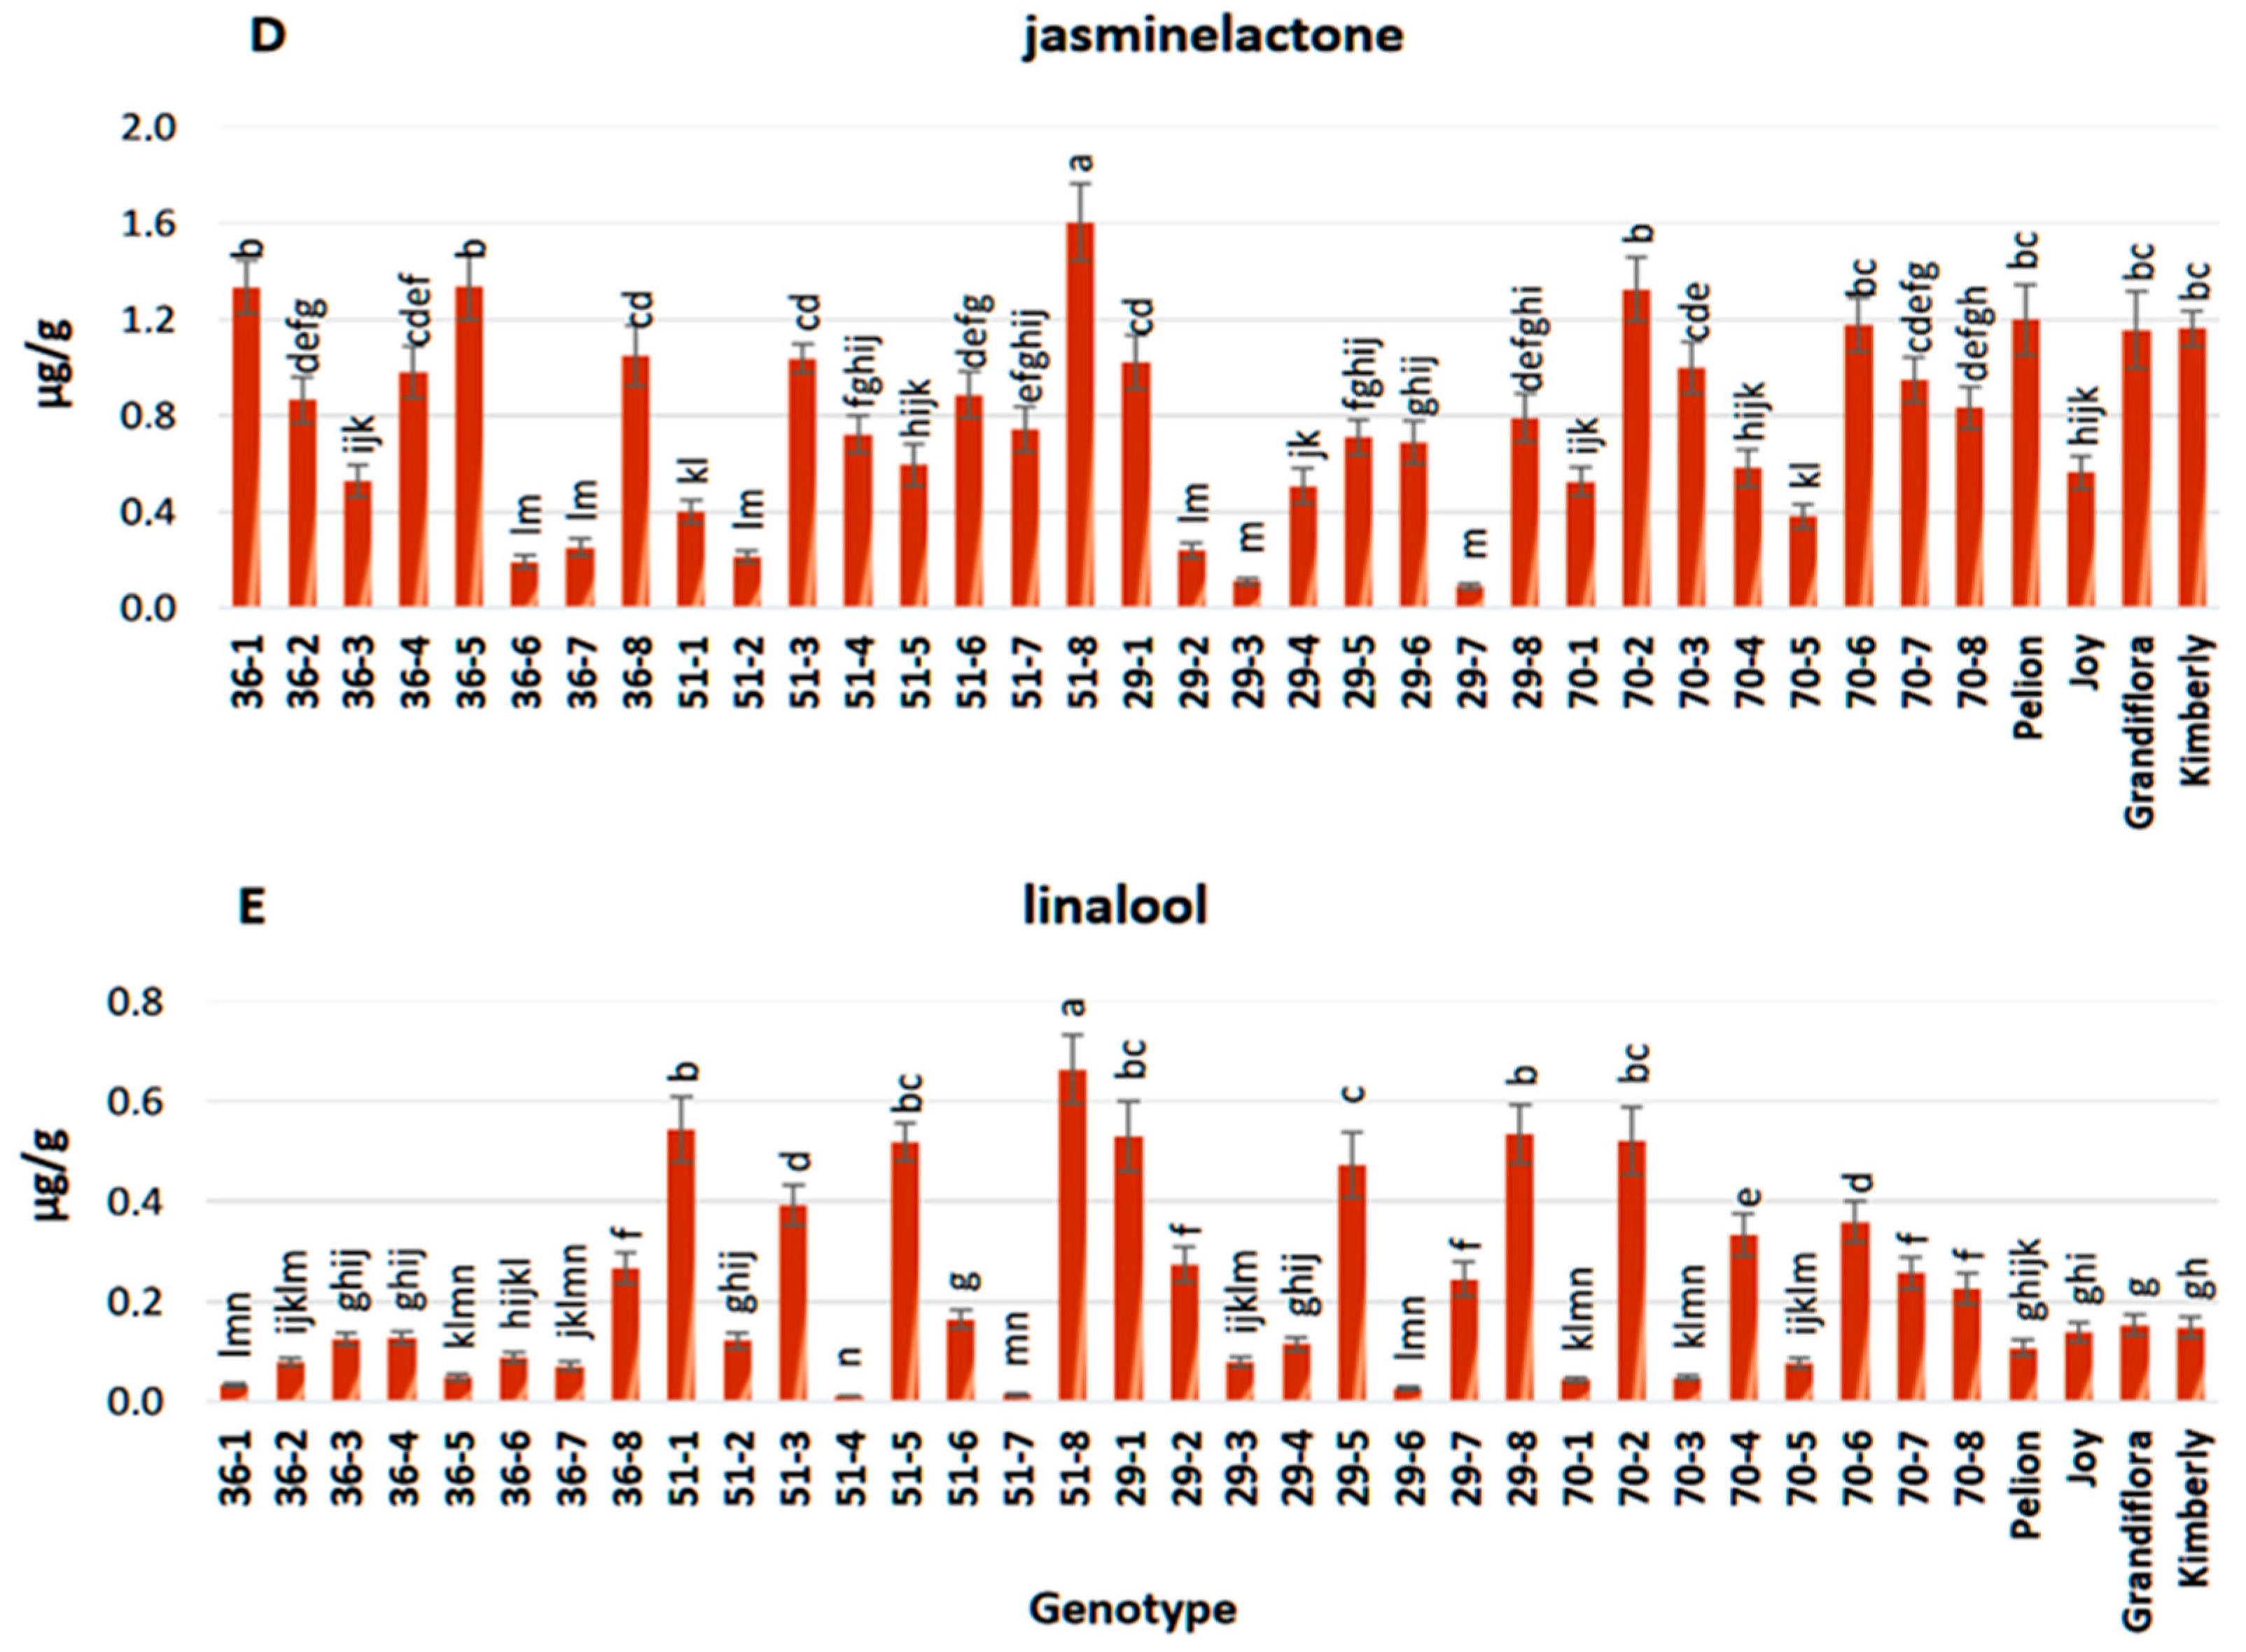
3.3. Chemical Composition of Flower Extracts

A total of 12 compounds were identified in the flower extracts of the thirty-two genotypes derived from seeds of G. jasminoides, as well as the four reference cultivars. The identified volatile compounds were α-farnesene, benzyl benzoate, benzyl tiglate, cis-3-hexenyltiglate, cis-3-hexenyl benzoate, guaiol jasminelactone, linalool, n-heptacosane, n-pentacosane, tetradecane and tricosane. Among them, α-farnesene, benzyl tiglate, cis-3-hexenyltiglate, jasminelactone and linalool were the most abundant. The highest values for the above volatile compounds were recorded in genotype 51-8, which significantly differed from all other genotypes (Figure 7 and Figure 8, Table S4). Sorting them in descending order, jasminelactone accounted for 1.605 μg/g, linalool for 0.664 μg/g, α-farnesene for 0.602 μg/g, benzyl tiglate for 0.321 μg/g and cis-3-hexenyltiglate for 0.182 μg/g (Figure 8, Table S4). The lowest values for cis-3-hexenyltiglate were observed in genotypes 29-7 and 70-1 (Figure 8C, Table S4) and for linalool in genotype 51-4 (Figure 8E, Table S4). Genotype 29-3 scored the lowest values for α-farnesene, benzyl tiglate and jasminelactone (Figure 8A,B,D, Table S4).
The quantification of the aromatic compounds of interest in fragrant flowers (from which flower essential oil is obtained) is directly related to the amount of these compounds contained in the essential oil [47]. Thus, the direct detection and quantification of these compounds in the petals of flowers is a rapid method that can be used in the chemotype determination and easy selection of genotypes that produce aromatic compounds of interest.
Solvent extraction and headspace are, currently, the two methods performed on G. jasminoides flowers to identify the aromatic compounds and characterize the aroma profile. According to Hattori et al. [29], a total of 130 ingredients were identified in the gardenia absolute. Among them, the main ingredients responsible for the sweet fragrance of gardenia were jasminelactone; cis-3-hexenol; its esters such as cis-3-hexenyltiglate and cis-3-hexenylbenzoate; and esters of both cis-3-hexenoic and tiglic acid. In addition to cis-3-hexenyltiglate and cis-3-hexenylbenzoate, Kanlayavattanakul and Lourith [33] reported α-farnesene and indole as the contributors to the floral scent. However, the headspace method performed by Chaichana et al. [32] identified α-farnesene (23.35%), linalool (22.46%), cis-3-hexenyltiglate (15.21%) and trans-beta-ocimene (2.61%) as the main ingredients of gardenia absolute, and the headspace method, applied by Liu and Gao [30], in fresh gardenia flowers detected α-farnesene at a higher concentration (64.86%) and linalool (2.74%) and cis-3-hexenyltiglate (1.34%) at a lower concentration. Ishikawa et al. [31], applying a new headspace method called ‘Aqua-space’, in which humidified air is used as a carrier gas, reported that 4-decanolide, jasminelactone, isoeugenol and linalool were the most important components of gardenia flower aroma.

4. Conclusions

The molecular markers ISSR and SCoT successfully assessed the genetic relationships among the thirty-two seed-derived genotypes and the four cultivars of G. jasminoides by separating them into three clusters: one cluster with the genotypes from Australia, one with the genotypes from the USA and, finally, one with the reference cultivars. In other words, the genetic analysis clearly showed that the 32 genotypes derived from seeds were genetically different from the reference cultivars. In addition, high variability was detected for both the morphological traits and volatile compounds of the flower petal extracts associated with the aroma of gardenia. Regarding the morphological characteristics, genotype 29-5 (derived from ‘Hedge Flower’) had a larger flower diameter, longer leaves and petals and more flower petals than the rest of the genotypes derived from seeds, desirable traits in the flower market that make this genotype a potential germplasm for commercial cultivation as a pot plant through vegetative propagation. In addition, among all of the seed-derived genotypes, genotype 51-8′s (derived from ‘Blanco Arbusto’) flowers had the highest contents of the main volatile compounds associated with gardenia aroma, and, therefore, it could be exploited in the perfumery industry. To confirm these findings, the production of volatile compounds will be compared to that of mother cultivars in a future study. The above-described screening could be applied to a larger number of genotypes to increase the chances of identifying G. jasminoides individuals with even better characteristics.

Supplementary Materials

The following supporting information can be downloaded at https://www.mdpi.com/article/10.3390/agriculture14050650/s1. Table S1: Analysis of molecular variance (AMOVA) of G. jasminoides genotypes; Table S2: Analysis of heterozygosity among G. jasminoides cultivars; Table S3: Mean values (numerical) of seven morphological traits of ornamental interest measured in the 32 seed-derived genotypes and the 4 reference cultivars of G. jasminoides; Table S4: Mean values (numerical) of the major volatile compounds of flower petals identified with GC-MS in the 32 seed-derived genotypes and the 4 reference cultivars of G. jasminoides.

Author Contributions

Conceptualization, S.K., S.H., N.T. and T.L.; Methodology, S.K., V.A., A.-A.K. and E.-N.P.; Software, V.A., A.-A.K., E.-N.P. and S.K.; Validation, V.A., A.-A.K. and E.-N.P.; Formal Analysis, V.A., S.K., S.H. and A.E.; Investigation, V.A., N.T., T.L. and S.K.; Resources, N.T., T.L., S.K., S.H. and E.-N.P.; Data Curation, V.A., A.-A.K., E.-N.P. and A.E.; Writing—Original Draft Preparation, V.A., A.E., S.K., S.H. and E.-N.P.; Writing—Review and Editing, A.E., V.A. and S.K.; Visualization, V.A., A.-A.K. and S.K.; Supervision, S.K., S.H. and A.E.; Project Administration, S.K. and S.H.; Funding Acquisition, S.K., S.H., N.T. and T.L. All authors have read and agreed to the published version of the manuscript.

Funding

This research was funded by “Research-Create-Innovate”, EPANEK, NSRF 2014-2020, with co-financing from European Regional Development Fund of the European Union and Greek national funds through the Operational Program Competitiveness, Entrepreneurship and Innovation, project code: Τ2ΕDΚ-03816 and approval date 12 May 2020.

Institutional Review Board Statement

Not applicable.

Data Availability Statement

The data presented in this study are available upon request from the corresponding authors.

Acknowledgments

The authors would like to thank the anonymous reviewers for their valuable comments and suggestions.

Conflicts of Interest

The author N. Tsalouchos is the owner of the company ‘N. Tsalouchos Nurseries’ and the author T. Labis is the main shareholder of the company ‘Labis Bros. Nurseries’. The remaining authors declare that the research was conducted in the absence of any commercial or financial relationships that could be construed as a potential conflict of interest.

References

  1. Jarvis, C.E.; DuVal, A.; Crane, P.R. GARDENIA JASMINOIDES: A Traditional Chinese Dye Plant Becomes A Garden Ornamental in Europe. Curtis’s Bot. Mag. 2014, 31, 80–98. [Google Scholar] [CrossRef]
  2. Chen, L.; Li, M.; Yang, Z.; Tao, W.; Wang, P.; Tian, X.; Li, X.; Wang, W. Gardenia jasminoides Ellis: Ethnopharmacology, phytochemistry, and pharmacological and industrial applications of an important traditional Chinese medicine. J. Ethnopharmacol. 2020, 257, 112829. [Google Scholar] [CrossRef] [PubMed]
  3. Tsanakas, G.F.; Polidoros, A.; Economou, A. Genetic variation in gardenia grown as pot plant in Greece. Sci. Hortic. 2013, 162, 213–217. [Google Scholar] [CrossRef]
  4. Lim, T.K. Gardenia jasminoides. In Edible Medicinal and Non Medicinal Plants; Lim, T.K., Ed.; Springer: Dordrecht, The Netherlands, 2014; Volume 8, pp. 705–729. [Google Scholar] [CrossRef]
  5. Çelikel, F.G.; Reid, M.S.; Jiang, C.-Z. Postharvest physiology of cut Gardenia jasminoides flowers. Sci. Hortic. 2020, 261, 108983. [Google Scholar] [CrossRef]
  6. Zhao, D.; Wang, R.; Meng, J.; Li, Z.; Wu, Y.; Tao, J. Ameliorative effects of melatonin on dark-induced leaf senescence in gardenia (Gardenia jasminoides Ellis): Leaf morphology, anatomy, physiology and transcriptome. Sci. Rep. 2017, 7, 10423. [Google Scholar] [CrossRef] [PubMed]
  7. Lin, S.; Li, H.; Xian, X.; Lin, X.; Pang, Z.; Liu, J.; He, S. Nano-silver pretreatment delays wilting of cut gardenia foliage by inhibiting bacterial xylem blockage. Sci. Hortic. 2019, 246, 791–796. [Google Scholar] [CrossRef]
  8. Huh, M.-K. Genetic Relationships between Gardenia jasminoides var. radicans and G. jasminoides for. grandiflora Using ISSR Markers. J. Life Sci. 2007, 17, 24–30. [Google Scholar] [CrossRef]
  9. Hatzilazarou, S.; Kostas, S.; Nendou, T.; Economou, A. Conservation, Regeneration and Genetic Stability of Regenerants from Alginate-Encapsulated Shoot Explants of Gardenia jasminoides Ellis. Polymers 2021, 13, 1666. [Google Scholar] [CrossRef] [PubMed]
  10. Wu, Y.; Wu, R.; Zhang, B.; Jiang, T.; Li, N.; Qian, K.; Liu, B.; Zhang, J. Epigenetic instability in genetically stable micropropagated plants of Gardenia jasminoides Ellis. Plant Growth Regul. 2012, 66, 137–143. [Google Scholar] [CrossRef]
  11. Mei, Z.; Khan, M.A.; Yang, L.; Yang, M.; Fu, J. Genetic characterization and authentication of Gardenia jasminoides in different regions of China by using improved RAPD analysis. Ind. J. Exp. Biol. 2015, 53, 164–169. [Google Scholar]
  12. Mei, Z.; Zhou, B.; Wei, C.; Cheng, J.; Imani, S.; Chen, H.; Fu, J. Genetic Authentication of Gardenia jasminoides Ellis var. grandiflora Nakai by Improved RAPD-Derived DNA Markers. Molecules 2015, 20, 20219–20229. [Google Scholar] [CrossRef] [PubMed]
  13. Tyagi, R.; Sharma, V.; Sureja, A.K.; Das Munshi, A.; Arya, L.; Saha, D.; Verma, M. Genetic diversity and population structure detection in sponge gourd (Luffa cylindrica) using ISSR, SCoT and morphological markers. Physiol. Mol. Biol. Plants 2020, 26, 119–131. [Google Scholar] [CrossRef] [PubMed]
  14. Yang, T.W.; Gao, M.R.; Huang, S.Y.; Zhang, S.W.; Zhang, X.J.; Li, T.; Yu, W.H.; Meng, P.; Shi, Q. Genetic Diversity and DNA Fingerprinting of Dendrobium Officinale Based On ISSR and Scot Markers. Appl. Ecol. Environ. Res. 2023, 21, 421–438. [Google Scholar] [CrossRef]
  15. Collard, B.C.Y.; Mackill, D.J. Start Codon Targeted (SCoT) Polymorphism: A Simple, Novel DNA Marker Technique for Generating Gene-Targeted Markers in Plants. Plant Mol. Biol. Rep. 2009, 27, 86–93. [Google Scholar] [CrossRef]
  16. Gorji, A.M.; Poczai, P.; Polgar, Z.; Taller, J. Efficiency of Arbitrarily Amplified Dominant Markers (SCOT, ISSR and RAPD) for Diagnostic Fingerprinting in Tetraploid Potato. Am. J. Potato Res. 2011, 88, 226–237. [Google Scholar] [CrossRef]
  17. Mulpuri, S.; Muddanuru, T.; Francis, G. Start codon targeted (SCoT) polymorphism in toxic and non-toxic accessions of Jatropha curcas L. and development of a codominant SCAR marker. Plant Sci. 2013, 207, 117–127. [Google Scholar] [CrossRef] [PubMed]
  18. Rajesh, M.K.; Sabana, A.A.; Rachana, K.E.; Rahman, S.; Jerard, B.A.; Karun, A. Genetic relationship and diversity among coconut (Cocos nucifera L.) accessions revealed through SCoT analysis. 3 Biotech 2015, 5, 999–1006. [Google Scholar] [CrossRef] [PubMed]
  19. Jalilian, H.; Zarei, A.; Erfani-Moghadam, J. Phylogeny relationship among commercial and wild pear species based on morphological characteristics and SCoT molecular markers. Sci. Hortic. 2018, 235, 323–333. [Google Scholar] [CrossRef]
  20. Etminan, A.; Pour-Aboughadareh, A.; Noori, A.; Ahmadi-Rad, A.; Shooshtari, L.; Mahdavian, Z.; Yousefiazar-Khanian, M. Genetic relationships and diversity among wild Salvia accessions revealed by ISSR and SCoT markers. Biotechnol. Biotechnol. Equip. 2018, 32, 610–617. [Google Scholar] [CrossRef]
  21. Agarwal, A.; Gupta, V.; Haq, S.U.; Jatav, P.K.; Kothari, S.; Kachhwaha, S. Assessment of genetic diversity in 29 rose germplasms using SCoT marker. J. King Saud Univ.-Sci. 2019, 31, 780–788. [Google Scholar] [CrossRef]
  22. Kostas, S.; Kaplani, A.; Koulaouzidou, E.; Kotoula, A.-A.; Gklavakis, E.; Tsoulpha, P.; Hatzilazarou, S.; Nianiou-Obeidat, I.; Kanellis, A.K.; Economou, A. Sustainable Exploitation of Greek Rosmarinus officinalis L. Populations for Ornamental Use through Propagation by Shoot Cuttings and In Vitro Cultures. Sustainability 2022, 14, 4059. [Google Scholar] [CrossRef]
  23. Kostas, S.; Hatzilazarou, S.; Pipinis, E.; Vasileiadis, A.; Magklaras, P.; Smyrnioudis, I.; Vasilakis, T.; Chazakis, M.; Anastasiadi, V.; Ziogou, F.-T.; et al. Propagation of Pistacia lentiscus var. Chia Genotypes and Determination of Their Ornamental Traits Combined with a Genetic Analysis Using ISSR Markers. Agronomy 2021, 11, 205. [Google Scholar] [CrossRef]
  24. Watanabe, N.; Nakajima, R.; Watanabe, S.; Moon, J.-H.; Inagaki, J.; Sakata, K.; Yagi, A.; Ina, K. Linalyl and bornyl disaccharide glycosides from Gardenia jasminoides flowers. Phytochemistry 1994, 37, 457–459. [Google Scholar] [CrossRef] [PubMed]
  25. Ragasa, C.Y.; Pimenta, L.E.N.; Rideout, J.A. Iridoids from Gardenia jasminoides. Nat. Prod. Res. 2007, 21, 1078–1084. [Google Scholar] [CrossRef] [PubMed]
  26. Song, J.-L.; Wang, R.; Shi, Y.-P.; Qi, H.-Y. Iridoids from the flowers of Gardenia jasminoides Ellis and their chemotaxonomic significance. Biochem. Syst. Ecol. 2014, 56, 267–270. [Google Scholar] [CrossRef]
  27. Song, J.-L.; Yang, Y.-J.; Qi, H.-Y.; Li, Q. Chemical constituents from flowers of Gardenia jasminoides. J. Chin. Med. Mat. 2013, 36, 752–755. [Google Scholar]
  28. Yu, R.; Li, Y.; Si, D.; Yan, S.; Liu, J.; Si, J.; Zhang, X. Identification, quantitative and bioactivity analyses of aroma and alcohol-soluble components in flowers of Gardenia jasminoides and its variety during different drying processes. Food Chem. 2023, 420, 135846. [Google Scholar] [CrossRef] [PubMed]
  29. Hattori, R.; Muraki, S.; Yoshida, T. Chemical Composition of the Absolute from Gardenia Flower. Agric. Biol. Chem. 1978, 42, 1351–1356. [Google Scholar] [CrossRef]
  30. Liu, B.Z.; Gao, Y. Analysis of headspace constituents of Gardenia flower by GC/MS with solid-phase microextraction and dynamic headspace sampling. Chin. J. Chromat. 2000, 18, 452–455. [Google Scholar]
  31. Ishikawa, M.; Honda, T.; Fujita, A.; Kurobayashi, Y.; Kitahara, T. “Aqua-space®”, a New Headspace Method for Isolation of Natural Floral Aromas Using Humidified Air as a Carrier Gas. Biosci. Biotechnol. Biochem. 2004, 68, 454–457. [Google Scholar] [CrossRef]
  32. Chaichana, J.; Niwatananun, W.; Vejabhikul, S.; Somna, S.; Chansakaow, S. Volatile constituents and biological activities of Gardenia jasminoides. J. Health Res. 2009, 23, 141–145. [Google Scholar]
  33. Kanlayavattanakul, M.; Lourith, N. Volatile profile and sensory property of Gardenia jasminoides aroma extracts. J. Cosmet. Sci. 2015, 66, 371–377. [Google Scholar]
  34. Zhang, N.; Luo, M.; He, L.; Yao, L. Chemical Composition of Essential Oil from Flower of ‘Shanzhizi’ (Gardenia jasminoides Ellis) and Involvement of Serotonergic System in Its Anxiolytic Effect. Molecules 2020, 25, 4702. [Google Scholar] [CrossRef]
  35. Doyle, J.J.; Doyle, J.L. A rapid DNA isolation procedure for small quantities of fresh leaf tissue. Phytochem. Bull. 1987, 19, 11–15. [Google Scholar]
  36. Tsaktsira, M.; Chavale, E.; Kostas, S.; Pipinis, E.; Tsoulpha, P.; Hatzilazarou, S.; Ziogou, F.-T.; Nianiou-Obeidat, I.; Iliev, I.; Economou, A.; et al. Vegetative Propagation and ISSR-Based Genetic Identification of Genotypes of Ilex aquifolium ‘Agrifoglio Commune’. Sustainability 2021, 13, 10345. [Google Scholar] [CrossRef]
  37. Peakall, R.; Smouse, P.E. GenAlEx 6.5: Genetic analysis in Excel. Population genetic software for teaching and research—An update. Bioinformatics 2012, 28, 2537–2539. [Google Scholar] [CrossRef]
  38. Nei, M. Genetic Distance between Populations. Am. Nat. 1972, 106, 283–292. [Google Scholar] [CrossRef]
  39. Tamura, K.; Dudley, J.; Nei, M.; Kumar, S. MEGA4: Molecular Evolutionary Genetics Analysis (MEGA) Software Version 4.0. Mol. Biol. Evol. 2007, 24, 1596–1599. [Google Scholar] [CrossRef]
  40. Pritchard, J.K.; Wen, X.; Falush, D. Documentation for Structure Software: Version 2.3; University of Chicago: Chicago, IL, USA, 2010; p. 38. [Google Scholar]
  41. Earl, D.A.; vonHoldt, B.M. STRUCTURE HARVESTER: A website and program for visualizing STRUCTURE output and implementing the Evanno method. Conserv. Genet. Resour. 2012, 4, 359–361. [Google Scholar] [CrossRef]
  42. Evanno, G.; Regnaut, S.; Goudet, J. Detecting the number of clusters of individuals using the software structure: A simulation study. Mol. Ecol. 2005, 14, 2611–2620. [Google Scholar] [CrossRef]
  43. Rusanov, K.E.; Kovacheva, N.M.; Atanassov, I.I. Comparative GC/MS Analysis of Rose Flower and Distilled Oil Volatiles of The Oil Bearing Rose Rosa Damascena. Biotechnol. Biotechnol. Equip. 2011, 25, 2210–2216. [Google Scholar] [CrossRef]
  44. Baghizadeh, A.; Dehghan, E. Efficacy of SCoT and ISSR markers in assessment of genetic diversity in some Iranian pistachio (Pistacia vera L.) cultivars. Pist. Health J. 2018, 1, 37–43. [Google Scholar] [CrossRef]
  45. Yilmaz, A.; Ciftci, V. Genetic relationships and diversity analysis in Turkish laurel (Laurus nobilis L.) germplasm using ISSR and SCoT markers. Mol. Biol. Rep. 2021, 48, 4537–4547. [Google Scholar] [CrossRef] [PubMed]
  46. Mansoory, A.; Khademi, O.; Naji, A.M.; Rohollahi, I.; Sepahvand, E. Evaluation of Genetic Diversity in Three Diospyros Species, Collected from Different Regions in Iran, Using ISSR and SCoT Molecular Markers. Int. J. Fruit Sci. 2022, 22, 235–248. [Google Scholar] [CrossRef]
  47. Ziogou, F.-T.; Kotoula, A.-A.; Hatzilazarou, S.; Papadakis, E.-N.; Avramis, P.-G.; Economou, A.; Kostas, S. Genetic Assessment, Propagation and Chemical Analysis of Flowers of Rosa damascena Mill. Genotypes Cultivated in Greece. Horticulturae 2023, 9, 946. [Google Scholar] [CrossRef]
  48. González, J.M.; Galindo, Y.N.; Chávez, M.d.R.C.; Hernández, K.P.B.; Valencia, M.G.; Corredor, J.A.H. Effect of open field crop management on the floral development of gardenia (Gardenia jasminoides Ellis). Agro Prod. 2022, 15, 81–90. [Google Scholar] [CrossRef]
  49. Mousa, G.T.; Abdul-Hafeez, E.Y.; Ibrahim, O.H.M. Response of gardenia plants grown under various growth media and ferrous sulfate application. Pak. J. Agric. Sci. 2015, 52, 651–658. [Google Scholar]
  50. Shahin, S.M.; Khedr, H.M.; Ahmed, M.; Mohamed, R. Effect of some natural extracts on growth and flowering of Gardenia jasminoides J. Ellis plant. Egypt. J. Agric. Res. 2020, 98, 580–589. [Google Scholar] [CrossRef]
Figure 1. Gel electrophoresis pattern of the amplification products of the 32 seed-derived genotypes [36 (1→8), 51 (1→8), 29 (1→8) and 70 (1→8)] of G. jasminoides and the 4 reference cultivars (‘Pelion’, ‘Joy’, ‘Grandiflora’ and ‘Kimberly’) using the primer UBC 834. The sizes of the amplified bands were calculated using a 1 kb DNA ladder (200–3000 bp).
Agriculture 14 00650 g001
Figure 2. Principal coordinate analysis (PCoA) based on combined data from 10 ISSR and 2 SCoT primers for the thirty-two genotypes of G. jasminoides, derived from seeds of the four cultivars (‘Long Lasting’ and ‘Blanco Arbusto’ from the USA and ‘Hedge Flower’ and ‘New Magnifica’ from Australia), and the four reference cultivars (‘Pelion’, ‘Joy’, ‘Grandiflora’ and ‘Kimberly’).
Agriculture 14 00650 g002
Figure 3. UPGMA dendrogram based on Nei’s genetic distance representing the genetic relationships of the 32 seed-derived genotypes [36 (1→8) and 51 (1→8) from the USA and 29 (1→8) and 70 (1→8) from Australia] of G. jasminoides and the 4 reference cultivars (‘Pelion’, ‘Joy’, ‘Grandiflora’ and ‘Kimberly’), generated from the combined data of 10 ISSR and 2 SCoT primers.
Agriculture 14 00650 g003
Figure 4. STRUCTURE analysis of the data of the 32 seed-derived gardenia genotypes and the 4 reference cultivars based on 10 ISSR and 2 SCoT primers, with K = 3 clusters: (A) estimation of the number of populations for K by calculating ΔK values (higher value for ΔK = 3); (Β) each column of the STRUCTURE analysis indicates 1 of the 36 genotypes. In green are the 8 genotypes (36-1→8) from ‘Long Lasting’ and the 8 genotypes (51-1→8) from ‘Blanco Arbusto’ (both from the USA); in red are the 8 genotypes (29-1→8) from ‘Hedge Flower’ and the 8 genotypes (70-1→8) from ‘New Magnifica’ (both from Australia); and in blue are the 4 reference cultivars.
Agriculture 14 00650 g004
Figure 5. Morphological variation in flowers [(a1) G. jasminoides ‘Grandiflora’; (b1) G. jasminoides ‘Pelion’; (c1) G. jasminoides genotype 51-8; (d1) G. jasminoides genotype 29-5] and mature leaves [(a2) G. jasminoides ‘Grandiflora’; (b2) G. jasminoides ‘Pelion’; (c2) G. jasminoides genotype 51-8; (d2) G. jasminoides genotype 29-5] of some G. jasminoides Ellis genotypes used in this study. The black horizontal lines in the images correspond to a length of 1 cm.
Agriculture 14 00650 g005aAgriculture 14 00650 g005b
Figure 6. Mean values of seven morphological traits of ornamental interest [(A) Number of petals, (B) Flower weight (g), (C) Flower diameter (cm), (D) Petal length (cm), (E) Petal width (cm), (F) Leaf length (cm) and (G) Leaf width (cm)] measured in the 32 seed-derived genotypes and the 4 reference cultivars of G. jasminoides. Different letters in the columns, for each of the traits, indicate statistically significant differences among the genotypes, according to Tukey’s multiple comparison test, at p < 0.05. The error bars indicate standard deviation (SD).
Agriculture 14 00650 g006aAgriculture 14 00650 g006bAgriculture 14 00650 g006c
Figure 7. GC-MS chromatogram of flower petal extracts of G. jasminoides genotype 51-8 (using n-hexane solvent).
Agriculture 14 00650 g007
Figure 8. Mean values of the major volatile compounds of flower petals [(A) α-farnesene, (B) benzyl tiglate, (C) cis-3-hexenyltiglate, (D) jasminelactone and (E) linalool (μg/g)] identified with GC-MS in the 32 seed-derived genotypes and the 4 reference cultivars of G. jasminoides. The different letters in the columns, for each of the volatile compounds, indicate statistically significant differences among the genotypes, according to Tukey’s multiple comparison test, at p < 0.05. The error bars indicate the standard deviation (SD).
Agriculture 14 00650 g008aAgriculture 14 00650 g008b
Table 1. ISSR and SCoT primers used in the PCR amplifications.
PrimerSequence (5′→3′)Ta (°C)
UBC 808AGAGAGAGAGAGAGAGC58
UBC 809AGAGAGAGAGAGAGAGG58
UBC 810GAGAGAGAGAGAGAGAT52
UBC 811GAGAGAGAGAGAGAGAC54
UBC 815CTCTCTCTCTCTCTCTG50
UBC 818CACACACACACACACAG56
UBC 821GTGTGTGTGTGTGTGTT56
UBC 834AGAGAGAGAGAGAGAGYT54
UBC 841GAGAGAGAGAGAGAGAYC52
UBC 888CACACACACACACABDB50
SCoT 313ACGACATGGCGACCATCG50
SCoT 333CCATGGCTACCACCGCAG50
Ta: annealing temperature.
Table 2. Presentation of the recorded morphological traits of the 32 seed-derived genotypes and the 4 reference cultivars of G. jasminoides.
Morphological TraitDescription
1. Flower formSingle or double
2. Number of petalsNumber of expanded petals per flower
3. Flower weightIn g, using six replications per genotype
4. Flower diameterIn cm, measured at the widest part of fully opened flowers
5. Petal lengthIn cm, measured from the base of the claw to the tip of the blade
6. Petal widthIn cm, measured at the widest part of the blade
7. Leaf lengthIn cm, measured from the end of the petiole to the top of the lamina
8. Leaf widthIn cm, measured at the widest part of the lamina
Table 3. Genetic parameters based on ISSR and SCoT analyses of the 32 seed-derived genotypes and the 4 reference cultivars of G. jasminoides.
PrimerSize Range (bp)NABNPBPPB (%)
UBC 808 270–850 12 12 100
UBC 809 300–1500 20 20 100
UBC 810 300–1500 21 21 100
UBC 811 200–1350 17 17 100
UBC 815 250–1600 19 19 100
UBC 818 200–1350 20 20 100
UBC 821 380–1350 13 13 100
UBC 834 200–1450 22 22 100
UBC 841 150–1000 18 18 100
UBC 888 200–1250 20 20 100
SCoT 313 200–1500 19 19 100
SCoT 333 450–1700 17 16 94.1
NAB: number of amplified bands; NPB: number of polymorphic bands; PPB: percentage of polymorphic bands.
Disclaimer/Publisher’s Note: The statements, opinions and data contained in all publications are solely those of the individual author(s) and contributor(s) and not of MDPI and/or the editor(s). MDPI and/or the editor(s) disclaim responsibility for any injury to people or property resulting from any ideas, methods, instructions or products referred to in the content.

