
Opportunity of the NEGFRY Decision Support System for the Sustainable Control of Potato Late Blight in A Limia (NW of Spain)

Department of Vegetal Biology and Soil Sciences, Faculty of Sciences, University of Vigo, As Lagoas, 32004 Ourense, Spain
*
Author to whom correspondence should be addressed.
Agriculture 2024, 14(5), 652; https://doi.org/10.3390/agriculture14050652
Submission received: 3 April 2024
/
Revised: 19 April 2024
/
Accepted: 20 April 2024
/
Published: 23 April 2024
(This article belongs to the Section Crop Protection, Diseases, Pests and Weeds)
Abstract
:The NEGFRY system is presented in this research work as a novelty strategy for the control of potato late blight in A Limia (NW Spain). The aim was to analyse the number of fungicide applications established by NEGFRY (Decision Support System, DSS) with respect to the routine calendars of this potato production area. This approach is in accordance with the requirements imposed by European policies, participating in more profitable and environmentally friendly agriculture. For this purpose, the relationships between the pathogen and the environmental conditions and epidemiological parameters were analysed in different plots compared to late blight infection in both Routine and DSS strategies. In addition, economic and environmental impacts of fungicide sprays were also analysed to check the adaptability of the decision support system to late blight in the area. Results confirmed that it is possible to reduce sprays following the NEGFRY model by more than 50% compared with Routine applications. Therefore, NEGFRY is a promising strategy to achieve lower footprint potato yields through a reduction in applied pesticides and water, lower gas emissions and less soil compaction due to a reduction in the number of tractor passes over the soil. The commitment to this strategy contributes to improving the economy of farmers, the health of the biodiversity, the environment and consumers, as well as to comply with demands of global economies in terms of more sustainable and resilient agriculture.
1. Introduction
Potato production has to constantly overcome both abiotic (related to soil fertility, water supply, frost and drought) and biotic (diseases and pests) threats. The latter are responsible for up to 20% of losses in world potato production [1]. Among several fungi affecting this crop, the oomycete Phytophthora infestans (Mont.) de Bary, is the most damaging pathogen to potato crops due to its rapid evolution, adaptability and short epidemic cycle [2]. This pathogen causes potato late blight disease, with consequences such as those that occurred during 1845–1847 (the great Irish famine), a catastrophe that is recognised worldwide [3]. Under favourable weather conditions, P. infestans has the ability to kill the entire canopy of a potato crop in 10–15 days, resulting in yield loss [4]. Annual economic losses of EUR 1000 M have been estimated for 6 Mha of potatoes grown in the EU, mainly caused by late blight disease [5]. Fungicides are the common systems to control the disease and are usually applied weekly during the growing season. Consequently, it makes the potato one of the most heavily sprayed crops in Europe [6,7,8,9,10,11,12]. In some potato producing areas, more than eight pesticide applications are required by growth season for sufficient control, presenting important economic costs [13]. At the same time, this dependence has negative consequences for the environment and jeopardizes the viability of agriculture due to the emergence of genotypes resistant to the active substances used [6,14].
Agriculture in the 21st century will have to produce more food and fibre to feed a growing population adopting more efficient and sustainable production methods and adapt to climate change [15]. Under this objective, is born the “Farm to fork” strategy in the framework of the European Green Pact. This strategy sets the ambitious objective of reducing the use and risk of chemical pesticides, as well as the use of more hazardous pesticides, by 50% by 2030 [16]. If food production systems are not adapted, halving the use of pesticides can result in significant yield reductions [17,18]. In addition, the European Climate Legislation makes achieving the EU climate target of reducing EU emissions by at least 55% by 2030. As part of the “Fit for 55” package, the new standards will increase in sectors such as industry, construction, transport and agriculture with the objective of reducing greenhouse gas emissions at EU level by 2030 from 29% to 40% compared to 2005 [19]. To avoid such repercussions, integrated pest management (IPM) plays a fundamental role in agricultural systems, even more than organic farming. Some experts are pointing out that organic agriculture cannot produce as much food as is demanded, which could generate higher prices, affecting its attractiveness [18].
Within the strategies of integrated pest management, cultivar resistance to late blight could become a more promising way to control disease with minimal use of pesticides [7,10,11,12]. However, variability in cultivar susceptibility ratings reflects the instability of late blight resistance ratings of potato cultivars [6,20]. Potato cultivars with partial resistance to late blight exist, but not full resistance [6]. Furthermore, the resistant cultivars are not grown on a large scale in Europe because other commercially important traits, such as quality, yield and earliness are usually not present in cultivars with late blight resistance [7].
In the context of the increasing cost of fungicides and legal restrictions on the number of sprays, farmers are looking for an opportunity to new agricultural systems focused on sustainable production. Furthermore, the instability of late blight resistance ratings of potato cultivars and the growing demand for their production with fewer chemicals makes it necessary to implement forecast models into Decision Support Systems (DSSs). DSSs employ various types of models (such as statistical, optimisation, simulation or rule-based models) to analyse the decision situation and advise the decision maker. In general, the process of developing a DSS consists of three steps: model development, implementation of the model(s) in a DSS and use of DSS. Although DSSs for pests and disease are new terms, models to predict potato late blight have been developed and used for several decades around the world. One of the first models for predicting potato late blight was the “Dutch rules” model, developed in the Netherlands in the early 19th century by van Everdingen [21] based on cloudiness, dew, precipitation and temperature. It was later modified by Beaumont [22] to successfully predict late blight under conditions in the UK. NEGFRY is another DSS developed in Denmark to successfully predict late blight outbreaks in potato crops [8]. It is currently available to farmers and combines the negative prognosis system [23] and Fry units [24]. These warning systems in the main potato producing countries are currently being implemented, and there is a growing tendency to follow this initiative. A list of these DSSs per European country can be found in the Euroblight [25]. However, Spain is not on the Euroblight list because so far it does not have a proven DSS for late blight control despite the fact that the pathogen has been previously studied and monitored [20,26,27,28,29].
In this context, this research work presents the novelty of applying and evaluating the usefulness of a DSS for the potato late blight control with the minimum application of fungicides and a significant reduction of CO2 emissions and production costs. For this purpose, the relationships between the pathogen and the environmental conditions served as the basis for the climatic model. In addition, different epidemiological parameters were analysed to check if the minimum use of fungicides compared to the traditional application system affected the development of the disease and the final yields. The main aim is therefore to implement a DSS to reduce the use of pesticides and CO2 emissions in agriculture. All this is proposed with the purpose of contributing to more environmentally friendly agriculture and complying with the requirements established by the European Commission.
2. Materials and Methods
2.1. Field Experiments
The experiments were carried out during the potato crop cycles of 2021, 2022 and 2023 in the region of A Limia (NW of Spain). Two potato cultivars were planted in test plots with the following nomenclature: Control (without fungicide application), Routine (with fungicide application every 7–10 days following the tradition of pre-established calendars) and DSS (in which fungicide applications were carried out following the warnings given by NEGFRY system). Two cultivars chosen for this study were selected considering the processing market and fresh preferences in the study area. They were Agria (AG) and Kennebec (KE), respectively. In addition, each of the three plots was replicated three times. Each plot of each cultivar is composed of 4 rows of 0.75 m × 30 m. In the three plots, the same cultural practices and the same applications of insecticides and herbicides were carried out.
2.2. Weather Data Recording
Meteorological data collection was performed with an IMetos autonomous weather station (IMetos®Pessl Instruments, Weiz, Austria) located in the study plot. This weather station is equipped with a system for downloading data from the cloud. It has sensors for temperature (T), relative humidity (RH) and rain. For its operation, it has a solar panel and readings are taken every hour.
2.3. Aerobiological Monitoring
P. infestans sporangia present in the environment crop were trapped with an Burkard aerobiological sampler (Burkard Manufacturing Co Ltd., Rickmansworth, UK). The capture system has a 7-day recorder spore-trap placed at 1.5 m high in the middle of experimental potato plots a week after potato planting. The reference methodology used for the aerobiological counting was that proposed by Galán et al. [30].
2.4. Fungicide Application Schedule: Routine Calendars and Validation of DSS
In two of the three established plots, fungicides for late blight control were applied. In Routine plots, treatments were carried out following the routine of applying treatments every 7–10 days regardless of the level of risk. DSS plots were treated following the NEGFRY model. NEGFRY is a personal computer-based model developed in Denmark [8]. It uses the Negative Prognosis model of Ullrich and Schrödter [23] to forecast risk of late blight outbreak on potato, and the model of Fry et al. [24] to time subsequent fungicide applications during the season. The Negative Prognosis model establishes a coefficient r as a function of temperature ranges within 10 to 23.9 °C, coinciding with relative humidity higher or equal to 90% (during a minimum of four or ten consecutive hours of relative humidity), or rain with values higher or equal to 0.1 mm h−1 [23]. First fungicide application is recommended once accumulated risk values exceed 150 in Ullrich and Schrödter [23] or 160 in Hansen et al. [8]. In this study, the threshold value was set at 150 because an incidence of field disease due to late blight of 0.1% was considered, as recommended in previous studies [23]. After the initial spray, favourable weather for disease development is expressed as blight units according to the method of Fry et al. [24]. This submodel considers weather conditions and the susceptibility of the cultivar. Fungicides were applied when 100 Fry units were accumulated in the moderately susceptible category. The model establishes temperature ranges considering consecutive hours of relative humidity greater than or equal to 90% and according to this number of hours a value of risk units is considered (ranging from 0 to 7) [24].
2.5. Analysis of Epidemiological Parameters
2.5.1. Assessment of Disease Severity
The disease severity data were used to calculate the area under the disease progress curve (AUDPC) using the following equation proposed by Shaner and Finney [31]:
where yi is the percentage of affected tissue at the ith observation, t is the time (days) at the ith observation and n is the total number of observations. To estimate the infection speed and the intensity of the damage caused by late blight in potato cultivars, AUDPC were converted considering duration expressed as number of days (duration) from the first symptoms (1% severity) to the end of the symptoms. The values were expressed following the formula proposed by Fry [32]:
2.5.2. Analysis of Fungicide Use Efficiency and Disease Suppression
Fungicide use efficiency was defined as the percent disease control per application. It was calculated following the methodology of Small et al. [33]:
in which AUDPCi = simulated AUDPC for a spray scheduling method (Routine or DSS), AUDPCcontrol = simulated AUDPC for untreated crop and N = number of fungicide applications scheduled by a method.
To compare the efficacy of DSS-recommended treatment schedules with Routine treatment schedules, the disease suppression due to the treatment was calculated according to methodology of Small et al. [33]. Disease suppression was defined as the reduction in AUDPC due to the fungicide treatment (AUDPCcontrol–AUDPCi), converted to a proportion of the unsprayed control for each cultivar. This proportion is the reduction in disease due to the treatment (disease suppression):
2.5.3. Analysis of Marketable Yield and Economic and Environmental Impact
Potato yields were calculated by taking tubers along a 0.75 m × 30 m furrow. The total number of weighed potatoes corresponded to the total yield. Subsequently, potatoes were calibrated in different sizes and marketable size (40–80 mm) was considered.
Economic impact considering costs of fungicide spray application in both strategies (Routine and DSS) was evaluated. For its calculation, total price of fungicide sprays (Table S1) was divided by marketable potato production in tonnes (EUR t−1). The fuel consumption per tonne of potatoes was calculated considering the average fuel consumption of a 170 hp John Deere tractor, which is about 20 L h−1 when it is applying fungicide. It is estimated that 1 ha is sprayed in 1 h. Several agents causing CO2 emissions were considered: tractor consumption, number of sprays performed per plot, marketable yield, diesel density (850 g m–3) and the average combustion emissions of agricultural diesel set by the Spanish government (at 3160 kg CO2 by t of fuel) [34]. Finally, CO2 emissions were expressed in kg t−1.
2.6. Statistical Treatment
Results of epidemiological parameters about Routine and DSS spray application strategies were compared with control by using an ANOVA and Fisher’s least significant difference test (α = 0.05). Statistical analyses and data handling were carried out with SPSS 21.0 software package for Windows (IBM, Somers, NY, USA).
3. Results
3.1. Weather Conditions during Crop Seasons
Daily weather conditions recorded by crop season are represented in Figure 1. The temperature during crop growing from 2021 ranged from 9.6 to 25.9 °C, with an average temperature of 17.5 °C. The average RH was 80.3% and the minimum RH was 44.7%. The total rain in 2021 was 70 mm in 21 days, which was supplemented by six irrigations from day 36 to 69, which meant a total of 175 mm for the crop. In 2022, the warmest year was recorded, with temperatures between 11.1 °C and 28.2 °C and an average value of 19.4 °C. The average RH and minimum RH were 78.3% and 43%, respectively. A total of 67 mm of rain was recorded in 21 days, with nine irrigations (between days 33 and 96), resulting in 142 mm of water for the crop development.
During the crop cycle of 2023, the average temperature was 18.3 °C, with an average maximum temperature of 26.1 °C and minimum temperature of 10.7 °C. Of the three years studied, this last year was the wettest, with an average RH and minimum RH of 88.5% and 58.2%, respectively. During this cycle, the crop received a total of 300 mm of water, 160 mm from rainwater and 140 mm from irrigation (between days 44 and 78) (Figure 1).
3.2. Sporangia Dispersion, Sub-Optimal Weather Conditions and Fungicide Application Schedule According to Phenological Development of Each Cultivar
P. infestans concentration by growing season was variable, recording 757 sporangia in 2021, 48 sporangia in 2022 and 631 sporangia in 2023. In 2021, the maximum peaks of 78, 64 and 46 sporangia per day occurred on days 15, 16 and 37, respectively. These days coincided with leaf development and flowering initiation in the AG and KE cultivars in the plots of the three strategies tested (Control, Routine and DSS). In this first year, there were 18 days with temperatures above 30 °C and 18 days with RH below 30%. A low number of sporangia (48 sporangia) characterised 2022 during the whole growing season. The maximum peak was recorded on day 23, with a value of 11 sporangia per day. This maximum peak was recorded during leaf development before flowering in three strategies of both cultivars. From day 36 onwards, the concentration decreased until the end of the cycle. This crop cycle had the most days of extreme conditions for pathogen survival: 43 days with maximum temperatures above 30 °C and 35 days with RH below 30%. During the 2023 season, P. infestans reached the value of 631 sporangia, with a higher concentration during the foliar development (in the first 29 days). The maximum peaks were recorded on days 15, 17 and 20, with 99, 82 and 65 sporangia per day, respectively. From day 29 onwards, the concentration decreased. This decrease coincides with the increase in days and with extreme conditions for the pathogen and flowering of the two cultivars in the three strategies tested. During this period, 12 days with temperatures above 30 °C and 11 days with minimum RH below 30% were recorded (Figure 2). The end of senescence was variable in each of the three strategies for the two cultivars, except in 2021. In 2021, AG and KE ended the cycle on 85 DAE, except KE Control, which ended a week earlier. In 2022, the fastest cultivar to finish the cycle was KE Control (78 DAE). Next were KE Routine and DSS, which finished senescence at 90 DAE. The AG cultivar completed senescence at 85, 97 and 106 DAE, according to the control, Routine and DSS, respectively. In 2023, AG completed the cycle between 85 and 106 days, with the control plot being the earliest and the Routine and DSS the latest. In the case of KE, the senescence was completed on 71 DAE in DSS plot and on 78 DAE in Control and Routine.
3.3. Severity of Late Blight in Potato Trials
Late blight disease severity was different in each growing season. In 2021, in general, the severity was higher in the Control plots of the two potato varieties. In the Control plots, achieved severity percentages were similar, with values of 47.5% and 50% at 85 DAE for KE and AG, respectively. For the treated plots (Routine and DSS), the severity value was less than 5% in both potato varieties (Figure 3). In 2022, the low pathogen pressure in the growing environment characterised a low severity in the crop included in the control plots, with no differences with the Routine and DSS plots. The severity did not exceed 1% in the three plots of the two varieties. In 2023, as in 2022, the severity of the Control plots of the two varieties was higher than the treated plots. Of these two varieties, the most resistant were KE, in which the maximum severity observed was 16.7% (at 78 DAE in control plot) compared to 3.7% in DSS and 2.3% in Routine. For AG, the maximum severity was observed in the Control plot (20%), compared to 10% in the DSS plot and 3.3% in the Routine plot (Figure 3). Some significant differences by the Fisher test were detected between the percentages of severity of two potato varieties counted between the study plots in each growing season. In 2021, the values of the Control plot were significantly higher than those detected in the Routine and DSS plots for the two variety. In 2023, the disease percentage counted in the Control plot showed significant differences with Routine and DSS plots for KE. However, during the 2022, the progress of the disease detected in the three plots for the two varieties were similar.
3.4. Epidemiological Parameters
In 2023, onset of the first symptoms was similar in the three strategies tested for both potato varieties. It was also the growing season in which symptoms were observed earliest, at 22 DAE (Table 1). In the 2021 and 2022 growing seasons, the day of first symptoms was variable, but in both years, this day varied by only one week. In 2021, the Control was the first strategy to show symptoms on the 29th day in KE and AG. However, in DSS the first symptoms on 36 DAE were observed. In 2022, in most strategies the first symptoms appeared on 36 DAE, except in KE Routine, which started on 43 DAE.
The infection period of the Control plot was in both varieties higher than Routine and DSS plots, except in 2023 for AG (Table 1). In this case, infection was initiated, but fungicide application controlled the disease and the crop stayed greener and healthier for longer. It is important to note that in 2021, both varieties planted in the Routine plot showed no late blight symptoms and their infection period was 0 days. AG in the Control plot was the variety that remained infected for the longest time (60.7 days) in contrast to AG DSS (49.0 days) and AG Routine (0 days). KE showed a shorter period of infection with 44.3 days in the Control plot and 18.7 days in the DSS plot. In KE, the differences were significant between treated and untreated plots. However, both cultivars showed significant differences in r–AUDPC between Control plots and plots where disease control with fungicides was carried out. No differences in r–AUDPC between the Routine and DSS plots were observed.
According to disease suppression, Routine and DSS strategies showed significant differences in AG, but not in KE (Table 1). However, the effectiveness of fungicide use was greater in DSS (around 30%) than in Routine (around 17%) and in both, the differences were significant (Table 1). In the year 2022, low disease pressure led to a lower disease prevalence in two selected varieties with similar periods of infection among three plots. Disease incidence reached r–AUDPC values 10 times lower than 2021 and there were no significant differences in r–AUDPC among three strategies. Disease suppression was similar for the two potato cultivars even though the DSS plots had fewer sprays. However, it was possible to increase the efficiency of fungicide use in the DSS plot compared to the Routine plot. In the year 2023, the pressure of P. infestans was higher, which led to a higher infection of late blight. The infection period of the KE was similar in the three established plots (Control, Routine and DSS) at around 72–77 days of infestation. In AG, the Control and DSS plots were diseased for around 72–77 days, but the Routine plot was only diseased for 46 days. The r–AUDPC of Routine and DSS was significantly different from Control in both cultivars but not different between Routine and DSS. This confirms that disease suppression was not different between Routine and DSS. However, a higher fungicide use efficiency in DSS plots was observed.
3.5. Marketable Yield and Economic and Environmental Impact
The marketable yields, the costs of fungicides, the litres of fuel used and the CO2 emissions released into the atmosphere per tonne of potatoes harvested are shown in Table 2 and Table S1. In 2021, the loss of marketable yield in AG was slightly higher in Routine than in DSS even though Routine did not show symptoms caused by late blight as DSS did. In the case of KE, the yields of the Routine plot were higher compared to DSS. In 2022, the marketable yields of the DSS plot were higher than the Routine plot (16.0% in AG and 12.6% in KE), despite the fact that late blight damage was similar in both strategies. In 2023, marketable yield suffered greater variation. The AG variety produced more commercial yields in the DSS plot than in the Routine. In contrast, in KE, the plot with the highest production was Routine (more 26.5%).
With respect to spray costs, spray fuel consumption and CO2 spray emissions in the three years studied were always higher in the Routine plot than in the DSS plot due to the greater number of sprays applied (Table 2). Although there were few differences in the yields calculated per plot (Routine and DSS) (except in year 2023 for the AG variety), the reduction in spray, fuel, tractor passes and emissions were notable in the DSS plot compared to the Routine plot.
4. Discussion
Late blight management has relied heavily on numerous fungicide applications. Many farmers choose to treat their potato crops consistently due to multiple reasons. Among them are the cost of fungicides, the lack of knowledge about behaviour of pathogen, the low confidence in success of new measures, the lack of adequate tools to control it and the introduction of new or more aggressive genotypes of the pathogen [6,7,8,14,33,35,36,37,38]. However, there is a global concern to reduce pesticide use. The European Commission adopted the “Farm to Fork” strategy and “Fit for 55” package with the objective of reducing pesticide use and greenhouse gas emissions in the EU [19]. Therefore, new technologies are important to move from traditional agriculture towards resilient and sustainable agricultural systems. The aim is to build a fair, healthy and environmentally friendly agricultural food system, which is indispensable to maintain food production and food security in the long term.
The results of this study demonstrated that the use of a DSS in A Limia could be a novel strategy to replace pre-established calendars for late blight control and reduce the use of pesticides. In the three seasons of trials to test the feasibility of NEGFRY for late blight control, it has been possible to reduce the number of treatments by up to 56% (following DSS advice) compared to treatments carried out every 7–10 days. Similar results were published by Dowley and Burke [39], in which comparing routine control with NEGFRY, SimPhyt, ProPhy and Plant–Plus programmes resulted in a 58–44% reduction in application frequency for the first two DSSs and more modest savings of 10–25% for the next two. During the course of this experiment, the leaf blight control measured by r–AUDPC achieved with the Routine and DSS programmes did not show significant differences. This confirms that there was no loss of foliar blight control following the use of decision support systems. Similar results were concluded by Dowley and Burke [39], in which they compared the efficacy of various DSSs (NEGFRY, Simphyt, ProPhy and Plant–Plus) with the 7-day routine treatment. Another study was successful in reducing sprays compared to routine schedules (25% to 50%) using the Førsund’s rules and the NEGFRY model for late blight control [9]. Furthermore, these researchers concluded that there was less foliar infection using the NEGFRY model, although they did not find statistically significant differences with the Førsund rules [9]. The modified Irish Rules model in Ireland made it possible to reduce fungicide usage by 58.7% on average, compared with current standard practices used by growers and without adversely compromising disease control and yield [40]. BlightPro DSS also recommended fewer fungicide applications (35% less than the usual calendar), but could not reduce late blight infection [33]. The Wallin model combined with NEGFRY managed to reduce the presence of potato late blight in Brazil and reduce the number of fungicide applications by 17% compared to the 7–10 days calendar [38]. In contrast, BLITECAST and Simcast models recommended a larger number of fungicide applications [38].
In the A Limia area, KE and AG are varieties protected by the quality label Protected Geographical Indication PGI Pataca de Galicia. Although there is no interest in replacing these varieties by others with greater resistance to late blight, it could be confirmed that the natural resistance of cultivars to late blight can be a promising way to minimise the application and improve efficiency use of fungicides in potato crop. The response of KE was different to AG under the same environmental conditions and late blight disease pressure. These cultivars accumulated different r–AUDPC values and therefore differences were obtained in the fungicide use efficacy. Although there were no significant differences in disease suppression of the three strategies applied for KE and AG, in the effectiveness of the use of fungicides for the KE variety they were found. These observations confirmed the positive combination of a DSS with resistant varieties (whenever possible). The AG variety is more profitable to produce using the DSS than the KE, since commercial yields are higher in the DSS plots. In addition, fungicide costs and emissions are considerably reduced compared to the Routine plot. In KE variety, yields were more variable between DSS and Routine plots, since it is a variety more sensitive to late blight. In any case, the expenses per t were lower in the DSS plot than in the Routine plot and the CO2 emissions released per t were considerably reduced when using the DSS strategy. Therefore, it can be an interesting strategy for the best use of fungicides in IPM strategies, as reported by Small et al. [33], Kessel et al. [11], Kapsa et al. [10] and Abuley and Hansen [6].
The weakness of the original DSS is its adjustment to the environmental conditions of the application area. Hermansen and Amundsen [9] showed promising results for late blight control by combining at least two DSSs, timing the first application according to the negative forecast of NEGFRY and the subsequent application according to Førsund’s rules. The results of the present study showed that the DSS continued to predict late blight risk in A Limia in July and August, despite unfavourable environmental conditions for late blight, low concentration of air sporangia recorded and first symptoms. However, NEGFRY successfully predicted the first treatment (two of the three seasons) coinciding with an increase in the number of sporangia. During the 2023 growing season, the DSS recommended the first application when slight symptoms of late blight in the field were observed. On another occasion, the model continued to accumulate risk units, giving 2–3 unnecessary warnings until the crop senesced (specifically, 36 DAE in 2021 and 58 DAE in 2023). Similar conclusions were found in Brazil; the DSS tested recommended between four and eight unnecessary applications [38]. According to the literature, the main cause is the high temperatures during the day combined with dry conditions and lack of rainfall. It is generally accepted that there is no disease progress at temperatures above 28–29 °C [28,37,41]. Temperatures above 30 °C slow or stop the growth of the fungus in the field, but do not kill it; the fungus can start sporulating again when the temperature becomes favourable and RH is sufficiently high [37]. A 30-minute exposure to dry weather with RH between 50% and 60% causes the cessation of sporangial activity, and if this dry weather continues, disease development will be limited. However, the disease can still develop if the crop canopy is sufficiently developed to generate a microclimate that allows sporulation and germination [42]. In present study, the 2022 crop season was a very hot year, with many days with meteorological conditions unfavourable for late blight. These unfavourable days were counted a week after the emergence of the crop, coinciding with a crop cycle with little presence of sporangia in the environment. Consequently, during the 2022 season, NEGFRY proposed three alerts. In this sense, meteorological conditions play a determining role in late blight epidemics during a crop cycle. Hence the importance of environmental condition monitoring during the development of the disease [20,26,38,43].
Another proposal to improve the precision of the DSS for late blight could be to incorporate information on the aerial dispersal of sporangia [20,26,28,44,45]. Although sporangium concentration generally had an impact on late blight severity, the most notable effect of sporangia was the accumulation of sporangia from the previous week with the observed severity of the current week. In fact, late blight has an incubation period of 3–5 days under field conditions [20]. This fact can help to predict both on days favourable for disease development and on days unfavourable (when fungicide treatments are not necessary). This information would be useful to avoid unnecessary fungicide sprays at the end of the crop season, when generally, the weather is unfavourable and the inoculum load in the environment is low.
5. Conclusions
NEGFRY is presented as a novel alternative to pre-established schedules to reduce the number of fungicide treatments, the consumption of fuel and released CO2 emissions into the atmosphere in A Limia (NW Spain). It was possible to verify for the first time that the application of this DSS was able to reduce the number of fungicide treatments by more than 50%, without the disease undergoing variation with the Routine strategy. It is also one of the best strategies to meet the demands of global economies and the demands of consumers in terms of more sustainable and resilient agriculture. If these models are applied to potato cultivars with a high resistance to late blight, the effectiveness of the use of fungicides will increase. However, the DSS applied in the studied area presented weakness in the results. NEGFRY proposed unnecessary alerts, with unfavourable conditions for the development of the disease and without or a very low presence of P. infestans in the crop environment. Therefore, to increase the precision of the model it is necessary to incorporate a greater number of growing seasons and adjust it to the particular environmental conditions of the geographical area. At the same time, the inclusion of the concentration of the pathogen in the crop environment and the unfavourable conditions for the development of the disease would improve the prediction of the first attacks of late blight.
Supplementary Materials
The following supporting information can be downloaded at https://www.mdpi.com/article/10.3390/agriculture14050652/s1, Table S1: Date of fungicide application, type and costs performed on two treated strategies (Routine and DSS) in three crop seasons (2021, 2022 and 2023).
Author Contributions
Conceptualisation, L.M., O.E. and M.C.S.; Formal analysis, L.M. and O.E.; Investigation, L.M.; Data curation, L.M.; Writing—original draft preparation, L.M.; Writing—review and editing, L.M., O.E. and M.C.S.; Supervision, O.E. and M.C.S.; Project administration, M.C.S.; Funding acquisition, M.C.S. All authors have read and agreed to the published version of the manuscript.
Funding
The study was funded by the European Commission Horizon 2020 program through the SoildiverAgro–project (grant agreement 817819). Funding for open access charge: Universidade de Vigo/CISUG.
Institutional Review Board Statement
Not applicable.
Data Availability Statement
The datasets that were generated in and/or analysed in the current study are available from the corresponding authors on reasonable request.
Acknowledgments
The authors would like to express their gratitude to the Centro de Desenvolvemento Agrogandeiro INORDE de Xinzo de Limia and especially to Servando Álvarez Pousa for his help in the field experiments.
Conflicts of Interest
The authors declare no conflicts of interest.
References
- Savary, S.; Willocquet, L.; Pethybridge, S.J.; Esker, P.; McRoberts, N.; Nelson, A. The global burden of pathogens and pests on major food crops. Nat. Ecol. Evol. 2019, 3, 430–439. [Google Scholar] [CrossRef] [PubMed]
- Leesutthiphonchai, W.; Vu, A.L.; Ah-Fong, A.M.V.; Judelson, H.S. How Does Phytophthora infestans Evade Control Efforts? Modern Insight into the Late Blight Disease. Phytopathology 2018, 108, 916–924. [Google Scholar] [CrossRef] [PubMed]
- Zadoks, J. The potato murrain on the European continent and the revolutions of 1848. Potato Res. 2008, 51, 5–45. [Google Scholar] [CrossRef]
- Rakotonindraina, T.; Chauvin, J.É.; Pellé, R.; Faivre, R.; Chatot, C.; Savary, S.; Aubertot, J.N. Modeling of yield losses caused by potato late blight on eight cultivars with different levels of resistance to Phytophthora infestans. Plant Dis. 2012, 96, 935–942. [Google Scholar] [CrossRef] [PubMed]
- Haverkort, A.; Boonekamp, P.; Hutten, R.; Jacobsen, E.; Lotz, L.; Kessel, G.; Visser, R.; Van der Vossen, E. Societal costs of late blight in potato and prospects of durable resistance through cisgenic modification. Potato Res. 2008, 51, 47–57. [Google Scholar] [CrossRef]
- Abuley, I.K.; Hansen, J.G. Characterization of the level and type of resistance of potato varieties to late blight (Phytophthora infestans). Phytopathology 2022, 112, 1917–1927. [Google Scholar] [CrossRef]
- Cooke, L.; Schepers, H.; Hermansen, A.; Bain, R.; Bradshaw, N.; Ritchie, F.; Shaw, D.; Evenhuis, A.; Kessel, G.; Wander, J. Epidemiology and integrated control of potato late blight in Europe. Potato Res. 2011, 54, 183–222. [Google Scholar] [CrossRef]
- Hansen, J.G.; Andersson, B.; Hermansen, A. NEGFRY—A system for scheduling chemical control of late blight in potatoes. In Proceedings PHYTOPHTHORA 150 Sesquicentennial Scientific Conference; Dowley, L.J., Cooke, L.R., Keane, T., O’Sullivan, E., Eds.; Boole Press Ltd.: Dublin, Ireland, 1995; pp. 201–208. [Google Scholar]
- Hermansen, A.; Amundsen, T. Evaluation of old potato late blight forecasting rules during 1994–1999 in fields with the new Phytophthora infestans population in Norway. Acta Agric. Scand Sect. B–Plant Soil Sci. 2003, 53, 118–128. [Google Scholar] [CrossRef]
- Kapsa, J.; Osowski, J.; Bernat, E. NegFry–decision support system for late blight control in potato crops–results of validation trials in North Poland. J. Plant Prot. Res. 2003, 43, 171–179. [Google Scholar]
- Kessel, G.J.T.; Mullins, E.; Evenhuis, A.; Stellingwerf, J.; Cortes, V.O.; Phelan, S.; van den Bosch, T.; Förch, M.G.; Goedhart, P.; van der Voet, H.; et al. Development and validation of IPM strategies for the cultivation of cisgenically modified late blight resistant potato. Eur. J. Agron. 2018, 96, 146–155. [Google Scholar] [CrossRef]
- Ritchie, F.; Bain, R.A.; Lees, A.K.; Boor, T.R.W.; Paveley, N.D. Integrated control of potato late blight: Predicting the combined efficacy of host resistance and fungicides. Plant Pathol. 2018, 67, 1784–1791. [Google Scholar] [CrossRef]
- Naumann, M.; Koch, M.; Thiel, H.; Gransee, A.; Pawelzik, E. The Importance of Nutrient Management for Potato Production Part II: Plant Nutrition and Tuber Quality. Potato Res. 2020, 63, 121–137. [Google Scholar] [CrossRef]
- Schepers, H.; Hausladen, H.; Hansen, J.; Nielsen, B.; Abuley, I.; Andersson, B.; Liljeroth, E.; Edin, E.; Bain, R.; Ritchie, F. Epidemics and control of early & late blight, 2015 & 2016 in Europe. In Proceedings of the 16th EuroBlight Workshop, Aarhus, Denmark, 1 May 2017; PPO–Special Report. pp. 11–32. [Google Scholar]
- FAO. High Level Expert Forum–How to Feed the World in 2050. 2009. Available online: https://www.fao.org/fileadmin/templates/wsfs/docs/Issues_papers/HLEF2050_Global_Agriculture.pdf (accessed on 12 December 2023).
- European Comission. Farm to Fork Strategy. 2020. Available online: https://food.ec.europa.eu/system/files/2020-05/f2f_action-plan_2020_strategy-info_en.pdf (accessed on 17 November 2023).
- Barreiro Hurle, J.; Bogonos, M.; Himics, M.; Hristov, J.; Perez Dominguez, I.; Sahoo, A.; Salputra, G.; Weiss, F.; Baldoni, E.; Elleby, C. Modelling Environmental and Climate Ambition in the Agricultural Sector with the CAPRI Model. 2021. Available online: https://publications.jrc.ec.europa.eu/repository/handle/JRC121368 (accessed on 2 December 2023).
- Bremmer, J.; Martinez, A.G.; Jongeneel, R.; Huiting, H.; Stokkers, R. Impact Assessment Study on ec 2030 Green Deal Targets for Sustainable Food Production: Effects of Farm to Fork and Biodiversity Strategy 2030 at Farm, National and eu Level; Wageningen Economic Research. 2021. Available online: https://research.wur.nl/en/publications/impact-assessment-study-on-ec-2030-green-deal-targets-for-sustain (accessed on 23 November 2023).
- European Council. Green Deal–Fit for 55. 2023. Available online: https://www.consilium.europa.eu/en/policies/green–deal/fit–for–55–the–eu–plan–for–a–green–transition/ (accessed on 23 November 2023).
- Meno, L.; Abuley, I.; Escuredo, O.; Seijo, M.C. Factors influencing the airborne sporangia concentration of Phytophthora infestans and its relationship with potato disease severity. Sci. Hortic. 2023, 307, 111520. [Google Scholar] [CrossRef]
- Van Everdingen, E. Het verband tusschen de weersgesteldheid en de aardappelziekte (Phytophthora infestans). Tijdschr. Over Plantenziekten 1926, 32, 129–139. [Google Scholar] [CrossRef]
- Beaumont, A. The dependence on the weather of the dates of outbreak of potato blight epidemics. Trans. Br. Mycol. Soc. 1947, 31, 45–53. [Google Scholar] [CrossRef]
- Ullrich, J.; Schrödter, H. Das Problem der Vorhersage des Auftretens der Kartoffelkrautfäule (Phytophthora infestans) und die Möglichkeit seiner Lösung durch eine “Negativprognose”. Nachrichtenblatt Deutsch. Pflanzenschutzdienst 1966, 18, 33–40. [Google Scholar]
- Fry, W.; Apple, A.; Bruhn, J. Evaluation of potato late blight forecasts modified to incorporate host resistance and fungicide weathering. Phytopathology 1983, 73, 1054–1059. [Google Scholar] [CrossRef]
- Euroblight. Euroblight Web Site. 2023. Available online: https://agro.au.dk/forskning/internationale-platforme/euroblight (accessed on 7 November 2023).
- Escuredo, O.; Seijo–Rodríguez, A.; Rodríguez–Flores, M.S.; Seijo, M.C. Decision support systems for detecting aerial potato Phytophthora infestans sporangia in northwestern Spain. Agron. J. 2019, 111, 354–361. [Google Scholar] [CrossRef]
- Seijo–Rodríguez, A.; Escuredo, O.; Rodríguez–Flores, M.; Seijo, M.C. Improving the use of aerobiological and phenoclimatological data to forecast the risk of late blight in a potato crop. Aerobiologia 2018, 34, 315–324. [Google Scholar] [CrossRef]
- Iglesias, I.; Escuredo, O.; Seijo, M.C.; Méndez, J. Phytophthora infestans prediction for a potato crop. Am. J. Potato Res. 2010, 87, 32–40. [Google Scholar] [CrossRef]
- Meno, L.; Escuredo, O.; Abuley, I.K.; Seijo, M.C. Predicting daily aerobiological risk level of potato late blight using C5. 0 and random forest algorithms under field conditions. Sensors 2023, 23, 3818. [Google Scholar] [CrossRef] [PubMed]
- Galán, S.C.; González, P.C.; Teno, P.A.; Vilches, E.D. Manual de Calidad y Gestión de la Red Española de Aerobiología; Universidad de Córdoba: Córdoba, Spain, 2007; p. 39. [Google Scholar]
- Shaner, G. The Effect of Nitrogen Fertilization on the Expression of Slow–Mildewing Resistance in Knox Wheat. Phytopathology 1977, 77, 1051. [Google Scholar] [CrossRef]
- Fry, W. Quantification of general resistance of potato cultivars and fungicide effects for integrated control of potato late blight. Phytopathology 1978, 68, 1650–1655. [Google Scholar] [CrossRef]
- Small, I.M.; Joseph, L.; Fry, W.E. Development and implementation of the BlightPro decision support system for potato and tomato late blight management. Comput. Electron. Agric. 2015, 115, 57–65. [Google Scholar] [CrossRef]
- Miteco. Sistema Español de Inventario de Emisiones–Metodologías de Estimación de Emisiones. 2017. Available online: https://www.miteco.gob.es/content/dam/miteco/es/calidad–y–evaluacion–ambiental/temas/sistema–espanol–de–inventario–sei–/08060708–maquinaria–movil_tcm30–456063.pdf (accessed on 12 November 2023).
- Gaucher, D.; Dubois, L.; Chatot, C. Mileos®, the French Potato Late Blight DSS: Continuous improvement over the past decade. In Proceedings of the Fourteenth Euroblight Workshop, Limassol, Cyprus, 12–15 May 2013; PPO–Special Report. Volume 16, pp. 209–210. [Google Scholar]
- Sharma, S.; Lal, M. Advances in Management of Late Blight of Potato. In Sustainable Management of Potato Pests and Diseases; Chakrabarti, S.K., Sharma, S., Shah, M.A., Eds.; Springer: Singapore, 2022; pp. 163–184. [Google Scholar]
- Tsedaley, B. Late blight of potato (Phytophthora infestans) biology, economic importance and its management approaches. J. Biol. Agric. Healthc. 2014, 4, 215–225. [Google Scholar]
- Batista, D.C.; Lima, M.A.; Haddad, F.; Maffia, L.A.; Mizubuti, E.S.G. Validation of decision support systems for tomato early blight and potato late blight, under Brazilian conditions. Crop Prot. 2006, 25, 664–670. [Google Scholar] [CrossRef]
- Dowley, L.J.; Burke, J.J. Field validation of four decision support systems for the control of late blight of potatoes in Ireland. Potato Res. 2004, 47, 151–162. [Google Scholar] [CrossRef]
- Cucak, M.; de Andrade Moral, R.; Fealy, R.; Lambkin, K.; Kildea, S. Opportunities for improved potato late blight management in the republic of Ireland: Field Evaluation of the Modified Irish Rules Crop Disease Risk Prediction Model. Phytopathology 2021, 111, 1349–1360. [Google Scholar] [CrossRef] [PubMed]
- Singh, B.; Sharma, S. Forecasting of potato late blight. Int. J. Innov. Hortic. 2013, 2, 1–11. [Google Scholar]
- Smith, I.M.; Dunez, J.; Phillips, D. Manual de Enfermedades de las Plantas; Ediciones Mundi-Prensa: Madrid, Spain, 1992; p. 671. [Google Scholar]
- Meno, L.; Seijo, M.C.; Rodríguez–Flores, M.S.; Escuredo, O. Impact of climate change on potato early and late blight occurrence in A Limia (NW Spain). In The Potato Crop: Management, Production, and Food Security; Villa, P., Ed.; Nova Science Publishers Inc.: New York, NY, USA, 2021; pp. 123–142. [Google Scholar]
- Aylor, D.E.; Fry, W.E.; Mayton, H.; Andrade–Piedra, J.L. Quantifying the rate of release and escape of Phytophthora infestans sporangia from a potato canopy. Phytopathology 2001, 91, 1189–1196. [Google Scholar] [CrossRef]
- Fall, M.; Van der Heyden, H.; Brodeur, L.; Leclerc, Y.; Moreau, G.; Carisse, O. Spatiotemporal variation in airborne sporangia of Phytophthora infestans: Characterization and initiatives towards improving potato late blight risk estimation. Plant Pathol. 2015, 64, 178–190. [Google Scholar] [CrossRef]
Figure 1.
Daily weather conditions during three crop seasons (2021, 2022 and 2023). The black arrow represents the amount of water supplied on days when sprinkler irrigation was applied. DAE: days after of emergence.
Figure 1.
Daily weather conditions during three crop seasons (2021, 2022 and 2023). The black arrow represents the amount of water supplied on days when sprinkler irrigation was applied. DAE: days after of emergence.
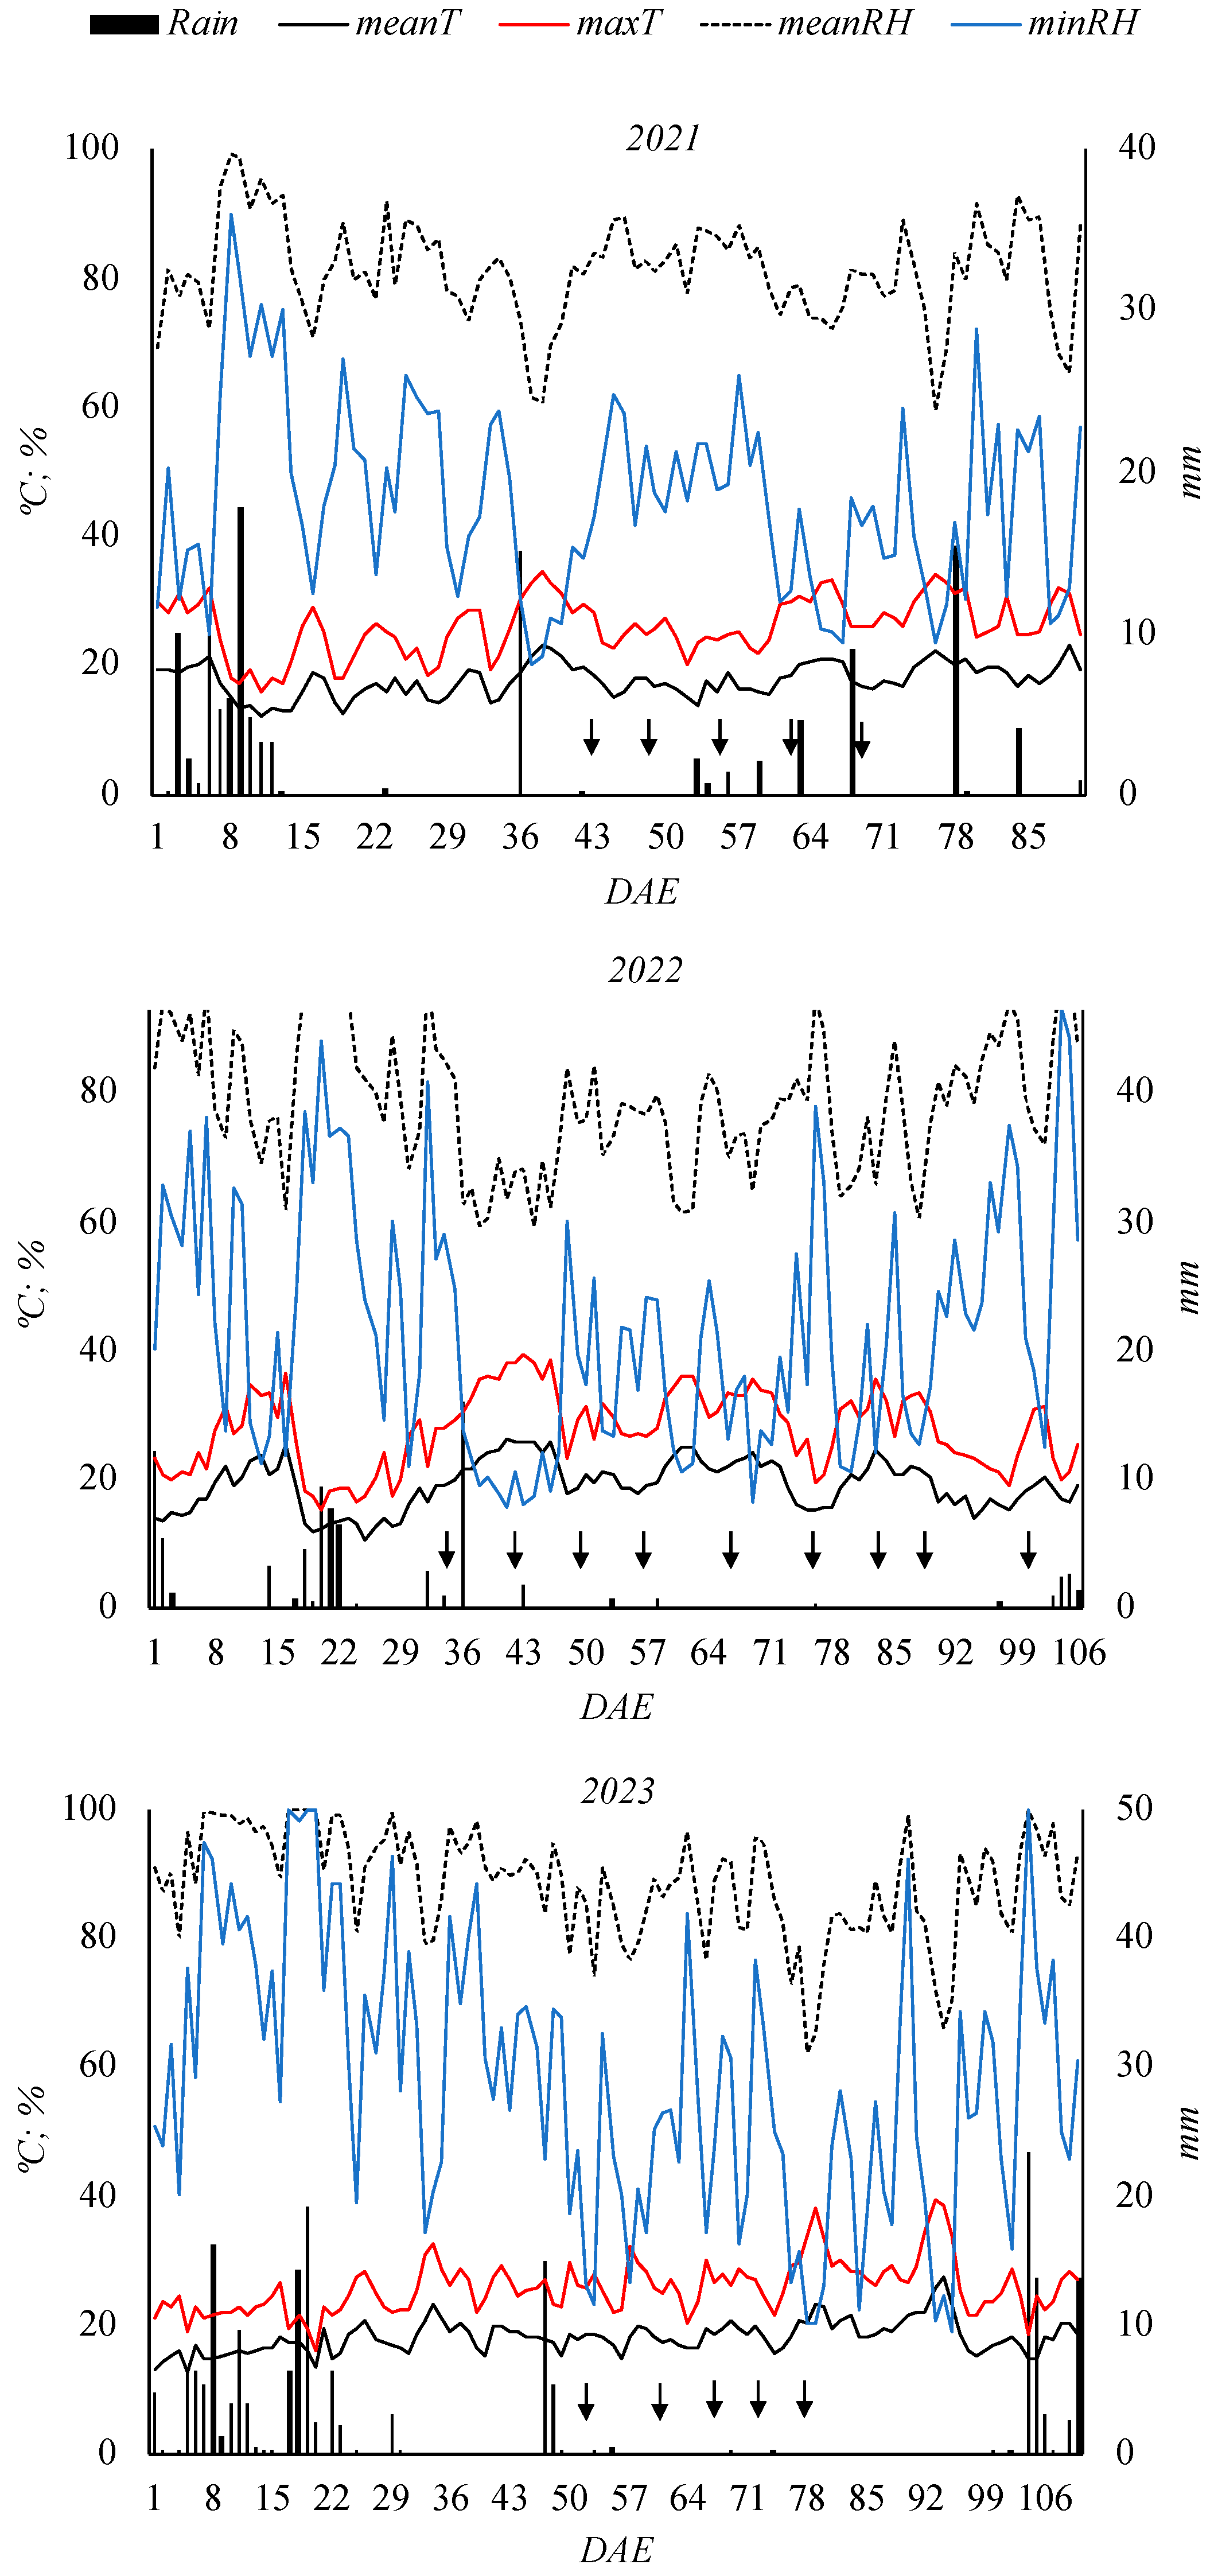
Figure 2.
Sporangia concentration, fungicide applications according to two strategies (Routine and DSS) and unfavourable weather conditions for P. infestans. The symbols represent the strategies followed for fungicide application: black triangles represent applications every 7–10 days (Routine) and black symbol represents applications according to DSS. DSV: disease severity values; DAE: days after of emergence.

Figure 3.
Disease progression of late blight of Agria (AG) and Kennebec (KE) cultivars according to three fungicide application strategies (Control, Routine and DSS) in the three crop seasons.
Figure 3.
Disease progression of late blight of Agria (AG) and Kennebec (KE) cultivars according to three fungicide application strategies (Control, Routine and DSS) in the three crop seasons.


Table 1.
Summary of epidemiological parameters measured in Agria (AG) and Kennebec (KE) cultivars according to fungicide application strategies (Control, Routine and DSS) during the three growing seasons (2021, 2022 and 2023). Different letters show significant differences between the three strategies according to the Fisher’s least significant difference test (α = 0.05). The dash (–) refers to the fact that there was no value.
| AG | KE | |||||
|---|---|---|---|---|---|---|
| 2021 | Control | Routine | DSS | Control | Routine | DSS |
| First symptoms (DAE) | 29 | – | 36 | 29 | – | 36 |
| Period of infection (days) | 60.7 a | 0 b | 49.0 a | 44.3 a | 0 b | 18.7 b |
| r–AUDPC | 0.145 a | 0 b | 0.013 b | 0.108 a | 0 b | 0.003 b |
| Fungicide use efficiency (%) | – | 16.7 a | 31.4 b | – | 16.7 a | 32.8 b |
| Disease suppression | – | 1.0 a | 0.94 b | – | 1.0 a | 0.98 a |
| 2022 | ||||||
| First symptoms (DAE) | 36 | 36 | 36 | 36 | 43 | 36 |
| Period of infection (days) | 53.7 a | 44.3 a | 39.7 a | 30.3 a | 23.3 a | 25.7 a |
| r–AUDPC | 0.011 a | 0.011 a | 0.011 a | 0.011 a | 0.012 a | 0.011 a |
| Fungicide use efficiency (%) | – | 2.8 a | 9.2 a | – | 4.3 a | 8.1 a |
| Disease suppression | – | 0.2 a | 0.27 a | – | 0.30 a | 0.24 a |
| 2023 | ||||||
| First symptoms (DAE) | 22 | 22 | 22 | 22 | 22 | 22 |
| Period of infection (days) | 72.3 a | 46.7 b | 77.0 a | 77.0 a | 72.3 a | 77.0 a |
| r–AUDPC | 0.178 a | 0.031 b | 0.088 b | 0.120 a | 0.022 b | 0.033 b |
| Fungicide use efficiency (%) | – | 9.3 a | 12.6 a | – | 9.8 a | 20.4 b |
| Disease suppression | – | 0.84 a | 0.51 a | – | 0.88 a | 0.82 a |
Table 2.
Marketable yields, spray costs and fuel consumption and CO2 spray emissions according to both strategies (Routine and DSS) for Agria (AG) and Kennebec (KE) during the three crop seasons (2021, 2022 and 2023). DSS–Routine (%): expresses the increase generated in percentage between the Routine and DSS plots.
| AG | KE | |||||
|---|---|---|---|---|---|---|
| 2021 | Routine | DSS | DSS–Routine (%) | Routine | DSS | DSS–Routine (%) |
| Marketable yield (t ha−1) | 44.6 | 46.2 | 3.5 | 37.6 | 33.6 | 10.6 |
| Spray costs (EUR t−1) | 6.7 | 2.7 | 59.7 | 7.9 | 3.7 | 53.16 |
| Tractor passes (number) | 6 | 3 | 50.0 | 6 | 3 | 50.0 |
| Spray fuel consumption (L t−1) | 2.7 | 1.3 | 51.9 | 3.2 | 1.8 | 43.8 |
| CO2 spray emissions (kg CO2 t−1) | 7.0 | 3.4 | 51.4 | 8.3 | 4.7 | 43.4 |
| 2022 | ||||||
| Marketable yield (t ha−1) | 31.8 | 37.9 | 16.1 | 22.2 | 25.4 | 12.6 |
| Spray costs (EUR t−1) | 12.8 | 4.7 | 63.3 | 17.3 | 7.03 | 59.4 |
| Tractor passes (number) | 7 | 3 | 57.1 | 7 | 3 | 57.1 |
| Spray fuel consumption (L t−1) | 4.4 | 1.6 | 63.6 | 6.3 | 2.4 | 61.9 |
| CO2 spray emissions (kg CO2 t−1) | 11.4 | 4.1 | 64.0 | 16.4 | 6.1 | 62.8 |
| 2023 | ||||||
| Marketable yield (t ha−1) | 26.2 | 38.1 | 31.2 | 27.9 | 20.5 | 26.5 |
| Spray costs (EUR t−1) | 21.8 | 7.6 | 65.1 | 20.5 | 14.0 | 31.7 |
| Tractor passes (number) | 9 | 4 | 55.6 | 9 | 4 | 55.6 |
| Spray fuel consumption (L t−1) | 6.9 | 2.1 | 69.6 | 6.5 | 3.9 | 40.0 |
| CO2 spray emissions (kg CO2 t−1) | 17.9 | 5.5 | 69.3 | 16.8 | 10.1 | 39.9 |
Disclaimer/Publisher’s Note: The statements, opinions and data contained in all publications are solely those of the individual author(s) and contributor(s) and not of MDPI and/or the editor(s). MDPI and/or the editor(s) disclaim responsibility for any injury to people or property resulting from any ideas, methods, instructions or products referred to in the content. |
© 2024 by the authors. Licensee MDPI, Basel, Switzerland. This article is an open access article distributed under the terms and conditions of the Creative Commons Attribution (CC BY) license (https://creativecommons.org/licenses/by/4.0/).
Share and Cite
MDPI and ACS Style
Meno, L.; Escuredo, O.; Seijo, M.C. Opportunity of the NEGFRY Decision Support System for the Sustainable Control of Potato Late Blight in A Limia (NW of Spain). Agriculture 2024, 14, 652. https://doi.org/10.3390/agriculture14050652
AMA Style
Meno L, Escuredo O, Seijo MC. Opportunity of the NEGFRY Decision Support System for the Sustainable Control of Potato Late Blight in A Limia (NW of Spain). Agriculture. 2024; 14(5):652. https://doi.org/10.3390/agriculture14050652
Chicago/Turabian StyleMeno, Laura, Olga Escuredo, and M. Carmen Seijo. 2024. "Opportunity of the NEGFRY Decision Support System for the Sustainable Control of Potato Late Blight in A Limia (NW of Spain)" Agriculture 14, no. 5: 652. https://doi.org/10.3390/agriculture14050652
Note that from the first issue of 2016, this journal uses article numbers instead of page numbers. See further details here.