
Optimizing Efficiency of Tea Harvester Leaf-Collection Pipeline: Numerical Simulation and Experimental Validation
1
College of Agricultural Equipment Engineering, Henan University of Science and Technology, Luoyang 471003, China
2
Science & Technology Innovation Center for Completed Set Equipment, Longmen Laboratory, Luoyang 471000, China
3
Library, Henan University of Science and Technology, Luoyang 471003, China
*
Author to whom correspondence should be addressed.
Agriculture 2024, 14(5), 653; https://doi.org/10.3390/agriculture14050653
Submission received: 17 March 2024
/
Revised: 21 April 2024
/
Accepted: 22 April 2024
/
Published: 23 April 2024
(This article belongs to the Special Issue Smart Mechanization and Automation in Agriculture)
Abstract
:To address the challenges of missed and disorderly picking in tea harvesters, this study focused on the leaf-collection pipeline and utilized Fluent simulation 19.0 software. A single-factor test identified key parameters affecting airflow velocity. An orthogonal test evaluated the main pipe taper, number of branch pipes, and branch pipe outlet diameter, with average outlet wind speed and wind speed non-uniformity as indicators. The optimal parameters were a main pipe taper of 25.5 mm, 10 branch pipes, and an inner diameter of 17.10 mm for the outlet, resulting in 10.73 m/s average wind speed and 8.24% non-uniformity. Validation tests showed errors under 1%. Further optimization on the internal structure’s extension length led to 11.02 m/s average wind speed and 8.04% non-uniformity. Field experiments demonstrated a 3.40% stalk leakage rate and 90.36% bud leaf integrity rate; the optimized structure of the leaf-collecting pipeline significantly improved the uniformity of airflow and the picking efficiency. These findings offer valuable insights and practical benefits for enhancing the efficiency of tea harvesters.
1. Introduction
China, the foremost tea producer, boasts a lengthy tradition of tea cultivation and harvesting. Tea harvesting encompasses two primary methods: manual and mechanical picking. Mechanical picking is advantageous for reducing labor expenses and physical demands, thereby increasing the efficiency of the harvest [1]. Tea cultivation is markedly influenced by seasonality and timeliness, making timely harvesting crucial [2]. Delayed picking can compromise tea quality [3,4] and significantly restrict the development of the tea industry. The optimal flow rate of the branch outlet within the leaf-collection pipe is a crucial element of the tea-plucking machinery. Maintaining this flow rate is vital to guarantee the successful extraction of fresh tea leaves, facilitating efficient and high-quality harvesting practices. Optimizing this component can significantly boost the productivity and competitive edge of tea production, aligning with industry demands for efficiency and quality.
Addressing the identified challenges, scholars worldwide have undertaken research to analyze the internal flow field of air outlet components using CFD simulations, achieving noteworthy results [5,6]. Weng et al. [7] investigated the leaf-collection process of a ride-on tea harvester using a coupled CFD-DEM simulation method, focusing on different inlet wind speeds, fresh leaf particle sizes, and elbow tube structures. Lei et al. [8] analyzed the impact of seed delivery pipe parameters (diameter, length, transverse-to-longitudinal length ratio, and joint type) on seed movement and airflow through a combined simulation methodology. Notably, a seed delivery pipe length of 1.0 m resulted in minimal seed velocity and outlet pressure loss. Chen et al. [9] established the airflow velocity distribution within the blowing mechanism of a yellow clover harvester at varying fan speeds, focusing on airflow characteristics in the main pipe, branch ducts, and distances from the air outlet. Li et al. [10] designed an air-assisted cutting table featuring a duckbill nozzle for optimal residual-free cutting and simplified machine maintenance. Wen et al. [11] created a model to make uniform the outlet air velocity of a collector leaf mechanism and optimized its parameters using the Box–Behnken design theory. Liu et al. [12] conducted a numerical study on the gas–solid flow in a conveyor using a coupled CFD and DEM method, focusing on how contraction and diffusion angles affect the airflow field and seed motion. Li et al. [13] used EDEM-Fluent to measure the metering speed of the airflow seed metering system. Endalew et al. [14,15] examined the airflow fields generated by three different fan combinations experimentally and numerically, comparing their effects on canopy wind speeds. Wu et al. [16] analyzed the performance of an axial fan through numerical simulation, determining that pressure loss is minimized when the inlet velocity ranges from 25–55 m/s and the diffusion angle is either 4.5° or 5.5°. Hong et al. [17] deeply studied the horizontal velocity distribution of multi-duct orchard sprayer nozzles at different heights. Lu et al. [18] simulated the flow of peanut pods in the pipe with the Euler multiphase flow model and predicted the conveying efficiency. From the current research status of flow field simulation, the spatial distribution of airflow field and the influence law of airflow velocity could be found by a fluid numerical simulation. The unreasonable design of the collecting pipeline structure on a tea harvester will cause the non-uniformity of the wind speed at the outlet of each branch pipe and reduce the collection efficiency.
This study investigated the distribution patterns of the internal and external structures of a leaf-collection pipe using the Fluent simulation method. The study also explored the impact of a leading pipe taper, the number of branch pipes, and the inner diameter of the branch pipe outlet on the average outlet wind speed and wind speed variability. Numerical simulations were conducted to analyze the flow field within the collector duct, optimizing the parameters to identify the most effective combination and extension length of the internal pipe structure. These findings offer a theoretical foundation for enhancing the leaf-collection pipeline device in tea-picking machines.
2. Materials and Methods
2.1. Overall Structure and Working Principle of Tea Harvester
The tea harvester comprised several key components: a plucking mechanism, a leaf-collection mechanism, and a walking mechanism (Figure 1). The cutter and the leaf-collecting pipeline were fixed on the rack independently, and were controlled by a petrol engine and DC motor, respectively. The motor power was set to 500 W with a rated voltage of 24 V, while the power supply was chosen to be a 24 V lithium battery. The leaf-collecting pipeline was placed directly above the cutter. At the same time, the telescopic devices adjusted the horizontal and vertical distances between the leaf-collecting pipeline and the cutter. The telescopic device kept the cutting mechanism in the optimum picking height. The machine was controlled by the operator using buttons on the control box, while the direction of advancement of the machine was controlled by the operator using the handles.
During operation, the device initially employed a motor to power the fan, facilitating airflow transmission through the main pipe to each airflow branch pipe. The eccentric wheel structure drove the blades to reciprocate, which received the power output of the gasoline engine through the soft shaft. Subsequently, the airflow from multiple branch tubes bent the tea stalks, guiding the cut leaves to be wind-blown into the leaf-collection bags, thereby effectively ensuring the quality of tea picking. The leaf-collecting pipeline ducting for the tea harvester comprised a main pipe and branch pipe, with the air inlet having an outer diameter of 53 mm at the larger end and being connected to the fan outlet. Modifications were made to the closed sections of the pipeline to maintain uniform wind speed. The total length of the leaf-collecting pipeline in the initial model was 617 mm, with eight branch pipes spaced 77 mm apart on the main pipe. The design of the leaf-collecting pipe’s three-dimensional model was created using SolidWorks 2019 software, and Fluent simulation software was employed for numerical simulation, as depicted in Figure 2.
2.2. Boundary Conditions and Solution Parameter Settings
The subdivided mesh was imported into Fluent for numerical simulation and analysis. As shown in Figure 3, the total mesh size was 134,988, and the meshing met the requirements. The inlet boundary condition of the model was set to a pressure inlet boundary condition using Gambit, with a relative pressure of 0. The outlet boundary condition was defined as a pressure outlet boundary condition. The wall surface was assigned a no-slip wall boundary condition. Turbulence intensity and hydraulic diameter were set at 5% and 53 mm, respectively, based on the Reynolds number Re > 2300. The turbulence model was selected as RNG k-epsilon [19], utilizing the standard wall function.
Considering the low-speed, steady-state, and viscous characteristics of the airflow, a pressure-based segregated implicit solver was selected to solve the problem. The second-order upwind discretization method was employed to enhance computational accuracy and reduce numerical diffusion. The SIMPLEC algorithm was chosen for pressure–velocity coupling. For velocity and pressure computations, the PRESTO! scheme was utilized, ensuring precise pressure field representation. The second-order upwind scheme was also applied across all governing equations. The convergence accuracy for the k and ε equations was set to 10−3, while for the remaining equations, it was set to 10−4 [20,21].
2.3. Determination of Factors Affecting the Structure of the Leaf-Collecting Pipeline
2.3.1. External Structural Design
- (1)
- Main pipe taper
Wang et al. [22] conducted an optimization study on the design of the blowing pipeline for the oilseed rape harvester. While the inner diameter of the inlet end of the main air duct remained constant at 96 mm, the researchers compared various inner diameters at the opposite end (small end). The study revealed that the airflow velocity distribution was most uniform, with an inner diameter of 48 mm at the small end. This research embarked on an optimized external structural design with a diameter taper ratio of 2:1. Altering the taper of the airflow main pipe from the original model, which had an inner diameter of 50 mm at the inlet end, iterations were made with inner diameters of 16, 19, 22, 25, 28, 31, and 34 mm at the opposite end to analyze the airflow characteristics.
- (2)
- Number of branches pipes
Previous research indicated that the quantity of branch pipes plays a significant role in influencing the airflow direction and velocity within the leaf-collecting pipe of the tea harvester [23]. This study explored various configurations of branch pipe quantities to enhance the consistency of air velocity emanating from each branch pipe outlet. This study selected seven sets of data comprising 4, 6, 8, 10, 12, 14, and 16 branch pipes for analysis and comparison.
- (3)
- Inner diameter of branch pipe outlet
In this study, pipeline gases were treated as incompressible fluids. When such fluids flow steadily at a constant rate, the flow rate through each pipeline cross-section remains constant.
where V is the pipeline flow rate (m/s), A is the cross-sectional area of the pipeline (m2), and Q is the flow rate through which a fluid flows at a specific time (m/s).
According to Equation (1), maintaining a constant flow rate can result in variations in airflow velocity due to alterations in the cross-sectional area of the collector duct. To enhance the uniformity of airflow velocity across each branch, adjustments should be made to the inner diameter of the branch outlet [24]. Therefore, the inner diameter of the branch outlet was selected as 15.5, 16.0, 16.5, 17.0, 17.5, 18.0, and 18.5 mm.
2.3.2. Internal Structural Design
The internal lengths of the collector pipe branches were extended following the optimization of the external structure to enhance the uniform air velocity distribution within the leaf-collecting pipe. Extending the branch lengths contributes to maintaining consistent gas velocities across various cross-sections [25]. This study selected extension lengths of 1.1, 1.3, 1.5, 1.7, and 1.9 mm for the internal branches of the collector pipe, constrained by the large end diameter of the 53 mm pipeline.
2.3.3. Test Indicators
This study introduced the velocity deviation ratio C, a metric to gauge wind speed uniformity across the branches of the leaf-collecting pipe. Additionally, wind speed non-uniformity E was utilized to quantify the variation in airflow velocity at the outlets of each branch pipe, serving as an indicator to assess the velocity distribution uniformity at these outlets [26,27,28]. The E of the wind speed at the outlet of the collecting pipeline was used as an index to measure the change degree of the air velocity at the outlet of each branch pipe. The increase in E value indicated that the non-uniformity of the air velocity distribution in each branch pipe increased and the consistency of wind speed at the outlet of each branch pipe decreased. The decrease in the E value indicated that the airflow velocity distribution of each branch pipe was more consistent and the consistency of wind speed at the outlet of each branch pipe of the collector pipeline was improved. Furthermore, the average outlet wind speed V represents the mean velocity value at the outlets of the airflow branch pipes.
where n is the number of airflow branches, Vi is the velocity at the outlet of each airflow branch (m/s), and V is the average velocity at the outlet of the airflow branch (m/s).
3. Results and Analysis
3.1. External Structural Parameters
3.1.1. Single-Factor Test
- (1)
- Effect of main pipe taper on each indicator
The main pipe featured eight branches with a branch outlet inner diameter of 16 mm and it tapered at seven levels. Each test set was repeated three times, and the averaged results are presented in Figure 4.
Figure 4 illustrates that, as the main pipe taper increased, the average outlet wind speed initially decreased and then increased. Additionally, the non-uniformity of wind speed followed a pattern of initial increase and subsequent decrease with the main pipe taper. A small diameter in the main pipe taper increased pressure within the leaf-collecting pipe wall, causing instability in the outlet air velocity of the branch pipe and resulting in uneven air velocity at the outlet. Consequently, when the main pipe taper reached 31 mm, there was a gradual upward trend in the average outlet wind speed, reducing the non-uniformity of the wind speed. Based on this observation, the main pipe taper range of 19–31 mm was selected as the test level for the response surface analysis.
- (2)
- Effect of number of branch pipes on each indicator
The main pipe tapered at 25 mm, with a branch outlet inner diameter of 16 mm, and it included seven levels of branching. Each test set was repeated three times, and the averaged results are presented in Figure 5.
As illustrated in Figure 5, the average outlet wind speed and non-uniformity exhibited a pattern of initial increase, subsequent decrease, and gradual increase with the growing number of branch pipes. Variations in the number of branch pipes significantly affected wind speed. Increasing the number of branches reduced the spacing between them. Turbulent fluid movement within the pipe resulted in mutual collisions between masses, generating vortices and contributing to non-uniformity. When there were few branch pipes, the spacing between them increased, causing the inlet air velocity to enter the main pipe and the outlet air velocity to decrease. Therefore, based on these findings, the suitable range of branch numbers for the response surface test was determined to be 6–14.
- (3)
- Effect of inner diameter of branch pipe outlet on each indicator
The main pipe tapered at 25 mm with eight branches, while the inner diameter of the branch outlet varied across seven levels. Each test set was repeated three times, and the averaged results are presented in Figure 6.
Figure 6 demonstrates that, with a constant inner diameter of the branch pipe outlet, the average outlet wind speed initially increased, then decreased, and subsequently rose again. The non-uniformity of wind speed first decreased and then increased with the inner diameter of the branch pipe outlet. The larger inner diameter of the branch pipe outlet induced alterations in the pipeline’s flow field when the inlet wind speed shifted from the main pipe to the branch pipe, leading to adjustments in the outlet wind speed of each branch pipe. As the distance from the fan to the branch pipe increased, the air volume progressively diminished, resulting in notable disparities in wind speed at each branch pipe outlet. Consequently, the optimal range for the inner diameter of the branch outlet was determined to be 16–18 mm for the response surface test.
3.1.2. Experimental Scheme and Results
Orthogonal testing methods were utilized to optimize parameter combinations [29,30]. The experimental factors included the taper of the main pipe (A), the number of branch pipes (B), and the inner diameter of the outlet of the branch pipe (C). The evaluation criteria comprised the average outlet wind speed (Y1) and wind speed homogeneity (Y2). A total of 23 experimental sets were conducted, each replicated thrice, and the mean values of the test outcomes were recorded. A single-factor experiment was conducted to establish the level range for each factor. The experimental factors and their corresponding level codes are detailed in Table 1; Table 2 presents the experimental design and results. X1, X2, and X3 are the coded values of factors A, B, and C.
Using Design-Expert software 8.0.6, a multiple regression analysis was performed on the experimental data. The quadratic model for the average outlet wind speed and wind speed non-uniformity was significant (p < 0.0001). The regression coefficients underwent an F-value test at a 0.05 confidence level. After discarding the insignificant terms, a simplified regression equation was derived:
The variance analysis for the average outlet wind speed, as depicted in Table 3, revealed that the model was extremely significant with p < 0.0001, affirming the validity of the regression equation. The lack-of-fit term, with p > 0.05, was insignificant, indicating a good fit of the model to the experimental data. The key factors in the study, including the main pipe taper, number of branch pipes, and branch outlet inner diameter, exhibited highly significant effects within the model. The interaction factor X1X2 was significant, while X1X3 and X2X3 were deemed insignificant. Additionally, the quadratic factors X12, X22, and X32 showed extreme significance. From the analysis presented in Table 3, the factors influencing the average outlet wind speed were ranked in order of importance as main pipe taper (X1), number of branch pipes (X3), and branch pipe outlet inner diameter (X2).
An analysis of variance was conducted on the wind speed non-uniformity, and the results are shown in Table 4. The model p < 0.0001 indicated that the regression equation was extremely significant; p > 0.05 indicated that the lack-of-fit term was insignificant. Among them, the primary term factors, which were the number of branch pipes and branch outlet inner diameter, had extremely significant effects on the model. Among the interaction factors, X1X2 and X1X3 were extremely significant, while X2X3 was significant; the quadratic factor X12X22X32 was extremely significant. From the analysis presented in Table 4, the factors influencing the wind speed non-uniformity were ranked in order of importance as number of branch pipes (X2), the inner diameter of branch pipe outlet (X3), main pipe taper (X1).
3.1.3. Effect of Interactions on Average Outlet Wind Speeds
Figure 7 illustrates the relationship between various factors and the average outlet wind speed. In Figure 7a, a constant main pipe taper shows that the average outlet wind speed rose and fell as the number of branch pipes increased. Figure 7b displays a relatively gentle response surface slope, indicating that when the main pipe taper was fixed, increasing the branch pipe outlet’s inner diameter from 16.5 mm to 17.5 mm caused the average outlet wind speed to increase and decrease. Figure 7c features a steeper response surface slope, highlighting the significant impact of the interaction between the branch pipe outlet’s inner diameter and the number of branch pipes on the average outlet wind speed. With a constant inner diameter at the branch pipe outlet, an increase in the number of branch pipes led to an initial rise and subsequent gradual decrease in average outlet wind speed.
3.1.4. Effect of Interactions on Wind Speed Non-Uniformity
The relationship between each factor and wind speed non-uniformity is illustrated in Figure 8. Figure 8a shows a relatively small response surface slope in the interaction between the number of branch pipes and the main pipe taper. As the main pipe taper increased, wind speed non-uniformity gradually rose. Concurrently, the non-uniformity tended to decrease and then increase with the number of branch pipes, hitting a minimum when the number was around 10. As shown in Figure 8b, the slope of the response surface was relatively gentle. As the inner diameter of the branch pipe outlet and the main pipe’s taper increased, the wind speed’s non-uniformity gradually increased and then decreased. The interaction between these two factors had a minor impact on wind speed non-uniformity. With a larger main pipe taper, wind speed non-uniformity decreased as the branch pipe outlet’s inner diameter increased. Conversely, with a smaller main pipe taper diameter, non-uniformity increased with the inner diameter of the branch pipe outlet. As shown in Figure 8c, the slope of the response surface was relatively large, indicating that the interaction between the inner diameter of the branch pipe outlet and the number of branch pipes significantly impacted the non-uniformity of wind speed. When the inner diameter of the branch pipe outlet remained constant, the non-uniformity of wind speed increased with an increase in the number of branch pipes. Similarly, when the number of branch pipes was constant, the average outlet wind speed initially increased and then decreased with an increase in the main pipe taper.
3.1.5. Parameter Optimization
The analysis of the response surface above revealed the significant interactive effect of the main pipe taper, the number of branch pipes, and the inner diameter of the branch pipe outlet on both the average outlet wind speed and non-uniformity. The Design-Expert software was employed for optimization and resolution purposes, with the average outlet wind speed and non-uniformity weights assigned values of 0.6 and 0.4, respectively. This assignment defined the objective function as max y1, min y2.
After rounding optimization, the optimal combination was determined: the main pipe taper at 25.5 mm, with 10 branch pipes and an inner diameter of the branch pipe outlet at 17.10 mm. This configuration resulted in an average outlet wind speed of 10.73 m/s and a wind speed non-uniformity of 8.24%. Prior to optimization, the average outlet wind speed stood at 9.30 m/s, with a wind speed non-uniformity of 12.77%. After optimization, the maximum deviation ratio of branch pipe wind speed decreased from 22.47% to 10.43%. Figure 9 displays the cloud map of the flow field within the external structure of the leaf-collecting pipeline before and after optimization. The improvements are evident, showing a 12.04% reduction in the maximum velocity deviation ratio and a 4.53% decrease in wind speed non-uniformity compared to the initial model.
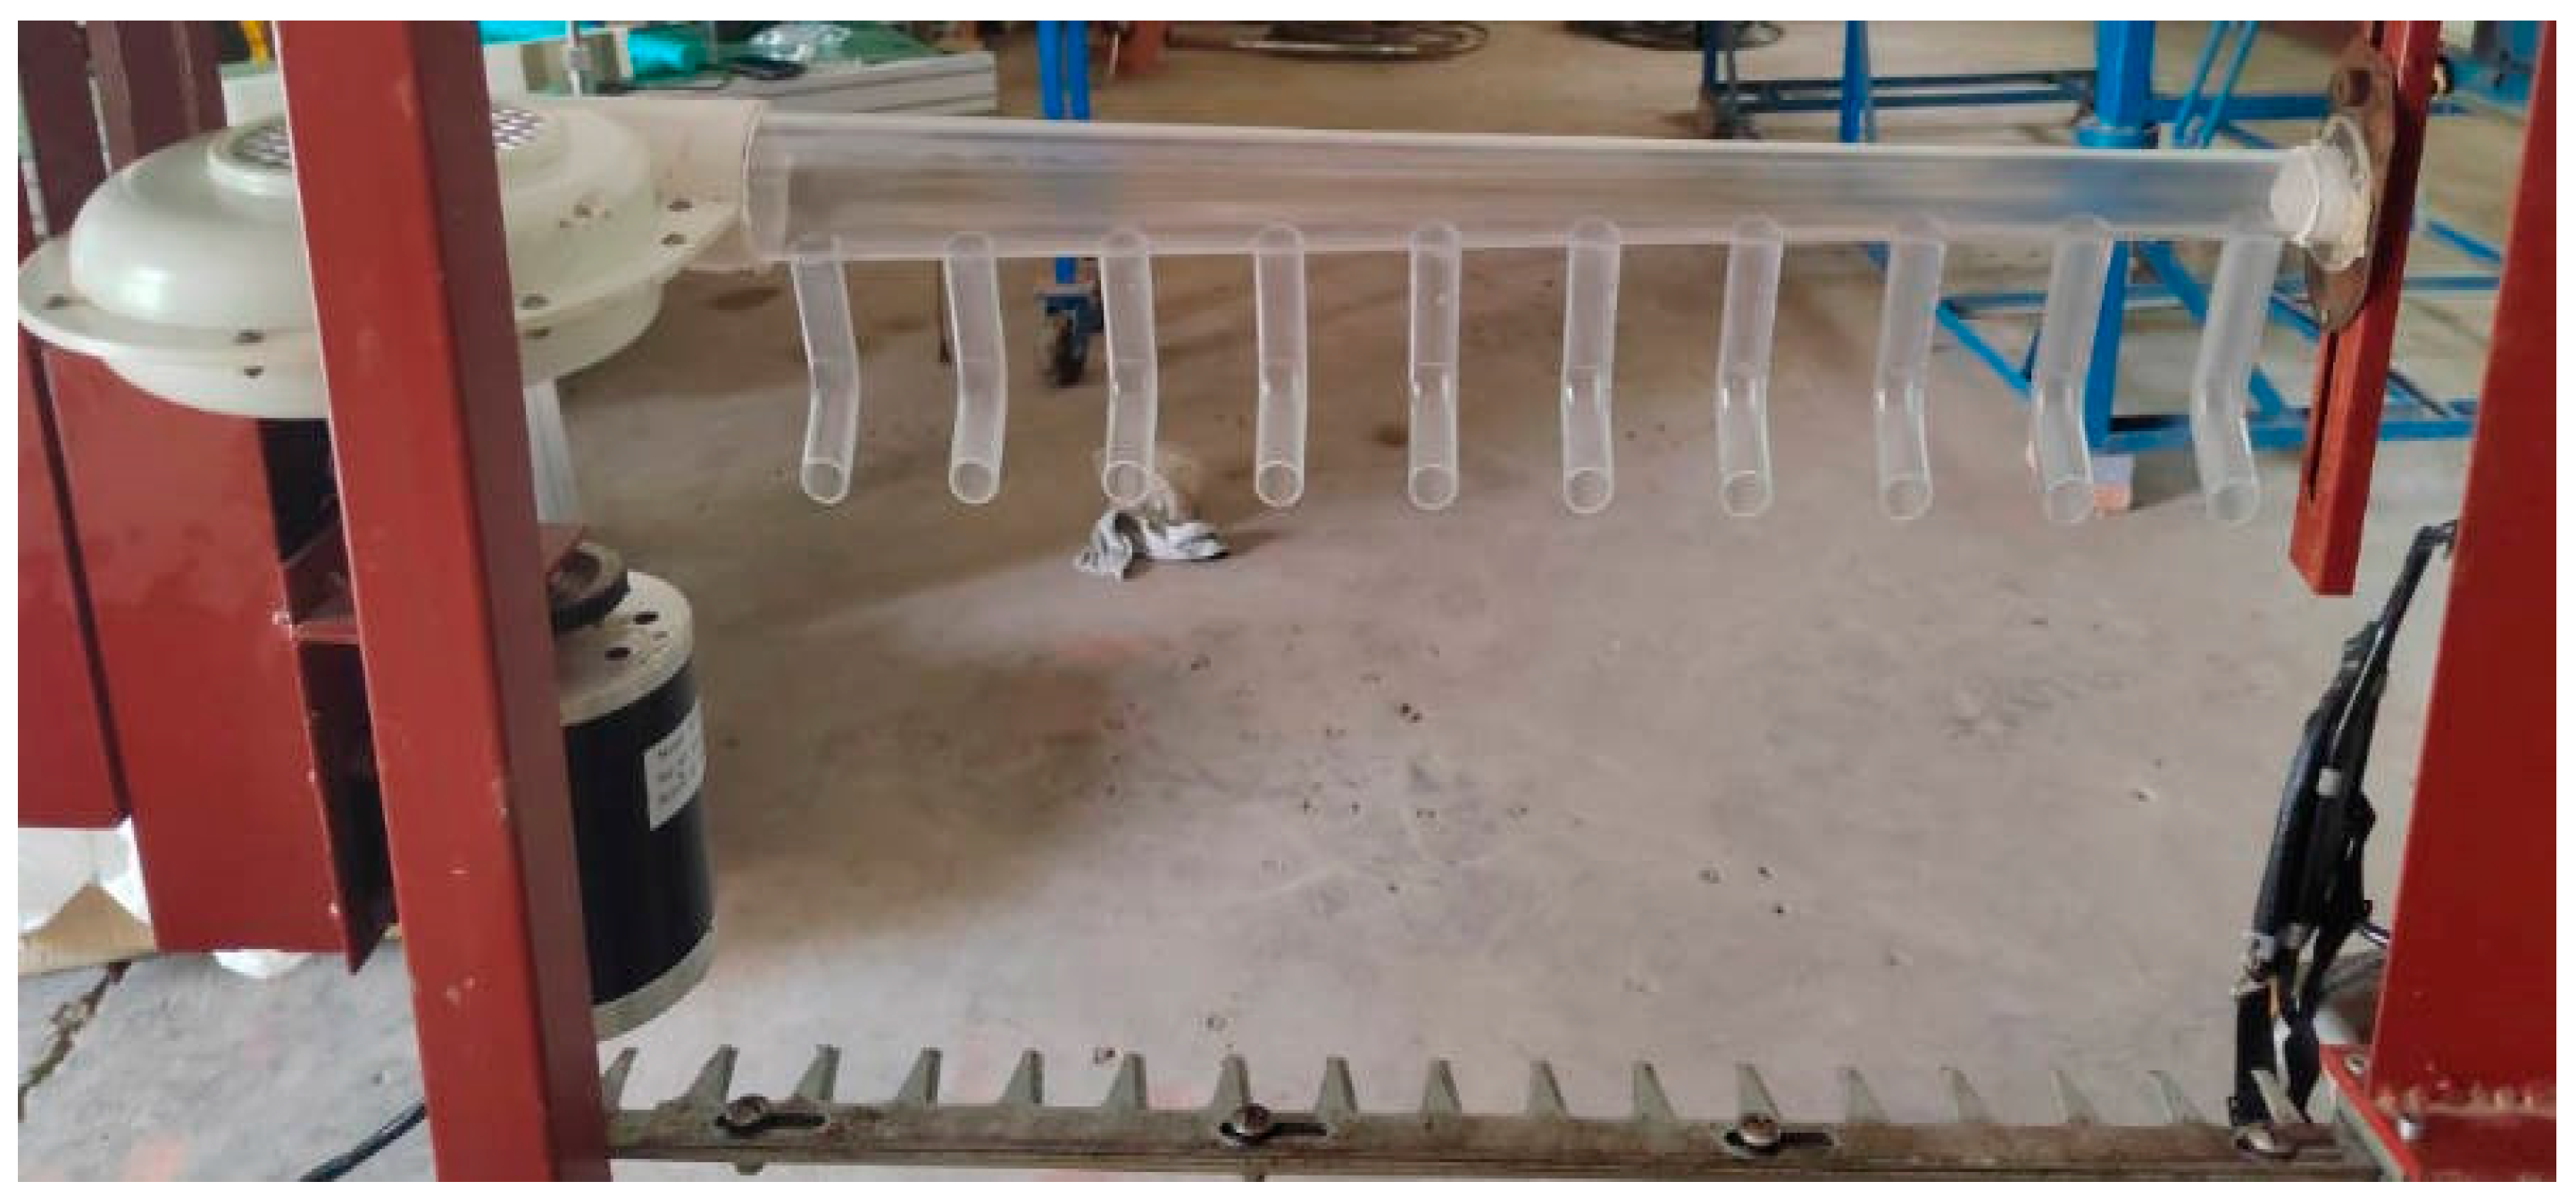
To validate the accuracy of the optimization analysis findings, experimental verification of the external structure of the leaf-collecting pipeline was conducted using the optimal parameter combination. Figure 10 displays the physical object under examination. Five test repetitions were performed, and the results were averaged. The findings indicated an average outlet wind speed of 10.80 m/s, with a wind speed non-uniformity of 8.21%. The experimental verification closely aligns with the results achieved through software optimization, falling within the accepted margin of error, thus confirming the reliability of the rounded optimization outcomes.
3.2. Optimization of the Internal Structure of the Leaf-Collecting Pipe
Simulation experiments were conducted on the internal structure under the optimal combination of the external structure of the leaf-collecting pipeline, as shown in Figure 11.
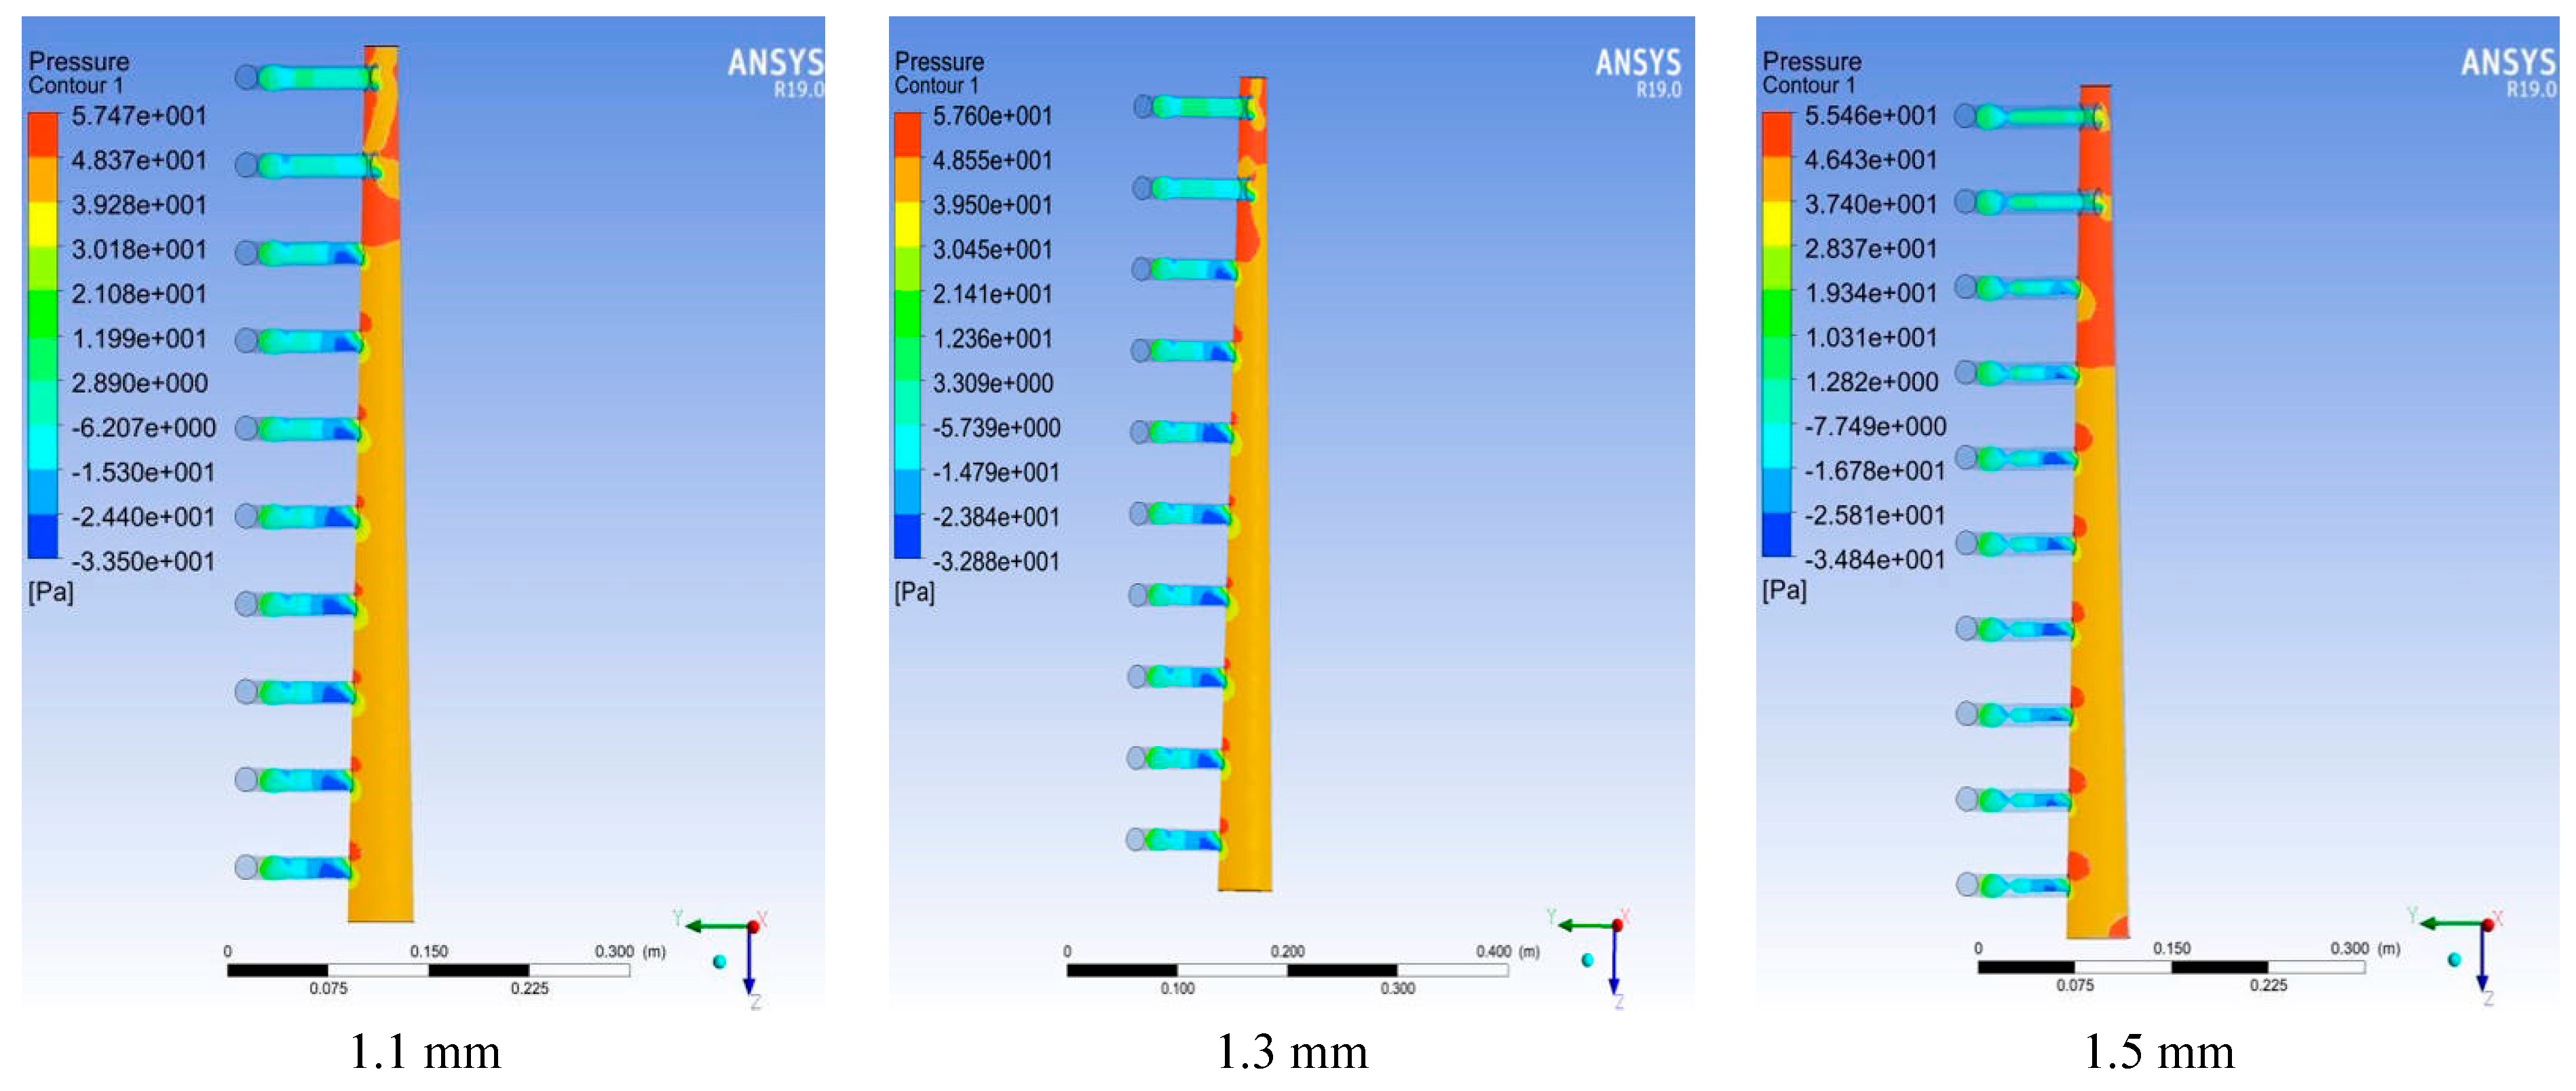
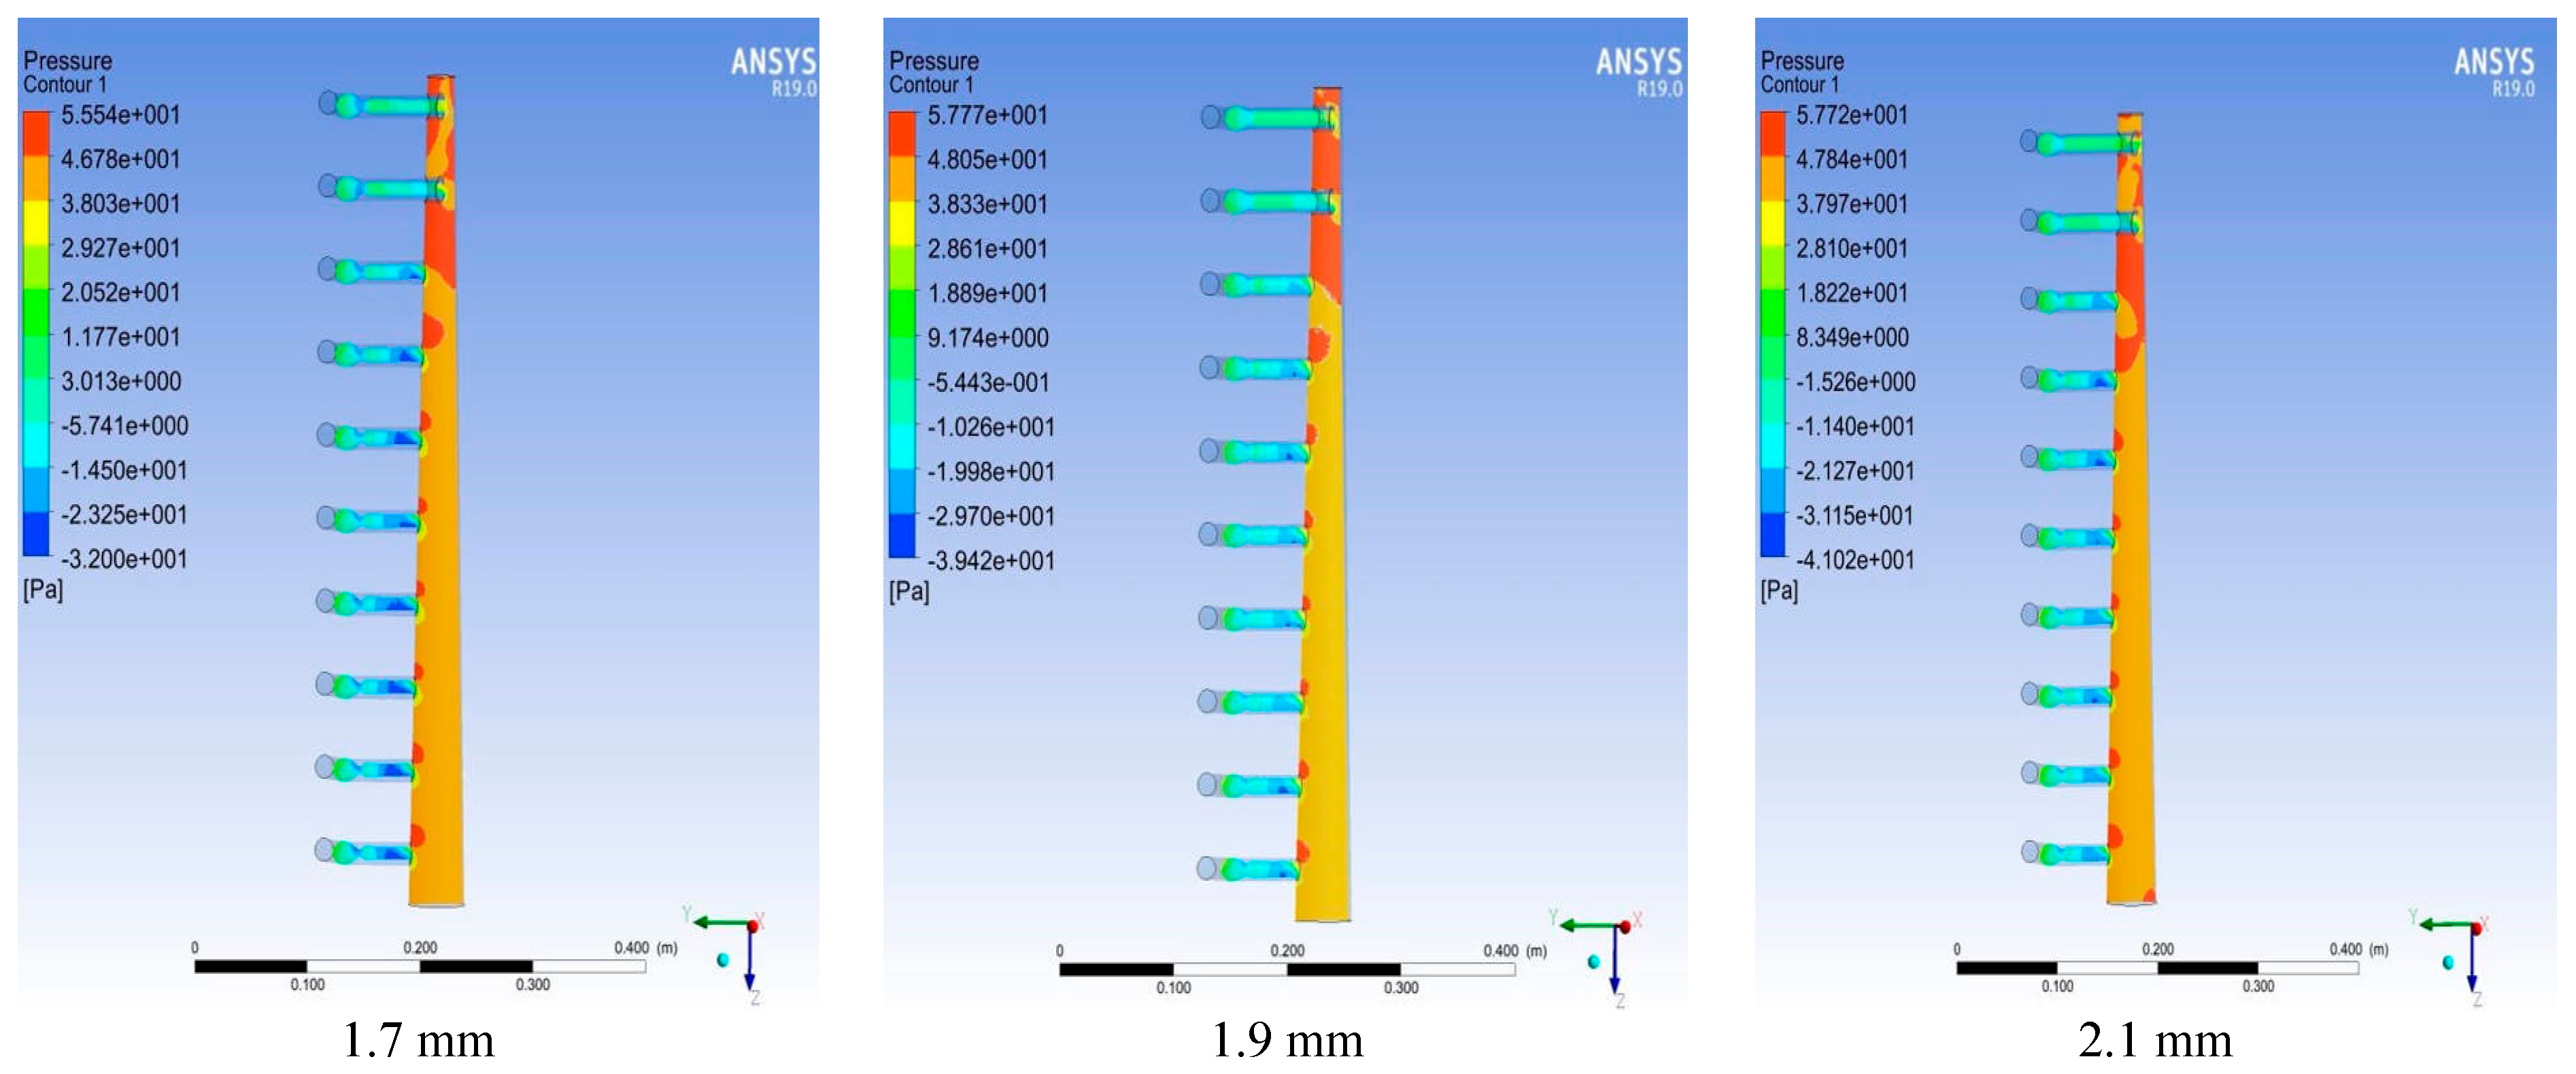
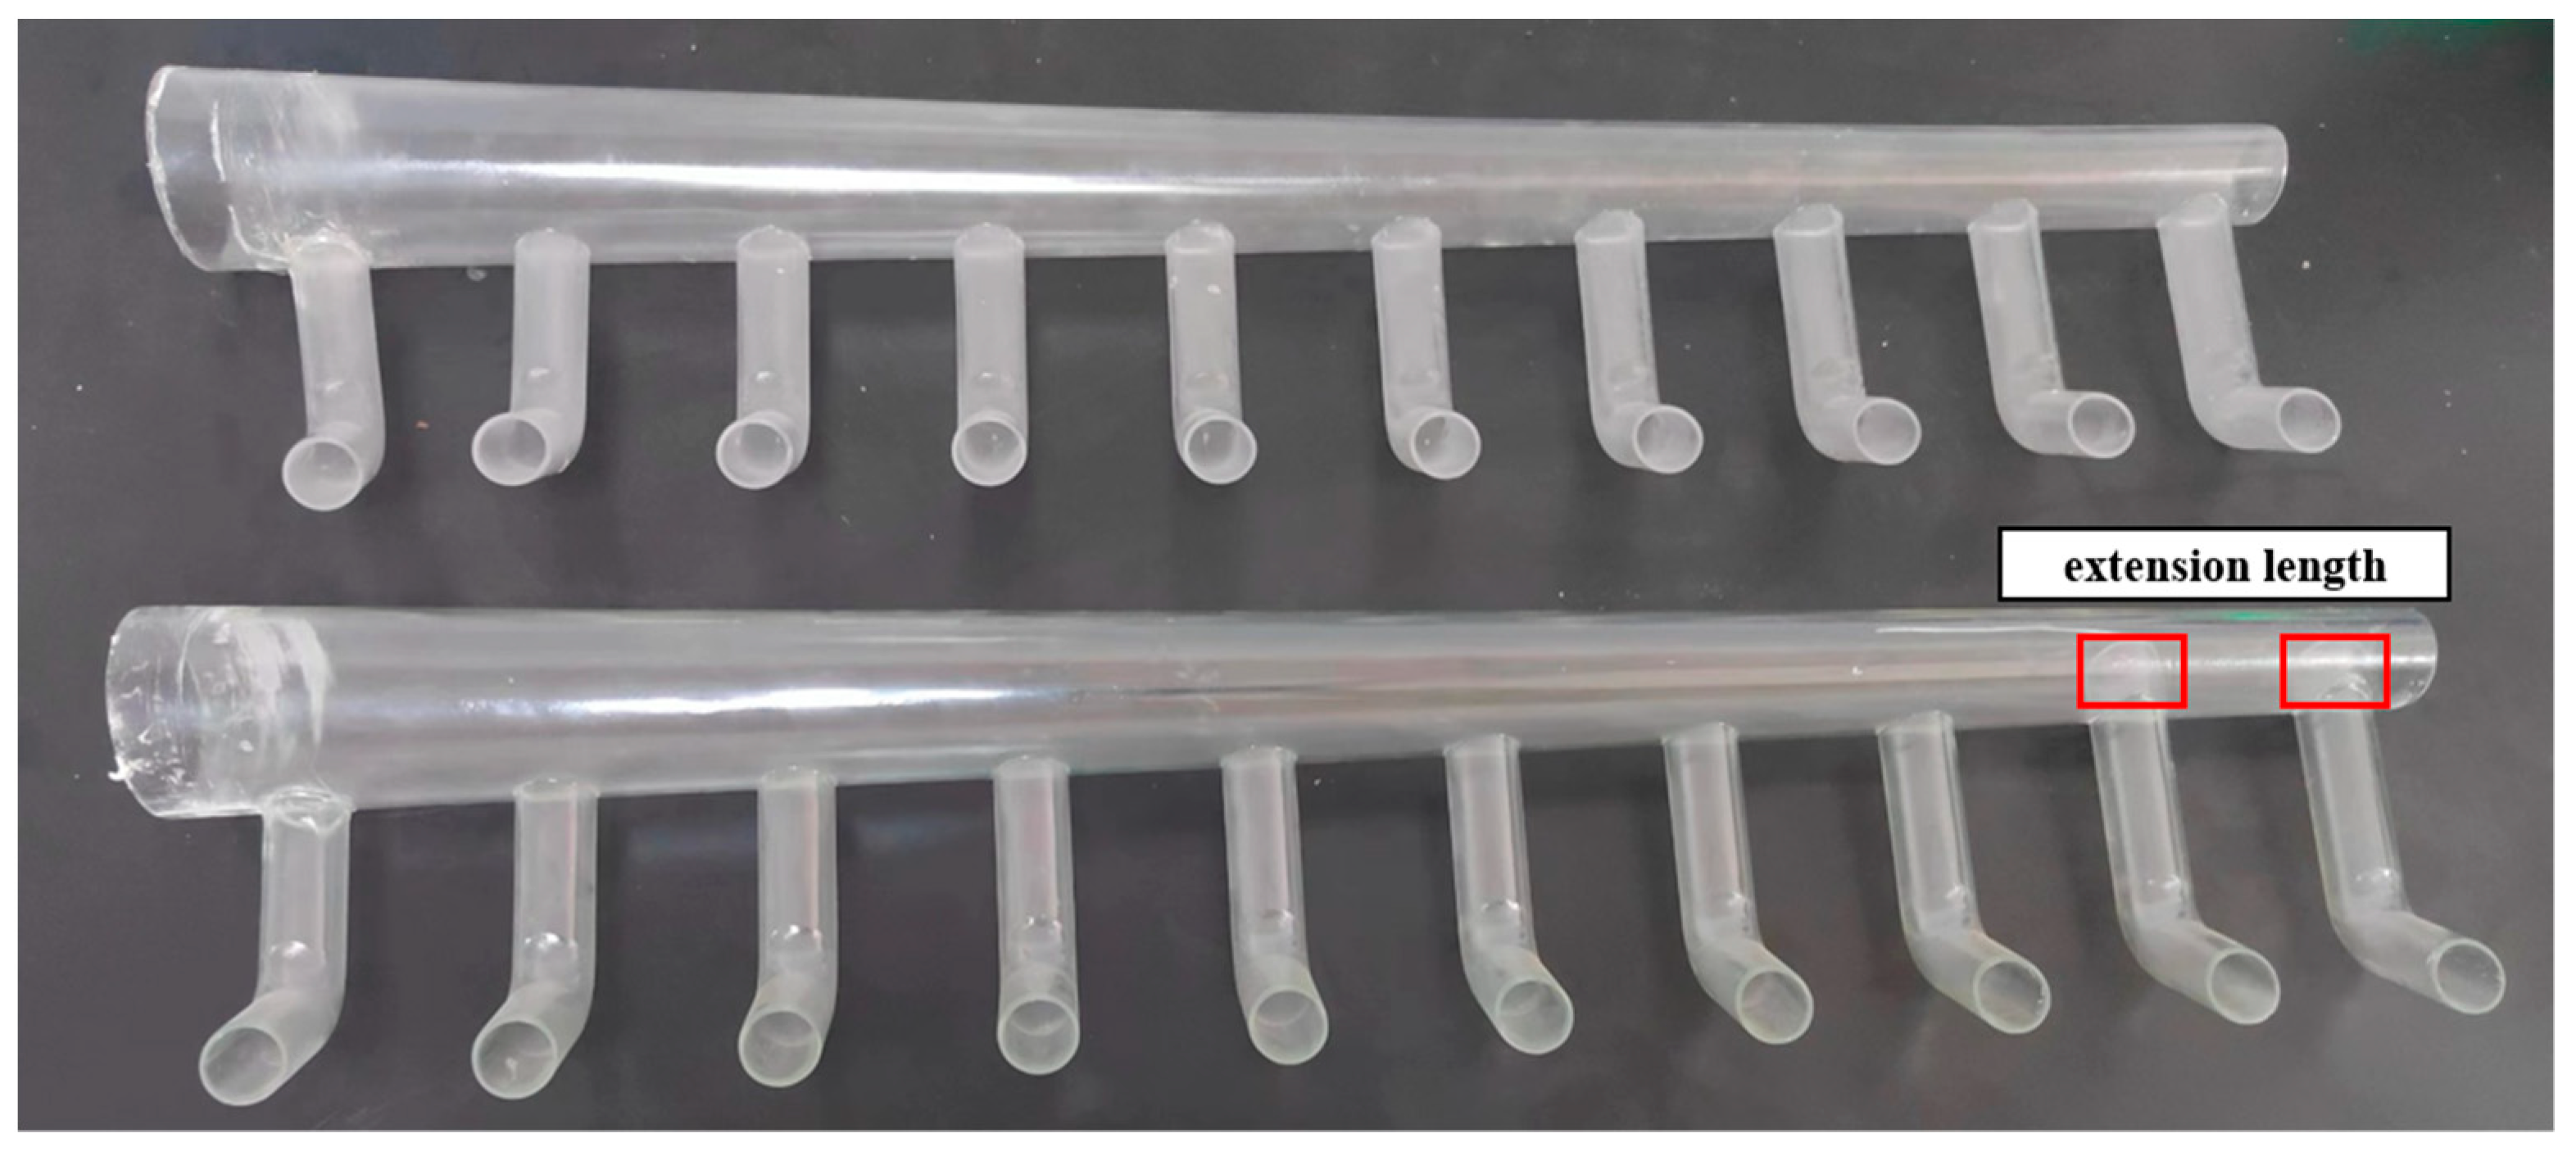
Figure 11 illustrates that the cross-sectional gas velocity was influenced by the static pressure within the branch pipe, with the cross-sectional area of the pipe decreasing as the distance between branches extended to 1.5 mm. Notably, the static pressure gradient along the pipe from the airflow inlet to its end displayed a gradual shift rather than a random variation as the branch separation increased, resulting in reduced variation between cross-sectional gas velocities among branches and increased consistency. Comparison of the pressure cloud maps with other internal extension lengths revealed that, as airflow reached the front region of the extension lengths, its velocity slowed down, accompanied by increased dynamic pressure. As the cross-sectional area of the pipeline decreased and static pressure decreased, gas pressure loss and energy consumption increased. Consequently, a simulation analysis selected an extension length of 1.5 mm as the optimal value to measure the average outlet wind speed and wind speed non-uniformity. Each test set was repeated three times to verify airflow velocity uniformity. Figure 12 displays the optimization diagram of the internal and external structure of the tea harvester leaf-collecting pipeline, while Table 5 presents the validation results.
Based on the findings in Table 5, the average outlet wind speed and wind speed uniformity within the internal structure of the leaf-collector pipeline outperformed those of the external structure across all experimental parameters. The error rate remained below 5%, falling within the acceptable threshold and affirming the reliability of the model.
3.3. Field Experiment
In order to verify the working performance of the tea harvester, a field experiment was carried out. The machine was above the tea tree canopy, and the cutter was placed in position 2–3 cm below the bud. The position of the tea-collection bag was adjusted, and the system was connected to power before the start of the harvest. Test instruments included electronic balance, tape measure, anemometer, etc.
The field experiment on a tea-plucking machine took place at the Lutong Tea (latitude 35°11′25.9″ N, longitude 112°25′45.5″ E) Plantation in Jiyuan City, Henan Province, in September 2023. Tea-planting rows, as depicted in Figure 13, were spaced approximately 1 m apart, and the length of the canopy was about 1.1 m featuring the Zhongcha 108 variety. To confirm the simulation data’s accuracy, further validating the simulation results’ reliability was essential.
The leakage rate and bud leaf intact rate were selected as the test indicators for the experiment, and the calculation formulas are as follows.
Leakage rate P is the ratio of the number of uncut buds and leaves within the cutting area to the total number of buds and leaves:
where P1 is the number of uncut buds and leaves within the cutting range and Pr is the total number of buds and leaves within the cutting range.
Bud and leaf integrity rate L is the ratio of the weight of intact and undamaged buds and leaves within the cutting area to the total weight of all cut buds and leaves:
where mi is the (g) weight of intact buds within the cutting range and m is the (g) total weight of all buds within the cutting range.
During the experiment, the horizontal distance between the outlet of the airflow branch and the cutting blade was set to 16 cm, the vertical distance between the outlet of the airflow branch and the cutting blade was also set to 16 cm, and the angle between the outlet of the airflow branch and the horizontal direction was maintained at 10°. Each set of tests was repeated three times, and the results were averaged. The test outcomes are presented in Table 6. The average leakage cutting rate was determined to be 3.40%, while the bud and leaf integrity rate reached 90.36%. These values closely resembled the predicted values, affirming the reliability of the experiment.
4. Conclusions
This study focuses on the leaf-collecting pipe of a tea harvester as the subject of investigation. The research utilized Fluent simulation software to numerically analyze the internal flow field of the leaf-collecting pipe structure. A single-factor test was conducted on structural parameters to identify key parameters affecting airflow velocity in the leaf-collecting pipe. Parameter optimization was then performed on the internal extension length of the branch pipe. Finally, the harvesting effect of the leaf-collecting pipeline was validated through field experiments. The main conclusions are as follows:
- (1)
- An orthogonal test was used to analyze the results using the average outlet wind speed and wind speed non-uniformity as the test indicators. The optimal parameter combination was determined to be a main pipe taper of 25.5 mm, 10 branch pipes, and an inner diameter of the branch pipe outlet at 17.10 mm. Under these conditions, the average outlet wind speed measured 10.73 m/s, with wind speed non-uniformity at 8.24%.
- (2)
- Comparison experiments conducted before and after optimization revealed a reduction in the maximum speed deviation ratio of branch pipe wind speed by 12.04% and a decrease in wind speed non-uniformity by 4.53%. Validation experiments were carried out using the optimal parameters, demonstrating an average outlet wind speed of 10.80 m/s and wind speed non-uniformity of 8.21%, thereby confirming the reliability of the simulation results.
- (3)
- To enhance the uniformity of wind speed at the outlet of the leaf-collecting pipeline, a comparison was made between gas velocity and pressure variations in each section of the internal structural branch of the leaf-collecting pipeline. The results indicated that at an average outlet wind speed of 11.02 m/s and wind speed non-uniformity of 8.04%, the experimental indicators of the internal structure of the leaf-collecting pipeline, outperformed those of the external structure with an error rate below 5%. Field experiments demonstrated a stalk leakage rate of 3.40%, a bud and leaf integrity rate of 90.36%, and that the optimization of the leaf-collecting pipeline structure not only improved the uniformity of airflow distribution but also effectively enhanced picking efficiency. This study provides a robust theoretical foundation for optimizing the design of the leaf-collecting pipeline structure.
Author Contributions
Conceptualization, Z.D. and X.L.; methodology, Z.D. and L.Z.; software, L.Z. and X.L.; validation, X.L., Z.D. and F.Y.; data analysis, L.Z. and F.Y.; writing, X.J. and F.Y.; project administration, X.L. and X.J. All authors have read and agreed to the published version of the manuscript.
Funding
This research was supported by the National Natural Science Foundation of China (52105251) and The Henan Provincial Department of Science and Technology Research Project (242102111182).
Institutional Review Board Statement
Not applicable.
Data Availability Statement
Data are contained within the article.
Conflicts of Interest
We declare that we do not have any commercial or associative interests that represent conflicts of interest in connection with the work submitted.
References
- Chen, Y.T.; Chen, S.F. Localizing plucking points of tea leaves using deep convolutional neural networks. Comput. Electron. Agric. 2020, 171, 105298. [Google Scholar] [CrossRef]
- Jia, J.; Ye, Y.; Cheng, P.; Zhu, Y.P. Design and experimental optimization of hand held manipulator for picking famous tea shoot. Trans. Chin. Soc. Agric. Mach. 2022, 53, 86–92. [Google Scholar] [CrossRef]
- Han, Y.; Xiao, R.; Song, Y. Design and evaluation of tea-plucking machine for improving quality of tea. Appl. Eng. Agric. 2019, 35, 979–986. [Google Scholar] [CrossRef]
- Li, X.; Lin, Y.; Zhao, S. Transcriptome changes and its effect on physiological and metabolic processes in tea plant during mechanical damage. For. Pathol. 2018, 48, e12432. [Google Scholar] [CrossRef]
- Ashfaq, S.; Ahmad, M.; Munir, A.; Ghafoor, A. Improvement of air homogeneity in paddy dryer with central air flow channel. Int. J. Food Eng. 2017, 13, 20150408. [Google Scholar] [CrossRef]
- Daza, G.; Pereyra, E.; Ratkovich, N. CFD simulation of two phase gas/non-Newtonian shear thinning fluid flow in pipes. Braz. Soc. Mech. Sci. 2019, 41, 506. [Google Scholar] [CrossRef]
- Weng, X.; Chen, C.; Wang, G.; Wei, Z. Numerical Simulation of leaf gathering process of fresh leaf collecting pipeline based on CFD-DEM. Trans. Chin. Soc. Agric. Mach. 2022, 53, 424–432. [Google Scholar] [CrossRef]
- Lei, X.; Liao, Y.; Zhang, W.; Li, S.; Shanshan, W. Simulation and experiment of gas solid flow in seed conveying tube for rapeseed and wheat. Trans. Chin. Soc. Agric. Mach. 2017, 48, 57–68. [Google Scholar] [CrossRef]
- Chen, S.; Xiao, J.; Rao, S.; Wu, M. CFD numerical analysis of airflow blowing velocity field of medicago hispida harvester. Trans. Chin. Soc. Agric. Eng. 2016, 32, 39–46. [Google Scholar] [CrossRef]
- Li, Y.; Yi, Y.; Du, S.; Ding, Q. Design and experiment on air blowing header of plot combine harvester for grain. Trans. Chin. Soc. Agric. Mach. 2017, 48, 79–87. [Google Scholar] [CrossRef]
- Weng, X.; Tan, D.; Wang, G.; Chen, C.; Zheng, L. CFD Simulation and optimization of the leaf collecting mechanism for the riding type tea plucking machine. Agriculture 2023, 13, 946. [Google Scholar] [CrossRef]
- Liu, R.; Liu, L.; Li, Y.; Liu, Z.; Zhao, J. Numerical simulation of seed movement characteristics in new maize delivery device. Agriculture 2022, 12, 1944. [Google Scholar] [CrossRef]
- Li, Y.; Liu, R.; Liu, C. Simulation and test of seed velocity coupling in seed tube of pneumutic seed metering device. Trans. Chin. Soc. Agric. Mach. 2021, 52, 54–61. [Google Scholar] [CrossRef]
- Endalew, A.M.; Debaer, C.; Rutten, N.; Vercammen, J.; Delele, M.A.; Ramon, H.; Nicolaï, B.M.; Verboven, P. A new integrated CFD modelling approach towards air assisted orchard spraying—Part II: Validation for different sprayer types. Comput. Electron. Agric. 2010, 71, 137–147. [Google Scholar] [CrossRef]
- Endalew, A.M.; Debaer, C.; Rutten, N.; Vercammen, J.; Delele, M.A.; Ramon, H.; Nicolaï, B.M.; Verboven, P. A new integrated CFD modelling approach towards air assisted orchard spraying. Part I. Model development and effect of wind speed and direction on sprayer airflow. Comput. Electron. Agric. 2010, 71, 128–136. [Google Scholar] [CrossRef]
- Wu, B.; Huang, K.; Qing, D.; Zhu, M. Numerical simulation and optimization of perforated tube trolley in circular cooler. World J. Eng. Technol. 2017, 5, 684–695. [Google Scholar] [CrossRef]
- Hong, S.; Zhao, L.; Zhu, H. CFD simulation of airflow inside tree canopies discharged from air-assisted sprayers. Comput. Electron. Agric. 2018, 149, 121–132. [Google Scholar] [CrossRef]
- Lu, Y.; Hu, Z.; Lin, D. Numerical simulation of peanuts particles conveying in pipeline using CFD-DEM coupled approach. Trans. Chin. Soc. Agric. Eng. 2016, 37, 104–109. [Google Scholar] [CrossRef]
- Shi, J.; Wu, Z.; Liu, Q.; Lou, Z.; Zhao, Y. CFD simulation and optimization of airflow field in industrial tunnel dryer with different blowing designs. Trans. Chin. Soc. Agric. Eng. 2014, 30, 315–321. [Google Scholar] [CrossRef]
- Ou, M.; Gao, T.; Wu, M.; Dong, X.; Jia, W. Simulation and experimental study of multi-duct air assisted orchard spray system based on CFD. Trans. Chin. Soc. Agric. Eng. 2021, 11, 70–75. [Google Scholar] [CrossRef]
- Zhong, H.; Mujumdar, A. CFD modeling of the gas particle flow behavior in spouted beds. Powder Technol. 2008, 183, 260–272. [Google Scholar] [CrossRef]
- Wang, L.; Huang, H.; Yi, Y. Optimization design and test of air flow pipe structure in small scale rape combined harvester. Chin. J. Agric. Mech. Eng. 2020, 41, 16–24. [Google Scholar] [CrossRef]
- Ou, A.; Shao, F.; Shu, S. Structural design of a monorail suspended tea picker and its simulation analysis of ventilation tube flow field. J. Agric. Sci. 2019, 47, 236–240. [Google Scholar] [CrossRef]
- Qin, W.; Wang, Z.; Wang, Y. Analysis and experiments of the air pressure loss in multi-branch convergence pipe of air suction seeder. Trans. Chin. Soc. Agric. Eng. 2023, 39, 111–127. [Google Scholar] [CrossRef]
- Zhu, Q.; Zhang, H.; Zhu, Z.; Gao, Y.; Chen, L. Structural Design and simulation of pneumatic conveying line for a paddy side deep fertilisation system. Agriculture 2022, 12, 867. [Google Scholar] [CrossRef]
- Han, W.; Wu, P.; Yang, Q.; Feng, H. Advances and comparisons of uniformity evaluation index of sprinkle irrigation. Trans. Chin. Soc. Agric. Eng. 2005, 21, 172–177. [Google Scholar] [CrossRef]
- Xia, J.; Lin, S.; Wang, F.; Wang, G.; Huang, Y.; Guo, J. Research on flow field optimization of cold storage plate periphery based on PIV visualization. Chin. J. Agric. Mech. Eng. 2022, 43, 127–133. [Google Scholar] [CrossRef]
- Wan, X.; Yuan, J.; Liao, Q.; Guan, Z. Design and experiment of cyclone separation cleaning device with raised cylinder disturbing airflow field for rapeseed combine harvest. Trans. Chin. Soc. Agric. Mach. 2023, 54, 159–172. [Google Scholar] [CrossRef]
- Singh, K.; Pardeshi, I.; Kumar, M.; Srinivas, K.; Srivastva, A. Optimization of machine parameters of a pedal operated paddy thresher using RSM. Biosyst. Eng. 2008, 100, 591–600. [Google Scholar] [CrossRef]
- Chen, K.; He, X.; Qi, H.; Yang, H. Optimization and experiment on process parameters of hot pressing bonding of seaweed sheet. Trans. Chin. Soc. Agric. Mach. 2023, 54, 407–415. [Google Scholar] [CrossRef]
Figure 1.
Overall structure diagram of tea harvester: (1) handle; (2) control box; (3) motor; (4) fan; (5) leaf-collecting pipeline; (6) cutter; (7) telescopic devices; (8) soft shaft; (9) gasoline engine.
Figure 1.
Overall structure diagram of tea harvester: (1) handle; (2) control box; (3) motor; (4) fan; (5) leaf-collecting pipeline; (6) cutter; (7) telescopic devices; (8) soft shaft; (9) gasoline engine.

Figure 2.
Three-dimensional view of the leaf-collecting pipeline.

Figure 3.
Mesh division of the leaf-collecting pipeline.
Figure 4.
Effect of main pipe taper on average outlet wind speed and wind speed non-uniformity.
Figure 5.
Effect of number of branch pipes on the average outlet wind speed and wind speed non-uniformity.
Figure 5.
Effect of number of branch pipes on the average outlet wind speed and wind speed non-uniformity.
Figure 6.
Effect of inner diameter of branch outlet on average outlet wind speed and wind speed non-uniformity.
Figure 6.
Effect of inner diameter of branch outlet on average outlet wind speed and wind speed non-uniformity.

Figure 7.
Response surface of the influence of various factors on the average outlet wind speed: (a) C = 17 mm; (b) B = 10; (c) A = 25 mm.
Figure 7.
Response surface of the influence of various factors on the average outlet wind speed: (a) C = 17 mm; (b) B = 10; (c) A = 25 mm.

Figure 8.
Response surface of various factors on the non-uniformity of wind speed: (a) C = 17 mm; (b) B = 10; (c) A = 25 mm.
Figure 8.
Response surface of various factors on the non-uniformity of wind speed: (a) C = 17 mm; (b) B = 10; (c) A = 25 mm.
Figure 9.
Speed cloud map of the leaf-collecting pipeline structure: (a) before optimization; (b) after optimization.
Figure 9.
Speed cloud map of the leaf-collecting pipeline structure: (a) before optimization; (b) after optimization.

Figure 10.
Verification of the physical diagram.

Figure 11.
Pressure cloud map with different extension lengths.


Figure 12.
Internal and external structure diagram of the leaf-collecting pipeline.

Figure 13.
Field experiment.


Table 1.
Factor levels’ coding table.
| Codes | Testing Factors | ||
|---|---|---|---|
| A (mm) | B | C (mm) | |
| −1.682 | 19 | 6 | 16 |
| −1 | 22 | 8 | 16.5 |
| 0 | 25 | 10 | 17 |
| 1 | 28 | 12 | 17.5 |
| 1.682 | 31 | 14 | 18 |
Table 2.
Experimental plan and results.
| No. | Factors | Evaluation Index | |||
|---|---|---|---|---|---|
| X1 | X2 | X3 | Y1/(m/s) | Y2/% | |
| 1 | −1 | −1 | −1 | 8.54 | 13.05 |
| 2 | 1 | −1 | −1 | 9.70 | 13.05 |
| 3 | −1 | 1 | −1 | 9.12 | 7.12 |
| 4 | 1 | 1 | −1 | 9.56 | 13.15 |
| 5 | −1 | −1 | 1 | 8.36 | 18.16 |
| 6 | 1 | −1 | 1 | 9.15 | 8.11 |
| 7 | −1 | 1 | 1 | 8.85 | 7.03 |
| 8 | 1 | 1 | 1 | 9.25 | 7.13 |
| 9 | −1.682 | 0 | 0 | 8.93 | 15.03 |
| 10 | 1.682 | 0 | 0 | 10.23 | 13.15 |
| 11 | 0 | −1.682 | 0 | 7.91 | 17.15 |
| 12 | 0 | 1.682 | 0 | 8.57 | 11.11 |
| 13 | 0 | 0 | −1.682 | 10.54 | 8.03 |
| 14 | −1 | 0 | 1.682 | 9.22 | 10.16 |
| 15 | 0 | 0 | 0 | 10.62 | 8.21 |
| 16 | 0 | 0 | 0 | 10.72 | 9.25 |
| 17 | 0 | 0 | 0 | 10.76 | 10.11 |
| 18 | 0 | 0 | 0 | 10.97 | 9.09 |
| 19 | 0 | 0 | 0 | 10.96 | 9.09 |
| 20 | 0 | 0 | 0 | 10.86 | 8.12 |
| 21 | 0 | 0 | 0 | 10.52 | 10.18 |
| 22 | 0 | 0 | 0 | 10.85 | 9.21 |
| 23 | 0 | 0 | 0 | 10.67 | 9.21 |
Table 3.
Analysis of variance of average outlet wind speed.
| Source | Sum of Squares | df | Mean Square | F-Value | p-Value |
|---|---|---|---|---|---|
| Model | 21.02 | 9 | 2.34 | 86.39 | <0.0001 ** |
| X1 | 1.79 | 1 | 1.79 | 66.30 | <0.0001 ** |
| X2 | 0.34 | 1 | 0.34 | 12.40 | 0.0038 ** |
| X3 | 0.37 | 1 | 0.37 | 13.86 | 0.0026 ** |
| X1X2 | 0.15 | 1 | 0.15 | 5.70 | 0.0329 * |
| X1X3 | 0.046 | 1 | 0.046 | 1.69 | 0.2161 |
| X2X3 | 0.002813 | 1 | 0.002813 | 0.10 | 0.7522 |
| X12 | 3.14 | 1 | 3.14 | 116.21 | <0.0001 ** |
| X22 | 13.76 | 1 | 13.76 | 509.08 | <0.0001 ** |
| X32 | 0.76 | 1 | 0.76 | 28.05 | <0.0001 ** |
| Residual | 0.35 | 13 | 0.027 | ||
| Lack of fit | 0.16 | 5 | 0.033 | 1.39 | 0.3234 |
| Pure error | 0.19 | 8 | 0.024 | ||
| Cor total | 21.37 | 22 |
Note: (*) indicates a significant effect (0.01 < p < 0.05), and (**) indicates an extremely significant effect (p < 0.01).
Table 4.
Analysis of variance of wind speed non-uniformity.
| Source | Sum of Squares | df | Mean Square | F-Value | p-Value |
|---|---|---|---|---|---|
| Model | 208.28 | 9 | 23.14 | 33.09 | <0.0001 ** |
| X1 | 3.98 | 1 | 3.98 | 5.69 | 0.0330 * |
| X2 | 57.81 | 1 | 57.81 | 82.67 | <0.0001 ** |
| X3 | 9.17 | 1 | 9.17 | 13.11 | 0.0031 ** |
| X1X2 | 32.72 | 1 | 32.72 | 46.80 | 0.0001 ** |
| X1X3 | 37.93 | 1 | 37.93 | 54.24 | 0.0001 ** |
| X2X3 | 4.93 | 1 | 4.93 | 7.05 | 0.0198 * |
| X12 | 38.10 | 1 | 38.10 | 54.48 | <0.0001 ** |
| X22 | 39.73 | 1 | 39.73 | 56.81 | <0.0001 ** |
| X32 | 19.22 | 1 | 19.22 | 27.49 | 0.0002 ** |
| Residual | 9.09 | 13 | 0.70 | ||
| Lack of fit | 5.14 | 5 | 1.03 | 2.08 | 0.1702 |
| Pure error | 3.95 | 8 | 0.49 | ||
| Cor total | 217.37 | 22 |
Note: (*) indicates a significant effect (0.01 < p < 0.05), and (**) indicates an extremely significant effect (p < 0.01).
Table 5.
Internal structure verification test results.
| Number | Average Outlet Wind Speed Y1 m/s | Wind Speed Non-Uniformity Y2/% |
|---|---|---|
| 1 | 10.89 | 8.11 |
| 2 | 11.05 | 8.05 |
| 3 | 11.13 | 7.98 |
| average value | 11.02 | 8.04 |
Table 6.
Field experiment results.
| Number | Leakage Rate Y1/% | Bud and Leaf Integrity Rate Y2/% |
|---|---|---|
| 1 | 3.15 | 91.23 |
| 2 | 4.08 | 89.74 |
| 3 | 2.98 | 90.13 |
| average value | 3.40 | 90.36 |
Disclaimer/Publisher’s Note: The statements, opinions and data contained in all publications are solely those of the individual author(s) and contributor(s) and not of MDPI and/or the editor(s). MDPI and/or the editor(s) disclaim responsibility for any injury to people or property resulting from any ideas, methods, instructions or products referred to in the content. |
© 2024 by the authors. Licensee MDPI, Basel, Switzerland. This article is an open access article distributed under the terms and conditions of the Creative Commons Attribution (CC BY) license (https://creativecommons.org/licenses/by/4.0/).
Share and Cite
MDPI and ACS Style
Du, Z.; Zhang, L.; Li, X.; Jin, X.; Yu, F. Optimizing Efficiency of Tea Harvester Leaf-Collection Pipeline: Numerical Simulation and Experimental Validation. Agriculture 2024, 14, 653. https://doi.org/10.3390/agriculture14050653
AMA Style
Du Z, Zhang L, Li X, Jin X, Yu F. Optimizing Efficiency of Tea Harvester Leaf-Collection Pipeline: Numerical Simulation and Experimental Validation. Agriculture. 2024; 14(5):653. https://doi.org/10.3390/agriculture14050653
Chicago/Turabian StyleDu, Zhe, Liyuan Zhang, Xinping Li, Xin Jin, and Fan Yu. 2024. "Optimizing Efficiency of Tea Harvester Leaf-Collection Pipeline: Numerical Simulation and Experimental Validation" Agriculture 14, no. 5: 653. https://doi.org/10.3390/agriculture14050653
Note that from the first issue of 2016, this journal uses article numbers instead of page numbers. See further details here.