Abstract
Determining the residual value of tractors is imperative for comprehensive cost analyses within the agricultural machinery sector. Despite numerous studies offering various models and independent variables, the double square root regression approach, originally developed by Cross and Perry and adapted by ASABE for North American contexts, has been widely utilized. However, factors such as the complexity of OEM portfolios, steep price increases due to compliance with diesel emission regulations, and limited data availability in Europe and its market specificities necessitate improvements in predictive accuracy. This study evaluates different tractor cohort alternatives beyond engine horsepower to enhance predictive robustness. Incorporating brand and powertrain type alongside engine power significantly improved model performance and exhibited the strongest robustness, as evidenced by reduced the root mean square error (RMSE) and increased R-squared values. These findings contribute to the refinement of tractor residual value estimation models, offering valuable insights for stakeholders in the agricultural machinery industry.
1. Introduction
Investing in capital assets, such as machinery, is crucial for long-term success [1]. Managing machinery effectively involves attention to its entire life cycle, including its procurement, maintenance optimization for maximum productivity, and eventual sale when financially viable. The accurate tracking of machinery life cycle costs requires proper depreciation calculation to monitor machine-related costs over time.
Efficient machinery management entails having the appropriate size and type of machine available at the right time and cost. After selecting ownership and operation costs, including size and type, several common acquisition alternatives exist, such as rental, leasing, or custom hire [2]. Minimizing production costs associated with machinery necessitates routine benefit and cost assessment, comparing the ownership, lease, rental, and custom hire [3].
Machinery costs encompass ownership and operation costs as well as losses due to lack of timeliness [4,5]. Ownership costs, regardless of machine age and usage, include depreciation, interest, taxes, insurance, and housing. Operating costs, linked to age and usage, encompass labor, fuel, diesel exhaust fluid (DEF), and repair/maintenance costs.
Understanding equipment ownership and operation costs is advantageous for maximizing profits. Ownership costs represent cumulative cash flows irrespective of machine productivity, while operation costs reflect expenses incurred during machine use. Selecting the appropriate machine type for a task requires understanding field operation costs. Failing to accurately estimate equipment costs can lead to hardship [6]. Efficient machinery management aims to provide dependable services to various enterprises while minimizing expenses, often intertwined with overall business operations.
Machinery-related expenses often comprise over 50% of total crop production costs. Regular evaluations of equipment ownership, leasing, or rental are crucial for cost reduction [3]. While conventional purchase plans remain common, leasing major machinery items is increasing. Leasing options include operating leases, enabling tax-deductible payments, and finance leases, offering depreciation deductions. Rollover purchases involve buying a new machine with the intent to replace it after a year or season [7].
Regardless of the payment mode, the machinery’s residual value significantly impacts financing costs. Lenders incorporate residual value into financing arrangements to ensure the loan’s lien remains below it, mitigating risk. Uncertain residual values may lead to higher financing costs, prompting lenders to incorporate a safety margin [8], thus influencing manufacturers, sellers, purchasers, financiers, lessors, lessees, insurers, tax authorities, users, and contractors.
The current landscape of research on used tractor markets in Europe faces several challenges. First, the availability of original source data is limited, primarily due to the smaller size of the used tractor market in Europe and the lack of well-established agricultural machinery auctions presenting a significant obstacle for empirical studies in this field.
Second, the compliance costs associated with diesel emission regulations, particularly those imposed by the European Commission (EC) on off-road diesel engines, have led to increased prices for tractors.
Third, the offerings of original equipment manufacturers (OEMs) have become more diverse and complex since 1998, atomizing even more of the already scarce machine population and, therefore, its transactional data.
These challenges underscore the complexities and limitations faced by researchers in understanding and analyzing the dynamics of the used tractor market in Europe.
The present investigation revisits the commonly employed double square root regression model, originally devised for the United States market, utilizing auction outcomes during the latter part of the 1980s. This model has been adapted to accommodate European market dynamics, incorporating data from advertisements, evolving engine power segments, and incorporating influential factors such as brand and powertrain configurations, which exert substantial impacts on pricing dynamics.
1.1. Current Issues
1.1.1. Limited Original Source Data Availability
Compared to the European passenger car industry [9], the market for used tractors in Europe [10] is notably smaller. Unlike North America, where agricultural machinery auctions are well-established, continental Europe lacks such a tradition. Even in the United Kingdom, where auctions have a longer history, significant variations exist in the terms and conditions. Ref. [11] highlights the considerable challenge of obtaining large datasets necessary for empirical studies in this domain, underscoring a significant obstacle for researchers.
1.1.2. Diesel Emission Regulation Compliance Cost Fosters Price Increase
While on-road diesel emission regulations have also impacted costs [12], the ramifications of the regulatory measures instituted by the European Commission (EC) regarding off-road diesel engine emissions [13,14,15,16,17] have been more pronounced. The fixed costs associated with compliance must be allocated among a smaller number of engines, resulting in elevated costs per unit.
1.1.3. Original Equipment Manufacturer (OEM) Size Increase
The OEM offering has experienced a significant increase since 1998. Therefore, currently, there are offerings of compact utility tractors of 55.4 kW, utility tractors of 120 kW, and row crop tractors of 380 kW. An example of a single OEM size increase evolution can be seen in Figure 1.
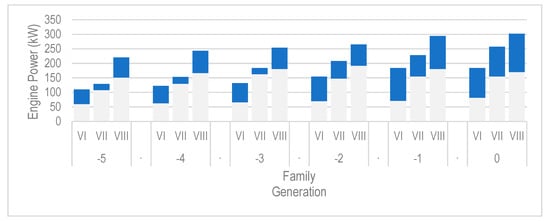
Figure 1.
OEM (original equipment manufacturer) product offering size increase.
1.1.4. Original Equipment Manufacturer (OEM) Portfolio Complexity Increase
The current spectrum of products offered by OEMs has experienced significant development [17], resulting in a situation where a single engine power option is available in diverse specifications that encompass multiple wheelbase variations and shipping masses. This broad range of offerings includes a variety of features, drivetrain alternatives, and user interface configurations integrated within distinct levels of technology packages (Figure 2). Consequently, it is not uncommon to encounter products from the same OEM featuring identical engine power but differing in specifications and feature combinations, resulting in manufacturer’s suggested retail price (MSRP) average disparities of 1.24 times or more between the most and least economical options (Figure 3).
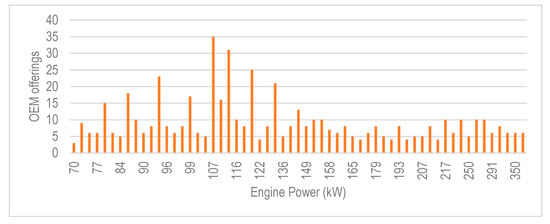
Figure 2.
Number of OEM (original equipment manufacturer) agricultural tractor configuration offerings in Germany in November 2023.
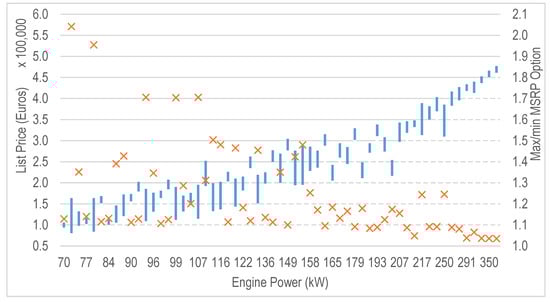
Figure 3.
Agricultural tractor OEM (original equipment manufacturer) list price (manufacturer’s suggested retail price (MSRP)) and minimum MSRP option (marked with ×) in Germany in November 2023.
1.2. Previous Studies
Various studies have endeavored to develop predictive models for determining the residual value of agricultural equipment, particularly combines and tractors. Early models, such as those proposed by ASAE in 1979 and [18], predominantly relied on age as a determining factor, with additional considerations for power, motor type, manufacturer, usage, and technological advancements. Ref. [19] introduced a Cobb–Douglas model incorporating age, header size, and manufacturer.
Reid and Bradford [20] aimed to construct a replacement model for farm tractors, integrating variables such as age, engine power, and net farm income. Their study utilized data spanning from 1954 to 1978 from a distributor association, incorporating indicator variables for manufacturers and technological periods. The residual value percent, calculated by normalizing the remaining market value against the inflation-adjusted list price using the wholesale price index, underscored the significance of economic factors in replacement model development for farm tractors, facilitating accurate replacement predictions.
Perry et al. [21] investigated tractor residual value percent (RVP) utilizing auction sale data from 1985 to 1988. Their analysis involved adjusting list prices and auction prices for special options to a common year using average price changes reported by the U.S. Department of Agriculture. The study underscored the significance of considering multiple predictors, including macroeconomic indicators, and highlighted the limitations of the ASAE approach, advocating for more comprehensive datasets in model construction.
Perry and Glyer [22] investigated the value loss rate of tractors by analyzing auction records from 1984 to 1988. Their study employed a multifaceted approach, utilizing price per power unit (HP) as the response variable and incorporating tractor engine power, age, condition rating, and auction region as predictor variables. A Box–Cox flexible functional form was employed for the statistical analysis. The study emphasized the necessity of considering multiple factors and employing sophisticated statistical techniques to accurately estimate the value loss rate of tractors, thereby offering invaluable insights for farmers and stakeholders in the agricultural industry.
Cross and Perry [23,24] conducted a similar study using auction sale data from 1985 to 1988. Their analysis mirrored previous studies, incorporating similar predictors and interaction terms. The hypothesized interactions aligned with those of [21,22]. The model yielded an RSqAdj value of 0.8032, reinforcing the importance of multiple predictors and highlighting the limitations of the ASAE approach.
Unterschultz and Mumey [25] conducted a comparable study, utilizing data from 1985 to 1988. Their analysis followed a similar framework, incorporating analogous predictors and interaction terms. The hypotheses mirrored previous studies; like their predecessors, they emphasized the significance of multiple predictors and underscored the limitations of the ASAE approach.
Wu and Perry [26] sought to enhance farm equipment depreciation estimation, utilizing 16 years of sale data (1984–1999). Their study updated prior estimates, analyzed potential model issues, and compared forecasting accuracy across functional forms. Auction sale data from the Midwest served as the primary source. The Box–Cox function yielded the highest log-likelihood value but provided marginal improvement over the double square root and sum-of-year’s digit functions. Thus, either of the latter two appears most practical for applied work. This study contributes to more accurate equipment depreciation forecasting, aiding financial decision-making in agriculture.
Fenollosa and Guadalajara [27] aimed to develop models for estimating the market value of second-hand agricultural tractors in Spain. They created a matrix with 12,570 observations and 42 variables, considering temporal, mechanical, locomotive, and safety and comfort factors. An ordinary least squares (OLS) regression was used to construct the depreciation model, while a cluster analysis identified new horsepower groups. The linear-logarithmic model explained 89.8% of the value, with power, age, traction type, air-conditioning, and the manufacturer as major variables.
Wilson [11] aimed to develop a methodology for accurately representing market prices for new and used agricultural tractors. Data on 968 tractors were collected from trade magazines between January and October 2001, including advertised price, age, hours worked, make, and model. List prices when new were adjusted for inflation, and the power rating of each tractor was obtained. Discounts from list prices were calculated, and average discount rates over 1986–2001 were determined. The percentage depreciation was calculated, and dummy variables were constructed for manufacturers. OLS and Box–Cox models were compared for predicting depreciation, with OLS identified as the preferred option. The chosen model incorporated the natural logarithm of the tractor’s age and a variable to account for high first-year depreciation. This model explained 84.2% of variation in depreciation and provided a more precise depiction than conventional methods, contingent on accurate manufacturer discount data.
Daninger and Gunderson [28] investigated tractor depreciation modeling to identify the most accurate functional form for price forecasting. Analyzing two decades of auction sale data across six major brands, they assessed various functional forms, including exponential, Cobb–Douglas, sum-of-year’s-digits, square root, double square root, and linear formulations. Crop price indices and prime rates were utilized to control broader economic conditions. The study discarded the remaining value approach due to market heterogeneity. The results favored the double square root and sum-of-year’s-digits models, with SizeClass indicators reducing variability. Their unique approach offers insights into challenges in determining used tractor values, contributing to the field of tractor depreciation modeling.
ASABE [5] updates STANDARD D497.7, first published in 1997, providing a simplified version of depreciation regressions outlined by [23,24] serving as agricultural machinery depreciation standards. ASAE’s Agricultural Machinery Management Data (ASAE D497.4, 1998) offers a residual value regression method based on Cross and Perry’s work (1996), omitting net farm income as an economic indicator. The regression equation considers machine age in calendar years and annual utilization in hours, derived from auction sale data spanning 1984 to 1993. Tabulated coefficients for various agricultural equipment types, including three sizes of farm tractors, are included in the standard, contributing to machinery depreciation analysis.
Ruiz-Garcia and Sanchez-Guerrero [29] propose leveraging data science to aid farmers in tractor purchasing decisions, recognizing its significance as a major investment. They developed a web-based decision support tool (DST) to address farmers’ primary concerns, particularly regarding price, employing predictive analytic methodologies. The DST utilizes various algorithms, including parametric and non-parametric regression models, to predict prices for both new and second-hand tractors. Utilizing a dataset comprising 227 observations of new tractors and 1003 of second-hand tractors from diverse European countries, the developed models achieved high accuracy, with RSqAdj exceeding 0.99. Employing techniques such as regression trees, support vector machines, ensembles of regression trees, Gaussian process, and neural networks, the DST is operational online, providing free access to assist farmers in making informed tractor purchasing decisions.
Witte et al. [30] aimed to estimate current functions describing the market value of used tractors in Germany, crucial for price assessments and remaining value estimations for internal accounting while emphasizing manufacturer and engine power differences. Departing from previous research, they utilized online advertisements as a data source to estimate market values. Multiple linear regressions were employed to fit various transformations and describe absolute prices, with the exponential model selected for its minimal sum of squared deviations of back-transformed estimates. While online advertisements provided a large dataset, actual sale prices may differ. The study tested whether relations from online ads could predict auction results and highlighted the significance of manufacturer-specific devaluation in estimating actual sale prices, contributing to a more accurate assessment of the German used tractor market.
Herranz-Matey and Ruiz-Garcia [31] address challenges arising from limited transactional data, heightened by non-road diesel emission regulations’ impact on prices and manufacturers’ complex portfolio offerings. They propose a methodology utilizing equivalent new models to absorb price increases due to emission regulations while grouping models into cohorts to enhance dataset size. Evaluating various machine learning-optimized regression models, they recommend a power regression model with the lowest residual mean squared error (RMSE) and highest adjusted coefficient of determination (RSqAdj). This transparent and robust model, fed by publicly available data and operable through mainstream spreadsheets, empowers stakeholders to optimize model selection and investment strategy, ensuring resilience and efficacy in residual value estimation. The model’s flexibility and robustness were rigorously tested against transactional data from tractor auctions [32] and advertisements for harvester combines [33].
In synthesis, numerous studies over time have endeavored to strike a harmonious equilibrium between user-friendliness and regression robustness, consistently finding that the double square root approach achieves this balance optimally (Figure 4). Despite advancements in computational capabilities facilitating access to more intricate non-parametric models, their adoption is deemed unwarranted when dealing with sufficiently extensive datasets. Consequently, the enduring popularity of the double square root coefficients introduced by Cross and Perry in 1988 and endorsed by the ASABE underscores the imperative to revisit and update these coefficients. This revision is essential for accommodating the evolving complexities inherent in contemporary market dynamics, such as the availability of transactional data and product intricacies.
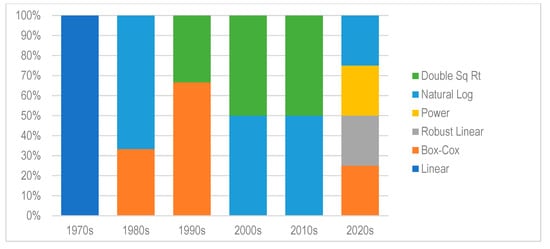
Figure 4.
Agricultural machinery referenced studies regression models evolution grouped by decades.
1.3. Goals
Amidst the extensive literature offering various models and independent variables, the double square root regression approach, originally formulated by Cross and Perry and subsequently adapted by ASABE for North American contexts, has gained widespread acceptance.
In light of existing challenges, there exists a discernible imperative to address divergent data availability in Europe, the evolution of manufacturer’s suggested retail price (MSRP), and the escalating density of original equipment manufacturer (OEM) product offerings. Consequently, there is a pressing need to update the current double coefficients employed in the regression model.
Simultaneously, the authors posit that the prevailing OEM product portfolio necessitates the delineation of distinct power cohorts and the consideration of additional factors to refine the classification of cohorts, thereby enhancing the robustness of agricultural tractor residual value forecasting. This endeavor aims to empower stakeholders to more accurately assess property costs, facilitating data-driven decision-making and ultimately enhancing the success of their enterprises.
2. Materials and Methods
2.1. Dataset
Due to the limited availability of primary data sources and the incomplete nature of secondary sources in Europe, akin to numerous prior investigations, this study relied on online advertisements of three web portals (agriaffaires, traktorpool, and mascus) for used agricultural tractors. Specifically, it focused on professional advertisements for used agricultural tractors exceeding 74 kW with more than 300 operational hours featuring age, working hours, and advertised price. This selection criterion aims to mitigate potential price distortions arising from original equipment manufacturer (OEM) demonstration discounts or the sale of ex-rental units. The study focused on tractors manufactured by major OEMs, including Case IH, Claas, Fendt, John Deere, Massey Ferguson, and New Holland, across various European countries, encompassing Austria, Belgium, Denmark, Estonia, Finland, France, Germany, Italy, Latvia, Lithuania, Netherlands, Norway, Poland, Spain, Sweden, and the United Kingdom
This study analyzed the dataset, consisting of 10,043 unique observations, defined earlier, obtained in November 2023.
2.2. Data Systemization and Preprocessing
ASABE [4], in ASAE EP496.2 DEC99, was used. ASAE states that the depreciation cost reflects the reduction in value of an asset with use and time. The actual total depreciation can never be known until the equipment has been sold; however, an estimated depreciation can be predicted from any of several methods. Different computational methods are used depending upon the objective (for more detailed information, consult an engineering economics textbook).
The residual value (RV) is calculated as follows:
Following Herranz-Matey and Ruiz-Garcia equivalent tractor approach [31,32,33], the following is calculated:
2.3. Data Analysis
ASABE [5] defines remaining value as follows:
Providing the C1, C2, and C3 for tractor cohorts of three sizes, small (S), <60 kW (80 hp); medium (M), 60–112 kW (80–150 hp); and large (L), >112 kW (150 hp).
As the engine power (Pwr) of tractors has experienced substantial growth (Figure 1), new categorizations based on terciles (i.e., dividing data into three equal groups based on their distribution) have been introduced for evaluation purposes. The proposed dataset based terciles are as follows: more than 143 kW (large, L), between 107 and 143 kW (medium, M), and less than 107 kW (small, L).
Several studies conducted since the 1980s have consistently affirmed the significant influence of brand on tractor residual value (RV) [32]. RV, a critical metric in assessing the worth of a tractor over time, incorporates various factors, including the market’s perception of the tractor’s brand, size, model, and specifications, such as transmission type and user interface. Additionally, it considers the tractor’s operational costs, field-proven performance, reliability, and the availability of parts and service support [31].
The OEM (original equipment manufacturer) landscape has witnessed a notable increase in the complexity of product offerings over time, leading to the bundling of specifications into packages tailored to different customer segments [17]. Notably, manufacturers such as AGCO, ARGO, CNH, and SDF have adopted distinct branding strategies, resulting in varying residual values among their respective brands.
Due to constraints regarding access to primary transactional data and the limited availability of detailed secondary data, researchers have resorted to creating cohorts of machines with similar characteristics to overcome these limitations. This approach not only addresses data scarcity but also enhances the robustness of regression analyses, not only within the realm of tractors but also across other products characterized by scarcity and diverse options, such as combines [33].
Given the significant influence of tractor brands on residual value and based on previous studies [17,31,32], brands exhibiting similar depreciation trends have been clustered into three tiers (A, B, and C) (Table 1).

Table 1.
Brand tier cohort grouping details.
Additionally, as the variety of tractor specification combinations has expanded (as illustrated in Figure 2), engine power and two distinct powertrain-based cohorts (Pwr|Prt), namely, those equipped with stepped and stepless transmissions (Table 2), have undergone assessment to determine whether notable price discrepancies influence differential depreciation patterns [31,32].
Table 2.
Powertrain type cohort grouping details.
Ultimately, tractor power, brand tier, and powertrain-based cohorts (Pwr|Brd|Prt) are concurrently utilized to conduct residual value regression analysis.
2.4. Regressin Analysis
Root mean square error (RMSE) and R-squared (Rsq) are widely recognized as robust metrics for assessing the performance and reliability of regression models, each offering unique yet complementary insights.
RMSE quantifies the average discrepancy between predicted and observed values, providing a numerical measure of model accuracy. By computing the square root of the mean of squared differences, RMSE places greater emphasis on larger errors, thereby offering a comprehensive evaluation of predictive performance [34].
In contrast, R-squared evaluates the goodness of fit by gauging the proportion of variance in the dependent variable explained by the independent variables, with values ranging from 0 to 1. A higher R-squared value indicates a better fit of the model to the data [35]. Together, RMSE and R-squared furnish a robust assessment of a regression model’s predictive capacity and its ability to capture the underlying relationships among variables in regression analysis [36].
3. Results
3.1. Regression Analysis
To ascertain the potential impact of incorporating additional features, such as brand tier and powertrain type, into the engine power cohort criteria on the robustness of double square root residual value forecasting, various alternatives have been examined.
As delineated earlier, tractors have been categorized into cohorts predicated on engine power terciles: those with less than 107 kW (small, S), those ranging between 107 and 143 kW (medium, M), and those exceeding 143 kW (large, L). This segmentation into new engine power intervals has demonstrated enhanced forecasting efficacy, characterized by reduced root mean square error (RMSE) and augmented R-squared values (Figure 5).
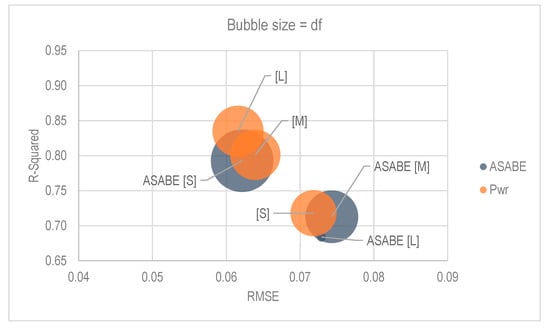
Figure 5.
Revised engine power segment regressions RMSE and R-squared compared to ASABE (bubble size represents degrees of freedom (df)) of ASABE and engine power (Pwr) grouped cohorts.
Moreover, the regression analysis of tractor residuals based on engine power and brand tier cohorts (categorized as A, B, and C) has evinced greater robustness when juxtaposed with engine power-centric cohorts (Figure 6).
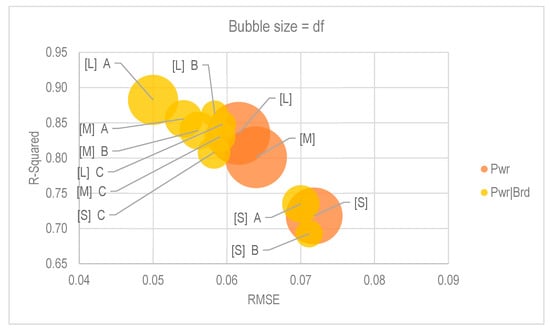
Figure 6.
Revised engine power segment regressions RMSE and R-squared compared to engine power- and brand tier-based cohorts (bubble size represents degrees of freedom (df)) of engine power (Pwr) and engine power and brand (Pwr|Brd) grouped cohorts.
Likewise, the analysis of a tractor residual regression, incorporating engine power and powertrain type cohorts (specifically, stepped (std) and stepless (sls) transmissions), has demonstrated superior robustness compared to the engine power-centric cohorts (Figure 7).
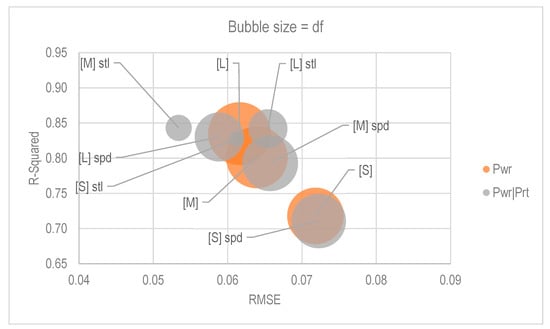
Figure 7.
Revised engine power segment (Pwr) regressions RMSE and R-squared compared to engine power (Pwr|Prt)- and powertrain type-based cohorts (bubble size represents degrees of freedom (df)).
Furthermore, the tractor residual regression analysis encompassing engine power, powertrain type, and brand tier-based cohorts has exhibited heightened robustness relative to engine power-centric cohorts (Figure 8).
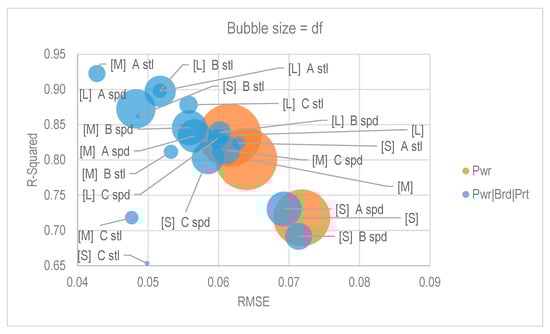
Figure 8.
Revised engine power (Pwr) segments regressions RMSE and R-squared compared to engine power-, brand tier-, and powertrain type (Pwr|Brd|Prt)-based cohorts (bubble size represents degrees of freedom (df)).
Cohorts comprising engine power, brand tier, and transmission type have demonstrated superior performance in double square root regression compared to scenarios involving solely engine power and brand tier, engine power and transmission type, and engine power alone (Figure 9, Table 3).
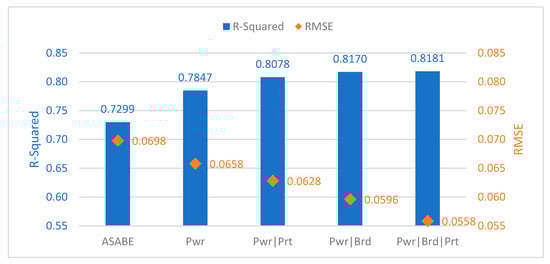
Figure 9.
Averaged RMSE and R-squared of the different analyzed cohort criteria (engine power groups (Pwr), engine power and powertrain type (Pwr|Prt), engine power and brand tier (Pwr|Brd) and engine power, brand tier and powertrain (Pwr|Brd|Prt)).
Table 3.
Studied cohort regression RMSE and R-Squared results.
3.2. Residual Value
The updated regressions based on engine power terciles reveal a notable trend: tractors with higher power levels experience a faster rate of depreciation compared to those with lower power levels. Specifically, the residual values at 10 years and 500 h per year (HPY) demonstrate this pattern: <107 kW: 0.499, 107–143 kW: 0.423, and >143 kW: 0.384 (Figure 10.)
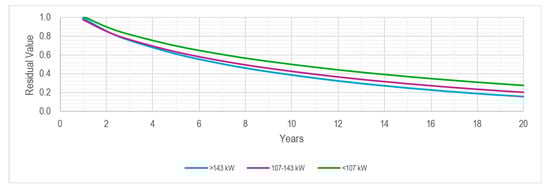
Figure 10.
Tractor residual value double square root regression of revised engine power (Pwr)-based cohorts (500 HPY).
Moreover, the regression analysis based on engine power and transmission type cohorts reveals that tractors equipped with stepped transmissions exhibit superior value retention, particularly within the >143 kW segment, and to a lesser extent, within the <107 kW segment, with the exception of the 107–143 kW segment (Figure 11).
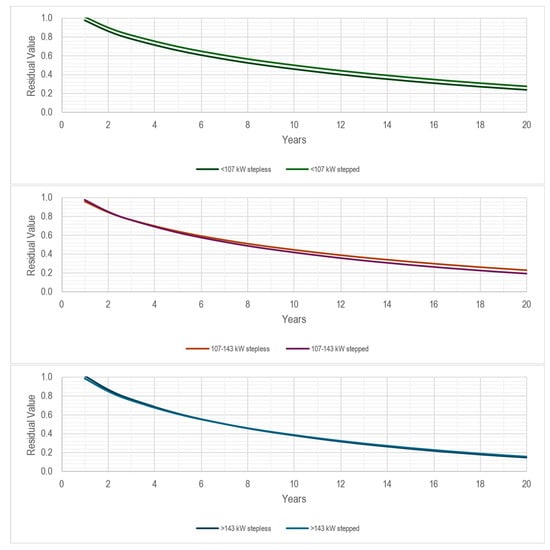
Figure 11.
Tractor residual value double square root regression of revised engine power- and powertrain type (Pwr|Prt)-based cohorts (500 HPY).
Furthermore, the double square root regression analysis of tractor residual values, considering engine power- and brand tier-based cohorts, elucidates that brand tier A demonstrates superior residual values across all power segments, whereas brand tier B exhibits better residual values in lower power segments compared to brand tier C, a trend that reverses in larger power segments (Figure 12).
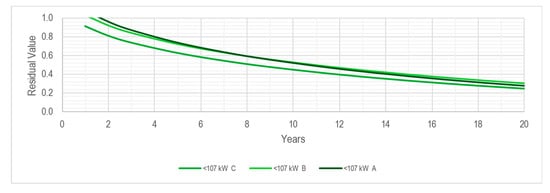
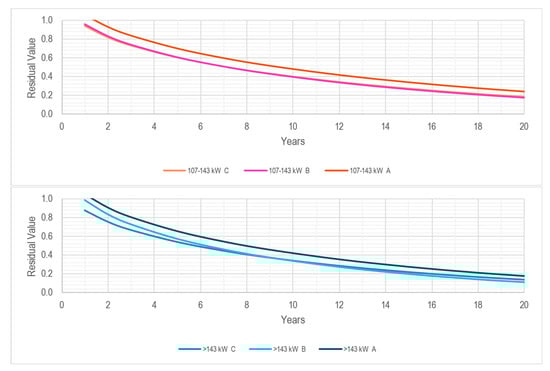
Figure 12.
Tractor residual value double square root regression of revised engine power- and brand tier (Pwr|Brd)-based cohorts (500 HPY).
Lastly, the double square root regression analysis encompassing engine power-, brand tier-, and transmission type-based cohorts confirms the trends observed in the stepped transmission cohorts (Figure 13) and accentuates them further in the case of stepless transmissions (Figure 14).
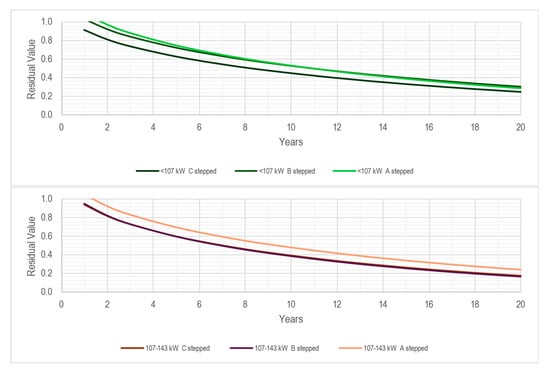
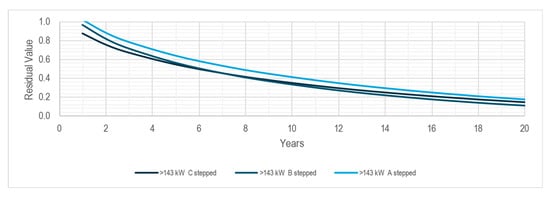
Figure 13.
Tractor residual value double square root regression of revised engine power-, brand tier-, and powertrain type (Pwr|Brd|Prt)-based cohorts of stepped transmission tractors (500 HPY).
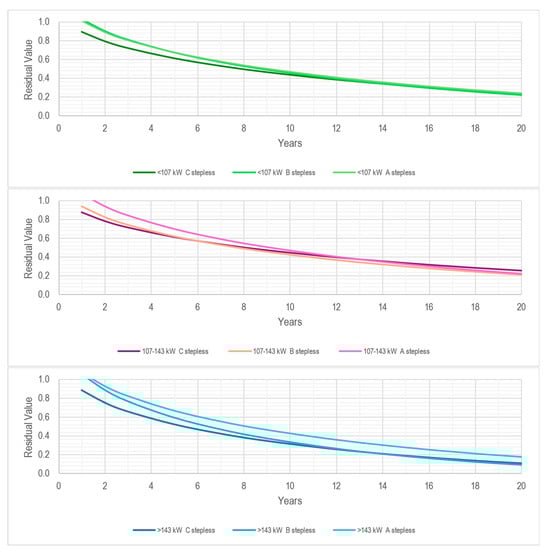
Figure 14.
Tractor residual value double square root regression of revised engine power-, brand tier-, and transmission type (Pwr|Brd|Prt)-based cohorts of stepless transmission tractors (500 HPY).
4. Discussion
The reappraisal of the double square root regression defined in ASABE STARNDARD D497 provides enhanced predictive accuracy in the European tractor residual value estimation.
Prior research has established a correlation between tractor power and distinct residual value behavior, leading to the formation of cohorts based on tractor engine power. The intensification of tractor power has reached a level where utility tractors now possess equivalent power to row-crop tractors from six generations prior, necessitating a novel segmentation of engine power. The implementation of new engine power segments, derived from dataset terciles, has resulted in enhancements in both the root mean square error (RMSE), which declined from 0.0698 to 0.06589, and the R-squared value, which escalated from 0.7299 to 0.7847 (Figure 5).
The complexity of the product portfolio has amplified, and the transmission type, which is associated with the user interface (i.e., electronic controls superseding mechanical controls, thereby enabling the utilization of electronic control units that offer operation automation functionality), serves as a crucial differentiator in both productivity and efficiency (Figure 2). It also influences purchasing capacity requirements (Figure 3), thereby impacting the residual value behavior of the tractor. This necessitates the continuous expansion of tractor cohorts with additional dimensions to enhance predictive accuracy. Subsequent regression analyses, based on cohorts of both engine power and transmission type, have demonstrated further improvements in both RMSE (decreasing from 0.0658 to 0.0628) and R-squared (increasing from 0.7847 to 0.8078) compared to analyses based solely on engine power cohorts (Figure 6).
Additional studies have also indicated that the brand is another determinant that drives distinct residual value behavior, leading to the creation of cohorts based on tractor engine and brand tier. Moreover, the utilization of brand type-based cohorts in lieu of transmission type-based cohorts has resulted in reductions in RMSE (decreasing from 0.0628 to 0.0596) and enhancements in R-squared (increasing from 0.8078 to 0.8170) (Figure 7).
Furthermore, the integration of cohorts based on engine power, brand tier, and transmission type in regression analyses has culminated in even more robust results, as evidenced by further reductions in RMSE (decreasing from 0.0596 to 0.0558) and improvements in R-squared (increasing from 0.8170 to 0.8181) (Figure 8).
In all scenarios, the residual value of larger tractors depreciates more rapidly than that of smaller tractors. Tractors with lower engine power attract a larger customer base due to the prevalence of smaller-scale farming and livestock operations and the fact that smaller tractors may serve a secondary role even in larger operations (Figure 10).
Tractors equipped with stepless transmissions exhibit a lower residual value compared to their counterparts featuring stepped transmissions. This factor is more pronounced in the lower engine power segments, as the introduction of this type of transmission to these segments is relatively recent. Furthermore, the customer demographic for these segments tends to be more risk averse and/or price sensitive due to the size of the farm and livestock operations and the secondary role assigned to the tractor (Figure 11).
Top-tier brands maintain a higher residual value across all power segments. The remaining brand tiers exhibit stronger residual value retention in different engine power categories, as they have traditionally concentrated more on certain engine power segments than others (Figure 12).
When both the transmission type and brand tier are considered in conjunction with engine power segments to form distinct regression cohorts, the residual value behavior remains consistent for stepped transmissions (which are more prevalent in the market and therefore influence the overall behavior) (Figure 13). However, the behavior is more extreme for tractors featuring stepless transmissions (Figure 14), as the brand significantly impacts factors such as years of market presence, productivity, reliability, and the capacity for maintenance and service to support them.
The complexity of the product portfolio is larger in the smaller power segment (Figure 2); therefore, they might require further category-based cohort regressions in order to obtain more forecast robustness and consider extending the study to the less frequent and more feature-diverse high-value crop specialty tractors for orchards, vineyards, and horticulture.
5. Conclusions
The dynamic shifts in product dimensions and intricacy, alongside substantial price escalations attributed to adherence to road diesel emission regulations and the adoption of web-based platforms for used tractor advertisements to mitigate the scarcity of primary and detailed secondary sources in Europe, underscore the necessity for a reassessment of the double square root regression prescribed in ASABE STANDARD D497 [5]. This reassessment is aimed at refining predictive accuracy in estimating tractor residual values within the European context.
The refinement of engine power segmentations based on dataset percentiles, coupled with the incorporation of the brand tier and transmission type as criteria for cohort grouping, has fortified the resilience of the regression model. This enhancement is manifested in the reduction in root mean square error (RMSE) to 0.0558 and the increase in the R-squared value to 0.8181, contrasting with an RMSE of 0.0698 and an R-squared value of 0.7299 associated with the prevailing ASABE coefficients.
Furthermore, this methodology has facilitated a data-centric comprehension of market attributes, including productivity, reliability, and maintenance serviceability, all of which are influenced by brand dynamics and have a quantifiable impact on tractor residual values.
The reappraisal of the double square root regression framework furnishes heightened predictive precision to various stakeholders, encompassing manufacturers, resellers, financiers, insurers, and end-users. Consequently, these stakeholders are empowered to conduct informed analyses that optimize decision-making processes, thereby enhancing the overall efficacy of their endeavors.
Author Contributions
Conceptualization, I.H.-M.; methodology, I.H.-M. and L.R.-G.; validation, I.H.-M.; formal analysis, I.H.-M. and L.R.-G.; investigation, I.H.-M. and L.R.-G.; resources, I.H.-M.; data curation, I.H.-M.; writing—original draft preparation, I.H.-M. and L.R.-G.; writing—review and editing, I.H.-M. and L.R.-G.; supervision, L.R.-G. All authors have read and agreed to the published version of the manuscript.
Funding
This study received no external funding.
Institutional Review Board Statement
Not applicable.
Data Availability Statement
If necessary, we can provide raw data.
Acknowledgments
The authors would like to thank Pilar Linares for her support and “Tractores y Máquinas” (https://www.tractoresymaquinas.com/) for providing the IT infrastructure for this study.
Conflicts of Interest
The authors declare no conflicts of interest.
References
- FAO. Handbook on Agricultural Cost of Production Statistics; FAO: Rome, Italy, 2016. [Google Scholar]
- Kay, R.D.; Edwards, W.M.; Duffy, P.A. Farm Management, 7th ed.; McGraw-Hill: New York, NY, USA, 2020. [Google Scholar]
- Kastens, T. Farm Machinery Operations Cost Calculations; Kansas State University Agricultural Experiment Station and Cooperative Extension Service: Manhattan, KS, USA, 1997. [Google Scholar]
- ASABE. Agricultural Machinery Management Data ASAE Standard EP496.2 Agricultural Machinery Management; ASABE: Joseph, MI, USA, 1999. [Google Scholar]
- ASABE. Agricultural Machinery Management Data ASAE Standard D497.7 Agricultural Machinery Management Data; American Society of Agricultural and Biological Engineers: Joseph, MI, USA, 2020. [Google Scholar]
- Gransberg, D.D.; Popescu, C.M.; Ryan, R. Construction Equipment Management for Engineers, Estimators, and Owners; CRC Press: Boca Raton, FL, USA, 2006; ISBN 0429136250. [Google Scholar]
- Edwards, W. FM1900/AgDM A3-30, Replacement Strategies for Farm Machinery; Iowa State University. Extension and Outreach: Ames, IA, USA, 2019. [Google Scholar]
- ECB Haircuts. Available online: https://www.ecb.europa.eu/ecb/educational/explainers/tell-me-more/html/haircuts.en.html (accessed on 24 December 2023).
- ACEA. Economic and Market Report. State of the EU Auto Industry. Full-Year 2021; European Automobile Manufacturers’ Association (ACEA): Brussels, Belgium, 2022. [Google Scholar]
- CEMA. Economic Press Release Tractor Registrations 2021; CEMA aisbl—European Agricultural Machinery: Brussels, Belgium, 2022. [Google Scholar]
- Wilson, P. Estimating Tractor Depreciation: The Impact of Choice of Functional Form. J. Farm Manag. 2010, 13, 799–818. [Google Scholar]
- Posada, F.; Isenstadt, A.; Badshah, H. Estimated Cost of a Diesel Emissions-Control Technology to Meet Future California Low NOx Standards in 2024 and 2027; The International Council of Clean Transportation: Washington, DC, USA, 2020. [Google Scholar]
- EC Directive 97/68/EC of the European Parliament and of the Council of 16 December 1997; European Commission (EC): Brussels, Belgium, 1997.
- EC Directive 2000/25/EC of the European Parliament; European Commission (EC): Brussels, Belgium, 2000.
- EC Directive 2004/26/EC of the European Parliament and of the Council of 21 April 2004 Amending Directive 97/68/EC; European Commission (EC): Brussels, Belgium, 2004.
- EC Directive 2009/30/EC of the European Parliament and of the Council of 23 April 2009 Amending Directive 98/70/EC; European Commission (EC): Brussels, Belgium, 2009.
- Herranz-Matey, I.; Ruiz-Garcia, L. New Agricultural Tractor Manufacturer’s Suggested Retail Price (MSRP) Model in Europe. Agriculture 2024, 14, 342. [Google Scholar] [CrossRef]
- Weersink, A.; Stauber, S. Optimal Replacement Interval and Depreciation Method for a Grain Combine. West. J. Agric. Econ. 1988, 13, 18–28. [Google Scholar]
- Leatham, D.J.; Baker, T.G. Empirical Estimates of the Effects of Inflation on Salvage Values, Cost and Optimal Replacement of Tractors and Combines. North Cent. J. Agric. Econ. 1981, 3, 109–117. [Google Scholar] [CrossRef]
- Reid, D.W.; Bradford, G.L. On Optimal Replacement of Farm Tractors. Am. J. Agric. Econ. 1983, 65, 326–331. [Google Scholar] [CrossRef]
- Perry, G.M.; Bayaner, A.; Nixon, C.J. The Effect of Usage and Size on Tractor Depreciation. Am. J. Agric. Econ. 1986, 72, 317–325. [Google Scholar] [CrossRef]
- Perry, G.M.; Glyer, D.J. Durable Asset Depreciation: A Reconciliation between Hypothesis. Rev. Econ. Stat. 1990, 72, 524–529. [Google Scholar] [CrossRef]
- Cross, T.L.; Perry, G.M. Depreciation Patterns for Agricultural Machinery. Am. J. Agric. Econ. 1995, 77, 194–204. [Google Scholar] [CrossRef]
- Cross, T.L.; Perry, G.M. Remaining Value Functions for Farm Equipment. Appl. Eng. Agric. 1996, 12, 547–553. [Google Scholar] [CrossRef]
- Unterschultz, J.; Mumey, G. Reducing Investment Risk in Tractors and Combines with Improved Terminal Asset Value Forecasts. Can. J. Agric. Econ. 1996, 44, 295–309. [Google Scholar] [CrossRef]
- Wu, J.; Perry, G.M. Estimating Farm Equipment Depreciation: Which Functional Form Is Best? Am. J. Agric. Econ. 2004, 86, 483–491. [Google Scholar] [CrossRef]
- Fenollosa, M.; Guadalajara, N. An Empirical Depreciation Model for Agricultural Tractors in Spain. Span. J. Agric. Res. 2007, 5, 130–141. [Google Scholar] [CrossRef]
- Daninger, N.; Gunderson, M.A. The Pricing and Depreciation Patterns of Used Tractors. In Proceedings of the Agricultural and Applied Economics Association 2017 Annual Meeting, Chicago, IL, USA, 30 July–1 August 2017. [Google Scholar]
- Ruiz-Garcia, L.; Sanchez-Guerrero, P. A Decision Support Tool for Buying Farm Tractors, Based on Predictive Analytics. Agriculture 2022, 12, 331. [Google Scholar] [CrossRef]
- Witte, F.; Back, H.; Sponagel, C.; Bahrs, E. Remaining Value Development of Tractors—A Call for the Application of a Differentiated Market Value Estimation. Agric. Eng. 2022, 77. [Google Scholar] [CrossRef]
- Herranz-Matey, I.; Ruiz-Garcia, L. A New Method and Model for the Estimation of Residual Value of Agricultural Tractors. Agriculture 2023, 13, 409. [Google Scholar] [CrossRef]
- Herranz-Matey, I.; Ruiz-Garcia, L. Agricultural Tractor Retail and Wholesale Residual Value Forecasting Model in Western Europe. Agriculture 2023, 13, 2002. [Google Scholar] [CrossRef]
- Herranz-Matey, I.; Ruiz-Garcia, L. Agricultural Combine Remaining Value Forecasting Methodology and Model (and Derived Tool). Agriculture 2023, 13, 894. [Google Scholar] [CrossRef]
- James, G.; Witten, D.; Hastie, T.; Tibshirani, R. An Introduction to Statistical Learning; Springer: Berlin/Heidelberg, Germany, 2013; Volume 112. [Google Scholar]
- Kutner, M.H.; Nachtsheim, C.J.; Neter, J.; Li, W. Applied Linear Statistical Models; McGraw-Hill: New York, NY, USA, 2005; ISBN 0072386886. [Google Scholar]
- Chatterjee, S.; Hadi, A.S. Regression Analysis by Example; John Wiley & Sons: Hoboken, NJ, USA, 2015; ISBN 1119122732. [Google Scholar]
Disclaimer/Publisher’s Note: The statements, opinions and data contained in all publications are solely those of the individual author(s) and contributor(s) and not of MDPI and/or the editor(s). MDPI and/or the editor(s) disclaim responsibility for any injury to people or property resulting from any ideas, methods, instructions or products referred to in the content. |
© 2024 by the authors. Licensee MDPI, Basel, Switzerland. This article is an open access article distributed under the terms and conditions of the Creative Commons Attribution (CC BY) license (https://creativecommons.org/licenses/by/4.0/).