Article

Using Cover Crops as Means of Controlling Weeds and Reducing the Applied Quantity of Glyphosate-Based Herbicide in No-Till Glyphosate Tolerant Soybean and Corn

by
Jérôme Bernier Brillon
*,
Marc Lucotte
,
Ariane Bernier
,
Myriam Fontaine
and
Matthieu Moingt
GEOTOP & Institute of Environmental Sciences, University of Quebec at Montreal, 201 Avenue du Président-Kennedy, Montréal, QC H2X 3Y7, Canada
*
Author to whom correspondence should be addressed.
Agriculture 2024, 14(5), 659; https://doi.org/10.3390/agriculture14050659
Submission received: 26 January 2024 / Revised: 19 April 2024 / Accepted: 20 April 2024 / Published: 24 April 2024
(This article belongs to the Special Issue Benefits and Challenges of Cover Crops in Agricultural Systems)

Abstract

:
Weeds represent a serious drawback affecting the productivity of field crops worldwide. While the most common approach to control weeds in no-till practices is the use of glyphosate-based herbicides (GBHs), reducing their use represents a major challenge. This two-year field study aims to evaluate whether the use of cover crops (CC) in transgenic soybean and corn productions can (1) help control weeds and (2) reduce the amount of GBH needed for managing weeds. Sampling was carried out in 32 experimental field plots (four crop managements with four replicates on both crops). Crop managements consisted of GBH applications at rates of 0.84, 1.67, and 3.3 L ha−1 in plots in direct seeding with CC (DSCC) and at rates of 3.3 L ha−1 in plots without CC (DS). Weed cover rates, plant parameters (fresh and dry weights and heights), grain yields, water, and cation contents in soil were considered as indicators of interspecific competition. Results obtained in both years show that it is possible to reduce GBH use by 50% in plots with CC compared to plots without CC using a rate of GBH application of 3.33 L ha−1 (DS 3.3). However, weeds had a large impact on water content in soil, which was reflected by smaller plants and lower yields in plots with only 0.84 L ha−1 of GBH applied. In the context of the study, the use of CCs seems to facilitate the development of more sustainable agriculture while reducing the quantities of GBH generally used.

1. Introduction

Despite technological, genetic, and chemical advances in recent decades, weed control remains one of the greatest challenges in field crop operations [1]. Weeds currently represent the greatest threat to yields compared to other pests in agriculture [2,3]. Weeds can compete directly with crops of interest for access to resources, which contributes to yield loss and profitability for producers [4,5]. It is estimated that the presence of weeds represents losses up to 50–52% in soybeans and corn yield in Canada and the United States, which represents billions of dollars in losses annually [6,7]. Mechanical tillage and herbicides used as burnout before crop implantation have historically been the most widely used conventional approach to weed control in North America [8]. Since the 1950s and the Green Revolution, herbicide use has increased dramatically due to the low cost of the products, the ease of use, and the ability to reduce the amount of labor required to control weeds [3,8]. Currently, 60% of the herbicide market is attributed to four mechanisms of action (EPSP synthase, auxin, acetolactate synthase, acetyl-CoA carboxylase) [9,10]. As a counterpart, the intensive use of herbicides with these mechanisms of action has contributed significantly to 530 actual cases of herbicide resistance globally [11], and this problem may increase with the impact of climate change [10,12].
In recent decades, direct seeding (DS) has been put forward to limit the degradation and loss of fertility of agricultural soils caused by compaction and soil erosion caused by intensive mechanical tillage [13]. DS systems help maintain soil carbon content and soil functions [14,15,16]. DS systems have been widespread in the world since 1996, and their adoption by producers has been greatly enhanced after the introduction of genetically modified herbicide-resistant seeds such as glyphosate tolerant (GT) cultivars [17,18]. Currently, glyphosate-based herbicides (GBH), with glyphosate (C3H8NO5P; N-(phosphonomethyl)glycine) as the main active ingredient, are the most widely used herbicides [19,20]. The combination of GBH and GT seeds in direct seedlings has helped reduce excessive tillage and the related rapid decline in soil quality in many agroregions around the world [21]. The great popularity surrounding GBH has greatly limited the research and development of herbicides with new mechanisms of action and no history of weed resistance [20,22]. However, reduced tillage in DS limits the number of weeds typically controlled mechanically, making DS vulnerable to weeds and herbicide resistance [16]. Also, despite the effectiveness of GBH, there are now 59 weeds resistant to GBH [11]. Producers are now forced to use larger quantities of GBH, to combine GBH with different types of herbicides, or to increase mechanical tillage [9,16]. Also, despite the current criticism and debate surrounding the use and impact of GBH and its impact on humans and environmental health, a ban on its use does not seem feasible without significant economic and environmental repercussions [19,23,24,25]. Weed management in field crops is currently at an impasse, which requires the development of alternatives to control weeds and potentially substitute GBH and other herbicides used.
The purpose of this two-year field study is to determine if the use of cover crops (CCs) is an option for weed control and if their use is a good alternative to reduce the use of GBH in transgenic corn (Zea mays L.) and soybean (Glycine max [L.] Merr.) in DS crops. CCs allow one to occupy space, reduce the time the soil is bare, and limit the establishment and densification of weeds between production periods [26]. However, this approach is still marginal in DS management in soybean and corn crops. Furthermore, many producers believe that CC represents more labor and can compete with crops of interest, which limits their adoption [27]. This study also aims at understanding if interspecific competition may exist between CC, weeds, and crops of interest. Few studies have combined CCs and the use of GBH before, making this study suitable for outlining the benefits of using CCs to reduce the use of GBH in soybean and corn crops.

2. Materials and Methods

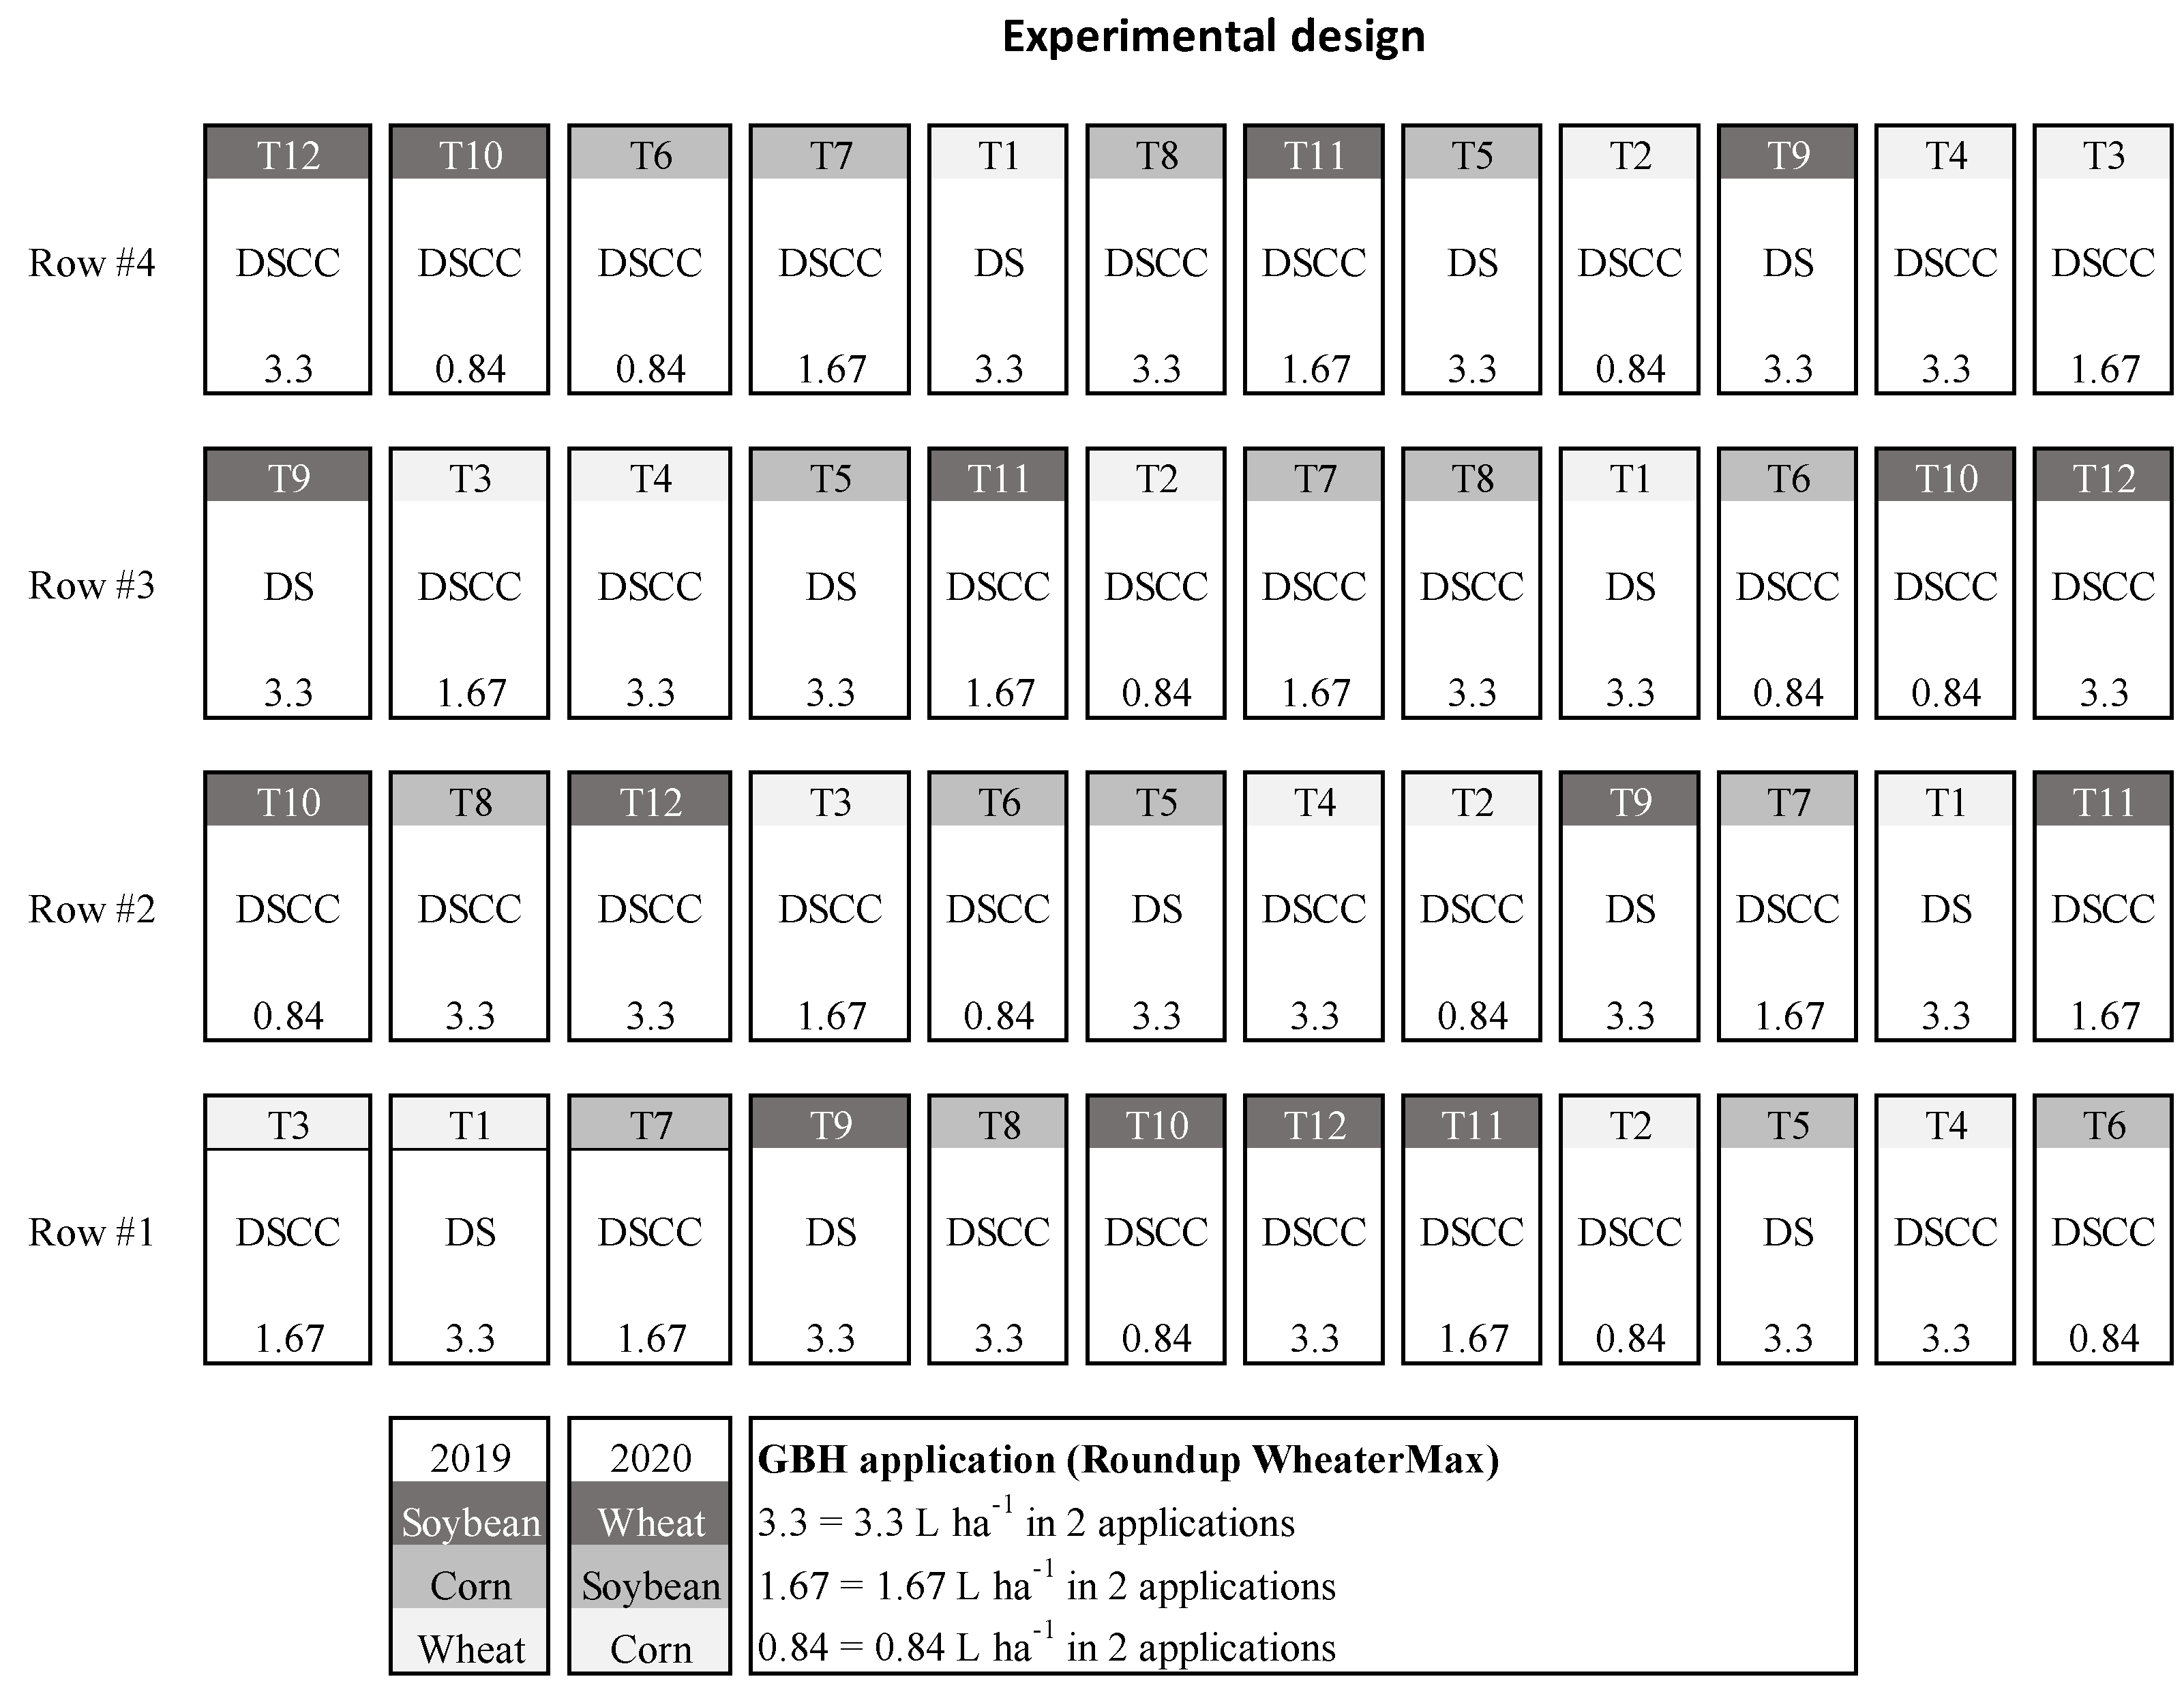
2.1. Site Description and Experimental Design

The study was conducted in an open field over two years, 2019 and 2020, at the Grain Research Center (CEROM) located in St-Mathieu-de-Beloeil, Quebec, Canada. The plots were established in 2018 on a humic Gleysol soil type represented by a heavy clay texture (mean ± standard deviation percentage of clay: 72.625 ± 0.916%, loam: 27.375 ± 0.916%, and sand: 0%). The soil mineral content on the 0–20 cm horizon was measured when the plots were implanted (12.87 ± 2.51 mg kg−1 for P, 313.50 ± 20.84 mg kg−1 for K, 2943.42 ± 219.62 mg kg−1 for C, 803.17 ± 48.27 mg kg−1 for Mg, 1056.71 ± 19.32 mg kg−1 for Al, 11.00 ± 0.47 mg kg−1 for Cu, 217.54 ± 13.92 mg kg−1 for Fe, 24.92 ± 5.72 mg kg−1 for Mn, 2.33 ± 0.18 mg kg−1 for Zn, and 47.60 ± 3.06 mg kg−1 for Na). The experimental design was a randomized complete block design consisting of 48 experimental plots of 9 m × 20 m (Figure 1). The plots were in three different crop rotations (wheat–corn; corn–soybean; soybean–wheat). Only 32 plots were sampled, corresponding to soybean and corn plots in crop rotations (plots from the soybean–wheat and corn–soybean rotation in 2019 and plots from the corn–soybean and wheat–corn rotation in 2020). According to Figure 1, this represents 12 crop managements, but only 8 of these were considered in the study. Those 8 crop managements were T5 (corn DS 3.3), T6 (corn DSCC 0.84), T7 (corn DSCC 1.67), T8 (corn DSCC 3.3), T9 (soybean DS 3.3), T10 (soybean DSCC 0.84), T11 (soybean DSCC 1.67), and T12 (soybean DSCC 3.3) for 2019 and T1 (corn DS 3.3), T2 (corn DSCC 0.84), T3 (corn DSCC 1.67), T4 (corn DSCC 3.3), T5 (soybean DS 3.3), T6 (soybean DSCC 0.84), T7 (soybean DSCC 1.67), and T8 (soybean DS 3.3) for 2020 (Figure 1). As shown in Figure 1, the design includes four rows in order to have experimental replicates of each crop management (Row 1, Row 2, Row 3, Row 4). The distance between rows illustrated in Figure 1 is 12 m. The distance between plots arranged in the same row is 2.5 m. The plots were planted with wheat (Hoffman HRF: 8 May 2019 and 25 April 2020), corn GT (P9188AM: 8 May 2019 and 15 May 2020), or soybean GT (Altitude R2: 18 May 2019 and 26 May 2020). Within the plots, wheat and soybean were sown at 19 cm (7.5 inches) and corn at 76 cm (30 inches) apart following the recommendation of agronomists from the Ministry of Agriculture of Quebec (MAPAQ).
Fertilization was made in wheat plots (90 kg of N added 6 June 2019; 90 kg of N and 65 kg of P added 4 June 2020) and in corn plots (90 kg of N and 60 kg of P added 28 June 2019; 50 kg of N and 80 kg of P were added 14 May with an extra 120 kg of N 2 July 2020). No fertilization was performed in soybean plots.
Two sequential applications of GBH (Roundup WeatherMax® with glyphosate a.i. at 540 g L−1) were applied by spraying on each experimental plot cultivated with direct seedlings either without CC (DS) or with CC (DSCC). The first GBH applications were made pre-sowing on 12 April 2019 and 24 April 2020 in corn plots and on 18 May 2019 and 2 June 2020 in soybean plots. The second GBH applications were made at post-emergence (V2 for soybean plots and V3 in corn plots) according to the recommendations of agronomists and the ministry of agriculture [28]. The dates of these second applications were 13 June 2019 and 15 June 2020 in corn plots and 24 June 2019 and 3 July 2020 in soybean plots. Three different doses of GBH were applied in different DSCC plots: 0.84 L ha−1 (DSCC 0.84 with a total of 454 g a.i.), 1.67 L ha−1 (DSCC 1.67 with a total of 902 g a.i.), and 3.3 L ha−1 (DSCC 3.3 with a total of 1782 g a.i.) (Figure 1). Only 3.3 L ha−1 of GBH was applied in DS plots (DS 3.3 with a total of 1782 g a.i.). Weed control between plots was carried out using a rototiller in order to avoid contamination and weed pressure on the plot edges. No GBH application was carried out in the wheat plots. In wheat, Infinity® was applied (at 0.83 L ha−1) in 2019 and 2020.
No CCs were sowed in DS plots, and only residues of previous crops were present on the ground. In each plot, soybean was seeded on the previous year’s corn residues, corn was seeded on previous wheat residues, and wheat was seeded on previous soybean residues.
In the DSCC plots, different CCs were sown depending upon the main crops (Table 1). The CCs were sown by manually broadcasting the seeds in the plots before the emergence of the crop of interest. A Great Plains® seed drill (Great Plains Inc., Salina, KS, USA) was used later in the season when the crop of interest was present (Table 1). The species sown in CCs and the rates of seed per ha used are shown in Table 1. During the growing season, CCs were not controlled with pesticides or mechanical work. All CCs were terminated by frost during the winter. Only autumn wheat planted in the soybean plots had the property of surviving the winter.
Field meteorological data were recorded in 2019 and 2020 by a weather station located at the CEROM main building and approximately 1.1 km from the sampling site [29]. These data included total precipitation and temperature (minimum, maximum and average) recorded hourly each day [29].

2.2. Sampling and Measurements

2.2.1. Weeds Cover Rates

Weed cover rates were obtained by visually estimating the percentage cover in a quadrat of each broadleaf and grass species present. Only the weed cover rates in the soybean and corn phases of the rotation were estimated. Two quadrats (size: 1 m × 0.5 m) were randomly used in each plot. For corn and soybean, data were obtained during three sampling periods. The first sampling periods were pre-sowing 9 May 2019 and 20 May 2020 in the upcoming soybean and corn plots. Apart from winter wheat, the other CCs were not present at that time. Winter wheat was easily identifiable and distinguishable from weeds in the plots. The second one was at post-emergence and after the second GBH application at V2 growth stage for soybean (2 July 2019 and 14 July 2020) and V3 for corn (20 June 2019 and 26 June 2020). The third sampling periods were 19 September 2019 and 24 September 2020 in soybean and corn plots.

2.2.2. Crops Biomass and Height

In each plot, three plants were harvested at the R2-R3 growth stages for soybean and at the V8 growth stage for corn. The fresh weight (FW) and height of the above-ground part of each plant were measured at the time of harvest. Corn and soybean plants were both measured from ground to the extended leaf tip. The collected plants were later placed in an oven at 60 °C for a minimum of 4 days in order to obtain their dry weight (DW).

2.2.3. Grain Yields

Grain yields were measured by each harvester shift in the plots. In order to avoid border bias, the grain harvest used to estimate yields was carried out on the two rows in the center of the plots. The soybean plots were harvested on 15 October 2019 and 31 October 2020, and corn plots were harvested on 29 October and 18 October 2020. Subsequently, grain yields (t ha−1) were adjusted to 13.5% moisture for soybean and to 14.5% for corn in order to obtain a comparative database with others studies.

2.2.4. Soil Water Content

The soil volumetric water content (VWC), defined as the ratio of the volume of water to the unit volume of soil [30], was obtained by time domain reflectometry (Fieldscout TDR 150©, Spectrum Technologies Inc., Aurora, IL, USA). In all plots during 2019 and 2020, measurements with a TDR probe were carried out five times on the 0–20 cm horizon and within 30 cm of the crop stem. These measurements were realized after the second GBH application at the V2 stage for soybean and the V3 stage for corn [28].

2.2.5. Soil Physicochemical Analyses

In each plot, three soil cores were collected at a 0–20 cm horizon and pooled together. Soil sampling was executed at the same three different periods as measurements of weed cover rates. The elementary contents were obtained following the Mehlich-3 extraction for phosphorus (P), potassium (K), calcium (Ca), magnesium (Mg), aluminium (Al), bore (B), copper (Cu), iron (Fe), manganese (Mn), zinc (Zn), sodium (Na), nickel (Ni), cadmium (Cd), chrome (Cr), cobalt (Co) and lead (Pb) [31]. All elementary contents were quantified using an inductively coupled plasma-optical emission spectrometer (ICP-OES; Perkin Elmer Optima 4300DV, Perkin Elmer Inc., Waltham, MA, USA).

2.3. Statistical Analyses

All statistical analyses were carried out using the software jmp16 (SAS Institute Inc., Cary, NC, USA). A Shapiro–Wilk good-fit test was performed to determine the normal distribution of the residuals. A two-way ANOVA with interaction between the two categorical variables (crop managements and years) was carried out for the continuous quantitative variables (weed cover rates, FW, DW, grain yield and plant height).
When no significant interaction was observed with year*crop managements and when significant differences were observed (p ≤ 0.05), a Student’s paired test (parametric) was performed on the means between the crop management for each year. Otherwise, a student’s paired test was made on each group of observations (4 crops management × 2 years = 8 groups) if the interaction was significant. If the distribution of the residuals was not normal, a Wilcoxon test and a Steel–Dwass non-parametric multiple means comparison test were performed to compare variable responses between the four crop managements by years. The use of Student’s paired test and Steel–Dwass was justified considering that each crop managements group had the same number of observations.
Also, simple linear regressions were executed in order to confirm relationships between weed cover rates and soil elementary contents and also between weed cover rates and soil VWC. Both AICC and ICC values were carried out to determine which correlation to consider.

3. Results

The results obtained from the two-way ANOVA are shown in Table 2. Crop management has a significant effect on most crop parameters for soybean GT and for corn GT (Table 2). Differences between the years 2019 and 2020 are observed in soybean plots (plant height) and corn plots (plant FW, plant height and grain yield) (Table 2). The interaction between years and crop managements has a significant effect on grain yield in the corn plots (Table 2).

3.1. Weeds Cover Rates

In soybean plots, the highest weed cover rates were obtained in the DSCC 0.84 plots in 2019 (23.5 ± 2.9%) and DSCC 0.84 plots in 2020 (23.2 ± 1.6%) (Figure 2A). No significant difference was observed between DSCC 1.67 plots (2019: 13.5 ± 1.7% and 2020: 17.8 ± 1.9%) and DS 3.3 plots (2019: 14.5 ± 2.1% and 2020: 17.3 ± 2.4%) (Figure 2A). In 2020, DSCC 3.3 plots (9.5 ± 1.1%) had the lowest weed cover. (Figure 2A).
In corn plots, DSCC 0.84 had significantly higher weed cover compared to DSCC 1.67 and DSCC 3.3 plots in 2019 (26.4 ± 5.3%) and 2020 (25.3 ± 3.7%) (Figure 2C,D). Weed cover rates in DS 3.3 and DSCC 0.84 corn plots were similar in 2019 and 2020 (Figure 2C,D). Weed cover rates in the DSCC 1.67 plots (2019: 15 ± 3.7% and 2020: 16.3 ± 1.6%), DSCC 3.3 plots (2019: 14.4 ± 2.6% and 2020: 12.0 ± 2.1%), and DS 3.3 plots were similar in both study years. However, weed cover rates in the DSCC 3.3 plots were significantly lower than in DS 3.3 plots in 2020 (p = 0.0330) (Figure 2D).

3.2. Crops Weights, Heights and Grain Yields

3.2.1. Soybean Plants

Soybean FW and DW were not significantly different between crop managements in 2019 (Table 3). Similarly, no significant difference was observed for the DW values between crop managements in 2020 (Table 3). For all crop managements combined, DW values were significantly different between 2019 and 2020 (Table 3).
Soybean plants in the DSCC 3.3 plots were significantly taller compared to all other crop management in 2019. Plants in the DSCC 0.87 plots were smaller during both years in soybean and during 2020 in corn compared to plants growing under other crop management plots (Table 3).

3.2.2. Corn Plants

No significant differences were observed for DW and FW between crop managements in 2019 (Table 3). In 2020, FW and DW were similar between plants from DSCC 1.67, DSCC 3.3 and DS 3.3 plots. However, plants in the DSCC 0.84 plots had the lowest FW and DW values in 2020 (Table 3). In general, FW values were significantly lower in 2020 compared to 2019 (p < 0.0001), but no difference in DW values was observed between these years.
In 2019, plant heights in DS 3.3 plots were significantly taller than the three DSCC crop managements (Table 3). In 2020, plants growing in the DSCC 0.84 plots were smaller compared to plants in other crop managements (Table 3).
A strong positive correlation was observed between corn plant height and FW (r2 adjusted = 0.874) and DW (r2 adjusted = 0.842). A weaker positive correlation was also observed between soybean heights and FW (r2 adjusted = 0.361) and DW (r2 adjusted = 0.127) as compared to corn heights.

3.2.3. Grain Yields

Grain yields for soybean and corn were the lowest in the DSCC 0.84 plots in 2019 and 2020 (Table 3). No difference was observed for soybean yields between the DSCC 1.64, DSCC 3.3 and DS 3.3 plots in 2019 and 2020 (Table 3). Corn yields in the DSCC 3.3 plots were significantly lower compared to yields measured in DS 3.3 plots in 2019 (Table 3). However, yields were similar in the DSCC 3.3 and DS 3.3 plots in 2020 (Table 3). Corn yields were not different in the DSCC 1.67 and DS 3.33 plots in 2020 (Table 3).

3.3. Soil Water Content

Soil VWCs in soybean plots were significantly different at the first sampling period between 2019 (28 June) and 2020 (7 July) (Figure 3a,b). On 28 June 2019, VWCs were lower in the DSCC 3.3 plots (18.95 ± 0.81%) compared to DS 3.3 plots (20.79 ± 0.37%) (Figure 3a). On 7 July 2020, VWC were lower in the DSCC 0.84 plots (14.88 ± 1.13%) plots compared to other crop managements (18.64 ± 0.80% in the DSCC 1.67 plots, 19.25 ± 0.70% in the DSCC 3.3 plots and 17.53 ± 0.73% in DS 3.3 plots) (Figure 3b).
VWCs in corn plots were lower in DS 3.3 plots (19.74 ± 0.57%) compared to DSCC 1.64 plots (21.48 ± 0.54%) on 20 June 2019 (Figure 3c). On 27 June 2020, VWCs were lower in DS 3.3 plots (18.96 ± 0.75%) compared to DSCC 0.84 plots (21.37 ± 0.61%) and DSCC 1.64 plots (21.68 ± 0.90%) (Figure 3c). DSCC 3.3 corn plots had higher values compared to DSCC 0.84 plots (11.05 ± 0.44%) on 17 June and 20 June 2020 (12.50 ± 0.45% for DSCC 3.3 plots, 11.80 ± 0.31% for DS 3.3 plots, 10.98 ± 0.46% for DSCC 1.67 plots and 10.42 ± 0.46% for DSCC 0.84 plots) (Figure 3d). On 6 July 2020, VWCs in the DSCC 3.3 plots (14.87 ± 0.52%) and DS 3.3 plots (14.84 ± 0.51%) were similar but higher than in the DSCC 1.64 plots (12.24 ± 0.32%) and DSCC 0.84 plots (12.25 ± 0.35%) (Figure 3d). Moreover, DSCC 0.84 plots (13.18 ± 0.51%) and DSCC 1.64 plots (13.15 ± 0.32%) exhibited lower VWCs compared to DSCC 3.3 plots (16.13 ± 0.69%) and DS 3.3 plots (15.59 ± 0.95%) on 14 July 2020 (Figure 3d). Moreover, no correlation was observed in soybean plots between weed cover rates and VWC in 2019 (r2 adjusted = 0.002) and in 2020 (r2 adjusted = 0.074). In corn plots, no correlation was observed between those two variables in 2019 (r2 adjusted = 0.054). However, a negative correlation was observed in corn plots (r2 adjusted = 0.413) in 2020.

3.4. Soil cation Content Nutriments

Significant differences were observed for Mg (p = 0.05) and Ni (p = 0.0452) contents in soil between crop management (Table 4). Mg contents were lower in DS 3.3 plots (780.35 ± 13.3 mg kg−1) and DSCC 1.64 plots (787.6 ± 6.7 mg kg−1) compared to DSCC 0.84 plots (820.7 ± 25.9 mg kg−1) but similar to DSCC 3.3 plots (794.9 ± 15.0 mg kg−1) (Table 4). Also, Ni contents were lower in the DSCC 0.84 plots (1.29 ± 0.04 mg kg−1) compared to DSCC 1.64 plots (1.45 ± 0.03 mg kg−1) but similar to DSCC 3.3 plots (1.36 ± 0.03 mg kg−1) and DS 3.3 plots (1.39 ± 0.05 mg kg−1) (Table 4). In corn plots, linear regression showed that weed cover rates had a positive correlation with B (r2 adjusted = 0.227), Mn (r2 adjusted = 0.118) and Zn (r2 adjusted = 0.103) contents and a negative correlation with Al (r2 adjusted = 0.213) content. In soybean plots, a linear regression showed that the weed cover rate has a negative correlation with B (r2 adjusted = 0.170), Cu (r2 adjusted = 0.10), and Cr (r2 adjusted = 0.331) contents.

4. Discussion

4.1. The Use of Cover Crop to Control Weeds

In this study, DSCC 3.3 plots present the lowest weed pressure compared to the other crop managements. These results are interesting and demonstrate that by combining cover crops with commonly applied rates of GBH (two application of 1.64 L ha−1), it is possible to significantly reduce the presence of weeds. Although weed cover rates are similar in DS 3.3 and DSCC 3.3 soybean and corn plots in 2019, weed presence is up to 57% lower in the DSCC 3.3 soybean plots and up to 55% lower in the DSCC 3.3 corn plots in 2020 (Figure 2A,B). These results are consistent with those observed in other studies, where the use of CCs reduced weed biomass by 40% to 95% [26,32]. This weed rate reduction may be explained by interspecific competition between CC species and weeds [26,33,34,35], which provides additional weed control on top of GBH impact. Although weed cover rates are lower in the DSCC 3.3 plots, biomass production (FW and DW) and grain yields are similar between the DSCC 3.3 and DS 3.3 maize and soybean plots in both study years (Table 3). These results show that the presence of CCs does not appear to compete with the integrity of the crop of interest and grain yields. This observation is particularly interesting in corn plots, where CCs were present as intercrops during the production period. These results support other observations where the use of CCs such as sunflower and buckwheat as intercrops could provide weed control without reducing soybean yields (Cheriere et al., 2020; Sharma et al., 2021). The variation of soil VWC and elementary contents can also be used as indicator of interspecific competition. No trace of water competition between CCs and crops seems to be observed, whereas soil VWC values are similar between DSCC 3.3 plots and DS 3.3 plots (Figure 3). Similarities are also observed between those plots based on elementary contents (Table 4). This may encourage field crop producers to plant CCs without fearing that they will negatively impact grain yields.
Corn plots are more severely impacted by the presence of weeds than soybean plots. This is demonstrated by a high correlation index between weed cover and soil water content (r2 adjusted = 0.413) in 2020. The scarcity of soil water subsequently has repercussions on the development of corn plants, with the smallest plants observed in plots with the lowest VWC values (Table 3 and Figure 3). The weeds competition for water is probably higher in 2020, given that soil VWCs are generally much lower (p < 0.001) in 2020 (14.4 ± 0.2%) compared to 2019 (20.4 ± 0.2%). The average size of maize plants is also significantly lower in 2020 than in 2019 (p = 0.0038), more so in plots where weeds are more prevalent. For example, the FWs of corn plants in 2020 are on average 56% lower (p < 0.001) and corn plant heights are 14% smaller (p = 0.0046) in the DSCC 0.84 plots (Table 3). However, as suggested by the correlation index, the presence of weeds does not appear to be the only factor influencing soil water content. It was observed in fields under climatic conditions identical to this study that the vapor pressure deficit (Vpd) in crop plants was higher in 2020 [29]. It is well known that Vpd is an indicator of air dryness and that it strongly influences soil evapotranspiration [36,37,38]. This can partly explain why lower FW production (p = 0.0041) and smaller plants (p = 0.0111) were also observed in the DS 3.3 plots in 2020 (Table 3), despite the fact that the presence of weeds in these plots was not the highest (Figure 2B). In plots without CCs, bare soil is more exposed and vulnerable to rising soil temperatures and greater water loss through soil evaporation [39,40,41]. An interesting observation is that, although DSCC 1.64 and DSCC 3.3 plots exhibit lower VWC in 2020, no difference in plant variables is observed between 2019 and 2020 (Table 3 and Figure 3). It seems that the agronomic conditions in these plots have made them more resilient to the presence of weeds and the lack of water.
Among CC species used in this study, some are known to have allelopathic properties, which may partly explain the effectiveness of CCs in controlling weeds. As such, rye, sunflower, oats, and various Brassicaceae (e.g., tillage radish and tillage turnips) are recognized for their allelopathic properties [42,43]. Rye and sunflower are recognized for their ability to produce over 16 different allelopathic compounds, including benzoxazinones [2,4-dihydroxy-1,4(2H)-benzoxazin-3-one (DIBOA) and 2(3H)-benzoxazolinone (BOA), phenyllactic acid and phenolic acids [44,45,46]. Those species can continue to offer allelopathic properties after plant senescence (e.g., after harvesting or freeze death) [43,47]. Residues of Brassicaceae species are also known to have similar properties through the production of glycosinolate, an important allelopathic compound [48,49].

4.2. Influence of CC on GBH Doses of Application

This study suggests that it is possible to reduce GBH doses for weed control when using CCs between crops or as intercrops under no-till practices. In corn and soybean cultivations, DSCC 1.64 plots share many similarities with DS 3.3 plots, such as weed cover rates, grain yields, FW, DW and plant heights. Weed cover rates in the DSCC 1.64 plots were not different from those in DS 3.3 plots in 2019 and 2020 (Figure 2A,B). The use of CCs combined with a reduction in GBH doses connects to the vision of integrated weed management (IWM), which recommends the diversification of approaches to weed control and a reduction in herbicide doses in order to limit the development of herbicide resistance [50,51]. In IWM, the ecological approach is to be prioritized as often as possible with respect to mechanical or chemical treatments. The use of machinery should be sparing and superficial, only when necessary or needed to implement CCs (e.g., stubble ploughing, strip-till, and making furrows to increase sowing success) or to control them (e.g., harvesters, roller-crimpers, knife-rollers) [19,52,53,54,55]. Also, the use of chemical herbicides must be seen as a last resort and be applied carefully following the herbicide resistance risk matrix [51].
It has also been observed in this study that reducing GBH doses to 0.84 L ha−1, i.e., below the minimal dose recommended by manufacturers, already entails risks and visible impacts on crop integrity. DSCC 0.84 plots present the highest weed infestation in soybean and corn cultivation in 2019 and 2020 (Figure 2A,B). The high presence of weeds in the DSCC 0.84 plots seems to have had an impact on plant development and grain yield in both study years and more critically so in 2020 (Table 3). In 2020, we observed that VWC values were lower in the DSCC 0.84 plots during the first and second sampling campaigns, which means interspecific competition for water with weeds may have occurred and impacted the subsequent development of the plants. Soybean and maize plants were indeed statistically smaller with a lower biomass (Table 3). A longer implantation period of CCs during spring may probably help to achieve satisfactory weed control with minimum GBH application. However, this study shows that without a significant presence of CCs during the intercrop period, it is not practicable to reduce the use of GBH along with CCs by up to 75%.

5. Conclusions

This two0year field study showed that the use of CCs combined with GBH may represent an interesting alternative for limiting weeds in field crops. The lowest weed cover rates were observed in the plots where CCs were paired with the 3.3 L ha−1 application of GBH compared to plots without CCs with the same GBH dose applied. The differences between crop managements are more striking in 2020, which can be explained by greater interspecific competition between crops and weeds compared to 2019. It has been observed that the smallest plants were located in plots with the lowest water content. Compared to elementary contents, where no correlation exists with weeds cover, a strong correlation was observed between water content and weed cover in these plots. Moreover, this correlation was strongly attributable to the presence of broadleaf weeds. Finally, many similarities were observed between DS 3.3 plots and DSCC 1.87 plots on weed cover rates, crop plants parameters, and grain yield during both years. These results suggest the possibility of reducing the use of GBH by up to 50% with the use of CCs in soybean cultivation after harvest and as intercrop in corn cultivation. However, without an efficient CCS implantation, it does appear feasible to reduce the use of GBH below 1.87 L ha−1 doses without having negative repercussions on crops.

Author Contributions

Conceptualization, J.B.B., M.M. and M.L.; Methodology, J.B.B., M.M. and M.L.; Validation, J.B.B.; Formal analysis, J.B.B.; Resources, M.M. and M.L.; Data curation, J.B.B., A.B. and M.F.; Writing—original draft, J.B.B.; Writing—review and editing, J.B.B., A.B., M.F., M.M. and M.L.; Visualization, J.B.B.; Supervision, A.B., M.F., M.M. and M.L.; Project administration, M.M. and M.L.; Funding acquisition, M.L. All authors have read and agreed to the published version of the manuscript.

Funding

This research was funded by the Strategic Partnership Program by the Natural Sciences and Engineering Research Council of Canada (NSERC). The grant number is STPGP 506291-17.

Institutional Review Board Statement

Not applicable.

Data Availability Statement

The data presented in this study are openly available in FigShare at https://figshare.com/search?q=10.6084%2Fm9.figshare.25423273.

Acknowledgments

This study would not have been possible without the implication of Blandine Giusti, Genevieve Crisafi, Roman Ferrant, Patrice Hamelin, and Samara Driessen. We also wish to acknowledge the expertise provided by Gilles Tremblay, an agronomist at the Ministère de l’Agriculture, des Pêcheries et de l’Alimentation du Québec (MAPAQ).

Conflicts of Interest

The authors declare no conflicts of interest.

References

  1. Perotti, V.E.; Larran, A.S.; Palmieri, V.E.; Martinatto, A.K.; Permingeat, H.R. Herbicide resistant weeds: A call to integrate conventional agricultural practices, molecular biology knowledge and new technologies. Plant Sci. 2020, 290, 110255. [Google Scholar] [CrossRef] [PubMed]
  2. Oerke, E.-C. Crop losses to pests. J. Agric. Sci. 2006, 144, 31–43. [Google Scholar] [CrossRef]
  3. Clay, S.A. Near-termchallenges for global agriculture: Herbicide-resistant weeds. Agron. J. 2021, 113, 4463–4472. [Google Scholar] [CrossRef]
  4. Harlan, J.R.; de Wet, J.M.J. Some thoughts about weeds. Econ. Bot. 1965, 19, 16–24. [Google Scholar] [CrossRef]
  5. Sharma, G.; Shrestha, S.; Kunwar, S.; Tseng, T.-M. Crop diversification for improved weed management: A review. Agriculture 2021, 11, 461. [Google Scholar] [CrossRef]
  6. Soltani, N.; Dille, J.A.; Burke, I.C.; Everman, W.J.; VanGessel, M.J.; Davis, V.M.; Sikkema, P.H. Potential corn yield losses from weeds in North America. Weed Technol. 2016, 30, 979–984. [Google Scholar] [CrossRef]
  7. Soltani, N.; Dille, J.A.; Burke, I.C.; Everman, W.J.; VanGessel, M.J.; Davis, V.M.; Sikkema, P.H. Perspectives on potential soybean yield losses from weeds in North America. Weed Technol. 2017, 31, 148–154. [Google Scholar] [CrossRef]
  8. Timmons, F.L. A history of weed control in the United States and Canada. Weed Sci. 2005, 53, 748–761. [Google Scholar] [CrossRef]
  9. Heap, I.; Duke, S.O. Overview of glyphosate-resistant weeds worldwide. Pest Manag. Sci. 2018, 74, 1040–1049. [Google Scholar] [CrossRef]
  10. Fernando, N.; Manalil, S.; Chauhan, B.S.; Florentine, S.K.; Seneweera, S. Glyphosate Resistance of C3 and C4 Weeds under Rising Atmospheric CO2. Front. Plant Sci. 2016, 7, 910. [Google Scholar] [CrossRef]
  11. Heap, I. The International Survey of Herbicide Resistant Weeds. Available online: http://www.weedscience.org/Account/FAQ (accessed on 19 February 2024).
  12. Varanasi, A.; Vara Prasad, P.V.; Jugulam, M. Impact of Climate Change Factors on Weeds and Herbicide Efficacy. Adv. Agron. 2016, 135, 107–146. [Google Scholar]
  13. Triplett, G.B.; Dick, W.A. No-tillage crop production: A revolution in agriculture! Agron. J. 2008, 100, 153–166. [Google Scholar] [CrossRef]
  14. Liu, M.; Ussirib, D.A.N.; Lal, R. Soil organic carbon and nitrogen fractions under different land uses and tillage practices. Commun. Soil Sci. Plant Anal. 2016, 47, 1528–1541. [Google Scholar] [CrossRef]
  15. West, T.O.; Marland, G. A synthesis of carbon sequestration, carbon emissions, and net carbon flux in agriculture: Comparing tillage practices in the United States. Agric. Ecosyst. Environ. 2002, 91, 217–232. [Google Scholar] [CrossRef]
  16. Yu, Z.; Lu, C.; Hennessy, D.A.; Feng, H.; Tian, H. Impacts of tillage practices on soil carbon stocks in the US corn-soybean cropping system during 1998 to 2016. Environ. Res. Lett. 2020, 15, 014008. [Google Scholar] [CrossRef]
  17. Derpsch, R.; Friedrich, T.; Kassam, A.; Hongwen, L. Current status of adoption of no-till farming in the world and some of its main benefits. Int. J. Agric. Biol. Eng. 2010, 3, 1–25. [Google Scholar]
  18. Kassam, A.; Friedrich, T.; Derpsch, R. Global spread of Conservation Agriculture. Int. J. Environ. Stud. 2019, 76, 29–51. [Google Scholar] [CrossRef]
  19. Beckie, H.J.; Flower, K.C.; Ashworth, M.B. Farming without Glyphosate? Plants 2020, 9, 96. [Google Scholar] [CrossRef] [PubMed]
  20. Duke, S.O.; Powles, S.B.; Sammons, R.D. Glyphosate-How it became a once in hundred year herbicide and its future. Outlooks Pest Manag. 2018, 29, 247–251. [Google Scholar] [CrossRef]
  21. Farooq, M.; Flower, K.C.; Jabran, K.; Wahid, A.; Siddique, K.H.M. Crop yield and weed management in rainfed conservation agriculture. Soil Tillage Res. 2011, 117, 172–183. [Google Scholar] [CrossRef]
  22. Duke, S.O. The history and current status of glyphosate. Pest Manag. Sci. 2017, 74, 1027–1034. [Google Scholar] [CrossRef] [PubMed]
  23. Brookes, G.; Taheripour, F.; Tyner, W. The Contribution of Glyphosate to Agriculture and Potential Impact of Restrictions on Use at the Global Level. GM Crops Food 2017, 8, 216–228. [Google Scholar] [CrossRef] [PubMed]
  24. Brookes, G. Glyphosate use in Asia and implications of possible restrictions on its use. AgBioForum 2019, 22, 1–26. [Google Scholar]
  25. Kanissery, R.; Gairhe, B.; Kadyampakeni, D.; Batuman, O.; Alferez, F. Glyphosate: Its environmental persistence and impact on crop health and nutrition. Plants 2019, 8, 499. [Google Scholar] [CrossRef] [PubMed]
  26. Osipitan, O.A.; Dille, J.A.; Assefa, Y.; Radicetti, E.; Ayeni, A.; Knezevic, S.Z. Impact of cover crop management on level of weed suppression: A meta-analysis. Crop Sci. 2019, 59, 833–842. [Google Scholar] [CrossRef]
  27. Lemessa, F.; Wakjira, M. Cover crops as a means of ecological weed management in agroecosystems. J. Crop Sci. Biotechnol. 2015, 18, 133–145. [Google Scholar] [CrossRef]
  28. OMAFRA. Guide Agronomique des Grandes Cultures, Publication 811F ed.; l’Ontario, G.d., Ed.; Ministère de l’agriculture, de l’alimentation et des Affaires rurales (OMAFRA): Toronto, ON, Canada, 2017; pp. 1–521. [Google Scholar]
  29. Bernier Brillon, J.; Moingt, M.; Lucotte, M. Influence of no-till system with or without cover crops on stomata sensitivity of glyphosate-tolerant soybeans to vapor pressure deficit. Physiologia 2023, 3, 531–541. [Google Scholar] [CrossRef]
  30. Datta, S.; Taghvaeian, S.; Stivers, J. Understanding Soil Water Content and Thresholds for Irrigation Management; Oklahoma Cooperative Extension Service, Oklahoma State University, Division of Agricultural Sciences and Natural Resources: Stillwater, OK, USA, 2017. [Google Scholar]
  31. Mehlich, A. Mehlich 3 soil test extractant: A modification of Mehlich 2 extractant. Commun. Soil Sci. Plant Anal. 1984, 15, 1409–1416. [Google Scholar] [CrossRef]
  32. Nichols, V.; Carlson, S.; Martinez-Feria, R.; Basso, B.; Weisberger, D.; Basche, A. Cover crops and weed suppression in the U.S. Midwest: A meta-analysis and modeling study. Agric. Environ. Lett. 2020, 5, e20022. [Google Scholar] [CrossRef]
  33. Teasdale, J.R. Contribution of cover crops to weed management in sustainable agricultural systems. J. Prod. Agric. 1996, 9, 475–479. [Google Scholar] [CrossRef]
  34. Petit, S.; Cordeau, S.; Chauvel, B.; Bohan, D.; Guillemin, J.-P.; Steinberg, C. Biodiversity-based options for arable weed management. A review. Agron. Sustain. Dev. 2018, 38, 48. [Google Scholar] [CrossRef]
  35. Woolford, A.R.; Jarvis, P.E. Cover, catch and companion crops: Benefits, challenges and economics for Uk growers. Agricology 2017. [Google Scholar]
  36. Grossiord, C.; Buckley, T.N.; Novick, K.A.; Poulter, B.; Sperry, J.S.; McDowell, N.G. Plant responses to rising vapor pressure deficit. New Phytol. 2020, 226, 1550–1566. [Google Scholar] [CrossRef] [PubMed]
  37. Seager, R.; Hooks, A.; Parkwilliams, A.; Cook, B.; Nakamura, J.; Henderson, N. Climatology, variability, and trends in the U.S. vapor pressure deficit, an important fire-related meteorological quantity. J. Appl. Meteorol. Climatol. 2015, 54, 1121–1141. [Google Scholar] [CrossRef]
  38. Sinclair, T.R.; Devi, J.; Shekoofa, A.; Choudhary, S.; Sadok, W.; Vadez, V.; Riar, M.; Rufty, T. Limited-transpiration response to high vapor pressure deficit in crop species. Plant Sci. 2017, 260, 109–118. [Google Scholar] [CrossRef]
  39. Robertson, G.P.; Gross, K.L.; Hamilton, S.K.; Landis, D.A.; Schmidt, T.M.; Snapp, S.S.; Swinton, S.M. Farming for ecosystem services: An ecological approach to production agriculture. BioScience 2014, 64, 404–415. [Google Scholar] [CrossRef] [PubMed]
  40. Scopel, E.; Triomphe, B.; Affholder, F.; Macena Da Silva, F.A.; Corbeels, M.; Valadares Xavier, J.H.; Lahmar, R.; Recous, S.; Bernoux, M.; Blanchart, E.; et al. Conservation agriculture cropping systems in temperate and tropical conditions, performances and impacts. A review. Agron. Sustain. Dev. 2013, 33, 113–130. [Google Scholar] [CrossRef]
  41. Pimentel, D.; Harvey, C.; Resosudarmo, P.; Sinclair, K.; Kuiz, D.; McNair, M.; Crist, S.; Shpritz, L.; Fitton, L.; Saffouri, R.; et al. Environmental and economic cost of soil erosion and conservation benefit. Science 1995, 267, 1117–1123. [Google Scholar] [CrossRef]
  42. Baraibar, B.; White, C.M.; Hunter, M.C.; Finney, D.M.; Barbercheck, M.E.; Kaye, J.P.; Curran, W.S.; Bunchek, J.; Mortensen, D.A. Weeds in cover crops: Context and management considerations. Agriculture 2021, 11, 193. [Google Scholar] [CrossRef]
  43. Jabran, K.; Mahajan, G.; Sardana, V.; Chauhan, B.S. Allelopathy for weed control in agricultural systems. Crop Prot. 2015, 72, 57–65. [Google Scholar] [CrossRef]
  44. Abbas, T.; Ahmad, A.; Kamal, A.; Nawaz, M.Y.; Jamil, M.A.; Saeed, T.; Abid, M.A.; Ali, H.H.; Ateeq, M. Ways to use allelopathic potential for weed management: A review. Int. J. Food Sci. Agric. 2021, 5, 492–498. [Google Scholar] [CrossRef]
  45. Alsaadawi, I.S.; Sarbout, A.K.; Al-Shamma, L.M. Differential allelopathic potential of sunflower (Helianthus annuus L.) genotypes on weeds and wheat (Triticum aestivum L.) crop. Arch. Agron. Soil Sci. 2012, 58, 1139–1148. [Google Scholar] [CrossRef]
  46. Schulz, M.; Marocco, A.; Tabaglio, V.; Macias, F.A.; Molinillo, J.M.G. Benzoxazinoids in rye allelopathy: From discovery to application in sustainable weed control and organic farming. J. Chem. Ecol. 2013, 39, 154–174. [Google Scholar] [CrossRef] [PubMed]
  47. Scavo, A.; Mauromicale, G. Crop allelopathy for sustainable weed management in agroecosystems: Knowing the present with a view to the future. Agronomy 2021, 11, 2104. [Google Scholar] [CrossRef]
  48. Fahey, J.W.; Zalcmann, A.T.; Talalay, P. The chemical diversity and distribution of glucosinolates and isothiocyanates among plants. Phytochemistry 2001, 56, 5–51. [Google Scholar] [CrossRef] [PubMed]
  49. Bachheti, A.; Sharma, A.; Bachheti, R.K.; Husen, A.; Pandey, D.P. Plant allelochemicals and their various applications. In Co-Evolution of Secondary Metabolites. Reference Series in Phytochemistry; Springer: Cham, Switzerland, 2019; pp. 1–25. [Google Scholar]
  50. Blackshaw, R.E.; Harker, K.N.; O’Donovan, J.T.; Beckie, H.J.; Smith, E.G. Ongoing Development of Integrated Weed Management Systems on the Canadian Prairie. Weed Sci. 2008, 56, 146–150. [Google Scholar] [CrossRef]
  51. Moss, S.; Ulber, L.; den Hoed, I. A herbicide resistance risk matrix. Crop Prot. 2019, 115, 13–19. [Google Scholar] [CrossRef]
  52. Clements, D.R.; Weise, S.F.; Swanton, C.J. Integrated weed management and weed species diversity. Phytoprotection 1994, 75, 1–18. [Google Scholar] [CrossRef]
  53. Harker, K.N.; O’Donovan, J.T. Recent Weed Control, Weed Management, and Integrated Weed Management. Weed Technol. 2013, 27, 1–11. [Google Scholar] [CrossRef]
  54. Davis, A.S. Cover-crop roller–crimper contributes to weed management in no-till soybean. Weed Sci. 2010, 58, 300–309. [Google Scholar] [CrossRef]
  55. Mirsky, S.B.; Curran, W.S.; Mortenseny, D.M.; Ryany, M.R.; Shumway, D.L. Timing of cover-crop management effects on weed suppression in no-till planted soybean using a roller-crimper. Weed Sci. 2011, 59, 380–389. [Google Scholar] [CrossRef]
Figure 1. Randomized complete block design for the twelve different crop managements with direct seeding and cover crops (DSCC) or without cover crops (DS) at St-Mathieu-de-Beloeil.
Agriculture 14 00659 g001
Figure 2. Average and standard error of broadleaf and grassy weed cover rates in (A) soybean plots 2019, (B) soybean plots 2020, (C) corn plots 2019, and (D) corn plots in 2020 (n = 96). All crop managements used direct seedlings without CC (DS) and with CC (DSCC) with different doses of glyphosate-based herbicide (0.84, 1.67, and 3.3 L ha−1). the * and different small letters indicate that mean values are significantly different between crop managements (p < 0.05).
Agriculture 14 00659 g002
Figure 3. Soil volumetric water content in GT soybean plots (A,B) and GT corn plots (C,D) in 2019 and 2020 (n = 60).
Agriculture 14 00659 g003
Table 1. Cover crops mix sown and rates applied in the different type of crop of interest in 2019 and 2020.
YearsCover Crops Mix Sowed
WheatCornSoybean
201912 May: berseem (5 kg ha−1) and crimson clover (5 kg ha−1). Sown manually.19 June: crimson clover (5 kg ha−1), tillage radish (3 kg ha−1) and tillage turnips (2 kg ha−1). Sown manually.6 September: autumn wheat (225 kg ha−1). Sown with a Great Plains® seed drill.
27 August: buckwheat (5 kg ha−1), sunflower (5 kg ha−1), faba bean (15 kg ha−1), tillage radish (3 kg ha−1), phacelia (1 kg ha−1), pea (25 kg ha−1) and oats (20 kg ha−1). Sown with a Great Plains® seed drill.8 September: autumn rye (50 kg ha−1), tillage radish (3 kg ha−1), tillage turnip (2 kg ha−1) and common vetch (10 kg ha−1). Sown with a Great Plains® seed drill.
20201 June: berseem (5 kg ha−1) and crimson clover (5 kg ha−1). Sown manually.28 June: crimson clover (5 kg ha−1), tillage radish (3 kg ha−1 and tillage turnips (2 kg ha−1). Sown manually.6 October: autumn wheat (200 kg ha−1). Sown with a Great Plains® seed drill.
14 August: buckwheat (5 kg ha−1), sunflower (5 kg ha−1), faba bean (15 kg ha−1), tillage radish (3 kg ha−1), phacelia (1 kg ha−1), pea (25 kg ha−1) and oats (20 kg ha−1). Sown with a Great Plains® seed drill.8 September: autumn rye (200 kg ha−1). Sown with a Great Plains® seed drill.
Table 2. Effect of fixed factor (years and crop managements) and their interaction on soybean GT and corn GT crops parameters (weed cover rates, plant fresh weight (FW), plant dry weight (DW), plant height and grain yield).
SoybeanCrop ParametersYearsCrop ManagementsYears*Crop Managements
Weed cover rates0.053<0.0001 *0.9911
Plant (FW)0.6420.0261 *0.6794
Plant (DW)0.0182<0.0001 *0.183
Plant height<0.0001 *0.11130.9751
Grain yield0.067<0.0001 *0.0848
CornCrop ParametersYearsCrop ManagementsYears*Crop Managements
Weed cover rates0.86950.0013 *0.8186
Plant FW<0.0001 *0.0001 *0.1152
Plant DW0.21070.0068 *0.3269
Plant height0.0013 *0.0001 *0.0842
Grain yield<0.0001 *<0.0001 *0.027 *
Note: The bold * indicates that factors (years, crop managements and the years*crop management interaction) have a significant effect (p < 0.05) on each crop parameter according to a two-way ANOVA.
Table 3. Biomass production (fresh weight (FW) and dry weight (DW)), height, and grain yield of soybean and corn plants in 2019 and 2020 (n = 36).
Plant Parameters20192020
DSCC 0.84DSCC 1.67DSCC 3.33DS 3.33p-ValueDSCC 0.84DSCC 1.67DSCC 3.33DS 3.33p-Value
SoybeanFresh weight (FW) (g)31.4 ± 3.6 a33.8 ± 2.94 a37.8 ± 3.5 a35.9 ± 2.7 a0.535226.0 ± 4.6 a31.9 ± 3.4 a41.1 ± 4.2 a35.3 ± 3.2 a0.0597 *
Dry weight (DW) (g)7.5 ± 0.8 a7.9 ± 0.7 a9.1 ± 0.9 a8.0 ± 0.5 a0.5163.9 ± 0.9 a4.6 ± 0.6 a5.9 ± 0.7 a5.0 ± 0.6 a0.2564
Height (cm)49.3 ± 1.6 c53.7 ± 1.2 b54.5 ± 3.1 b58.4 ± 5.8 a0.000448.3 ± 2.7 b56.5 ± 1.6 a60.5 ± 0.9 a61.2 ± 1.2 a<0.001
Grain yield (t ha−1)1.6 ± 0.1 b2.4 ± 0.1 a2.6 ± 0.1 a2.5 ± 0.1 a<0.0011.2 ± 0.4 b2.8 ± 0.3 a3.3 ± 0.3 a3.1 ± 0.1 a0.0008
20192020
DSCC 0.84DSCC 1.67DSCC 3.33DS 3.33p-ValueDSCC 0.84DSCC 1.67DSCC 3.33DS 3.33p-Value
CornFresh weight (FW) (g)116.7 ± 15.4 a118.1 ± 10.1 a140.6 ± 18.8 a173.4 ± 20.9 a0.096251.7 ± 4.8 b91.1 ± 12.3 a111.7 ± 14.4 a101.5 ± 11.2 a0.0004 *
Dry weight (DW) (g)11.8 ± 1.5 a11.2 ± 0.9 a14.0 ± 1.7 a16.0 ± 1.7 a0.11628.8 ± 0.7 b12.3 ± 1.3 a14.1 ± 1.5 a12.8 ± 1.2 a0.0231
Height (cm)93.9 ± 3.7 b94.8 ± 2.9 b100.5 ± 4.0 b111.8 ± 4.2 a0.005480.3 ± 2.3 b92.0 ± 3.0 a99.5 ± 4.3 a94.8 ± 4.5 a0.0042
Significant interaction year*crop managements
20192020
DSCC 0.84DSCC 1.67DSCC 3.33DS 3.33 DSCC 0.84DSCC 1.67DSCC 3.33DS 3.33p-value
Grain yield (t ha−1)6.5 ± 0.5 D8.8 ± 0.2 B8.7 ± 0.4 B10.2 ± 0.6 A 4.0 ± 0.4 E6.1 ± 0.3 D8.1 ± 0.2 BC7.1 ± 0.6 CD<0.027 *
Note: Data are presented as means ± standard error of the mean for each weed management. When no interaction year*crop managements was observed, the * and different small letters indicate that mean values are significantly different between crop managements (p < 0.05) for each year according to a multiple means comparison (post hoc test with letters). Capital letters indicate significant differences between years*crop managements when interaction was observed (p < 0.05) (only for grain yield in corn plots).
Table 4. Elementary contents between crop management with different applied quantities of glyphosate-based herbicides (n=72).
Element (mg kg−1)Crop Managements
DSCC 0.84DSCC 1.67DSCC 3.33DS 3.33p-Value
P13.95 ± 2.54 a12.74 ± 0.82 a11.03 ± 0.68 a16.90 ± 4.66 a0.4797
K320.8 ± 5.0 a331.0 ± 7.0 a320.6 ± 5.1 a318.6 ± 5.2 a0.4051
Ca2897.8 ± 25.2 a2787.5 ± 48.4 a2950.9 ± 55.7 a2940.9 ± 51.3 a 0.0603
Mg820.7 ± 25.9 a787.6 ± 6.7 ab794.9 ± 15.0 ab780.35 ± 13.3 b0.0230 *
Al1043.0 ± 5.6 a1053.2 ± 5.2 a1050.5 ± 4.4 a1049.3 ± 5.1 a0.5423
B0.700 ± 0.012 a0.702 ± 0.016 a0.740 ± 0.014 a0.718 ± 0.020 a0.2438
Cu10.94 ± 0.12 a11.20 ± 0.10 a11.38 ± 0.18 a11.12 ± 0.17 a0.2198
Fe219.0 ± 4.8 a221.7 ± 2.9 a219.2 ± 3.4 a217.4 ± 3.1 a0.8632
Mn21.82 ± 1.00 a20.72 ± 1.07 a23.14 ± 1.06 a22.95 ± 1.54 a0.4503
Zn2.36 ± 0.07 a2.53 ± 0.05 a2.51 ± 0.07 a2.53 ± 0.11 a0.3698
Na44.26 ± 0.84 a44.06 ± 0.94 a45.13 ± 0.78 a44.51 ± 1.03 a0.8519
Ni1.29 ± 0.04 b1.45 ± 0.03 a1.36 ± 0.03 ab1.39 ± 0.05 ab0.0455 *
Cd 0.086 ± 0.002 a0.089 ± 0.001 a0.089 ± 0.002 a0.089 ± 0.002 a0.4941
Cr0.289 ± 0.004 a0.284 ± 0.003 a0.291 ± 0.004 a0.295 ± 0.005 a0.3184
Co 0.446 ± 0.017 a0.451 ± 0.018 a0.468 ± 0.018 a0.475 ± 0.024 a0.6918
Pb 3.49 ± 0.09 a3.73 ± 0.07 a3.85 ± 0.12 a3.63 ± 0.11 a0.0787
Note: The elementary contents were obtained for phosphorus (P), potassium (K), calcium (Ca), magnesium (Mg), aluminium (Al), bore (B), copper (Cu), iron (Fe), manganese (Mn), zinc (Zn), sodium (Na), nickel (Ni), cadmium (Cd), chrome (Cr), cobalt (Co) and lead (Pb). Data are presented as means ± standard error of the mean for each elementary content. Data are presented for corn and soybean plots of the three crop rotations in 2019 and 2020, respectively. The * and different bold small letters indicate that mean values are significantly different (p < 0.05) between the different crop managements according to a multiple means comparison and post hoc test with letters. The non-bold small letters indicate that mean values are not significantly different between crop managements.
Disclaimer/Publisher’s Note: The statements, opinions and data contained in all publications are solely those of the individual author(s) and contributor(s) and not of MDPI and/or the editor(s). MDPI and/or the editor(s) disclaim responsibility for any injury to people or property resulting from any ideas, methods, instructions or products referred to in the content.

