Article

Heterogeneity of Intramuscular, Intermuscular, and Subcutaneous Fat in Laiwu Pigs: Insights from Targeted Lipidomics and Transcriptomics

1
State Key Laboratory of Animal Biotech Breeding, Institute of Animal Science, Chinese Academy of Agricultural Sciences (CAAS), Beijing 100193, China
2
Institute of Genetics and Developmental Biology, Chinese Academy of Sciences, Beijing 100101, China
*
Authors to whom correspondence should be addressed.
The authors contributed equally to this work.
Agriculture 2024, 14(5), 658; https://doi.org/10.3390/agriculture14050658
Submission received: 12 March 2024 / Revised: 16 April 2024 / Accepted: 18 April 2024 / Published: 24 April 2024

Abstract

:
In the livestock industry, an excessive accumulation of subcutaneous fat diminishes the proportion of lean meat, while elevated intramuscular fat (IMF) content is associated with enhanced meat quality. However, the heterogeneity of various fat depots in pigs remains incompletely understood. Comprehensive tissue section, lipidomic, and transcriptomic analyses indicated that the maturity of IMF was significantly less than that of both intermuscular and subcutaneous fats. We identified 467 lipids across 29 lipid classes in total, revealing that IMF exhibits unique lipid composition and transcriptional profiles. More importantly, several lipids, including GalCer, S1P, CL, AcCa, PC-O, PE-O, and sulfatide, are highly enriched in intramuscular fat and may play pivotal roles in neuromodulation, mitochondrial function, lipogenesis, and membrane signaling. In conclusion, we unveiled unique lipid composition and molecular regulatory pathways of porcine IMF, offering new insights for the synergistic breeding that aims at optimizing pig backfat thickness and IMF content.

1. Introduction

Pork ranks as the world’s most-consumed meat, playing a pivotal role in both economic efficiency and human health [1]. The thickness of porcine subcutaneous fat, commonly known as backfat (BF), alongside the intramuscular fat (IMF) content, are two key targets for artificial selection [2]. The backfat thickness is instrumental in determining pig leanness and influences overall pork yield, while IMF content critically impacts the flavor, juiciness, and tenderness of pork, also contributing to marbling—a crucial parameter in assessing pork quality [3]. Given the positive correlation between BF thickness and IMF content [4,5], traditional swine breeding strategies have focused on reducing BF to enhance lean meat yield, inadvertently affecting IMF content (typically below 2.5%) and, consequently, the quality of meat in commercial crossbreeds [6,7]. Given the significant heterogeneity in gene expression, metabolic profiles, and adipokine secretion among different fat depots [8], dissecting the distinct metabolic and molecular characteristics of porcine IMF in comparison to fat from other body regions can offer critical insights for the synergistic enhancement of pork productivity and quality.
Lipids, as the primary constituents of adipocytes, serve three pivotal functions: they form integral parts of cellular membranes (e.g., phospholipids), act as energy reserves (e.g., triglycerides), and function as signaling molecules (e.g., oxylipins) [9]. Consequently, the lipid composition of adipocytes is essential for their functionality and interactions with other organs. Lipidomics, an emerging field, offers novel insights into the biological mechanisms underlying IMF formation, thereby facilitating pork quality enhancement through the comprehensive analysis of lipid types, concentrations, and metabolic pathways [10]. Intramuscular fat, characterized by its deposition within and between muscle fibers, contrasts with intermuscular adipose tissue (IMAT), which resides beneath the deep fascia and between muscle groups [11]. The content of IMF is primarily determined by the quantity and size of intramuscular adipocytes, predominantly comprising over 80% triglycerides, with 5% to 20% of these triglycerides localized in lipid droplets within muscle fibers [12,13]. Previous lipidomic investigations into IMF did not differentiate between myofiber and adipocyte lipids, thereby obscuring the precise metabolic and molecular profiling of intramuscular adipocytes.
The Laiwu pig, with its remarkable IMF content of 10% to 13%, surpasses other local Chinese pig breeds in this aspect [14,15]. This characteristic renders the Laiwu pig an exemplary model for exploring the molecular dynamics of IMF development. Our study aims to elucidate the differences in lipid composition between porcine IMF, BF, and IMAT. Furthermore, it seeks to uncover the unique molecular pathways underlying intramuscular fat formation through transcriptomic analysis.

2. Materials and Methods

2.1. Animal and Samples Preparation

In this study, all six male Laiwu pigs obtained from the original Laiwu pig breeding farm were raised in indoor cofnditions with ad libitum access to feed and water under standardized pig breeding conditions. They were humanely euthanized and slaughtered in the same commercial abattoir at about 300 days of age, at an average body weight of 124.33 ± 13.84 kg after fasting for 12–16 h, following the protocols approved by the Institutional Animal Care and Use Committee of the Institute of Animal Science, Chinese Academy of Agricultural Sciences (31 March 2020, CAAS; No: IAS2020-21). The middle layer of BF, IMAT of the hind leg, and IMF-rich longissimus dorsi muscle (LDM) samples of the Laiwu pigs were collected immediately after slaughter, flash-freezing the samples in liquid nitrogen within 30 min to preserve the integrity of the biological samples, and then stored at −80 °C for subsequent analysis. For the isolation of IMF, the IMF-rich LDM was maintained on Drikold to prevent RNA degradation, and the IMF sample was carefully separated from the LDM using fine tweezers and scalpels, taking care to prevent any contamination with muscle fibers. Once separated, the IMF sample was rapidly flash-frozen in liquid nitrogen. After flash-freezing, the IMF sample was transferred and stored in an ultra-low temperature freezer at −80 °C until RNA and lipid extraction.

2.2. Hematoxylin–Eosin (H&E) Staining

For histological analysis, the middle layer of BF, IMAT of the hind leg, and IMF-rich LDM samples were taken from the Laiwu pigs and fixed in a 4% paraformaldehyde solution. The tissues were then dehydrated, infiltrated with paraffin, and embedded for further processing. The tissues were meticulously sectioned to a uniform thickness of five micrometers using a microtome and carefully mounted onto glass slides. Multiple sections from each specimen were prepared, dewaxed, and stained with H&E to facilitate cellular evaluation. For each specimen, three distinct, non-consecutive sections were treated with the selected stain. Images of these sections were captured using a DS-RI2 microscope (Nikon, Tokyo, Japan). Images from five distinct areas of the adipose biopsy tissue were captured for each slide, across a minimum of five pigs. Adipocyte size was quantitatively assessed by converting pixels to micrometers using Image J software (version: 2.9.0/1.5.3t), ensuring a minimum of 200 adipocytes were analyzed per pig.

2.3. Immunofluorescence Staining

The tissue sections were air-dried at room temperature for 30 m, followed by fixation with cold acetone for 10 min at 4 °C. After fixation, the sections were rinsed with PBS and then blocked with 10% goat serum (Beyotime Biotechnology, Shanghai, China) in PBST for 1 h at room temperature to reduce non-specific binding. Next, the sections were incubated with a primary antibody, Tyrosine Hydroxylase (1:100 dilution, Cat#ab75875, Abcam, Cambridge, UK), at 4 °C overnight to allow for the specific binding of the antibody to its target antigen. On the following day, the sections were thoroughly washed three times with PBST to remove any unbound antibodies. Subsequently, they were incubated with a secondary antibody, goat anti-rabbit IgG H&L, conjugated with Alexa Fluor 488 (1:200 dilution, Cat#ab150113, Abcam, Cambridge, UK), for 1 h at room temperature to enable fluorescent visualization of the bound primary antibody. Finally, the sections were mounted using an aqueous mounting medium containing DAPI (Thermo Fisher Scientific, Waltham, MA, USA) to stain the nuclei, enhancing the contrast and facilitating the identification of cellular structures. The mounted sections were then visualized and captured using a fluorescence microscope (Nikon, Tokyo, Japan).

2.4. Lipidomics Analyses

Lipids were extracted from approximately 30 mg of the frozen middle layer of the BF, IMAT of the hind leg, and IMF samples, respectively, using a modified Bligh and Dyer method, as detailed in a previous report [16]. The lipidomic analyses were performed at LipidALL Technologies (Changzhou, Jiangsu, China) using an ExionLC-AD (Sciex, Framingham, MA, USA) in conjunction with Sciex QTRAP 6500 PLUS (Sciex, Framingham, MA, USA). To separate individual lipid classes of polar lipids, we employed a normal phase (NP)-high-performance liquid chromatography (HPLC) system equipped with a TUP-HB silica column. The separation was achieved using mobile phase A (chloroform:methanol:ammonium hydroxide, 89.5:10:0.5, by volume) and mobile phase B (chloroform:methanol:ammonium hydroxide:water, 55:39:0.5:5.5, by volume). Multiple reaction monitoring (MRM) transitions were configured for the comparative analysis of various polar lipid species. Most individual lipid species were quantified by spiked internal standards from Avanti Polar Lipids (Alabaster, AL, USA) [17]. Specifically, GM3-d18:1/18:0-d3 was sourced from Matreya LLC (Cayman Chemicals, Ann Arbor, MI, USA). Free fatty acids (FFAs) were quantified using d31-16:0 from Sigma-Aldrich (Merck KGaA, Darmstadt, Germany)) and d8-20:4 from Cayman Chemicals (Ann Arbor, MI, USA). TAG(14:0)3-d5, TAG(16:0)3-d5, and TAG(18:0)3-d5 were acquired from CDN Isotopes (Pointe-Claire, QC, Canada).

2.5. Unsupervised Multivariate Data Analyses

Multivariate statistical analysis was performed utilizing MetaboAnalyst 5.0, an online platform for metabolomics data processing (https://www.metaboanalyst.ca/, accessed on 15 April 2024). Principal component analysis (PCA) was initially applied to discern overall patterns and detect potential clustering within the dataset. This was followed by partial least squares discriminant analysis (PLS-DA) and its sparse variant (sPLS-DA) to pinpoint lipids that significantly contribute to group differentiation. Lipids that demonstrated a Variable Importance in Projection (VIP) score exceeding 1.0, coupled with a p-value less than 0.05 in the PLS-DA model, were deemed significantly different between groups. To further scrutinize the variations in lipid profiles, univariate analyses, including Student’s t-test and fold change analysis, were conducted to further evaluate lipid variations. Hierarchical cluster analysis and correlation analysis utilized the heatmap and correlation plot functions, respectively, to explore the relationships and groupings within the data.

2.6. Quantitative Real-Time PCR(qPCR)

Total RNA was isolated from different adipose tissues utilizing RNAiso reagent (Takara, Tokyo, Japan), following the manufacturer’s kit protocol. The PrimeScript RT Reagent Kit with gDNA Eraser (Takara, Tokyo, Japan) was employed to synthesize cDNA from 1 μg of the isolated RNA. Quantitative PCR (qPCR) assays were conducted in duplicate, employing SYBR Green PCR Master Mix on a QuantStudio 3 system (Thermo Fisher Scientific, Waltham, MA, USA) to quantify gene expression levels. The relative gene expression was calculated using the 2−ΔΔCt method, with the 18S serving as the internal control. The design of gene-specific primers was designed using the Primer3 web tool (https://primer3.ut.ee/, accessed on 15 April 2024), which is a widely recognized online resource for the design of PCR primers, and all the primers are detailed in Supplementary Table S1.

2.7. RNA Sequencing (RNA-Seq) Analysis and Differentially Expressed Gene Screening

RNA-Seq and the preparation of sequencing libraries were carried out by Shanghai Personal Biotechnology Co., Ltd. (Shanghai, China). Only RNA samples that exhibited both high purity with an OD260/280 ratio ≥ 2.0 and high integrity with RNA integrity number (RIN) > 7 were selected for the construction of the cDNA library. The comprehensive methodologies for constructing cDNA libraries, performing paired-end (PE) sequencing, executing quality control measures, aligning sequence reads, and calculating FPKM values are thoroughly elaborated in a previous study [18]. For gene expression quantification, HTSeq (version 0.9.1) was utilized to determine read count values for each gene as a measure of initial expression levels, followed by normalization using FPKM. Differential gene expression analysis was subsequently conducted using DESeq2 (version 1.30.0). The genes with a fold change greater than 2.0 and p-value less than 0.05 were identified as significantly differentially expressed.

2.8. Bioinformatic Analysis

The PCA and heatmap analysis of RNA-Seq were performed using the free online Genescloud platform (https://www.genescloud.cn, accessed on 15 April 2024), which is a comprehensive resource for functional annotation and bioinformatics analysis. Gene Ontology (GO) and Kyoto Encyclopedia of Genes and Genomes (KEGG) pathway analyses were carried out through the online DAVID 2022 functional annotation tool (https://david.ncifcrf.gov/home.jsp, accessed on 15 April 2024). The GO terms and KEGG pathways demonstrating a p-value < 0.05 were considered to be statistically significant. Gene set enrichment analysis (GSEA) was employed to elucidate the functional enrichment of gene sets within each comparative group. Volcano plots were created using the ggplot2 package in RStudio, based on R version 4.3.2.

2.9. Statistical Analysis

Statistical analyses were performed using GraphPad Prism 10.1.1 (270) software (RRID: SCR_002798, La Jolla, CA, USA). Data that were normally distributed were analyzed using Student’s two-tailed and unpaired t-test. Data are presented as the mean ± standard error of the mean (SEM). p-values are indicated in each figure as ns p > 0.05, * p < 0.05, ** p < 0.01, and *** p < 0.001

3. Results

3.1. The Size of IMF Adipocytes is Smaller than BF and IMAT

  • To explore the lipid and molecular characteristics of the IMF of Laiwu pigs, we collected the middle layer of BF, IMAT of the hind leg, and IMF-rich LDM from 300-day-old Laiwu pigs. We performed hematoxylin-eosin (H&E) staining on the BF, IMAT, and LDM samples to assess the adipocyte morphology and found the size of IMF adipocytes within the LDM was smaller than the BF and IMAT adipocytes (Figure 1A). Quantitative analysis revealed that BF adipocytes are primarily distributed over areas ranging from 5000 to 15,000 μm², with an average area of 11,265 μm². IMAT adipocytes mainly span areas between 4000 and 11,000 μm², with an average area of 6205 μm². Meanwhile, IMF adipocytes predominantly occupy areas from 2000 to 5000 μm², with an average area of 3356 μm² (Figure 1B,C). These findings imply a comparatively slower development of IMF relative to BF and IMAT.

3.2. Alterations in Lipid Class Composition across IMF, IMAT, and BF

  • To explore the differences in the overall lipid composition and distribution in different adipose tissues, we carried out lipidomic analysis through liquid chromatography-tandem mass spectrometry (LC-MS/MS). This analysis identified over 467 lipid species distributed among 29 lipid classes in the BF, IMAT, and IMF (Figure 2A). These lipid classes included triacylglycerols (TAGs), alkyl-phosphatidylethanolamines (PE-Os), phosphatidylcholines (PCs), phosphatidylethanolamines (PEs), galactosylceramides (GalCers), phosphatidyl-inositols (PIs), and others. The abbreviations of these quantified lipid classes are shown in Figure S1A. Multivariate analysis of the data from the 467 lipid molecules across the three tissue types revealed a close relationship between the BF and IMAT groups, whereas the IMF group exhibited a distinct profile (Figure S1B–D). Utilizing the PLS-DA model, 70 critical variables were identified that differentiated the IMF group from the BF and IMAT groups, based on VIP values >1.0 and p-values < 0.05. Predominantly, these variables included CLs, PE-Os, PC-Os, AcCas, and GalCers, which were found to be elevated in IMF and demonstrated high positive correlations amongst themselves (Figure 2B and Figure S2B). A total of 152 and 93 lipid species in the IMF group were identified as significantly changed compared to the BF and IMAT groups based on p-values < 0.05, respectively. The downregulated lipid species within the IMF group included FFAs, DAGs, and TAGs (Figure 2C and Figure S2B). Furthermore, the IMF exhibited a notable reduction in glycerolipid levels alongside a significant elevation in the concentrations of fatty acyls, sphingolipids, glycerophospholipids, and sulfatides (Figure 2D). Of these, the FFA and DAG contents were significantly lower, and AcCa, CL, PS, PC-O, PE-O, S1P, SM, GM3, and GalCer contents were significantly higher in the IMF (Figure 2E), while other lipid subclasses were unchanged among the three adipose tissues (Figure S2C–F). These findings further underscored substantial alterations in the composition and content of lipids in IMF compared to BF and IMAT.

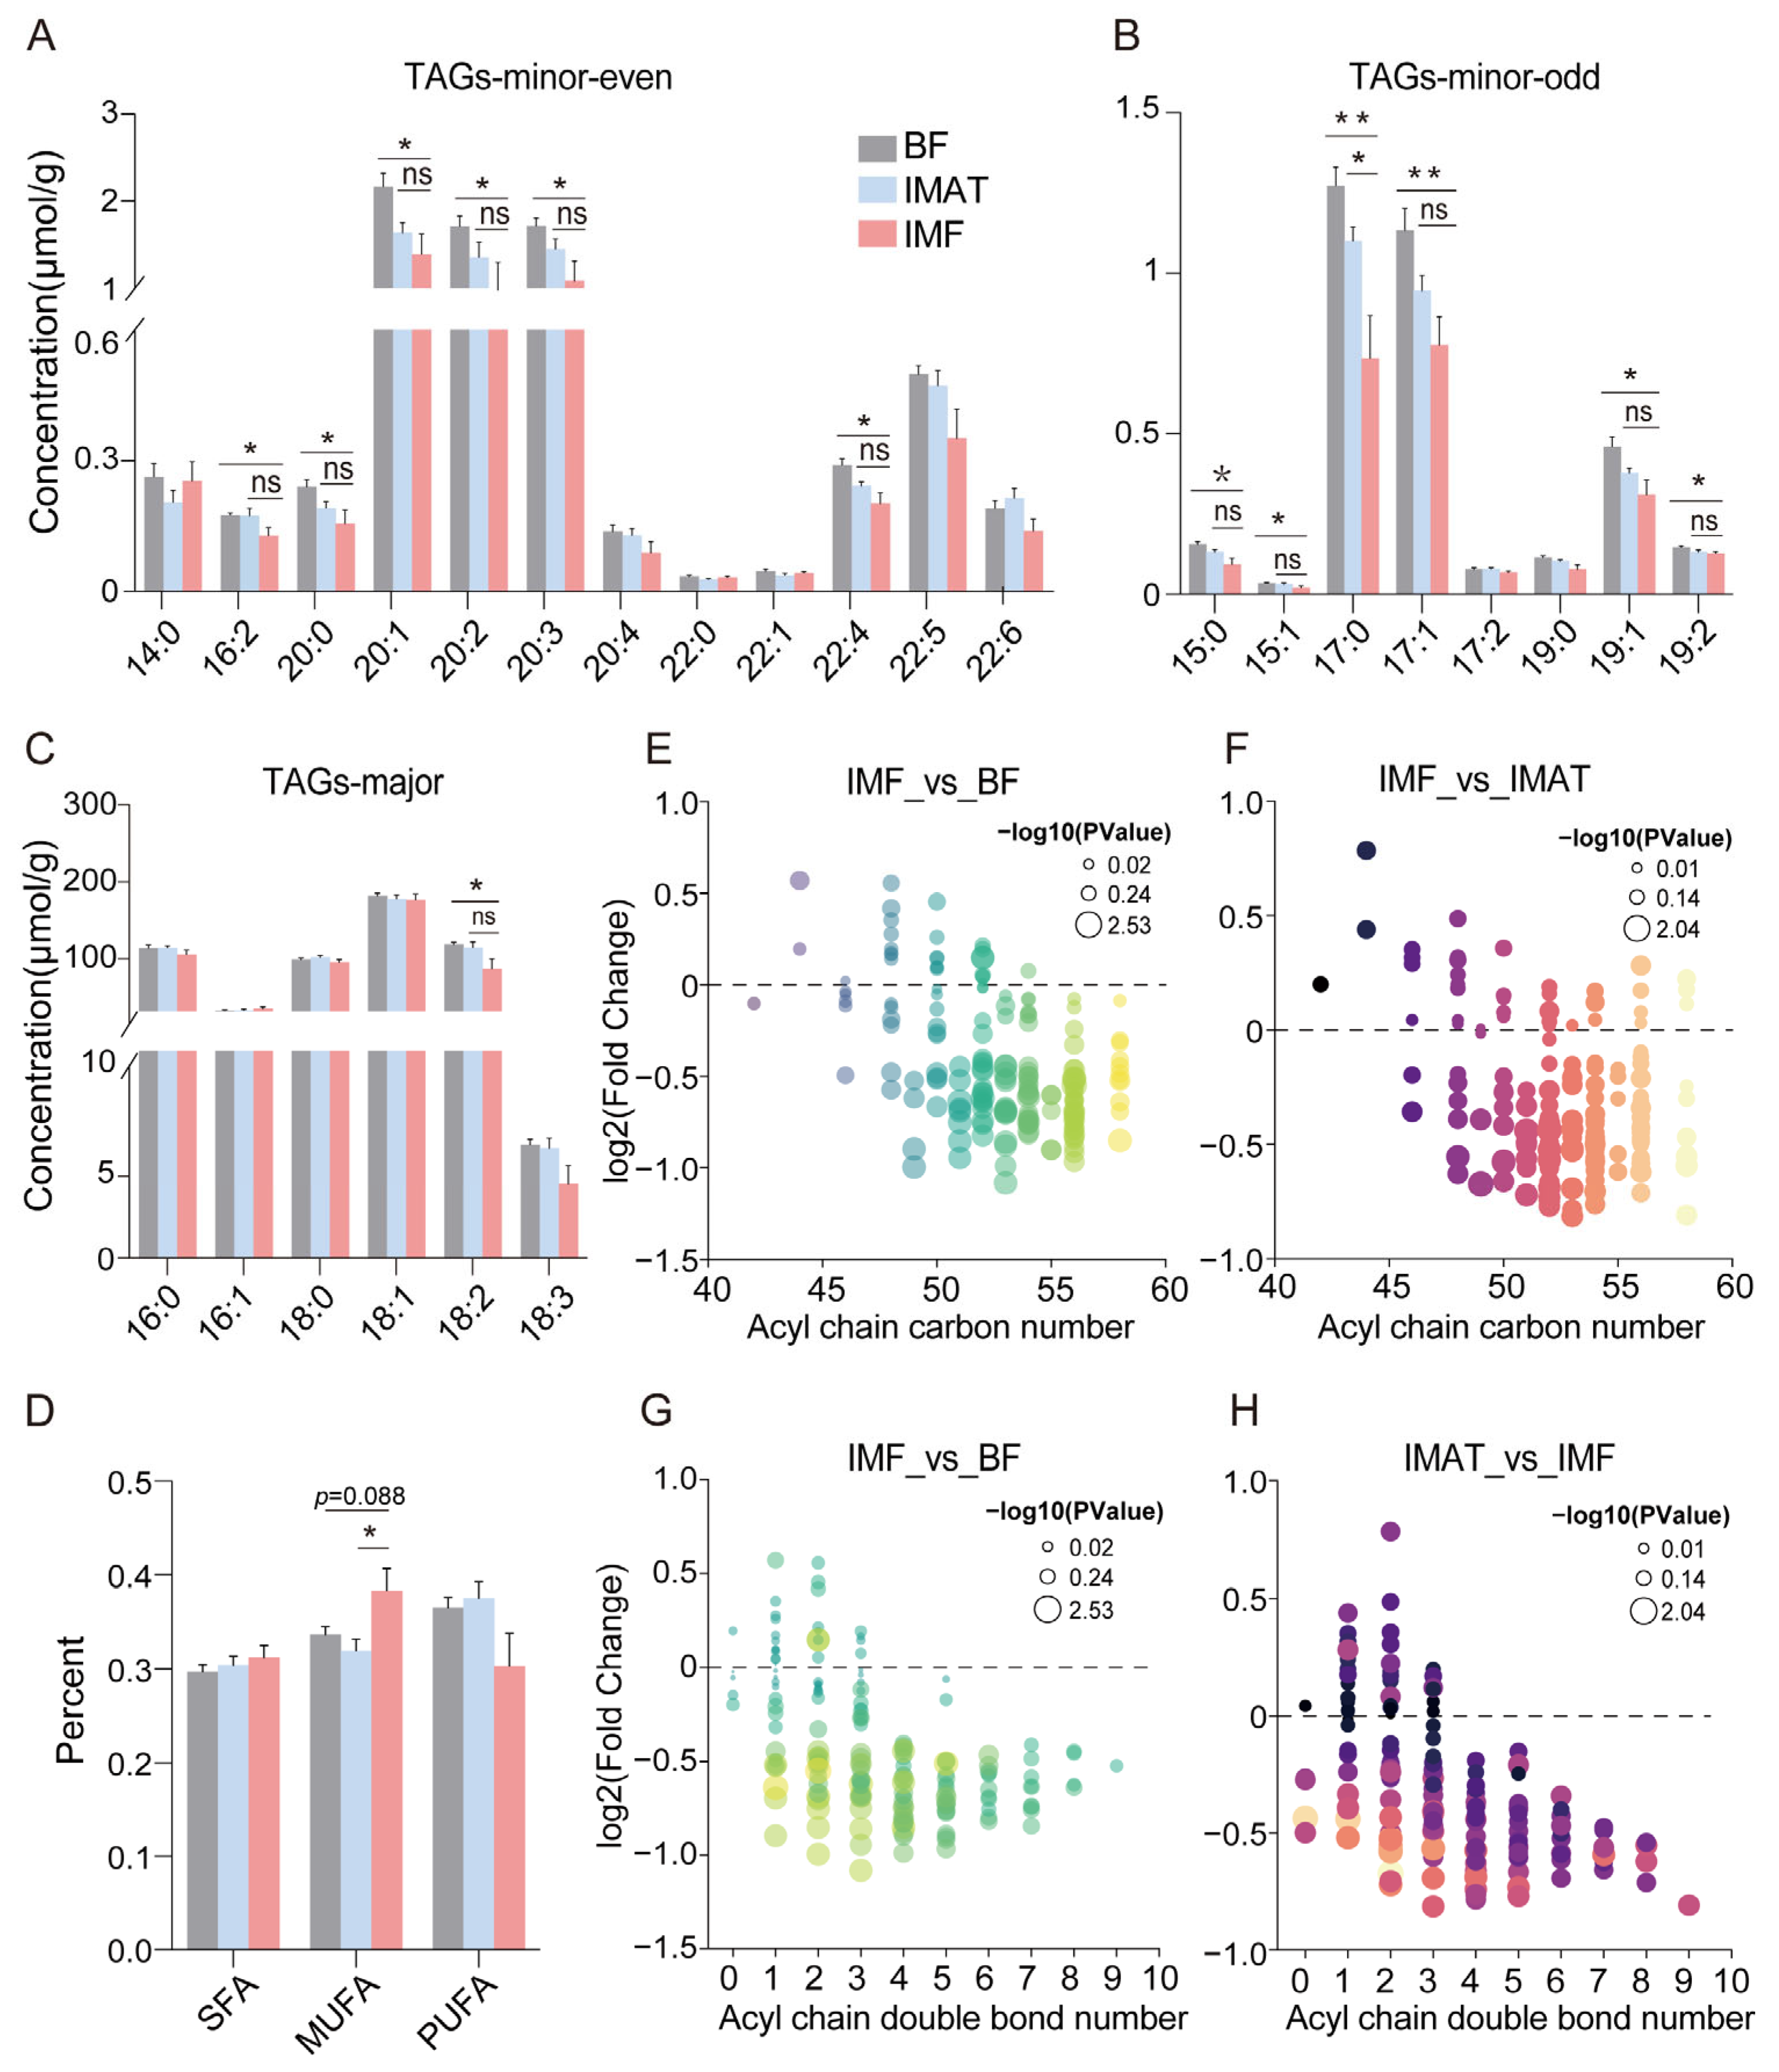
3.3. IMF Exhibited a Reduction in TAG Species Characterized by Longer Acyl Chain Carbon Numbers and More Double Bonds

  • TAGs and glycerophospholipids are the two most abundant lipid types in adipose tissues, with their associated individual fatty acyl chains mirroring the composition of the predominant fatty acids. The results showed the content of most fatty acyl chains associated with TAG was significantly decreased in the IMF group compared to the BF group, with only the C17:0 fatty acyl chain showing a significant decrease compared to the IMAT group (Figure 3A,B). Notably, the content of the LA (C18:2) fatty acyl chain associated with TAGs was decreased in the IMF group relative to BF (p < 0.05) and IMAT groups (p = 0.09) (Figure 3C); LA is an essential fatty acid with documented health benefits [19]. Moreover, the percentage of MUFA chains associated with TAGs was decreased in the IMF relative to BF (p < 0.05) and IMAT (p = 0.088), while the SFA and PUFA chains showed no significant differences among the three adipose tissue groups (Figure 3D). Furthermore, the IMF exhibited a marked decrease in TAG content as acyl chain carbon numbers increased (Figure 3E,F) or as the number of double bonds rose (Figure 3G,H). These observations suggest that the fatty acid profile as reflected by TAGs undergoes significant modifications in IMF in contrast to BF and IMAT.

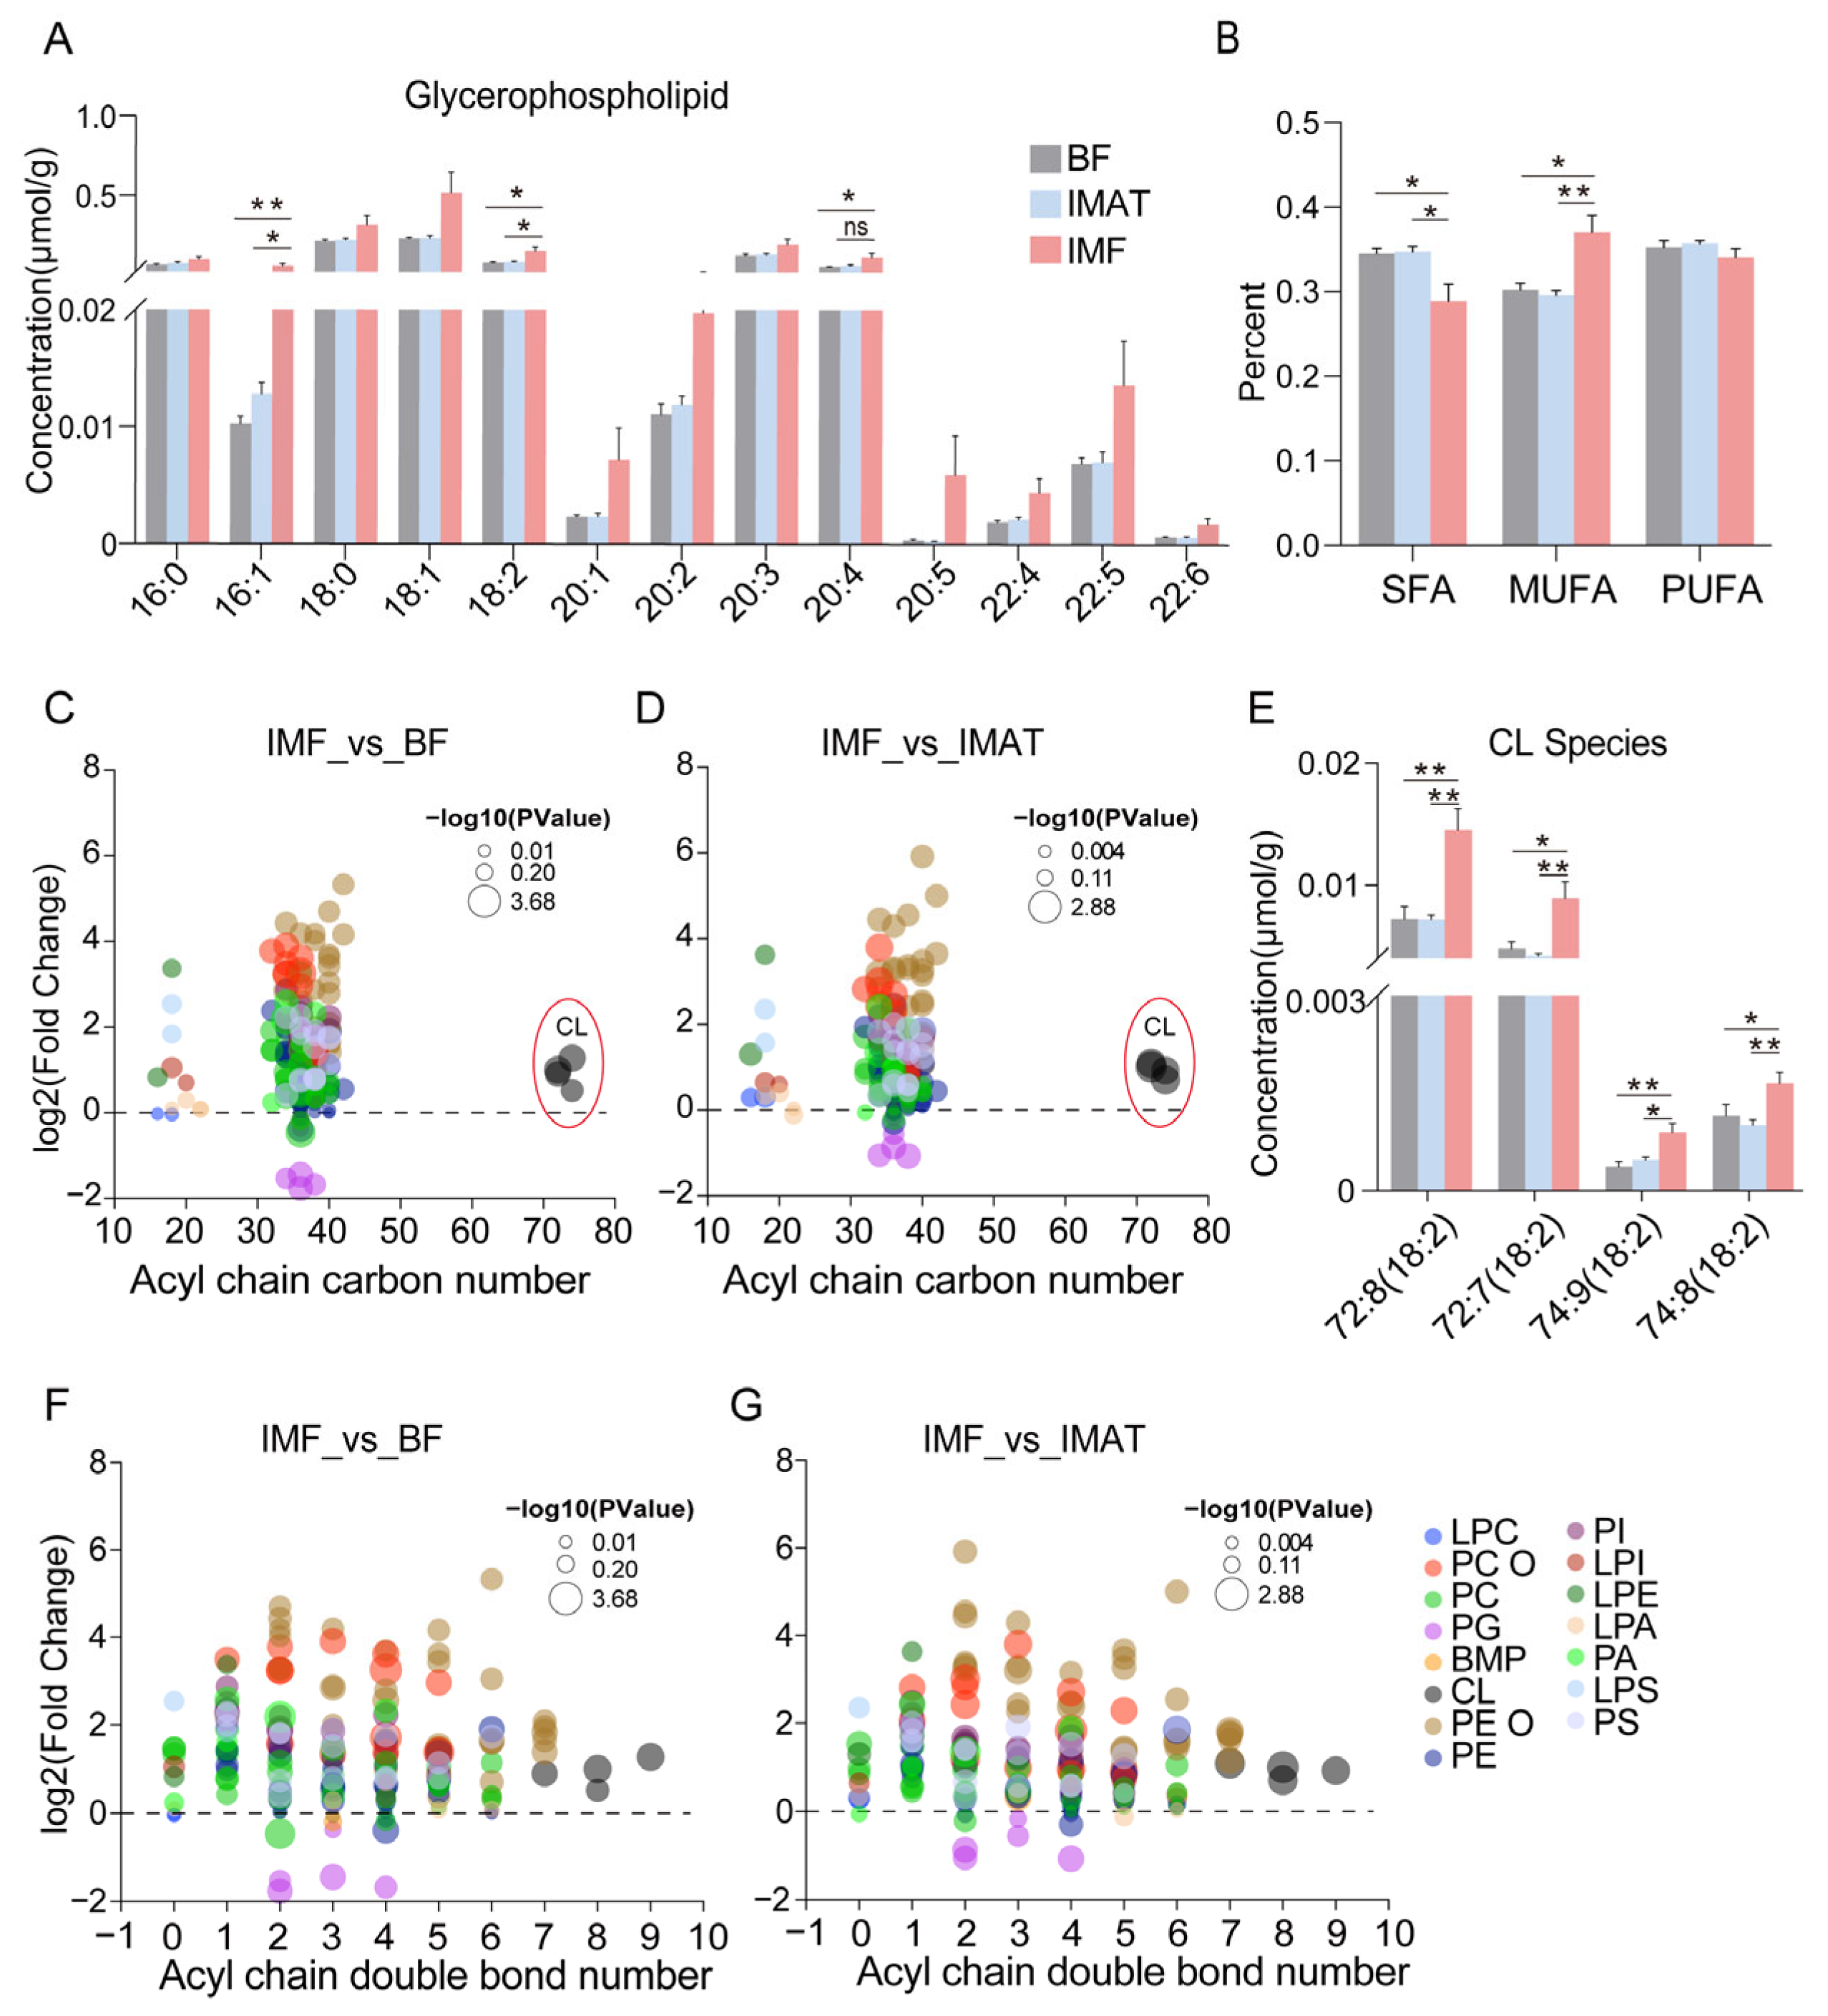
3.4. IMF Exhibited Significantly Higher Levels of Glycerophospholipid Species Characterized by Longer Acyl Chain Carbon Numbers and Increased Double Bonds

  • We next analyzed the individual fatty acyl chain composition associated with glycerophospholipids. The concentration of C16:1 and C18:2 fatty acyl chains in the glycerophospholipids pool was notably increased in IMF compared to BF and IMAT (Figure 4A). We analyzed the total contents of SFA, MUFA, and PUFA chains associated with glycerophospholipids. The SFA percentage was significantly lower, and the MUFA percentage was significantly higher in IMF; the PUFA percentage was unaffected (Figure 4B). Moreover, the IMF displayed elevated levels of glycerophospholipid species with lower (below 30 carbons, mostly associated with LPCs, LPEs, and LPSs), intermediate (above 30 and below 50 carbons, particularly associated with PC-O and PE-O), and higher (above 70 carbons, associated with CLs) acyl chain carbon numbers (Figure 4C,D). Particularly, all four significantly increased CLs contained C18:2 fatty acyl chains (Figure 4E); cardiolipins (CLs) play a crucial role in maintaining mitochondrial membrane integrity and function [20]. Additionally, the IMF displayed significantly higher levels of most glycerophospholipids species with greater acyl chain double bonds compared to BF and IMAT groups (Figure 4F,G). These results suggest a dramatic change in the composition and fatty acyl chains within glycerophospholipids in IMF.

3.5. IMF Exhibited a Significant Increase in Fatty Acyl Species, Characterized by Longer Acyl Chain Carbon Numbers and More Double Bonds

  • The above-described results showed a significant increase in the total content of fatty acyls in the IMF. Fatty acyls contain FFAs and AcCas, which are fatty acid metabolites that play important roles in many cellular energy metabolism pathways and are important diagnostic markers for mitochondrial-related metabolic syndrome [21]. We analyzed the composition of fatty acyl chains associated with fatty acyls and found most FFA species significantly decreased, while AcCas species markedly increased in the IMF and compared to BF and IMAT (Figure 5A,B). Particularly, in line with the alteration of C18:2 associated with TAGs and glycerophospholipids, FFA (C18:2) and AcCa (C18:2) exhibited a significant change in the IMF (Figure 5A,B). Moreover, IMF showed a greatly lower percentage of SFA chains and a notably higher percentage of MUFA chains associated with fatty acyls, with an unaffected percentage of PUFA chains relative to BF and IMAT (Figure 5C). Additionally, FFA species showed a significant decrease in IMF, but AcCa species exhibited a significant increase conversely within the IMF with varying acyl chain carbon numbers (Figure 5D,E) and acyl chain double bonds (Figure 5F,G). These results suggest the composition and acyl chains of fatty acyl species considerably change in IMF.

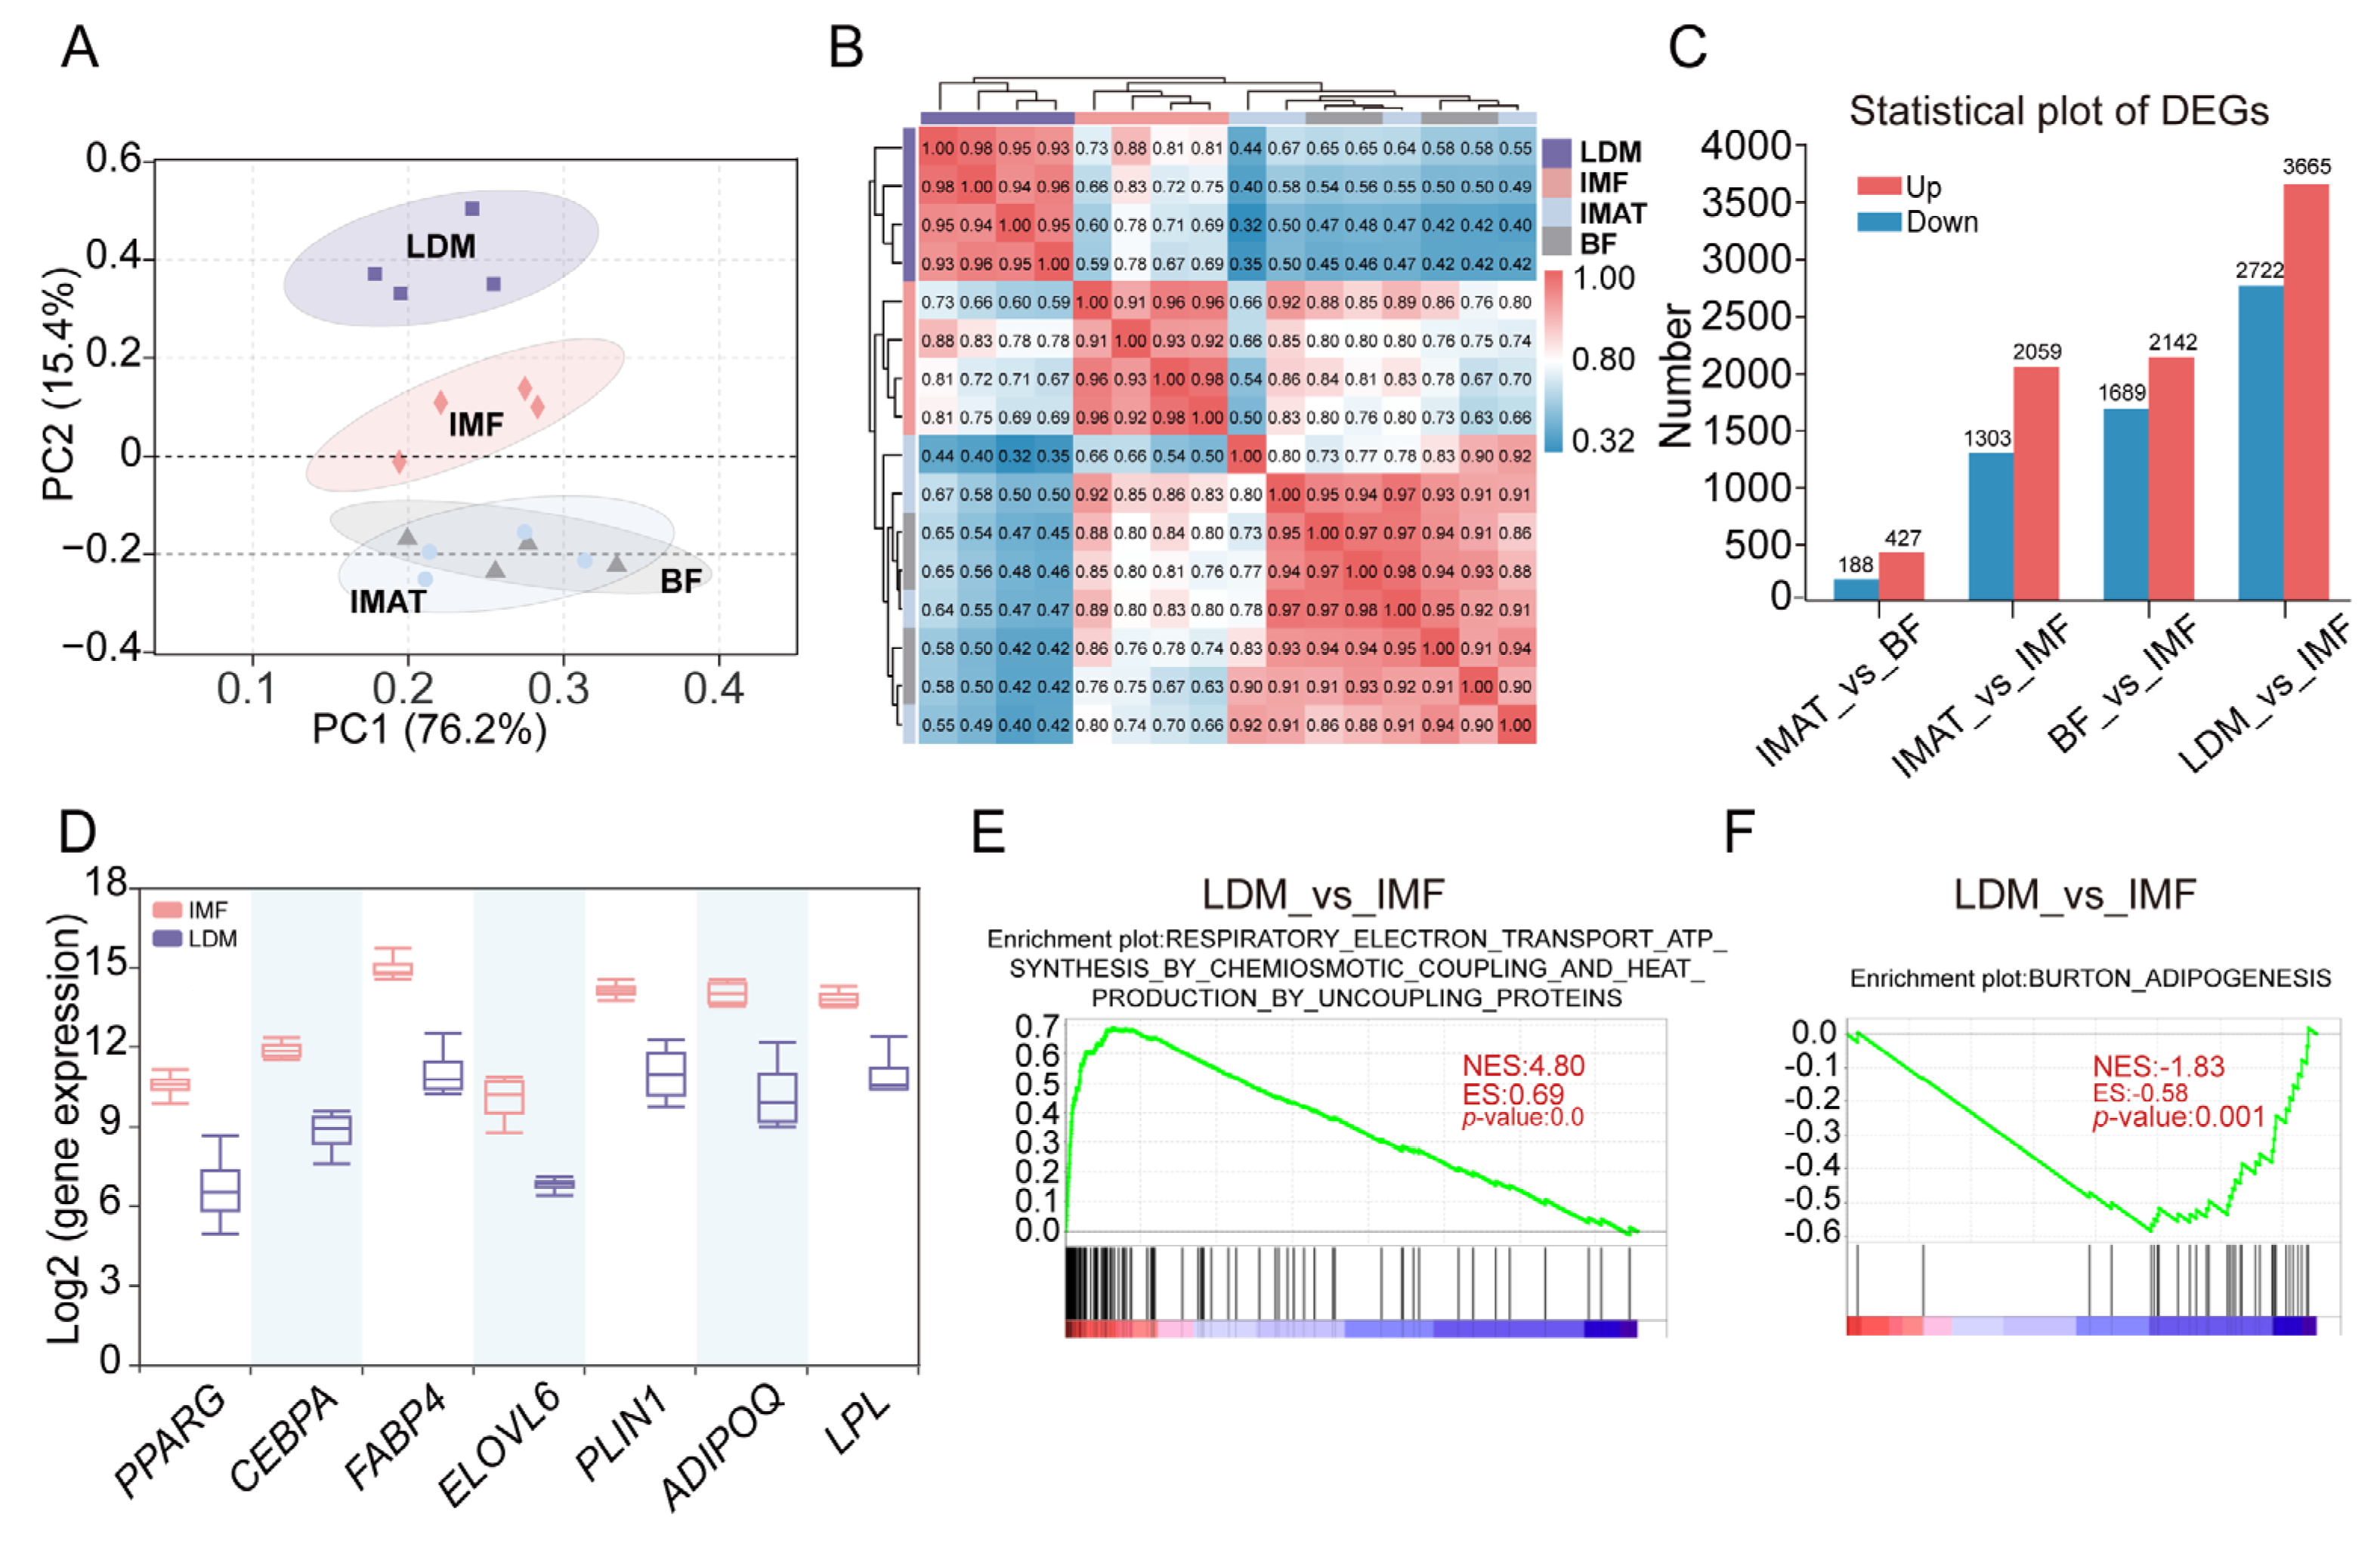
3.6. IMF Isolated from the LDM Constitutes a Unique Adipose Tissue, Exhibiting Distinct Molecular Characteristics Compared to BF and IMAT

  • We conducted RNA-Seq analysis on IMF, BF, and IMAT samples obtained from Laiwu pigs to investigate transcriptional changes and lipid metabolic pathways in adipose tissues. The IMF samples were manually dissected from the LDM under a stereomicroscope, and RNA extraction was successfully performed. To validate the adipose tissue specificity of the IMF samples, we included RNA-Seq data from LDM samples for comparison. PCA based on FPKM values of commonly expressed genes in all four tissues showed that BF and IMAT samples closely clustered together, while IMF samples occupied an intermediate position between BF (or IMAT) and LDM samples on the second axis of the PCA plot, indicating gene expression patterns in IMF were different from BF, IMAT, and LDM (Figure 6A). Moreover, Pearson’s correlation coefficients demonstrated significantly greater similarity between pairwise BF (or IMAT) and IMF samples compared to pairwise IMF and LDM samples (Figure 6B). This observation was supported by the identification of a greater number of differentially expressed genes between IMF and LDM than between IMF and BF (or IMAT) (Figure 6C). We identified genes associated with adipogenesis (PPARG, CEBPA), lipogenesis (FABP4, ELOVL6, PLIN1), and adipocytokines (ADIPOQ, LPL) that exhibited higher expression in IMF compared with LDM (Figure 6D). Furthermore, GSEA showed that RESPIRATORY_ELECTRON_TRANSPORT_ATP_SYNTHESIS_BY_CHEMIOSMOTIC_COPLING_AND_HEAT_PRODUCTION_BY_UNCOUPLING_PROTEINS (NES = 4.80, p = 0.0) was greatly upregulated in LDM, but ADIPOGENESIS (NES= −1.83, p = 0.0001) was greatly upregulated in IMF (Figure 6E,F). These findings reveal that IMF samples, isolated from the LDM, represent largely adipose tissue and possess distinct molecular characteristics from BF and IMAT.

3.7. Transcriptomic Gene Enrichment Analysis Indicates a Reduction in Lipogenesis and an Enhanced Innervation in IMF

  • To better characterize the molecular signature of the IMF, we performed a differential gene expression analysis on IMF, BF, and IMAT. We identified 1054 BF and 992 IMF genes that exhibited a significantly higher expression than the corresponding LDM genes (fold change > 2 and p-value < 0.05) (Figure 7A). Moreover, 755 IMAT and 861 IMF genes exhibited a significantly higher expression than the corresponding LDM genes, respectively (Figure S4A). GO and KEGG pathway enrichment analysis with genes differentially expressed in BF, IMAT, and IMF. The 1054 genes highly expressed in BF and 755 genes highly expressed in IMAT were commonly involved in the PPAR signaling pathway, glycerolipid metabolism, unsaturated fatty acid biosynthesis, fatty acid elongation, and lipid storage (Figure 7B and Figure S4B), which was consistent with the significant higher glycerolipid content and unsaturated and long-chain fatty acids associated with TAGs. In comparison, the IMF genes were associated with axon guidance, the cAMP signaling pathway, cell adhesion molecules, glutamatergic synapse, dopaminergic synapse, postsynaptic density, insulin secretion, calcium signaling, and ATP synthesis coupled electron transport (Figure 7C and Figure S4C). Moreover, gene set enrichment analysis (GSEA) analysis showed the ADIPOGENESIS pathway was significantly downregulated (Figure 7D and Figure S4D), while the NEURONAL_SYSTEM pathway was notably upregulated in IMF (Figure 7E and Figure S4E). The heatmap showed significant differences in gene expression between IMF and BF (or IMAT) in the PPAR signaling pathway, glycerolipid metabolism, unsaturated fatty acid biosynthesis, axon guidance, and cAMP signaling pathway (Figure 7F,G and Figure S4F,G).
  • qPCR validation showed the genes related to glycerolipid metabolism and lipogenesis significantly decreased in IMF compared to BF (Figure 7H). The genes related to axon guidance and the cAMP signaling pathway were increased in the IMF, including BMP7 (p = 0.077) and PPP1R12A (p < 0.01) (Figure 7I). In particular, the gene UGT8, which encodes the rate-limiting enzyme for GalCer biosynthesis, was significantly increased in IMF compared with BF (Figure 7I). Furthermore, immunostaining analysis found tyrosine hydroxylase (TH), the marker of sympathetic innervation, was more densely distributed in IMF adipocytes (Figure 7J). Taken together, these results suggest that IMF has a lower capacity for fat deposition and receives stronger innervation.

4. Discussion

Intramuscular fat content is one of the important indexes for evaluating pork quality, as it affects the flavor, tenderness, and juiciness of meat. Laiwu pigs are known for their high IMF content, but their excessive BF also reduces the lean meat percentage. Understanding the underlying mechanisms driving adipose tissue heterogeneity could balance high-quality meat production with economic efficiency. In the following, we will discuss the differences in porcine IMF versus BF and IMAT in terms of adipocyte maturity, lipid composition, and transcriptional profiles.
Generally, the size of IMF adipocytes is closely related to development maturity. Previous studies have reported that the expression of genes related to lipid metabolism in IMF adipocytes was relatively slower when compared with subcutaneous adipocytes [22]. In this study, we found that IMF adipocytes in Laiwu pigs were smaller and contained significantly lower levels of GL compared to those in BF and IMAT. Furthermore, PPAR signaling, unsaturated fatty acid biosynthesis, fatty acid elongation, and lipid storage pathways were significantly downregulated in IMF. In growing pigs, the immature state of intramuscular fat (IMF) adipocytes leads to reduced responsiveness to insulin stimuli, resulting in diminished insulin-induced lipogenesis compared to other adipose depots [23]. The IMF content is primarily influenced by the number and size of intramuscular adipocytes. Hence, future research should prioritize the investigation into signaling pathways that trigger adipocyte proliferation and hypertrophy within IMF.
Targeted lipidomics analysis found that lipid expression profiles of IMAT and BF are similar, but IMF is heterogeneous. Compared with BF and IMAT, IMF showed a significant decrease in glycerolipid content and a significant increase in the content of fatty acyl, sphingolipid, glycerophospholipid, and sulfatide. The differentiated lipid subclasses identified were mainly GalCer, S1P, CL, AcCa, PC-O, and PE-O (Figure 2D,E). The decreased glycerolipid content was consistent with the smaller size of IMF adipocytes. Sphingolipids play a key role in intracellular signaling transduction, cell adhesion, and neuronal development [24,25,26]. Of these, sulfatide and GalCer levels were the most multiply elevated in IMF. GalCer is a precursor for sulfatide, and the expression of the rate-limiting enzyme gene UGT8 for GalCer biosynthesis was significantly upregulated in IMF in this study. Sulfatides have been found to increase insulin sensitivity in muscle and fat cells, thus playing a positive role in maintaining normal glucose homeostasis and energy balance [27]. Since the metabolic activities of IMF and muscle are closely related, the abundance of sulfatides and GalCer may help IMF to improve the response to insulin stimulus, which in turn promotes efficient glucose utilization and rapid energy supply.
In addition, sulfatides and GalCer are important lipid molecules in the nervous system [28], involved in the protection and maintenance of peripheral nerves, and they play key roles in cellular function and intercellular communication [29]. S1P plays important roles as second messengers regulating cell growth, differentiation, migration, and apoptosis [30]. Previous studies found that S1P inhibits adipogenic differentiation [31,32] but promotes lipogenesis [33]. Plasmalogen (PE-O and PC-O) has abundant expression in neural tissues and cardiac muscle tissue, which involves mediators of membrane dynamics and signaling, antioxidants, and sources of second messengers [34]. In our study, the highly expressed genes in IMF were enriched in the intercellular signaling transduction pathway. Overall, the specific roles of these lipid molecules in IMF deposition need further exploration.
Interestingly, we found the FFAs were significantly decreased and AcCas were significantly increased in IMF. During fatty acid oxidation, FFA undergoes esterification to CoA and is subsequently converted into AcCa by carnitine acyltransferase, facilitating mitochondrial β-oxidation and producing energy to sustain adipocyte activity [35]. Moreover, a significant increase in specific CL (18:2) species was shown in IMF, consistent with the Laiwu pig possessing more CL (C18:2) than the Yorkshire pig [15]. Mature CL is enriched in C18:2, which is optimal for effective mitochondrial electron transport chain function and ATP generation [36]. Plasmalogen (PE-O and PC-O) can increase mitochondrial copy numbers and improve mitochondrial function in Pex16-AKO mice [37]. We also found the highly expressed genes in IMF were involved in the calcium signaling pathway, which is important for regulating mitochondrial ATP production [38] and IMF adipogenesis [39]. Since IMF adipocytes are smaller than BF and IMAT, this suggests that IMF adipocytes may be at an early stage of differentiation and require large numbers of mitochondria to provide energy and metabolites (acetyl CoA) to support lipid synthesis and storage [40].
The fatty acyl chains associated with various lipids reflect the composition of major fatty acids, which plays a key role in affecting the IMF deposition [13]. Previous studies compared the IMF from different pig breeds and found that SFAs within TAGs were positively correlated to IMF content and more conducive to IMF deposition [41,42]. However, we found that the content of all detected FFAs and the percentage of SFA chains associated with glycerophospholipids and fatty acyls was significantly decreased in IMF relative to BF and IMAT. This opposite result may be because they compared the changes in fatty acid content in LDM from different pig breeds, which cannot truly reflect the composition of fatty acid chains in IMF adipocytes. Moreover, the percentage of MUFAs associated with TAGs and glycerophospholipids significantly increased, and the percentage of PUFAs showed a decline in the diversity of TAGs containing chains in IMF, which was consistent with previous studies [41,42]. These results indicate that the fatty acyl chains in the IMF of Laiwu pigs were remodeled, and the specific effect of FAs on IMF deposition needs further investigation.
Innervation has an important role in regulating adipose tissue differentiation, energy storage, and expenditure [43]. In this study, we found that tyrosine hydroxylase (TH), the rate-limiting enzyme for catecholamine biosynthesis and a marker of sympathetic innervation, is more densely distributed in IMF adipocytes. Adipocyte lipolysis is triggered mainly by sympathetic stimuli of β-adrenergic receptors, initiating the sequential hydrolysis of TAGs through a cAMP signaling pathway [44,45]. Moreover, the genes highly expressed in IMF were enriched in neurologically functionally relevant pathways in IMF, including the axon guidance, glutamatergic synapse, dopaminergic synapse, and cAMP signaling pathways. A previous study compared the transcriptome of subcutaneous fat and IMF in large pig populations and also found that the genes highly expressed in IMF were associated with neurogenesis and nervous system development [46]. These results suggest that IMF is subjected to enhanced innervation, which may promote lipid metabolism in IMF, thereby responding faster to muscle energy needs.

5. Conclusions

In this study, we meticulously delineate the heterogeneity of porcine adipose tissues by a thorough evaluation of tissue sections, alongside lipidomics and transcriptomics analyses, indicating that the maturity of IMF is significantly inferior to that of both intermuscular and subcutaneous fat. These insights not only shed light on the differential lipid composition and molecular regulation across various adipose tissues in pigs but also underpin the understanding of the intricate mechanisms governing intramuscular fat deposition. Furthermore, this research contributes valuable knowledge towards the synergistic breeding strategies aimed at enhancing pig BF thickness and intramuscular fat content.

Supplementary Materials

The following supporting information can be downloaded at: https://www.mdpi.com/article/10.3390/agriculture14050658/s1, Figure S1: Multivariate data analysis of LC-MS lipidomics data from adipose tissue samples from 300-day-old Laiwu pigs; Figure S2: The overall composition of lipid classes altered in the IMF group; Figure S3: IMF exhibits a reduced capacity for lipid deposition and increased innervation relative to IMAT; Table S1: The primer for qPCR.

Author Contributions

Conceptualization, C.T. and Y.W.; methodology, S.M.L., G.S. and J.X.; software, J.X. and T.W.; validation, J.X. and T.W.; formal analysis, C.T. and Y.W.; investigation, T.W.; resources, S.Y., Y.W. and C.T.; data curation, J.X.; writing—original draft preparation, J.X.; writing—review and editing, T.W.; visualization, J.X.; supervision, C.T.; project administration, J.X. and C.T.; funding acquisition, Y.W. and C.T. All authors have read and agreed to the published version of the manuscript.

Funding

This research was funded by the National Natural Science Foundation of China, grant numbers 32025034, 32330099, and 32372835; STI2030—Major Projects, grant number 2023ZD0404702, and the Agricultural Science and Technology Innovation Program, grant number ASTIP-IAS05.

Institutional Review Board Statement

The animal study protocol was approved by the Institutional Animal Care and Use Committee of the Institute of Animal Science, Chinese Academy of Agriculture Science (IAS2020-21, 31 March 2020).

Data Availability Statement

The RNA-Seq raw data are available in the Genome Sequence Archive in BIG Data Center, Beijing Institute of Genomics (BIG), Chinese Academy of Sciences, under accession number PRJCA023887 (http://bigd.big.ac.cn/gsa, uploaded, accessed on 15 April 2024).

Acknowledgments

We thank our lab members for their critical reading of the manuscript and helpful discussions.

Conflicts of Interest

The authors declare no conflicts of interest.

References

  1. Drewnowski, A. Perspective: The Place of Pork Meat in Sustainable Healthy Diets. Adv. Nutr. 2024, 15, 100213. [Google Scholar] [CrossRef] [PubMed]
  2. Warriss, P.D.; Brown, S.N.; Franklin, J.G.; Kestin, S.C. The thickness and quality of backfat in various pig breeds and their relationship to intramuscular fat and the setting of joints from the carcasses. Meat Sci. 1990, 28, 21–29. [Google Scholar] [CrossRef] [PubMed]
  3. Font-i-Furnols, M.; Tous, N.; Esteve-Garcia, E.; Gispert, M. Do all the consumers accept marbling in the same way? The relationship between eating and visual acceptability of pork with different intramuscular fat content. Meat Sci. 2012, 91, 448–453. [Google Scholar] [CrossRef]
  4. Lonergan, S.M.; Huff-Lonergan, E.; Rowe, L.J.; Kuhlers, D.L.; Jungst, S.B. Selection for lean growth efficiency in Duroc pigs influences pork quality. J. Anim. Sci. 2001, 79, 2075–2085. [Google Scholar] [CrossRef] [PubMed]
  5. Newcom, D.W.; Baas, T.J.; Schwab, C.R.; Stalder, K.J. Genetic and phenotypic relationships between individual subcutaneous backfat layers and percentage of longissimus intramuscular fat in Duroc swine1. J. Anim. Sci. 2005, 83, 316–323. [Google Scholar] [CrossRef] [PubMed]
  6. Poklukar, K.; Čandek-Potokar, M.; Batorek Lukač, N.; Tomažin, U.; Škrlep, M. Lipid Deposition and Metabolism in Local and Modern Pig Breeds: A Review. Animals 2020, 10, 424. [Google Scholar] [CrossRef] [PubMed]
  7. Rubin, C.J.; Megens, H.J.; Martinez Barrio, A.; Maqbool, K.; Sayyab, S.; Schwochow, D.; Wang, C.; Carlborg, Ö.; Jern, P.; Jørgensen, C.B.; et al. Strong signatures of selection in the domestic pig genome. Proc. Natl. Acad. Sci. USA 2012, 109, 19529–19536. [Google Scholar] [CrossRef] [PubMed]
  8. Jeffery, E.; Wing, A.; Holtrup, B.; Sebo, Z.; Kaplan, J.L.; Saavedra-Peña, R.; Church, C.D.; Colman, L.; Berry, R.; Rodeheffer, M.S. The Adipose Tissue Microenvironment Regulates Depot-Specific Adipogenesis in Obesity. Cell Metab. 2016, 24, 142–150. [Google Scholar] [CrossRef] [PubMed]
  9. Leiria, L.O.; Tseng, Y.H. Lipidomics of brown and white adipose tissue: Implications for energy metabolism. Biochim. Biophys. Acta Mol. Cell Biol. Lipids 2020, 1865, 158788. [Google Scholar] [CrossRef]
  10. Lam, S.M.; Tian, H.; Shui, G. Lipidomics, en route to accurate quantitation. Biochim. Biophys. Acta (BBA) Mol. Cell Biol. Lipids 2017, 1862, 752–761. [Google Scholar] [CrossRef]
  11. Ogawa, M.; Lester, R.; Akima, H.; Gorgey, A.S. Quantification of intermuscular and intramuscular adipose tissue using magnetic resonance imaging after neurodegenerative disorders. Neural Regen. Res. 2017, 12, 2100–2105. [Google Scholar] [CrossRef] [PubMed]
  12. Hocquette, J.F.; Gondret, F.; Baéza, E.; Médale, F.; Jurie, C.; Pethick, D.W. Intramuscular fat content in meat-producing animals: Development, genetic and nutritional control, and identification of putative markers. Animal 2010, 4, 303–319. [Google Scholar] [CrossRef] [PubMed]
  13. Zhou, J.; Zhang, Y.; Wu, J.; Qiao, M.; Xu, Z.; Peng, X.; Mei, S. Proteomic and lipidomic analyses reveal saturated fatty acids, phosphatidylinositol, phosphatidylserine, and associated proteins contributing to intramuscular fat deposition. J. Proteom. 2021, 241, 104235. [Google Scholar] [CrossRef] [PubMed]
  14. Chen, W.; Fang, G.-f.; Wang, S.-d.; Wang, H.; Zeng, Y.-q. Longissimus lumborum muscle transcriptome analysis of Laiwu and Yorkshire pigs differing in intramuscular fat content. Genes Genom. 2017, 39, 759–766. [Google Scholar] [CrossRef]
  15. Hou, X.; Zhang, R.; Yang, M.; Niu, N.; Wu, J.; Shu, Z.; Zhang, P.; Shi, L.; Zhao, F.; Wang, L.; et al. Metabolomics and lipidomics profiles related to intramuscular fat content and flavor precursors between Laiwu and Yorkshire pigs. Food Chem. 2023, 404, 134699. [Google Scholar] [CrossRef]
  16. Lam, S.M.; Li, J.; Sun, H.; Mao, W.; Lu, Z.; Zhao, Q.; Han, C.; Gong, X.; Jiang, B.; Chua, G.H.; et al. Quantitative Lipidomics and Spatial MS-Imaging Uncovered Neurological and Systemic Lipid Metabolic Pathways Underlying Troglomorphic Adaptations in Cave-Dwelling Fish. Mol. Biol. Evol. 2022, 39, msac050. [Google Scholar] [CrossRef]
  17. Pan, J.; Tao, C.; Cao, C.; Zheng, Q.; Lam, S.M.; Shui, G.; Liu, X.; Li, K.; Zhao, J.; Wang, Y. Adipose lipidomics and RNA-Seq analysis revealed the enhanced mitochondrial function in UCP1 knock-in pigs. Biochim. Biophys. Acta Mol. Cell. Biol. Lipids 2019, 1864, 1375–1383. [Google Scholar] [CrossRef]
  18. Lin, J.; Cao, C.; Tao, C.; Ye, R.; Dong, M.; Zheng, Q.; Wang, C.; Jiang, X.; Qin, G.; Yan, C.; et al. Cold adaptation in pigs depends on UCP3 in beige adipocytes. J. Mol. Cell Biol. 2017, 9, 364–375. [Google Scholar] [CrossRef]
  19. Hamilton, J.S.; Klett, E.L. Linoleic acid and the regulation of glucose homeostasis: A review of the evidence. Prostaglandins Leukot. Essent. Fat. Acids 2021, 175, 102366. [Google Scholar] [CrossRef]
  20. Paradies, G.; Paradies, V.; De Benedictis, V.; Ruggiero, F.M.; Petrosillo, G. Functional role of cardiolipin in mitochondrial bioenergetics. Biochim. Biophys. Acta 2014, 1837, 408–417. [Google Scholar] [CrossRef]
  21. Dambrova, M.; Makrecka-Kuka, M.; Kuka, J.; Vilskersts, R.; Nordberg, D.; Attwood, M.M.; Smesny, S.; Sen, Z.D.; Guo, A.C.; Oler, E.; et al. Acylcarnitines: Nomenclature, Biomarkers, Therapeutic Potential, Drug Targets, and Clinical Trials. Pharmacol. Rev. 2022, 74, 506–551. [Google Scholar] [CrossRef] [PubMed]
  22. Chen, L.; Zhang, Y.; Chen, H.; Zhang, X.; Liu, X.; He, Z.; Cong, P.; Chen, Y.; Mo, D. Comparative Transcriptome Analysis Reveals a More Complicated Adipogenic Process in Intramuscular Stem Cells than That of Subcutaneous Vascular Stem Cells. J. Agric. Food Chem. 2019, 67, 4700–4708. [Google Scholar] [CrossRef] [PubMed]
  23. Gardan, D.; Gondret, F.; Louveau, I. Lipid metabolism and secretory function of porcine intramuscular adipocytes compared with subcutaneous and perirenal adipocytes. Am. J. Physiol. Endocrinol. Metab. 2006, 291, E372–E380. [Google Scholar] [CrossRef] [PubMed]
  24. Mendelson, K.; Evans, T.; Hla, T. Sphingosine 1-phosphate signalling. Development 2014, 141, 5–9. [Google Scholar] [CrossRef] [PubMed]
  25. Olsen, A.S.B.; Færgeman, N.J. Sphingolipids: Membrane microdomains in brain development, function and neurological diseases. Open Biol. 2017, 7, 170069. [Google Scholar] [CrossRef] [PubMed]
  26. Vos, M.; Dulovic-Mahlow, M.; Mandik, F.; Frese, L.; Kanana, Y.; Haissatou Diaw, S.; Depperschmidt, J.; Böhm, C.; Rohr, J.; Lohnau, T.; et al. Ceramide accumulation induces mitophagy and impairs β-oxidation in PINK1 deficiency. Proc. Natl. Acad. Sci. USA 2021, 118, e2025347118. [Google Scholar] [CrossRef] [PubMed]
  27. Takahashi, T.; Suzuki, T. Role of sulfatide in normal and pathological cells and tissues. J. Lipid Res. 2012, 53, 1437–1450. [Google Scholar] [CrossRef] [PubMed]
  28. Gault, C.R.; Obeid, L.M.; Hannun, Y.A. An overview of sphingolipid metabolism: From synthesis to breakdown. In Sphingolipids as Signaling and Regulatory Molecules; Advances in Experimental Medicine and Biology; Springer: New York, NY, USA, 2010; Volume 688, pp. 1–23. [Google Scholar] [CrossRef]
  29. Eckhardt, M. The role and metabolism of sulfatide in the nervous system. Mol. Neurobiol. 2008, 37, 93–103. [Google Scholar] [CrossRef] [PubMed]
  30. Mu, J.; Lam, S.M.; Shui, G. Emerging roles and therapeutic potentials of sphingolipids in pathophysiology: Emphasis on fatty acyl heterogeneity. J. Genet. Genom. 2023, 51, 268–278. [Google Scholar] [CrossRef]
  31. Hashimoto, Y.; Matsuzaki, E.; Higashi, K.; Takahashi-Yanaga, F.; Takano, A.; Hirata, M.; Nishimura, F. Sphingosine-1-phosphate inhibits differentiation of C3H10T1/2 cells into adipocyte. Mol. Cell Biochem. 2015, 401, 39–47. [Google Scholar] [CrossRef]
  32. Moon, M.H.; Jeong, J.K.; Lee, Y.J.; Seol, J.W.; Park, S.Y. Sphingosine-1-phosphate inhibits the adipogenic differentiation of 3T3-L1 preadipocytes. Int. J. Mol. Med. 2014, 34, 1153–1158. [Google Scholar] [CrossRef] [PubMed]
  33. Kim, J.Y.; Garcia-Carbonell, R.; Yamachika, S.; Zhao, P.; Dhar, D.; Loomba, R.; Kaufman, R.J.; Saltiel, A.R.; Karin, M. ER Stress Drives Lipogenesis and Steatohepatitis via Caspase-2 Activation of S1P. Cell 2018, 175, 133–145.e115. [Google Scholar] [CrossRef] [PubMed]
  34. Brites, P.; Waterham, H.R.; Wanders, R.J. Functions and biosynthesis of plasmalogens in health and disease. Biochim. Biophys. Acta 2004, 1636, 219–231. [Google Scholar] [CrossRef] [PubMed]
  35. Indiveri, C.; Iacobazzi, V.; Tonazzi, A.; Giangregorio, N.; Infantino, V.; Convertini, P.; Console, L.; Palmieri, F. The mitochondrial carnitine/acylcarnitine carrier: Function, structure and physiopathology. Mol. Asp. Med. 2011, 32, 223–233. [Google Scholar] [CrossRef] [PubMed]
  36. El-Hafidi, M.; Correa, F.; Zazueta, C. Mitochondrial dysfunction in metabolic and cardiovascular diseases associated with cardiolipin remodeling. Biochim. Biophys. Acta Mol. Basis Dis. 2020, 1866, 165744. [Google Scholar] [CrossRef] [PubMed]
  37. Park, H.; He, A.; Tan, M.; Johnson, J.M.; Dean, J.M.; Pietka, T.A.; Chen, Y.; Zhang, X.; Hsu, F.F.; Razani, B.; et al. Peroxisome-derived lipids regulate adipose thermogenesis by mediating cold-induced mitochondrial fission. J. Clin. Investig. 2019, 129, 694–711. [Google Scholar] [CrossRef]
  38. Boyman, L.; Karbowski, M.; Lederer, W.J. Regulation of Mitochondrial ATP Production: Ca(2+) Signaling and Quality Control. Trends Mol. Med. 2020, 26, 21–39. [Google Scholar] [CrossRef] [PubMed]
  39. Liu, J.; Wang, L.; Chen, W.; Li, J.; Shan, T. CRTC3 Regulates the Lipid Metabolism and Adipogenic Differentiation of Porcine Intramuscular and Subcutaneous Adipocytes by Activating the Calcium Pathway. J. Agric. Food Chem. 2021, 69, 7243–7255. [Google Scholar] [CrossRef] [PubMed]
  40. De Pauw, A.; Tejerina, S.; Raes, M.; Keijer, J.; Arnould, T. Mitochondrial (dys)function in adipocyte (de)differentiation and systemic metabolic alterations. Am. J. Pathol. 2009, 175, 927–939. [Google Scholar] [CrossRef]
  41. Huang, Y.; Zhou, L.; Zhang, J.; Liu, X.; Zhang, Y.; Cai, L.; Zhang, W.; Cui, L.; Yang, J.; Ji, J.; et al. A large-scale comparison of meat quality and intramuscular fatty acid composition among three Chinese indigenous pig breeds. Meat Sci. 2020, 168, 108182. [Google Scholar] [CrossRef]
  42. Kim, J.A.; Cho, E.S.; Jeong, Y.D.; Choi, Y.H.; Kim, Y.S.; Choi, J.W.; Kim, J.S.; Jang, A.; Hong, J.K.; Sa, S.J. The effects of breed and gender on meat quality of Duroc, Pietrain, and their crossbred. J. Anim. Sci. Technol. 2020, 62, 409–419. [Google Scholar] [CrossRef] [PubMed]
  43. Zhu, Q.; Glazier, B.J.; Hinkel, B.C.; Cao, J.; Liu, L.; Liang, C.; Shi, H. Neuroendocrine Regulation of Energy Metabolism Involving Different Types of Adipose Tissues. Int. J. Mol. Sci. 2019, 20, 2707. [Google Scholar] [CrossRef] [PubMed]
  44. Ravnskjaer, K.; Madiraju, A.; Montminy, M. Role of the cAMP pathway in glucose and lipid metabolism. In Metabolic Control; Springer: Cham, Switzerland, 2016; pp. 29–49. [Google Scholar]
  45. Zechner, R.; Madeo, F.; Kratky, D. Cytosolic lipolysis and lipophagy: Two sides of the same coin. Nat. Rev. Mol. Cell Biol. 2017, 18, 671–684. [Google Scholar] [CrossRef] [PubMed]
  46. Zhang, Y.; Sun, Y.; Wu, Z.; Xiong, X.; Zhang, J.; Ma, J.; Xiao, S.; Huang, L.; Yang, B. Subcutaneous and intramuscular fat transcriptomes show large differences in network organization and associations with adipose traits in pigs. Sci. China Life Sci. 2021, 64, 1732–1746. [Google Scholar] [CrossRef]
Figure 1. The size of IMF adipocytes is smaller than BF and IMAT adipocytes. (A) H&E staining for BF, IMAT, and IMF from 300-day-old Laiwu pigs. (B) The distribution of adipocyte size of BF, IMAT, and IMF (C) The average adipocyte size of BF, IMAT, and IMF. Data are presented as the means ± SEM (n = 6). ** p < 0.01, *** p < 0.001.
Agriculture 14 00658 g001
Figure 2. Distinct lipidomic profiles in IMF compared to BF and IMAT in Laiwu pigs. (A) The distribution of lipid classes selected for further analysis was determined across all samples using LC-MS/MS. (B) Heatmap of the significantly changed lipids (p-value < 0.05 and VIP > 1) in the IMF group (n = 6). (C) The visualization presents a graphical comparison of lipid species between the BF and IMF groups, showcasing the log2 fold changes in their levels with significance levels represented as -log10 (p-value) (n = 6). (D) The ion intensity fold changes in lipid groups, including glycerolipids, glycerophospholipids, sphingolipids, fatty acyls, and sulfatides. (E) The ion intensity fold changes in significantly changed lipid classes, comprising FFAs, DAGs, AcCas, CLs, PSs, PC-Os, PE-Os, S1Ps, SMs, GM3s, and GalCers. Data are presented as the means ± SEM. * p < 0.05, ** p < 0.01, *** p < 0.001.
Agriculture 14 00658 g002
Figure 3. The number of carbon atoms and unsaturated double bonds of fatty acyl chains associated with TAGs decreased in IMF. (AC) The total lipid ion intensity of individual fatty acyl chains associated with TAGs is sorted by degree of intensity. (D) The total percentages of SFA, MUFA, and PUFA chains associated with TAGs. (E,F) The TAG pattern in the IMF group versus that in the BF group (E) or the IMAT group (F). Each dot represents a distinct TAG, organized along the x-axis based on the total acyl chain carbon number. (G,H) The TAG pattern in the IMF group versus that in the BF group (G) or the IMAT (H). Data are presented as the means ± SEM. ns p > 0.05, * p < 0.05, ** p < 0.01.
Agriculture 14 00658 g003
Figure 4. The number of carbon atoms and unsaturated double bonds of fatty acyl chains associated with glycerophospholipids increased in IMF. (A) The content of GPs with different carbon chain lengths and saturation. (B) The percentages of SFA chains, MUFA chains, and PUFA chains associated with glycerophospholipids. (C,D) The glycerophospholipid pattern in the IMF versus that in the BF (C) or the IMAT (D) is organized along the x-axis based on the acyl chain carbon number. (E) The content of CLs (C18:2) with different carbon chain lengths. (F,G) The GP pattern in the IMF group versus that in the BF (F) or the IMAT (G) is organized along the x-axis based on the number of double bonds in the acyl chains. Data are presented as the means ± SEM. ns p > 0.05, * p < 0.05, ** p < 0.01.
Agriculture 14 00658 g004
Figure 5. The number of carbon atoms and unsaturated double bonds of fatty acyl chains associated with AcCas was higher in the IMF. (A) The content of FFAs with different carbon chain lengths and saturation. (B) The content of AcCas with different carbon chain lengths and saturation (n = 6). (C) The total percentages of SFA chains, MUFA chains, and PUFA chains associated with fatty acyl. (D,E) The comparative analysis of fatty acyl patterns in IMF relative to BF (D) and IMAT (E) is illustrated, with the arrangement of data points along the x-axis reflecting the total number of carbon atoms in the acyl chains. (F,G) The distribution of fatty acyls in the IMF group compared to BF (F) and IMAT (G), with each species arrayed on the x-axis according to their total double bond content. Data are presented as the means ± SEM. ns p > 0.05, * p < 0.05, ** p < 0.01, *** p < 0.001.
Agriculture 14 00658 g005
Figure 6. IMF samples extracted from the LDM serve as representative specimens of adipose tissue and exhibit unique molecular characteristics that distinguish them from BF and IMAT. (A) The PCA plot of LDM, BF, IMAT, and IMF groups (B) Histogram of Pearson’s correlation coefficients between different tissues. Purple, gray, light blue, and light red symbols represent LDM, BF, IMAT, and IMF samples from Laiwu pigs, respectively. (C) The number of differentially expressed genes between different tissues. (D) Box plots of the gene expression markers for adipocytes in IMF and LDM tissues. (E,F) GSEA enrichment analysis between LDM and IMF. Data are presented as the means ± SEM.
Agriculture 14 00658 g006
Figure 7. IMF exhibits a reduced capacity for lipid deposition and increased innervation relative to BF. (A) Representation of the differentially expressed genes between BF and IMF. Genes overexpressed in BF and IMF are indicated in gray and pink, respectively. Genes enriched in the PPAR signaling pathway and axon guidance are highlighted. (B,C) GO and KEGG analysis of highly expressed genes in IMF and BF, respectively. (D,E) GSEA enrichment analysis between BF and IMF. (F) The heatmap of the genes involved in the PPAR signaling pathway, glycerolipid metabolism, and biosynthesis of unsaturated fatty acids. (G) The heatmap of the genes associated with axon guidance and the cAMP signaling pathway. (H,I) Relative mRNA expression levels of genes selected for qPCR identification (n = 4-6). (J) Representative images of tyrosine hydroxylase (TH) immunochemistry staining. Data are presented as the means ± SEM. * p < 0.05, ** p < 0.01, *** p < 0.001.
Agriculture 14 00658 g007
Disclaimer/Publisher’s Note: The statements, opinions and data contained in all publications are solely those of the individual author(s) and contributor(s) and not of MDPI and/or the editor(s). MDPI and/or the editor(s) disclaim responsibility for any injury to people or property resulting from any ideas, methods, instructions or products referred to in the content.

