Article

Environmental Impacts of the Beef Production Chain in the Northeast of Portugal Using Life Cycle Assessment

by
Pedro Henrique Presumido
1,*,
Fernando Sousa
1,
Artur Gonçalves
1,
Tatiane Cristina Dal Bosco
2 and
Manuel Feliciano
1
1
Mountain Research Centre (CIMO), ESA, Polytechnique Institute of Bragança, Campus de Santa Apolónia, 5301-855 Bragança, Portugal
2
Department of Environmental Engineering, Federal University of Technology, Av. Pioneiros 3131, 86036-370 Londrina, Brazil
*
Author to whom correspondence should be addressed.
Agriculture 2018, 8(10), 165; https://doi.org/10.3390/agriculture8100165
Submission received: 21 September 2018 / Revised: 15 October 2018 / Accepted: 17 October 2018 / Published: 19 October 2018

Abstract

:
The beef supply chain has multiple negative impacts on the environment. A method widely used to measure impacts from both the use of resources and the emissions generated by this sector is the life cycle assessment (LCA) (ISO 14040). This study aimed to evaluate a semi-intensive system (SIS) and an extensive organic system (EOS), combined with two different slaughterhouses located in the northeast of Portugal. The studied slaughterhouses are similar in size but differ in number of slaughters and in sources of thermal energy: natural gas (Mng) vs. biomass pellets (Mp). Four categories of environmental impact were evaluated: global warming potential (GWP), acidification potential (AP), eutrophication potential (EP), and photochemical ozone creation potential (POCP). As expected, higher impacts were found for SIS for all studied impact categories. Slaughterhouse activities, fertilizer production, and solid waste treatment stages showed little contribution when compared to animal production. Concerning the slaughterhouses activities, the main sources of environmental impact were the use of energy (electric and thermal) and by-products transportation.

1. Introduction

As global meat production continues to grow, high amounts of energy and water are used, releasing large quantities of waste and gaseous emissions into the environment. As a consequence, this agro-industrial sector has been facing significant market and social pressures to minimize its negative environmental impacts in order to become more eco-efficient. The need for balancing economic growth with environmental protection has become a major goal over the last decades [1].
According to United States Department of Agriculture [2], world beef production is approximately 60 million tons of carcass weight per year. The largest meat production country is the United States of America, with 19.0% of world production, followed by Brazil, with 15.3%, and the European Union (EU), with 13.0%.
In Portugal about 88,645 tons of beef are slaughtered per year, representing 70% of the needs of the internal market. The annual national consumption of meat is approximately 111.2 kg per person, of which about 17.9 kg are beef [3].
There are large variations in agricultural structure and in the use of the resources in the different beef production systems and, as a consequence, so are the dissimilarities in pollution load released into the environment. The most common animal production systems are based on the use of either intensive or extensive exploitations, depending on the level of technology used. In addition to these two production methods, there are alternative organic production systems, which seek to privilege the environmental protection with positive impacts on agricultural ecosystems [4].
When addressing the complexity of the meat production sector and its demand for resources, it is important to assess its interactions with the environment and evaluate its effects on ecosystems and other environmental impacts.
Therefore, there is the need for a holistic analytical approach to quantify the use of resources, emissions, and other significant environmental aspects of this sector and to highlight opportunities for product system improvements. Life Cycle Assessment (LCA) presents an important set of tools to quantify, evaluate, compare, and improve products and services in terms of their potential environmental impacts [5]. In LCA, all stages related to the products’ life cycle may be studied, including raw materials extraction, various stages of production and distribution, its use or consumption and the final stages leading to its disposal in the environment. The methodology is standardized for global environmental management through the ISO 14040:2006 [6] and 14044:2006 [7] standards. LCA is a tool that takes into account the triple bottom line (economic performance, environmental balance, and society needs). Thus, this tool of analysis of environmental impacts is not only based on environmental loads, but also on social and economic impacts. Life cycle sustainability assessment represents the evaluation of all environmental, social, and economic negative impacts and benefits of a product throughout its life cycle and how to use the result to support decision-making processes [8]. This tool can still allow farmers and other producers to respond to consumer and environmental groups regarding the environmental footprints of agricultural products.
There are several studies addressing the environmental impacts of beef production through LCA [9,10,11,12]. Most studies focus on 2–9 beef production systems and used LCA to evaluate global warming potential, whereas fewer studies evaluated eutrophication potential, acidification potential, land use, and energy use [13]. However, there is still a gap in the knowledge regarding animal production and slaughtering systems in the Iberian Peninsula [14]. In addition, there is still little knowledge regarding organic systems.
The aim of this study was to compare a semi-intensive system (SIS) and an extensive organic system (EOS) of bovine cattle, combined with slaughterhouses with different energy systems, namely natural gas boiler (Mng) and pellets boiler (Mp), and located in the northeast of Portugal.

2. Life Cycle Assessment Applied: State of the Art

The application of the LCA tool makes possible to calculate the impact of the productive chain on the environment and expresses the results through different impact categories (e.g., energy resources, climate changes, and toxicological effects) [15]. LCA is a relatively recent, fast-growing method and has become a standard and cutting-edge tool for investigating the environmental performance of a wide range of human processes [16]. Due to its strict definition, LCA is one of the most accepted tools in the study and measurement of the environmental impacts associated with products and services [17].
The application of the LCA tool has several advantages [18]: allows identifying and comparing different types of impacts; allows to present a situation where the economy, technology, and environment are in the same level of priorities; allows public participation; allows analyzing environmental balances, quantifying environmental discharges (air, water and soil), assessing the human and ecological effects of consumption of products and services.
The LCA has been used for the environmental evaluation of milk production [19,20], pork [21,22], beef [23,24], and other agricultural products [25,26]. However, the LCA system has some limitations regarding its application. Often, in order to make the study feasible, it is necessary to simplify some aspects that can significantly affect the results [27]. The simplification of the aspects and the insufficient data collected sometimes leads to an underestimation of the impacts caused by the product/service process. To minimize these impacts in LCA studies, more databases have been created with a broad spectrum of information across different product/service sectors.
The application of the LCA methodology is carried out in four stages: (1) Definition of the objective and scope; (2) Inventory analysis; (3) Impact assessment, and (4) Interpretation of results. The definition of scope is the starting point of the LCA since it is at this stage that the necessary resources are defined to achieve the objectives of the study. Also at this stage, the system boundary and the scope are defined, identifying the fundamental processes of the productive system to be included, and establishing the level of detail of the study.
Life cycle inventory analysis is the second stage of a LCA. This step includes the collection of data and the quantification the inputs and outputs of a production system in order to achieve the proposed objectives of the study. The main data collected are energy, transport, raw materials, emissions to air, soil, and water, effluents, and wastes [28].
In the life cycle impact assessment phase, the impact category is selected and the potential environmental impacts are calculated for each category. In the livestock sector, the most recurrent categories of impacts are global warming, acidification, eutrophication and energy consumption [24,29,30]. In LCA, all relevant emissions and resources used throughout the life cycle of a product are aggregated and expressed per functional unit [31]. The characterization factors can be obtained through a methodology proposed by the CML 2001 model [32]. The CML 2001 is an impact assessment method that restricts the quantitative modeling at the initial stages in the cause-effect chain to limit uncertainties.
Finally, the interpretation phase of the life cycle methodology should provide conclusions, recommendations, and decision-making orientations, taking into account the initial objective and scope of the work.

3. Materials and Methods

3.1. General Systems Characteristics

The two systems analyzed in this study are located in the northeast of Portugal: a semi-intensive system (SIS) and an extensive organic system (EOS) (Figure 1). In the SIS, the birth of the animals takes place throughout the year and each calf is weaned at 7–9 months of age. The replacement rate is 12 to 15% per year and calf mortality between birth and weaning is 5%. In this system, the age of the first calving is between 24 and 27 months and the slaughter age is 7 to 9 months for calves. The diet for each category of animal is composed mainly of local hay and concentrated feeds. The waste products are retained in the housings, processed, and subsequently spread in the field. Rearing and finishing occur with the animals in free housing (Table 1).
In the EOS, cows spend their life in the pasture. Weaning occurs between 6 and 8 months of age depending on the month of birth and especially on pasture availability during the year. The replacement rate is 8 to 10% and calf mortality between birth and weaning is 2%. In EOS, the age of slaughter is between 6 and 8 months for calves. Animal feed is, including grazing and food produced on the farm itself, predominantly made up of straw and hay, in addition to the use of commercialized concentrated feed. As animals graze most of the time, manure is soon disposed in the pasture. Rearing and finishing occur partly with animals in feedlot and in free housing (Table 1).
Pastures for both SIS and EOS were considered as kept in a natural state, although with occasional fertilization with calcium superphosphate 18%, in the amount of 200 kg per ha with application once every 2–3 years. This operation lasts on average about 30–40 min per ha.
Slaughterhouses processes several types of animals, including cattle, goats, sheep, and pigs. However, this study aimed to perform a LCA of beef production only. The slaughterhouses studies with different energy systems were: slaughterhouse with natural gas boiler (Mng) and slaughterhouse with pellets boiler (Mp).
The slaughtering process for Mng takes 28 h of work per week, with approximately 500,000 kg of beef slaughtered per year, coming from approximately 2700 units of cattle entering the slaughter system. The boiler uses natural gas to produce hot water and so does the blood cooker.
On the other hand, Mp also has 28 h of work per week and slaughters approximately 800,000 kg of beef per year, coming from approximately 4000 units of cattle. The main fuel for the boiler is pellets. In addition, the slaughterhouse has a propane-fueled boiler, which is used only as backup in the absence of pellets.

3.2. System Boundary, Allocation, and Functional Unit

This study considered the production chain of cattle from feed production to the slaughterhouse, with the respective transport, energy production, fertilizer production, and incineration as a treatment for the generated meat residues (Figure 1).
Processes were chosen considering the availability of reliable data. This LCA aimed to represent at least 95% of the total mass, 90% of the total energy inputs [33] and all inputs of environmental relevance in the beef production chain. Some data was not considered including cleaning agents, tools used in the construction of stables and other works, animal vaccines, and transportation of the final consumer to the butcher shop.
Allocation consisted on the subdivision of process impact factors between the main products and by-products of the system. This analysis strategy is used when the system generates more than one product. Thus, the allocation applied to this study was based on the weight of the animals [34].
To provide a basic measure for the interpretation and comparison of results, the functional unit (FU) used was 1 kg of beef carcass leaving the slaughterhouse.

3.3. Life Cycle Inventory Analysis

For the life cycle inventory analysis, the main inputs of the processes, defined as the resources used, and outputs to the environment (emissions) related to beef production were taken into consideration. The inputs are based mainly on data collected from questionnaires applied to business owners, with additional data from experts in the different stages of the production stream. Some bibliographic references and databases from GaBi 6.0 software (Thinkstep, Leinfelden-Echterdingen, Germany) were also used. The primary data includes averages of data collected for two representative years (Table 2).
Air emissions data associated with burning fossil fuels were estimated based on emission factors from the literature [35]. Data on CH4 and N2O emissions from animal waste and enteric fermentation were taken from IPCC [36]. Emissions from waste to water bodies receptors were calculated considering the maximum values established by the Portuguese Law [37].
Electrical energy consumption was considered throughout the entire process of beef production, from animal production to slaughter at the slaughterhouse. Data on the inputs and outputs of power energy were obtained from the database from the GaBi 6.0 software and the questionnaires were provided by the companies.
The GaBi 6.0 database was also applied to estimate inputs and outputs related to transportation between the livestock farm and the slaughterhouse (approximately 50 km), fertilizer production, and displacement of waste generated for incineration and slaughterhouse boiler. Impacts from these processes were estimated based on data from Portugal, the European Union, or both. Concentrated feed production was not considered in this study because of its low overall relevance to environmental impacts as reported in the study by Tichenor et al. [38].

3.4. Life Cycle Impact Assessment (LCIA)

There are several categories of environmental impact that can be related to meat production activities, however in the present study, environmental impact categories were restricted to global warming potential (GWP), acidification potential (AP), eutrophication potential (EP), and photochemical ozone creation potential (POCP). The life cycle impact assessment (LCIA) followed the methodology CML 2001, proposed by Guinée et al. [32] and updated for the year 2016 [39].

4. Results and Discussion

4.1. Global Warming Potential (GWP)

Greenhouse gas (GHG) emissions from SIS and EOS are shown in Figure 2. The global results were 22.3 kg CO2-eq kg−1 for SIS and 16.4 kg CO2-eq kg−1 for EOS. Results for SIS regarding GWP are close to those estimated in studies such as Lupo et al. [41] with 23.0 kg CO2-eq kg−1 for the USA, Ruviaro et al. [42] with estimates of 23.4 kg CO2-eq kg−1 for beef production in Brazil, or Mogensen et al. [43] with 23.1 kg CO2-eq kg−1 in Denmark and 25.4 kg CO2-eq kg−1 in Sweden. Nguyen et al. [44] reported results between 16.0 and 27.3 kg CO2-eq kg−1 for the European Union. According to Leip et al. [45], the average GHG emissions from the production of ruminants in the European Union, including feed production, is approximately 20–23 kg CO2-eq per kg of meat and the average is 22.2 kg CO2-eq kg−1 to beef produce.
GHG emissions estimated for EOS are close to those presented by Casey and Holden [46], who obtained emissions 13.8 kg CO2-eq kg−1 when studying different animal production systems. In addition, the authors argue that different animal production may reduce GHG emissions, but this should not affect meat production, while trying to find the balance between production and environmental protection. Peters et al. [47], using Australian case studies, found 17.5 kg CO2-eq kg−1, Williams et al. [48] found 18.2 kg CO2-eq kg−1 for the United Kingdom (UK), and Alig et al. [49] found 14.8 kg CO2-eq kg−1 for Switzerland; all of these studies reported similar results for GHG emissions in EOS. Organic animal production appears as a valuable alternative that can meet the need for promoting low environmental impact production. Studies carried out by Haas et al. [50] in Germany and by Wood et al. [51] in Australia concluded that a transition to organic production could be a viable way to reduce energy use and GHG emissions.
Figure 3 shows the main GHG emissions for SIS and EOS systems. CH4 from the enteric fermentation process represents 60.5% and 62.8% of the total GHG emissions for SIS and EOS, respectively. However, when analysis is based on the absolute emission values, potentially higher CH4 emissions are found in SIS (13.5 kg CO2-eq kg−1) when compared with those from EOS (10.3 kg CO2-eq kg−1). These results are consistent with research addressing enteric fermentation with a weight of 40–70% of the total GHG emissions [52]. Moreover, Salvador et al. [20] addressing the environmental impact of organic and conventional small-scale production in mountain areas estimated contributions from enteric CH4 of 52.8% for EOS and 48.6% for SIS. Similar proportions were obtained in studies developed by Meier et al. [25] in which the EOS systems enteric CH4 contribution to GHG emissions was 55% and 50% for SIS. These authors argued that such higher CH4 emissions are a consequence of forage based diets used in the organic system.
Nitrous oxide (N2O) emitted from the manure handling accounted for 35.9% (SIS) and 34.7% (EOS) of the total emissions. These results are at the upper limit of the interval presented in Cerri et al. [53], which reported a contribution in N2O to the GHG between 19–33%. In this sense, the feed composition in the different varieties of exploitation can affect the flow of N2O emitted into the atmosphere. The protein content consumed by the cattle affects the digestion of nitrogen and the amount of nitrogen gaseous emission that are excreted [54].
Emissions from the use of fuel and electric energy, mostly CO2, have low contributions, 3.5% in SIS and 2.5% in EOS. Wiedemann et al. [55], in a study to estimate GHG emissions in Australian beef cattle industry, found CO2 contributions to be in the range of 3–5% from fossil fuels and electrical energy used. It seems clear that direct and indirect CO2 emissions from fuel and electricity use represent a relatively small part of the carbon footprint in beef production chain [56]. Transport and treatment of meat waste by incineration also appear to have little relevance in this category of environmental impact [29].
Hyslop [57] carried out simulations for the UK context to evaluate strategies to reduce GHG emissions and concluded that short-term finishing systems, linked to higher production efficiency using feeding stuffs, could substantially reduce GHG. The development of management techniques for the productive systems and the increase in quality of the feeding of animals could reduce the enteric emissions of methane by up to 22% [58].
Furthermore, there may be substantial reductions in GHG emissions in animal production through genetic screening, forage selection and management, inhibition of methane, and animal care [59]. Another solution to reduce these GHG emission is to improve the production and intensification of pastures to reduce the fattening time before animal slaughter [60].
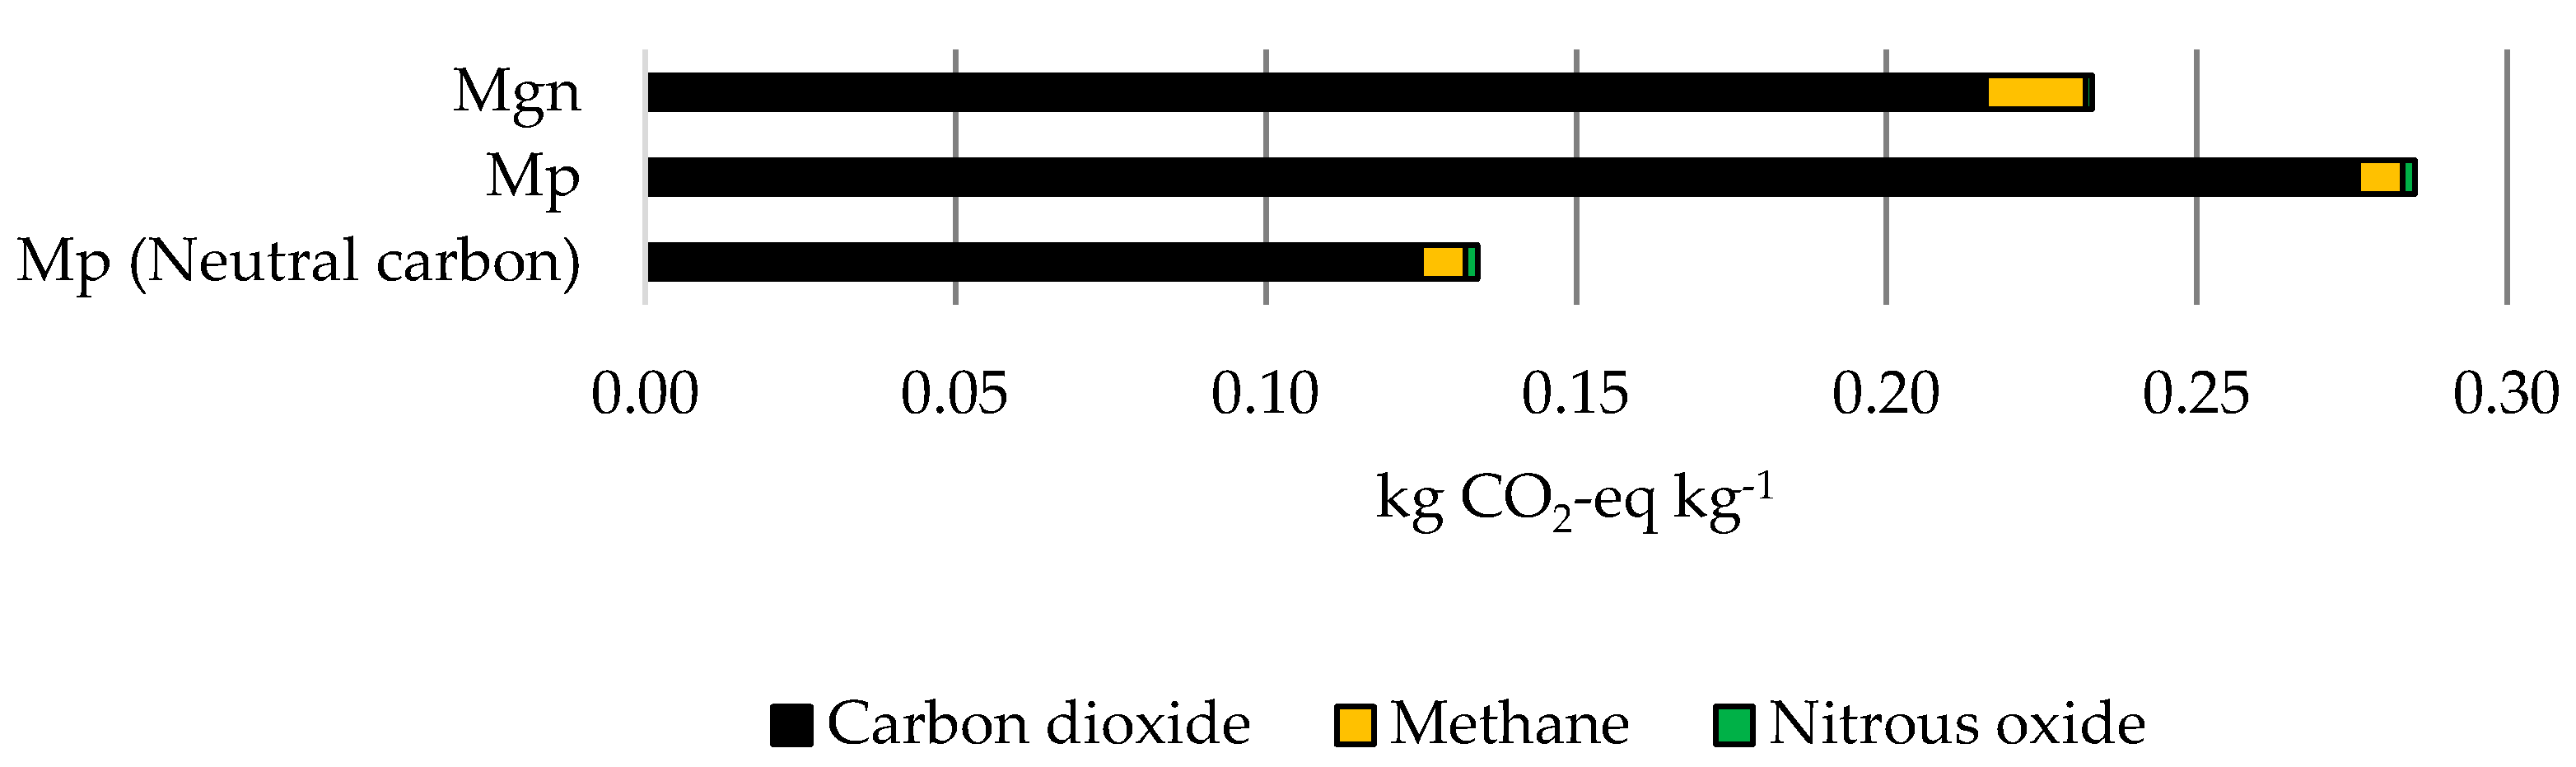
Figure 4 shows the direct and indirect GHG emissions from the slaughterhouse with natural gas boilers (Mng) and from the slaughterhouse with a pellet boiler (Mp). Emissions of GHG per functional unit were similar in both slaughterhouses and relatively low when compared to GHG emissions from farming 0.233 kg CO2-eq kg−1 for Mng and 0.285 kg CO2-eq kg−1 for Mp (includes all emissions).
The use of pellets is commonly regarded an energy consumption that reduces GHG emission. Pellets used as biomass fuels are generally considered to be carbon-neutral due to the production of wood and the accumulation of CO2 for their growth [61,62,63].
Mogensen et al. [64] estimated GHG emissions throughout the beef production system, from food production to slaughter, with a global amount of 19 kg CO2-eq kg−1, and only 0.2 kg CO2-eq kg−1 was inputted to processes taking place at the slaughterhouse.
Similarly, Desjardins et al. [65] reported that transport-associated GHG emissions for slaughter and slaughter operations were 0.18 kg CO2-eq kg−1, or about 2% of GHG emissions from animal production. These results show that the environmental impact intensity related to GHG emissions in slaughterhouses is lower when compared to the animal production processes.
Therefore, the contributions and emissions to the GWP were lower than the Mng. For this study, total GHG emission values were reduced by 53% by neutralizing the output of carbon by the pellet boiler (from 0.285 kg CO2-eq kg−1 to 0.134 kg CO2-eq kg−1).
Contributions by source of GHG emissions from the slaughter process can be observed in Figure 5. The use of inputs such as heat and electricity were the largest contributors (Mng with 75.0% and Mp with 77.5%), followed by the incineration of meat wastes (Mng with 20.5% and Mp with 16.6%) and of transport (4.5% for Mng and 5.9% for Mp). These results agree with those on the studies of Mogensen et al. [64] that analyzed different beef production systems, focusing on the slaughter phase.
Mp has a specific energy consumption lower than Mng. The amount of GHG emissions from the meat waste treatment process produced is also an indicator of the efficiency of the slaughter process, as it indirectly identifies the amount of waste that is destined for incineration. That means, that the lower the losses during the slaughter process, the greater the amount of meat available for commercialization.
Also relevant is the contribution of boiler emissions, in which Mp had higher GHG emission (58.0%) than Mng (34.9%) (Figure 5). Boiler combustion using natural gas as fuel provides a better energy yield, generates less waste emitted to the atmosphere, and, consequently, leads to an improvement in air quality [66]. However, when the Mp (neutral C) is taken into account, the boiler decreases its contribution to 22% lower than the Mng.

4.2. Acidification Potential (AP)

Table 3 indicates main results for the animal production systems under study for acidification potential (AP). SIS had 168.0 g SO2-eq kg−1 for AP. In a study by Lupo et al. [41] using a model of LCA to estimate the environmental impacts associated with four different systems of North American beef production, an impact of 165 g SO2-eq kg−1 was estimated for a semi-intensive system. In studies conducted by Nguyen et al. [44] in the EU, authors found AP values ranging from 101 to 210 g SO2-eq kg−1. In France, results for the AP were also close to those estimated in the present study, with a value of approximately 170 g SO2-eq kg−1 [34].
On the other hand, for EOS the estimated value of AP was 71.9 g SO2-eq kg−1, less than half the value found in the SIS system. The AP associated with beef production in organic or conventional systems with higher slaughter ages has additional impacts than in systems that obtain the ideal slaughter weight in less time [44,48]. There are several factors which justify these differences, including: (i) longer life to produce one kg of beef requires additional power and effort in soil maintenance and thus provides greater leaching of pollutants and gaseous emissions; (ii) higher production of manure per kg of beef in systems where the age of slaughter is highest increases the rate of nitrogen and ammonia losses. Williams et al. [48] compared ammonia losses for steers with slaughter ages from 22 to 24 months with steers from 18 to 20 months and found that in the first case the losses were higher. These results can also be explained by the different methods used in this study for modeling nitrogen and ammonia flows and emissions, since emissions of these constituents depends on the time of animal slaughter.
The difference in AP values may be related to the emissions of acidic pollutants from feed and higher emissions of ammonia (NH3) from manure [24]. The main acidifying pollutants of livestock are NH3 and SO2 [67]. Acidifying pollutants affect soil, surface and groundwater, biological organisms, and other materials, causing fish mortality, forest decline, and erosion of buildings, among other effects [68].
The NH3 emission factors related to the manure are higher for SIS system due to their storage in animal shelters, which is reflected in the higher AP in SIS compared to EOS. On the other hand, despite the higher contribution from cattle manure, the deposition of animal feces directly into the soil can result in a lower environmental impact (e.g., global warming, energy needs, land use, and eutrophication) than the application of synthetic fertilizers [69].
Agriculture, in particular livestock production, accounts for about 83.2% of ammonia emissions in the EU-28 [70]. Animal production was the major contributor to AP for both SIS and EOS (96.5% and 97.9%, respectively) (Table 4). These values are mainly a consequence of emissions from waste and the high amount of gases released by enteric fermentation [20]. Thus, NH3 is one of the major contributors to AP in cattle production for slaughter (Table 3).
Feed and fertilizer production had low contributions to the AP indicator in relation to the total animal production, both for SIS and EOS (Table 4).
Concerning the slaughter stage, estimated AP values were 0.32 and 0.37 g SO2-eq kg−1 for Mng and Mp slaughterhouses, respectively (Figure 6).
AP was 16% higher for Mp than for Mng. The main differences expressed in quantitative terms were found for nitrogen oxides, with 0.166 g SO2-eq kg−1 for Mng and 0.198 g SO2-eq kg−1 for Mp, and for hydrogen chloride with 0.01 g SO2 -eq kg−1 for Mng and 0.0185 g SO2-eq kg−1 for Mp (Figure 6).
The pollutants with the greatest contribution to the AP, both for Mng and Mp, were nitrogen oxides (NOx) and sulfur dioxide (SO2). In Mng, NOx and SO2 accounted for about 92.5% of total AP while in Mp, the weight of these same pollutants represented 91.5% (Figure 6). Emissions of nitrogen and sulfur oxides into the atmosphere can lead to the formation of nitric acid and sulfuric acid, respectively. The fate of many of these acids is its deposition in terrestrial and aquatic ecosystems, reducing the pH of soils and waters [71].
Differences in AP values for slaughterhouses may be related to the type of fuel used in the boiler and the efficiency of the use of electric energy. Figure 7 shows the main contributions to the AP from Mng and Mp slaughterers. It is estimated that the contribution of the electric energy to the AP was lower in the Mp (21.9%) than in the Mng (43.1%), as for the former slaughterhouse, there was a higher production of slaughtered meat with a lower consumption of electricity. Conversely, the situation reverses with regard to the consumption of thermal energy, which is higher in Mp (Mp = 41.0% and Mng = 23.0%).
The contribution of the incineration of the meat residues to the AP was 10.0% for Mng and 7.7% for Mp. The highest emissions estimated for Mng were attributed to the highest amount of meat waste generated in Mng compared to Mp.

4.3. Eutrophication Potential (EP)

The contribution of animal production to the eutrophication potential (EP) impact category represented more than 96% of the total environmental impact of EP for both SIS and for EOS (Table 5). Huerta et al. [10] agree that animal production is the largest contributor to the EP, yet these authors attributed this amount to emissions from animal waste handling. SIS had emissions related to EP 25% higher than those observed in EOS (Table 5). Many studies show that EP is mainly caused by NH3 emission and by leaching of NO3 and PO43− [9,30,44].
Pelletier et al. [72], in a LCA study for three bovine production systems, estimated EP values between 104 and 142 g PO4−3-eq kg−1. EP values estimated by Nguyen et al. [44] to conventional systems of beef production in the EU ranged between 87 and 159 g PO4−3-eq kg−1. Cederberg and Darelius [73], in a study of organic bovine production for slaughter, obtained values ranging from 116 to 146 g PO4−3-eq kg−1. These emissions are generated mainly from animal waste and from the use of nitrogen or phosphate fertilizers in pasture.
The leaching of nitrate (NO3) and phosphate (PO43−) depends mainly on climatic and soil conditions, and may differ widely among countries or even regions of the same country [74]. This partially explains the large variation observed in EP among animal production systems.
The losses of NO3 and PO43− from manure, either directly deposited on pasture by animals or stored in feedlot, were the largest contribution to eutrophic emissions for both systems (SIS of 71.1% and EOS of 82.7%) (Figure 8). Gaseous emissions at farm level, mainly NH3 and N2O, associated to the deposition of manure on pasture, contributed to 23.6% (SIS) and 12.6% (EOS). The use of fertilizers contributed to 5.3% (SIS) and 4.7% (EOS) for the total EP values.
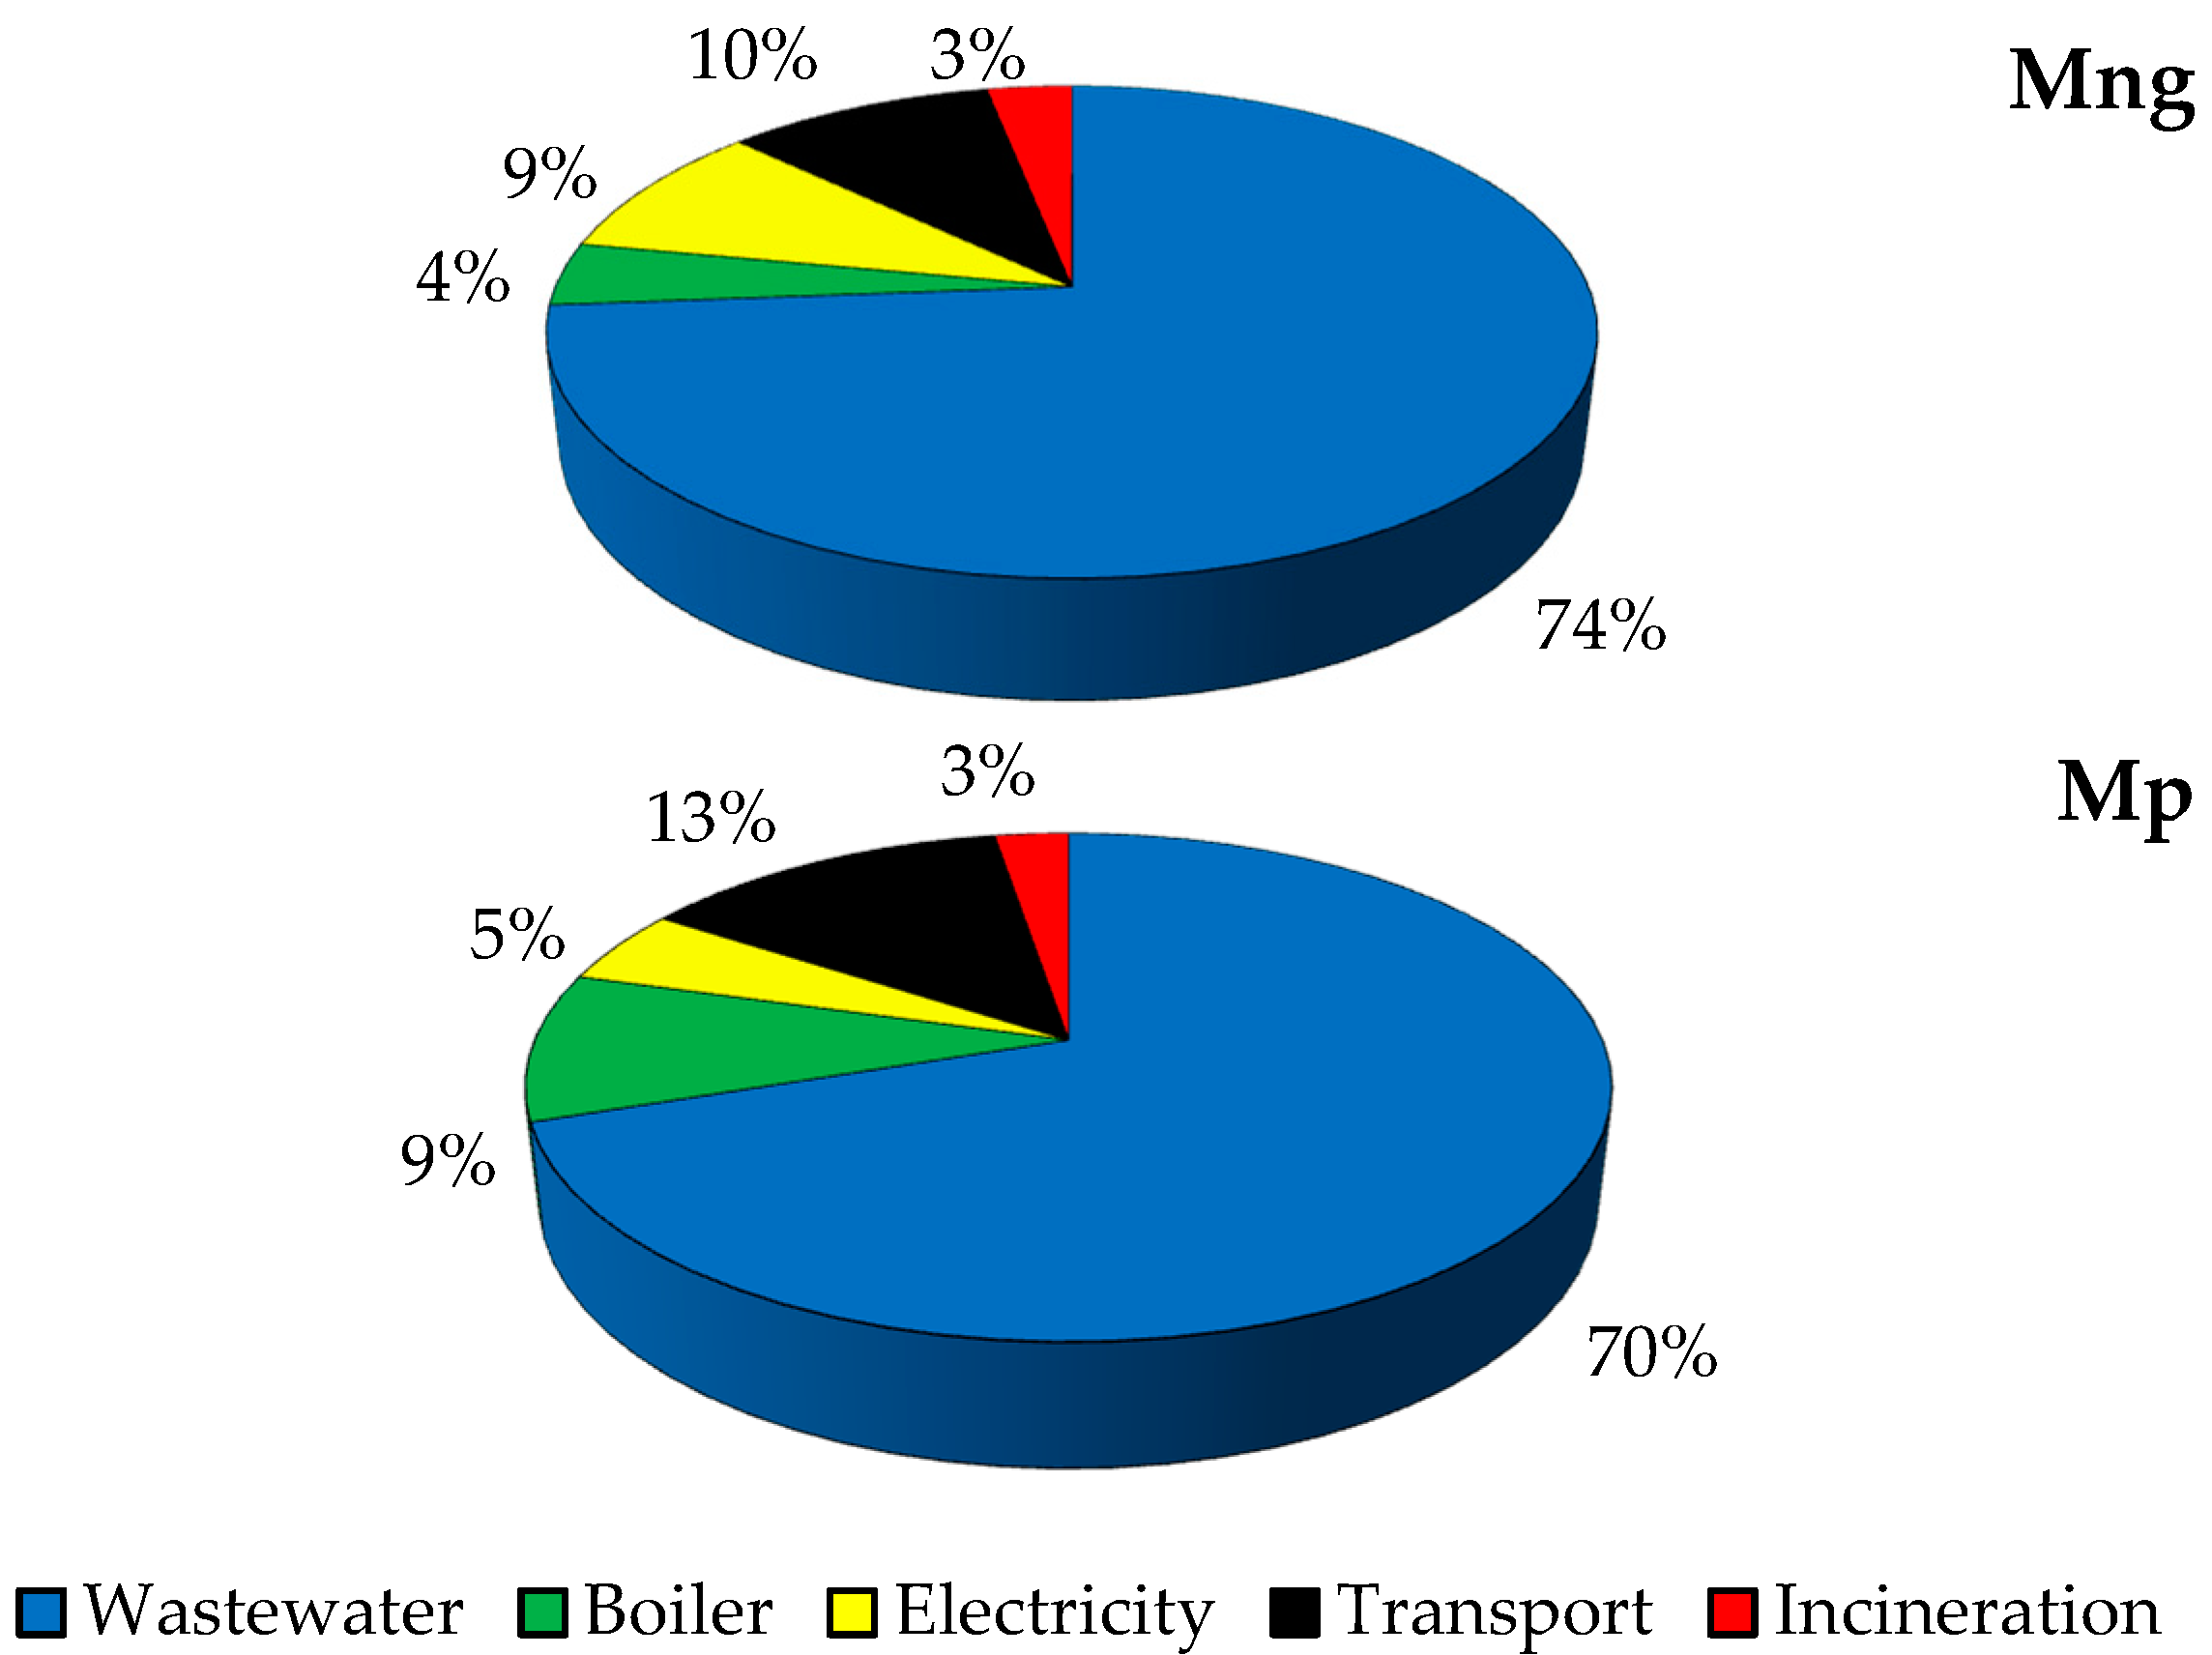
EP estimated for Mng and Mp slaughterhouses is shown in Figure 9. Regarding outputs, the flows that most influenced the EP were emissions to the aquatic environment, with 0.152 g PO4−3-eq kg−1 for Mng and 0.149 g PO4−3-eq kg−1 for Mp, coming mainly from the emissions of chemical oxygen demand (COD) and nitrate. Wastewater from slaughterhouses is considered as a potential pollutant because of its complex composition, with the presence of fats, proteins, and fibers from the slaughter process, as well as parts of the stomach and intestine of the animals [75].
The analysis of Figure 10 shows that the largest contributions are related to the wastewater produced in the slaughterhouses for both Mng (74%) and Mp (70%).
The other relevant shares of emissions influencing EP are air emissions in the form of nitrogen oxides (Mng with 0.045 g PO4−3-eq kg−1 and Mp with 0.053 g PO4−3-eq kg−1) and ammonia (Mng with 0.001 g PO4−3-eq kg−1 and Mp with 0.002 g PO4−3-eq kg−1) (Figure 9). These gases come mainly from transportation, production of electricity, and emissions from boilers.
Differences in slaughterhouse contributions may be related to improved slaughter efficiency. The more the slaughter process can take advantage of meat material, avoiding wastes, the less substances are directed to wastewater and the lower the impact on the EP [76].
The percentage contribution of transports for Mng and Mp are, respectively, 10% and 13% (Figure 10). The values differ as a function of the distances traveled in both systems, so that the greater the distance between the slaughterhouse and the meat distribution center, the greater the contribution of this sector to the EP. The electric energy used for the beef slaughtering process had a contribution of 9% and 5% for Mng and Mp, respectively.
Finally, Mp pellet fuel boiler had a higher contribution (9%) to the EP than the natural gas boiler (4%) (Figure 10). The highest percentage of EP for boilers is mainly due to the presence of NOx. NOx emissions can cause health problems in addition to several environmental impacts such as photochemical pollution, acid rain, and eutrophication [77]. Thus, the boiler with natural gas supply had lower environmental impacts when compared to the EP for the slaughterhouse.

4.4. Photochemical Ozone Creation Potential (POCP)

Overall, the POCP was higher for SIS than for EOS. Volatile organic compounds (VOCs) are the air components that contributed the most to the POCP with 24.50 g C2H4-eq kg−1 and 8.90 g C2H4-eq kg−1, followed by CH4 with 2.90 and 2.20 g C2H4-eq kg−1, respectively for SIS and EOS (Table 6).
The primary pollutants commonly found in urban environments are CO, CO2 NO, SO2, and VOCs. Carbon compounds and nitrogen oxides are the precursors of tropospheric ozone through complex photochemical reactions [78]. Each compound has a contribution dependent on its concentration in the atmosphere, the relative proportion of precursors in the atmosphere and their reactivity [79].
In order to facilitate the comparison with POCP values reported in other studies, results estimated in this study by the CML 2001 model (g C2H4-eq kg−1) were converted to the ReCiPe model (kg VOCs-eq kg−1). As a consequence, the results of this study for total POCP emissions changed from 27.40 g C2H4-eq kg−1 to 6.99 × 10⁻² kg VOCs-eq kg−1 in SIS and 11.20 g C2H4-eq kg−1 to 2.85 × 10⁻² kg VOCs-eq kg−1 in EOS. Environmental impacts of combined milk and meat production in Norway were studied and the POCP values per kg of beef carcass were between 8.88 × 10⁻² and 9.45 × 10⁻² kg VOCs-eq kg−1 [80]. For Zucaro et al. [12], the results for POCP in beef production were approximately 3.40 × 10⁻² kg VOCs-eq kg−1.
Animal production was identified as the subsystem of the beef value chain with the highest POCP (Table 7), mainly due to emissions from waste and enteric fermentation which emit large amounts of gases influencing POCP [81]. Similar results were also obtained in study conducted in Portugal on cattle for milk production, in which the authors attributed emissions mainly to CH4 and enteric fermentation of animals [82]. Other processes associated to beef production had low relevance when compared to animal production.
Results regarding the impacts of slaughterhouses in POCP showed negative values in some activities of the beef slaughter process, especially in the boiler, electricity, and incineration of solid waste. These values can be explained by the higher emissions of NO which reacts with atmospheric ozone, reducing its formation and, consequently, causing a negative effect on POCP [83].
VOCs were the most relevant contributor to the POCP of the slaughterers, with 0.0153 g C2H4-eq kg−1 for Mng and 0.020 g C2H4-eq kg−1 for Mp. VOCs are known ingredients in the photochemical production of tropospheric ozone (O3) in the presence of nitrogen oxides (NOx) and sunlight [84].
The transport of meat waste from the slaughterhouse to the distribution center appears as the largest contributor to POCP (Figure 11). Generally, VOCs are emitted by vehicles through three ways [85]: (i) exhaust emission from the engine consisting of unburned fuel and the VOCs generated by fuel combustion during vehicle operation; (ii) evaporative emissions, from fuel vapor escaping from vehicles; and (iii) release of VOCs from vehicle equipment, including plastic panels, leather seats, rubber tires, etc.

5. Conclusions

This study showed the main environmental impacts caused by the production of beef in Portugal. Results add to regional knowledge accuracy and enable benchmarking between products from multiple regions. Moreover, for beef production, regionalization of inventories and results is required to guarantee that the LCA framework meets the original characteristics of the study.
There are many difficulties in conducting LCA tool for food products. The ideal would be a comprehensive study including agricultural production, industrial processing, storage and distribution, packaging, consumption, and waste management. However, all these sets form a large and complex system. In addition, the LCA study involves many scientific disciplines and requires extensive multidisciplinary knowledge. Despite the limitations of LCA, this methodology is still a unique analysis to quantify environmental impacts caused by the products and services of human activities. In addition, with this tool it is possible to interpret the results and take an attitude to minimize the influence of the impacts on the environment.
Results show that the environmental impacts of SIS and EOS are different. SIS had greater environmental impacts for all categories analyzed when compared to EOS. Such difference is related to higher emissions of methane, nitrous oxides, ammonia, and phosphate derived mainly from enteric fermentation and manure management. The slaughter of animals, fertilizer production and treatment of solid waste presented little significance for the environmental impacts studied when compared with the contributions of animal production.
Regarding the slaughterhouses studied, Mng presented the largest contributions mainly to GWP and POCP. The main contributions were related with the use of energy (electric and thermal) and by-products transportation. Energy efficiency measures can be implemented to minimize all impacts, such as the use of renewable energy sources and the reuse of heat generated by boilers. The impacts generated by transport can also be minimized by reducing the distances between slaughter units and meat waste treatment units.
The EOS has lower environmental impacts than SIS, indicating that a transition to organic farming could be a viable way to reduce emissions to the environment. For SIS, a possible alternative to minimize environmental impacts may be achieved by increasing animal weight gain in a shorter time and improve animal production efficiency.
The comparison of environmental performance with the economic evaluation for production systems and slaughter systems should be considered in future work using decision support models that allow integration and optimization between environmental and economic variables. Furthermore, future studies on the use of alternative sources in feed production and the application of the mitigating measures should be performed to corroborate the environmental benefits of the same.

Author Contributions

Conceptualization and methodology: P.H.P., A.G., and M.F.; Data collection: F.S. and M.F.; Data validation: F.S. and M.F.; Writing—Original draft preparation: P.H.P.; Writing—Review: A.G., T.D.B., and M.F.; Supervision: M.F.

Funding

This research was supported by the project ECODEEP (Eco-efficiency and Eco-management in the Agro Industrial sector, FCOMP–05–0128–FEDER–018643) and the Foundation for Science and Technology (FCT, Portugal) and FEDER under Programme PT2020 for financial support to CIMO (UID/AGR/00690/2013).

Acknowledgments

The authors also like to thank the farmers and companies for their cooperative attitude and for having provided relevant data for this research.

Conflicts of Interest

The authors declare no conflict of interest.

References

  1. Santagata, R.; Ripa, M.; Ulgiati, S. An environmental assessment of electricity production from slaughterhouse residues. Linking urban, industrial and waste management systems. Appl. Energy 2017, 186, 175–188. [Google Scholar] [CrossRef]
  2. Livestock and Poultry: World Markets and Trade; United States Department of Agriculture (USDA), Office of Global Analysis, Foreign Agricultural Service: Washington, DC, USA, 2016.
  3. Estatísticas Agrícolas 2014; Instituto Nacional de Estatística (INE): Lisboa, Portugal, 2015.
  4. Reganold, J.P.; Wachter, J.M. Organic agriculture in the twenty-first century. Nat. Plants 2016, 2, 15221. [Google Scholar] [CrossRef] [PubMed]
  5. Kovacic, I.; Waltenbereger, L.; Gourlis, G. Tool for life cycle analysis of facade-systems for industrial buildings. J. Clean. Prod. 2016, 130, 260–272. [Google Scholar] [CrossRef]
  6. ISO 14040 International Standard. Environmental Management—Life Cycle Assessment—Principles and Framework; International Organization for Standardization (ISO): Geneva, Switzerland, 2006. [Google Scholar]
  7. ISO 14044 International Standard. Environmental Management—Life cycle assessment—Requirements and Guidelines; International Organization for Standardization (ISO): Geneva, Switzerland, 2006. [Google Scholar]
  8. Falcone, P.; Imbert, E. Social life cycle approach as a tool for promoting the market uptake of bio-based products from a consumer perspective. Sustainability 2018, 10, 1031. [Google Scholar] [CrossRef]
  9. Berton, M.; Agabriel, J.; Gallo, L.; Lherm, M.; Ramanzin, M.; Sturaro, E. Environmental footprint of the integrated France—Italy beef production system assessed through a multi-indicator approach. Agric. Syst. 2017, 155, 33–42. [Google Scholar] [CrossRef]
  10. Huerta, A.R.; Güereca, L.P.; Lozano, M.S.R. Environmental impact of beef production in Mexico through life cycle assessment. Resour. Conserv. Recycl. 2016, 109, 44–53. [Google Scholar] [CrossRef]
  11. Martin, M.; Brandão, M. Evaluating the environmental consequences of Swedish food consumption and dietary choices. Sustainability 2017, 9, 2227. [Google Scholar] [CrossRef]
  12. Zucaro, A.; Forte, A.; De Vico, G.; Fierro, A. Environmental loading of Italian semi-intensive snail farming system evaluated by means of life cycle assessment. J. Clean. Prod. 2016, 125, 56–67. [Google Scholar] [CrossRef]
  13. De Vries, M.; van Middelaar, C.E.; de Boer, I.J.M. Comparing environmental impacts of beef production systems: A review of life cycle assessments. Livest. Sci. 2015, 178, 279–288. [Google Scholar] [CrossRef]
  14. Morais, T.G.; Teixeira, R.F.M.; Domingos, T. Regionalization of agri-food life cycle assessment: A review of studies in Portugal and recommendations for the future. Int. J. Life Cycle Assess. 2016, 21, 875–884. [Google Scholar] [CrossRef]
  15. Pennington, D.W.; Potting, J.; Finnveden, G.; Lindeijer, E.; Jolliet, O.; Rydberg, T.; Rebitzer, G. Life cycle assessment Part 2: Current impact assessment practice. Environ. Int. 2004, 30, 721–739. [Google Scholar] [CrossRef] [PubMed]
  16. Yasar, A.; Rasheed, R.; Tabinda, A.B.; Tahir, A.; Sarwar, F. Life cycle assessment of a medium commercial scale biogas plant and nutritional assessment of effluent slurry. Renew. Sustain. Energy Rev. 2017, 67, 364–371. [Google Scholar] [CrossRef]
  17. Lo-Iacono-Ferreira, V.G.; Torregrosa-López, J.I.; Capuz-Rizo, S.F. Use of Life Cycle Assessment methodology in the analysis of Ecological Footprint Assessment results to evaluate the environmental performance of universities. J. Clean. Prod. 2016, 133, 43–53. [Google Scholar] [CrossRef]
  18. Passuello, A.C.B.; Oliveira, A.F.; Costa, E.B.; Kirchheim, A.P. Aplicação da Avaliação do Ciclo de Vida na análise de impactos ambientais de materiais de construção inovadores: Estudo de caso da pegada de carbono de clínqueres alternativos. Ambiente Construído 2014, 14, 7–20. [Google Scholar] [CrossRef]
  19. Colombini, S.; Zucali, M.; Rapetti, L.; Crovetto, G.M.; Sandrucci, A.; Bava, L. Substitution of corn silage with sorghum silages in lactating cow diets: In vivo methane emission and global warming potential of milk production. Agric. Syst. 2015, 136, 106–113. [Google Scholar] [CrossRef]
  20. Salvador, S.; Corazzin, M.; Piasentier, E.; Bovolenta, S. Environmental assessment of small-scale dairy farms with multifunctionality in mountain areas. J. Clean. Prod. 2016, 124, 94–102. [Google Scholar] [CrossRef]
  21. González-García, S.; Belo, S.; Dias, A.C.; Rodrigues, J.V.; Costa, R.R.; Ferreira, A.; Andrade, L.P.; Arroja, L. Life cycle assessment of pigmeat production: Portuguese case study and proposal of improvement options. J. Clean. Prod. 2015, 100, 126–139. [Google Scholar] [CrossRef]
  22. Lamnatou, C.; Ezcurra-Ciaurriz, X.; Chemisana, D.; Plà-Aragonés, L.M. Environmental assessment of a pork-production system in North-East of Spain focusing on life-cycle swine nutrition. J. Clean. Prod. 2016, 137, 105–115. [Google Scholar] [CrossRef]
  23. Cardoso, A.S.; Berndt, A.; Leytem, A.; Alves, B.J.R.; de Carvalho, I.N.O.; de Barros Soares, L.H.; Urquiaga, S.; Boddey, R.M. Impact of the intensification of beef production in Brazil on greenhouse gas emissions and land use. Agric. Syst. 2016, 143, 86–96. [Google Scholar] [CrossRef]
  24. Ogino, A.; Sommart, K.; Subepang, S.; Mitsumori, M.; Hayashi, K.; Yamashita, T.; Tanaka, Y. Environmental impacts of extensive and intensive beef production systems in Thailand evaluated by life cycle assessment. J. Clean. Prod. 2016, 112, 22–31. [Google Scholar] [CrossRef]
  25. Meier, M.S.; Stoessel, F.; Jungbluth, N.; Juraske, R.; Schader, C.; Stolze, M. Environmental impacts of organic and conventional agricultural products—Are the differences captured by life cycle assessment? J. Environ. Manag. 2015, 149, 193–208. [Google Scholar] [CrossRef] [PubMed]
  26. Wang, X.; Chen, Y.; Sui, P.; Gao, W.; Qin, F.; Zhang, J.; Wu, X. Emergy analysis of grain production systems on large-scale farms in the North China Plain based on LCA. Agric. Syst. 2014, 128, 66–78. [Google Scholar] [CrossRef]
  27. Turconi, R.; Boldrin, A.; Astrup, T. Life cycle assessment (LCA) of electricity generation technologies: Overview, comparability and limitations. Renew. Sustain. Energy Rev. 2013, 28, 555–565. [Google Scholar] [CrossRef] [Green Version]
  28. Handbook—General Guide for Life Cycle Assessment—Detailed Guidance; Publications Office of the European Union, JRC, The International Reference Life Cycle Data System (ILCD): Luxembourg, 2012.
  29. Cederberg, C.; Meyer, D.; Flysjö, A. Life cycle inventory of greenhouse gas emissions and use of land and energy in Brazilian beef production. Swed. Inst. Food Biotechnol. 2009, 792, 1–77. [Google Scholar]
  30. De Vries, M.; de Boer, I.J.M. Comparing environmental impacts for livestock products: A review of life cycle assessments. Livest. Sci. 2010, 128, 1–11. [Google Scholar] [CrossRef]
  31. Mogensen, L.; Hermansen, J.E.; Halberg, N.; Dalgaard, R.; Vis, J.; Smith, B.G. Life Cycle Assessment across the Food Supply Chain. Sustainability in the Food Industry; John Wiley and Sons, Ltd.: Ames, IA, USA, 2009. [Google Scholar]
  32. Guinée, J.B.; Gorrée, M.; Heijungs, R.; Huppes, G.; Kleijn, R.; Koning, A.D.; Oers, L.; Wegener Sleeswijk, A.; Suh, S.; Udo de Haes, H.A.; et al. LCA—An Operational Guide to the ISO-Standards—Part 2b: Operational Annex (Final Report. May 2001); Institute of Environmental Science (CML), Faculty of Science, Leiden University: Leiden, The Netherlands, 2001. [Google Scholar]
  33. Pascale, A.; Urmee, T.; Moore, A. Life cycle assessment of a community hydroelectric power system in rural Thailand. Renew. Energy 2011, 36, 2799–2808. [Google Scholar] [CrossRef]
  34. Nguyen, T.T.H.; van der Werf, H.M.G.; Eugène, M.; Veysset, P.; Devun, J.; Chesneau, G.; Doreau, M. Effects of type of ration and allocation methods on the environmental impacts of beef-production systems. Livest. Sci. 2012, 145, 239–251. [Google Scholar] [CrossRef]
  35. EMEP/EEA Air Pollutant Emission Inventory Guidebook 2016; Publications Office of the European Union, European Environment Agency (EMEP/EEA), European Environment Agency: Luxembourg, 2016.
  36. Guidelines for National Greenhouse Gas Inventories—Volume 4: Agriculture, Forestry and Other Land Use; Intergovernmental Panel on Climate Change (IPCC): Geneva, Switzerland, 2006.
  37. Portaria n.° 259/2012 de 28 de Agosto. Ministério da Agricultura, do Mar, do Ambiente e do Ordenamento do Território, 2012. Available online: https://dre.pt/application/conteudo/174783 (accessed on 18 October 2018).
  38. Tichenor, N.E.; Peters, C.J.; Norris, G.A.; Thoma, G.; Griffin, T.S. Life cycle environmental consequences of grass-fed and dairy beef production systems in the Northeastern United States. J. Clean. Prod. 2017, 142, 1619–1628. [Google Scholar] [CrossRef]
  39. CML-IA Characterisation Factors, Update Information Version 4.7, Released January. Available online: http://www.universiteitleiden.nl/en/research/research-output/science/cml-ia-characterisation-factors (accessed on 18 October 2018).
  40. GaBi. Thinkstep GaBi—Professional Database 2018. Available online: http://www.gabi-software.com/support/gabi/gabi-database-2018-lci-documentation/professional-database-2018/ (accessed on 9 October 2018).
  41. Lupo, C.D.; Clay, D.E.; Benning, J.L.; Stone, J.J. Life-cycle assessment of the beef cattle production system for the northern great plains, USA. J. Environ. Qual. 2013, 42, 1386–1394. [Google Scholar] [CrossRef] [PubMed]
  42. Ruviaro, C.F.; de Léis, C.M.; Lampert, V.N.; Barcellos, J.O.J.; Dewes, H. Carbon footprint in different beef production systems on a southern Brazilian farm: A case study. J. Clean. Prod. 2015, 96, 435–443. [Google Scholar] [CrossRef]
  43. Mogensen, L.; Kristensen, T.; Nielsen, N.I.; Spleth, P.; Henriksson, M.; Swensson, C.; Hessle, A.; Vestergaard, M. Greenhouse gas emissions from beef production systems in Denmark and Sweden. Livest. Sci. 2015, 174, 126–143. [Google Scholar] [CrossRef]
  44. Nguyen, T.L.T.; Hermansen, J.E.; Mogensen, L. Environmental consequences of different beef production systems in the EU. J. Clean. Prod. 2010, 18, 756–766. [Google Scholar] [CrossRef]
  45. Leip, A.; Weiss, F.; Wassenaar, T.; Perez, I.; Fellmann, T.; Loudjani, P.; Tubiello, F.; Grandgirard, D.; Monni, S.; Biala, K. Evaluation of the Livestock Sector’s Contribution to the EU Greenhouse Gas Emissions (GGELS)—Final Report; European Commission, Joint Research Centre: Brussels, Belgium, 2010; pp. 1–32. [Google Scholar]
  46. Casey, J.W.; Holden, N.M. Greenhouse gas emissions from conventional, agri-environmental scheme, and organic Irish suckler-beef units. J. Environ. Qual. 2006, 35, 231–239. [Google Scholar] [CrossRef] [PubMed]
  47. Peters, G.M.; Rowley, H.V.; Wiedemann, S.; Tucker, R.; Short, M.D.; Schulz, M. Red meat production in australia: Life cycle assessment and comparison with overseas studies. Environ. Sci. Technol. 2010, 44, 1327–1332. [Google Scholar] [CrossRef] [PubMed]
  48. Williams, A.G.; Audsley, E.; Sandars, D.L. Determining the Environmental Burdens and Resource Use in the Production of Agricultural and Horticultural Commodities, Main Report, Defra Research Project IS0205; Cranfield University and Defra: Cranfield, UK, 2006; pp. 1–97. [Google Scholar]
  49. Alig, M.; Grandl, F.; Mieleitner, J.; Nemecek, T.; Gaillard, G. Ökobilanz von Rind, Schweine und Geflügelfleisch; Agroscope Reckenholz-Tänikon ART: Zürich, Switzerland, 2012. [Google Scholar]
  50. Haas, G.; Wetterich, F.; Köpke, U. Comparing intensive, extensified and organic grassland farming in southern Germany by process life cycle assessment. Agric. Ecosyst. Environ. 2001, 83, 43–53. [Google Scholar] [CrossRef] [Green Version]
  51. Wood, R.; Lenzen, M.; Dey, C.; Lundie, S. A comparative study of some environmental impacts of conventional and organic farming in Australia. Agric. Syst. 2006, 89, 324–348. [Google Scholar] [CrossRef]
  52. Vergé, X.P.C.; Dyer, J.A.; Desjardins, R.L.; Worth, D. Greenhouse gas emissions from the Canadian beef industry. Agric. Syst. 2008, 98, 126–134. [Google Scholar] [CrossRef]
  53. Cerri, C.C.; Moreira, C.S.; Alves, P.A.; Raucci, G.S.; de Almeida Castigioni, B.; Mello, F.F.C.; Cerri, D.G.P.; Cerri, C.E.P. Assessing the carbon footprint of beef cattle in Brazil: A case study with 22 farms in the State of Mato Grosso. J. Clean. Prod. 2016, 112, 2593–2600. [Google Scholar] [CrossRef]
  54. Buratti, C.; Fantozzi, F.; Barbanera, M.; Lascaro, E.; Chiorri, M.; Cecchini, L. Carbon footprint of conventional and organic beef production systems: An Italian case study. Sci. Total Environ. 2017, 576, 129–137. [Google Scholar] [CrossRef] [PubMed]
  55. Wiedemann, S.G.; Henry, B.K.; McGahan, E.J.; Grant, T.; Murphy, C.M.; Niethe, G. Resource use and greenhouse gas intensity of Australian beef production: 1981–2010. Agric. Syst. 2015, 133, 109–118. [Google Scholar] [CrossRef]
  56. Kissinger, M.; Dickler, S. Interregional bio-physical connections—A ‘footprint family’ analysis of Israel’s beef supply system. Ecol. Indic. 2016, 69, 882–891. [Google Scholar] [CrossRef]
  57. Hyslop, J. Simulated global warming potential and ammonia emission figures for a range of suckler herd breeding strategies and beef cattle finishing systems. In Livestock and Global Climate Change International Conference Proceedings; Cambridge University Press: Cambridge, UK, 2008. [Google Scholar]
  58. DeRamus, H.A.; Clement, T.C.; Giampola, D.D.; Dickison, P.C. Methane emissions of beef cattle on forages: Efficiency of grazing management systems. J. Environ. Qual. 2003, 32, 269–277. [Google Scholar] [CrossRef] [PubMed]
  59. Wittenberg, K. Enteric Methane Emissions and Mitigation Opportunities for Canadian Cattle Production Systems; University of Manitoba: Winnipeg, MB, Canada, 2018; pp. 1–13. [Google Scholar]
  60. White, R.R.; Brady, M.; Capper, J.L.; Johnson, K.A. Optimizing diet and pasture management to improve sustainability of U.S. beef production. Agric. Syst. 2014, 130, 1–12. [Google Scholar] [CrossRef] [Green Version]
  61. Sjølie, H.K.; Solberg, B. Greenhouse gas emission impacts of use of Norwegian wood pellets: A sensitivity analysis. Environ. Sci. Policy 2011, 14, 1028–1040. [Google Scholar] [CrossRef]
  62. Zanchi, G.; Pena, N.; Bird, N. Is woody bioenergy carbon neutral? A comparative assessment of emissions from consumption of woody bioenergy and fossil fuel. GCB Bioenergy 2012, 4, 761–772. [Google Scholar] [CrossRef]
  63. Röder, M.; Whittaker, C.; Thornley, P. How certain are greenhouse gas reductions from bioenergy? Life cycle assessment and uncertainty analysis of wood pellet-to-electricity supply chains from forest residues. Biomass Bioenergy 2015, 79, 50–63. [Google Scholar] [CrossRef]
  64. Mogensen, L.; Nguyen, T.L.T.; Madsen, N.T.; Pontoppidan, O.; Preda, T.; Hermansen, J.E. Environmental impact of beef sourced from different production systems—Focus on the slaughtering stage: Input and output. J. Clean. Prod. 2016, 133, 284–293. [Google Scholar] [CrossRef]
  65. Desjardins, R.; Worth, D.; Vergé, X.; Maxime, D.; Dyer, J.; Cerkowniak, D. Carbon footprint of beef cattle. Sustainability 2012, 4, 3279–3301. [Google Scholar] [CrossRef]
  66. Moreira, L.C.O. Comparação entre os poluentes atmosféricos emitidos por uma caldeira flamotubular movida a gás natural e a óleo combustível BPF 2A. Interações 2012, 13, 49–57. [Google Scholar] [CrossRef] [Green Version]
  67. Seppälä, J.; Posch, M.; Johansson, M.; Hettelingh, J.P. Country-dependent characterisation factors for acidification and terrestrial eutrophication based on accumulated exceedance as an impact category indicator (14 pp). Int. J. Life Cycle Assess. 2006, 11, 403–416. [Google Scholar] [CrossRef]
  68. Webb, J.; Ryan, M.; Anthony, S.G.; Brewer, A.; Laws, J.; Aller, M.F.; Misselbrook, T.H. Cost-effective means of reducing ammonia emissions from UK agriculture using the NARSES model. Atmos. Environ. 2006, 40, 7222–7233. [Google Scholar] [CrossRef]
  69. Dolman, M.A.; Sonneveld, M.P.W.; Mollenhorst, H.; de Boer, I.J.M. Benchmarking the economic, environmental and societal performance of Dutch dairy farms aiming at internal recycling of nutrients. J. Clean. Prod. 2014, 73, 245–252. [Google Scholar] [CrossRef]
  70. European Commission, Key Figures on Europe 2016; Publications Office of the European Union: Luxembourg, 2016.
  71. Guerreiro, C.; Gonzalez Ortiz, A.; de Leeuw, F.; Viana, M.; Horalek, J. Air Quality in Europe—2016 Report; European Environment Agency: Copenhagen, Denmark, 2016. [Google Scholar]
  72. Pelletier, N.; Pirog, R.; Rasmussen, R. Comparative life cycle environmental impacts of three beef production strategies in the Upper Midwestern United States. Agric. Syst. 2010, 103, 380–389. [Google Scholar] [CrossRef]
  73. Cederberg, C.; Darelius, K. Livscykelanalys (LCA) av nötkött. (Life Cycle Assessment of Beef Meat.) Naturresursforum; Institutet för livsmedel och bioteknik: Halmstad, Sweden, 2000. [Google Scholar]
  74. Schils, R.L.M.; de Haan, M.H.A.; Hemmer, J.G.A.; van den Pol-van Dasselaar, A.; de Boer, J.A.; Evers, A.G.; Holshof, G.; van Middelkoop, J.C.; Zom, R.L.G. DairyWise, a whole-farm dairy model. J. Dairy Sci. 2007, 90, 5334–5346. [Google Scholar] [CrossRef] [PubMed]
  75. Bustillo-Lecompte, C.F.; Mehrvar, M.; Quiñones-Bolaños, E. Cost-effectiveness analysis of TOC removal from slaughterhouse wastewater using combined anaerobic–aerobic and UV/H2O2 processes. J. Environ. Manag. 2014, 134, 145–152. [Google Scholar] [CrossRef] [PubMed]
  76. Cleaner Production Assessment in Meat Processing; United Nations Environment Programme (UNEP), Danish Environmental Protection Agency, Danish Ministry of Environment and Energy: Copenhagen, Denmark, 2000.
  77. Korpela, T.; Kumpulainen, P.; Majanne, Y.; Häyrinen, A.; Lautala, P. Indirect NOx emission monitoring in natural gas fired boilers. Control Eng. Pract. 2017, 65, 11–25. [Google Scholar] [CrossRef]
  78. Sharma, S.; Sharma, P.; Khare, M. Photo-chemical transport modelling of tropospheric ozone: A review. Atmos. Environ. 2017, 159, 34–54. [Google Scholar] [CrossRef]
  79. Derwent, R.G.; Jenkin, M.E.; Saunders, S.M.; Pilling, M.J. Photochemical ozone creation potentials for organic compounds in northwest Europe calculated with a master chemical mechanism. Atmos. Environ. 1998, 32, 2429–2441. [Google Scholar] [CrossRef]
  80. Roer, A.G.; Johansen, A.; Bakken, A.K.; Daugstad, K.; Fystro, G.; Strømman, A.H. Environmental impacts of combined milk and meat production in Norway according to a life cycle assessment with expanded system boundaries. Livest. Sci. 2013, 155, 384–396. [Google Scholar] [CrossRef]
  81. Phan, N.T.; Kim, K.H.; Parker, D.; Jeon, E.C.; Sa, J.H.; Cho, C.S. Effect of beef cattle manure application rate on CH4 and CO2 emissions. Atmos. Environ. 2012, 63, 327–336. [Google Scholar] [CrossRef]
  82. Castanheira, É.G.; Dias, A.C.; Arroja, L.; Amaro, R. The environmental performance of milk production on a typical Portuguese dairy farm. Agric. Syst. 2010, 103, 498–507. [Google Scholar] [CrossRef]
  83. Colorado, A.; McDonell, V.; Samuelsen, S. Direct emissions of nitrous oxide from combustion of gaseous fuels. Int. J. Hydrogen Energy 2017, 42, 711–719. [Google Scholar] [CrossRef]
  84. Li, B.; Ho, S.S.H.; Xue, Y.; Huang, Y.; Wang, L.; Cheng, Y.; Dai, W.; Zhong, H.; Cao, J.; Lee, S. Characterizations of volatile organic compounds (VOCs) from vehicular emissions at roadside environment: The first comprehensive study in Northwestern China. Atmos. Environ. 2017, 161, 1–12. [Google Scholar] [CrossRef]
  85. Yue, T.; Yue, X.; Chai, F.; Hu, J.; Lai, Y.; He, L.; Zhu, R. Characteristics of volatile organic compounds (VOCs) from the evaporative emissions of modern passenger cars. Atmos. Environ. 2017, 151, 62–69. [Google Scholar] [CrossRef]
Figure 1. Description of the system boundary of the life cycle assessment (LCA) for beef production.
Agriculture 08 00165 g001
Figure 2. Greenhouse gas (GHG) emissions for the SIS and EOS systems of animal production, expressed in kg CO2-eq kg−1 of FU. Note: SIS, semi-intensive system; EOS, extensive organic system.
Agriculture 08 00165 g002
Figure 3. Percentage contribution to GHG emission from the main processes involved in SIS and EOS. Note: SIS, semi-intensive system; EOS, extensive organic system.
Agriculture 08 00165 g003
Figure 4. GHG emissions from slaughterhouses with natural gas boiler (Mng) and pellet boiler (Mp/Mp (neutral C)).
Agriculture 08 00165 g004
Figure 5. Percentage contribution to GHG emissions of slaughtering from use of transport, incinerations, energy (electric and thermal). Note: Mng, slaughterhouse with natural gas boiler; Mp, slaughterhouse with pellet boiler.
Agriculture 08 00165 g005
Figure 6. Acidification potential expressed in g SO2-eq kg−1 for the Mng and Mp slaughterers, including the contribution of each pollutant. Note: Mng, slaughterhouse with natural gas boiler; Mp, slaughterhouse with pellet boiler.
Agriculture 08 00165 g006
Figure 7. Percentage contribution of the main processes involved in the slaughter of animals to the AP. Note: Mng, slaughterhouse with natural gas boiler; Mp, slaughterhouse with pellet boiler.
Agriculture 08 00165 g007
Figure 8. Main contributors to EP in SIS and EOS. Note: SIS, semi-intensive system; EOS, Extensive organic system.
Agriculture 08 00165 g008
Figure 9. EP associated to the Mng and Mp slaughterhouses, expressed in g PO4−3-eq kg−1. Note: Mng, slaughterhouse with natural gas boiler; Mp, slaughterhouse with pellet boiler.
Agriculture 08 00165 g009
Figure 10. Main contributions to the estimated EP for the Mng and Mp slaughterhouses. Note: Mng, slaughterhouse with natural gas boiler; Mp, slaughterhouse with pellet boiler.
Agriculture 08 00165 g010
Figure 11. Main contributions of the processes involved for the POCP estimated for the Mng and Mp slaughterhouses. Note: Mng, slaughterhouse with natural gas boiler; Mp, slaughterhouse with pellet boiler.
Agriculture 08 00165 g011
Table 1. Main characteristics of the production systems studied.
InformationSISEOS
Weaning7–9 months6–8 months
Replacement rate12–15%8–10%
Fertilization rate100%90%
Mortality of animals5%2%
Waste transportation100 km60 km
Number of cows45100
Number of heifers (6 to 24 months)3-
Number of bulls12
Number of calves (8 months)4088
SIS, semi-intensive system; EOS, Extensive organic system.
Table 2. Inventory data from animal production processes expressed in kg per kg of functional unit (FU).
StageSub-SystemSISEOS
Animal feedInput
Barley (kg)0.0100.100
Calcium carbonate (kg)0.0200.012
Calcium oxide (kg)0.0110.090
Corn (kg)0.0400.249
Dicalcium phosphate (kg)0.0020.001
Fertilizer (kg)0.0310.067
Land use (ha)20100
Mineral salt (kg)0.0060.004
Soy (kg)0.0500.031
Sunflower meal (kg)0.0600.05
Superphosphate (kg)0.0200.035
Water (kg)0.0060.006
Wheat (kg)0.1500.200
Output
Animal feed (kg)2.113.42
CH4 (air emissions) (kg)4.38 × 10−54.60 × 10−6
CO (air emissions) (kg)1.16 × 10−46.23 × 10−5
CO2 (air emissions) (kg)0.780.40
VOCs (air emissions) (kg)3.59 × 10−52.00 × 10−5
NOx (air emissions) (kg)6.72 × 10−41.61 × 10−4
Animal productionInput
Animal feed (kg)2.113.42
Electricity (kWh)5.44 × 10−42.37 × 10−4
Water (kg)0.010.024
Young animal (kg)0.510.60
Output
Animal for slaughter (kg)1.801.80
CH4 (air emissions) (kg)0.4830.366
VOCs (air emissions) (kg)0.0670.024
N2O (air emissions) (kg)0.030.021
NH3 (air emissions) (kg)0.1010.044
Manure (kg)0.0260.010
Nitrate (water emission) (kg)0.2670.184
Phosphate (water emission) (kg)0.0810.078
Wastewater (kg)0.0110.023
Solid waste (kg)4.62 × 10−33.55 × 10−3
Slaughterhouse MngMp
Input
Animal for slaughter (kg)1.801.80
Electricity (kWh)0.1460.080
Technical Energy (kWh)0.2520.217
Water (kg)7.59 × 10−34.29 × 10−3
Output
Air emissionsGabi 6.0 software database [40]
Beef (kg)11
BOD (water emissions) (kg)0.0040.005
Nitrate (water emissions) (kg)6.07 × 10−43.43 × 10−4
Wastewater (kg)7.59 × 10−34.29 × 10−3
Solid wastes (kg)0.0700.061
VOCs, volatile organic compounds; Mng, slaughterhouse with natural gas boiler; Mp, slaughterhouse with pellet boiler; BOD, biochemical oxygen demand.
Table 3. Acidification potential expressed in g SO2-eq kg−1 for the SIS and EOS systems and individualized contribution of each pollutant.
PollutantSIS 1 (g SO2-eq kg−1)EOS 1 (g SO2-eq kg−1)
Ammonia167.0070.40
nitrogen oxides0.200.10
Sulfur dioxide0.601.40
Others 20.200.03
Total168.0071.90
1 SIS, semi-intensive system; EOS, Extensive organic system; 2 Hydrogen chloride, phosphoric acid, hydrogen sulfide and nitric acid.
Table 4. Main contributions to the acidification potential (AP) of the animal production systems (SIS and EOS) in percentage.
Main ContributionsSIS 1 (%)EOS 1 (%)
Animal production96.5097.90
Feed production 3.100.11
Fertilizer production0.381.94
Others 2 0.020.05
1 SIS, semi-intensive system; EOS, Extensive organic system; 2 Transportation, production of electricity and treatment of meat waste by incineration.
Table 5. Potential eutrophication expressed in g PO4-eq kg−1 of FU, for animal production of SIS and EOS.
g PO4-eq kg−1Feed ProductionAnimal ProductionTransportElectricityIncinerationTotal
SIS 13.231510.000094450.00006760.000411154
EOS 14.651180.000043580.000001970.0000316123
1 SIS, semi-intensive system; EOS, Extensive organic system.
Table 6. Photochemical ozone creation potential (POCP) values, in g C2H4-eq kg−1, with the main pollutants for SIS and EOS.
Pollutants (g C2H4-eq kg−1)SIS 1EOS 1
CH42.90002.2000
CO0.00350.0024
VOCs24.50008.9000
NOx0.01200.0074
SO20.02500.0540
Total27.400011.2000
1 SIS, semi-intensive system; EOS, Extensive organic system.
Table 7. Main contributors to the POCP of the SIS and EOS systems.
ProcessSIS 1 (%)EOS 1 (%)
Animal production99.70099.300
Feed production0.0980.121
Fertilizer production0.1040.561
Others 20.0980.018
1 SIS, semi-intensive system; EOS, Extensive organic system; 2 Includes the production of electricity, transport and treatment of meat waste by incineration.

