Article

Relationship of Salinity Tolerance to Na+ Exclusion, Proline Accumulation, and Antioxidant Enzyme Activity in Rice Seedlings

by
Maha Nagy Abdelaziz
1,†,
Tran Dang Xuan
1,*,
Ahmad Mohammad M. Mekawy
2,3,†,
Hongliang Wang
1 and
Tran Dang Khanh
4
1
Graduate School for International Development and Cooperation (IDEC), Hiroshima University, Higashi-Hiroshima 739-8529, Japan
2
Graduate School of Biosphere Science, Hiroshima University, Higashi-Hiroshima 739-8528, Japan
3
Department of Botany and Microbiology, Faculty of Science, Minia University, El-Minia 61519, Egypt
4
Agricultural Genetics Institute, Pham Van Dong Street, Hanoi 123000, Vietnam
*
Author to whom correspondence should be addressed.
The authors contributed equally to this work.
Agriculture 2018, 8(11), 166; https://doi.org/10.3390/agriculture8110166
Submission received: 31 August 2018 / Revised: 17 October 2018 / Accepted: 18 October 2018 / Published: 23 October 2018
(This article belongs to the Special Issue Response and Tolerance of Agricultural Crops to Salinity Stress)

Abstract

:
Rice is a staple crop for over 50% of the world’s population, but its sensitivity to salinity poses a threat to meeting the worldwide demand. This study investigated the correlation of salinity tolerance to Na+ exclusion, proline accumulation, and the activity of antioxidant enzymes in some rice cultivars originating from Egypt. Giza 182 was shown to be the most tolerant of the five cultivars, as judged by visual symptoms of salt injury, growth parameters, and patterns of Na+ accumulation, while Sakha 105 appeared to be highly susceptible. In detail, Giza 182 accumulated the lowest Na+ concentration and maintained a much lower Na+/K+ ratio in all plant organs in comparison to Sakha 105. The salinity-tolerant varieties had higher accumulation of proline than the salinity-susceptible cultivars. The salinity-tolerant Giza 182 accumulated a higher concentration of proline, but the lipid peroxidation (MDA) level was significantly reduced compared to in the salinity-susceptible Sakha 105. In addition, Giza 182 had stronger activity of both catalase (CAT) and ascorbate peroxidase (APX) compared to Sakha 105. The findings of this study reveal that the salinity tolerance in rice is primarily attributable to Na+ exclusion, the accumulation of proline in rice organs, a low Na+/K+ ratio, and a low level of lipid peroxidation. The levels of the antioxidant enzymes CAT and APX and the accumulation of proline may play important roles in salinity tolerance in rice. However, the comparative involvement of individual antioxidant enzymes in salinity stress in rice should be further investigated. Giza 182 has the potential to be cultivated in salinity-affected areas, although the effects of salinity stress on its grain yield and quality should be evaluated during the full crop cycle.

1. Introduction

Climate change causes alterations to the surrounding environment and markedly imposes soil salinization. In arid and semi-arid areas, elevated temperatures have resulted in increased evapotranspiration, which, when associated with the inefficient irrigation systems used in developing countries, has induced surface soil salinization to various degrees [1]. Soil salinity has become an increasing challenge for agriculture worldwide, as it is followed by a significant reduction in crop growth and productivity [2].
Under salinity stress, the osmotic stress due to the higher Na+ concentration causes dehydration that impairs crop growth. The ionic stress from the accumulation of a high Na+ concentration in plant cells, which may cause K+ deficiency, disrupts cellular ion homeostasis [3]. During salinity stress, plants synthesize proline, which acts as an osmolyte to preserve the cell osmoticum, thus protecting cells from dehydration [3,4]. Proline is an active solute which regulates the osmotic adjustment of cells and protects enzymes, proteins, membranes, and cellular structures in water deficient conditions, thus conferring stress tolerance [5]. Additionally, proline enhances drought and salt tolerance through its capacity to scavenge hydroxyl radicals in plants [6]. To adapt to ionic stress, Na+ is excluded from cells, and excess cytosolic Na+ is transferred into the vacuoles or recirculated and partitioned to different plant organs through the activity of Na+ transporters and/or channels. Differently from Na+, K+ is a fundamental plant nutrient in biosynthetic processes and metabolic pathways that is required for plant growth and development. Therefore, the maintenance of the appropriate K+/Na+ ratio for a certain species is imperative for plant adaptation and growth under conditions of salinity stress [3,7].
Salinity stress increases the rate of reactive oxygen species (ROS) (e.g., OH, H2O2 and O2) production. ROS damages biomolecules, including lipids, proteins, and DNA, and may lead to cell death [8]. Plants possess an antioxidant defense system to scavenge ROS [9]. The antioxidant enzymes catalase (CAT) and ascorbate peroxidase (APX) are efficient scavengers of hydrogen peroxide (H2O2), and thus inhibit membrane lipid peroxidation, which is induced by high concentrations of H2O2. This is a key factor in reducing the effects of salinity stress [8].
Rice (Oryza sativa L.) is a staple food crop for more than 50% of the world’s population. Soil salinity significantly limits rice production because rice is a salinity-sensitive plant. Therefore, the characterization of rice physiology under soil salinity is a necessity. This study investigated the physiological responses of some rice varieties to salinity stress. In this work, five common Egyptian rice cultivars with high yields were screened under 100 mM of NaCl in a hydroponic culture at the seedling stage for 14 days. From the cultivars tested, the most salinity-tolerant and the most salinity-susceptible varieties were selected to elucidate the physiological differences between the two contrasting rice genotypes. Visual symptoms of salt injury and growth and physiological parameters, including dry matter production, patterns of Na+ and K+ accumulation, oxidative damage, and antioxidant enzyme activities, were investigated.

2. Materials and Methods

2.1. Plant Materials and NaCl Treatment

The rice varieties included Sakha 103, Sakha 104, Sakha 105, Sakha 106 (Japonica subtype), and Giza 182 (Indica subtype). These were provided from the Field Crops Research Institute, Giza, Egypt. Pokkali cultivar (Indica subtype) was used as a salinity-tolerant control. Rice seeds were sterilized in a sodium hypochlorite solution (5.0%) for 30 min and then rinsed in distilled water. Rice seeds were subsequently immersed in tap water for 1 day at 28 °C. The uniformly germinated rice seeds were moved to a nylon mesh floating on 20 L of a half-strength Kimura B nutrient solution, as described in Ma et al. [10]. Twenty-eight-day-old seedlings (40 plants of each cultivar) were then transferred to either the Kimura B nutrient solution (control and devoid of NaCl) or a nutrient solution supplemented with 100 mM NaCl (salinity treatment) for 14 days. The Kimura B nutrient solution (Electronic Conductivity: 2 mS cm−1) has the following composition in mM: 0.37 (NH4)2SO4, 0.18 KNO3, 0.21 KH2PO4, 0.37 Ca(NO3)2, 0.55 MgSO4, 9.0 × 10⁻² EDTA-Fe, 7.3 × 10⁻³ MnSO4, 9.3 × 10⁻³ H3BO3, 1.6 × 10⁻⁴ CuSO4, 1.5 × 10⁻⁵ (NH4)6 Mo2O24, and 1.5 × 10⁻⁴ ZnSO4. The NaCl doses (25, 50, and 100 mM) were applied gradually over 3-day intervals to protect the rice seedlings from osmotic shock. The treatment solutions were renewed every 2 days, and the pH was adjusted daily to 5.0–6.0. The rice seedlings were grown in a greenhouse affiliated with Hiroshima University, Japan, under ambient conditions.

2.2. Growth Measurements

The treated rice seedlings (4 plants representing 4 replicates from each treatment; 16 plants in total) were collected and separated into leaves (including the leaf blade and sheath), and roots. The dry weights (DW) were recorded after drying in an oven at 70 °C for 3 days. The fresh rice seedlings (4 plants for each treatment) were also kept at −80 °C until the analysis of proline, lipid peroxidation, and enzyme activities. The plant heights were compared by using the length values of both roots and shoots (cm) subjected to non-treated (control) and salinity stress conditions.

2.3. Quantification of Na+ and K+ Concentrations

The Na+ and K+ concentrations in the leaf blades and sheaths and roots were determined by a flame photometer (ANA-135; Tokyo Photoelectric, Tokyo, Japan) using a method described in Kushizaki [11]. The dried rice seedlings were placed in 1 N HCl for 12 h, and the concentrations of Na+ and K+ were estimated from the Na+ and K+ standard curves.

2.4. Free Proline Quantification

The concentration of proline was determined as described in Bates et al. [12] with some modifications. In brief, 500 mg of rice leaf or root tissue was homogenized in 10 mL of 3.0% sulfosalicylic acid. Afterwards, an aliquot of 2 mL of the extract was mixed with 2 mL ninhydrin reagent, which contained glacial acetic acid. This was heated at 100 °C for 40 min. The mixture was subsequently cooled in an iced water bath, and then an aliquot of 4 mL toluene was added and vigorously mixed. The absorbance of the produced chromophore was recorded at 520 nm.

2.5. Measurement of Lipid Peroxidation (MDA)

The malondialdehyde (MDA) concentration in the leaf blades and roots was determined as described in Assaha et al. [13]. Fresh leaf blades and roots (100 mg) were homogenized in 6 mL of an extraction buffer (10 mM HEPES, pH 7, 15% trichloroacetic acid (TCA), 0.375% thiobarbituric acid, 0.25 N HCl, 0.04% butylated hydroxyl toluene (BHT), and 2% ethanol (EtOH), and heated at 95 °C for 30 min. The reaction was terminated in an ice bath. The blend was then centrifuged at 10,000× g for 20 min, and the absorbance of the supernatant was measured at 535 and 600 nm. The MDA concentration was determined using a coefficient (155 mM−1 cm−1) [14].

2.6. Measurement of Antioxidant Enzymes’ Activity

The activity levels of catalase (CAT, EC 1.11.1.6) and ascorbate peroxidase (APX, EC 1.11.1.11) were calculated using the Protein Assay kit (Bio-Rad DC, Hercules, CA, USA), for which bovine serum albumin was used as a standard. An amount of 0.5 g of fresh sample was extracted following a method described in Takagi and Yamada [15]. An aliquot of 1 mL of the CAT assay mixture contained 50 mM potassium phosphate buffer (pH 7.0), 10 mM H2O2, and enzyme extract (5%). A decline in H2O2 was recorded at 240 nm and the enzyme activity was expressed in mmol of H2O2 consumed per minute. For the APX activity, an amount of 1 mL of the assay mixture contained 25 mM phosphate buffer (pH 7.0), 0.25 mM ascorbic acid, 0.1 mM EDTA, 0.1 mM H2O2, and enzyme extract (10%). The oxidation of ascorbate was recorded at 290 nm, and the concentration was calculated by the coefficient of 2.8 mM−1 cm−1. One unit of the APX was measured as 1 μM of ascorbate oxidized per minute.

2.7. Statistical Analyses

The experiments were conducted in a completely randomized block design with four replications (n = 4) that were repeated twice. The data was analyzed using two-way analysis of variance (ANOVA) with SPSS Statistical Software, version 21 (IBM Inc., Armonk, NY, USA). The means were separated using the Duncan’s multiple range test (p ≤ 0.05).

3. Results

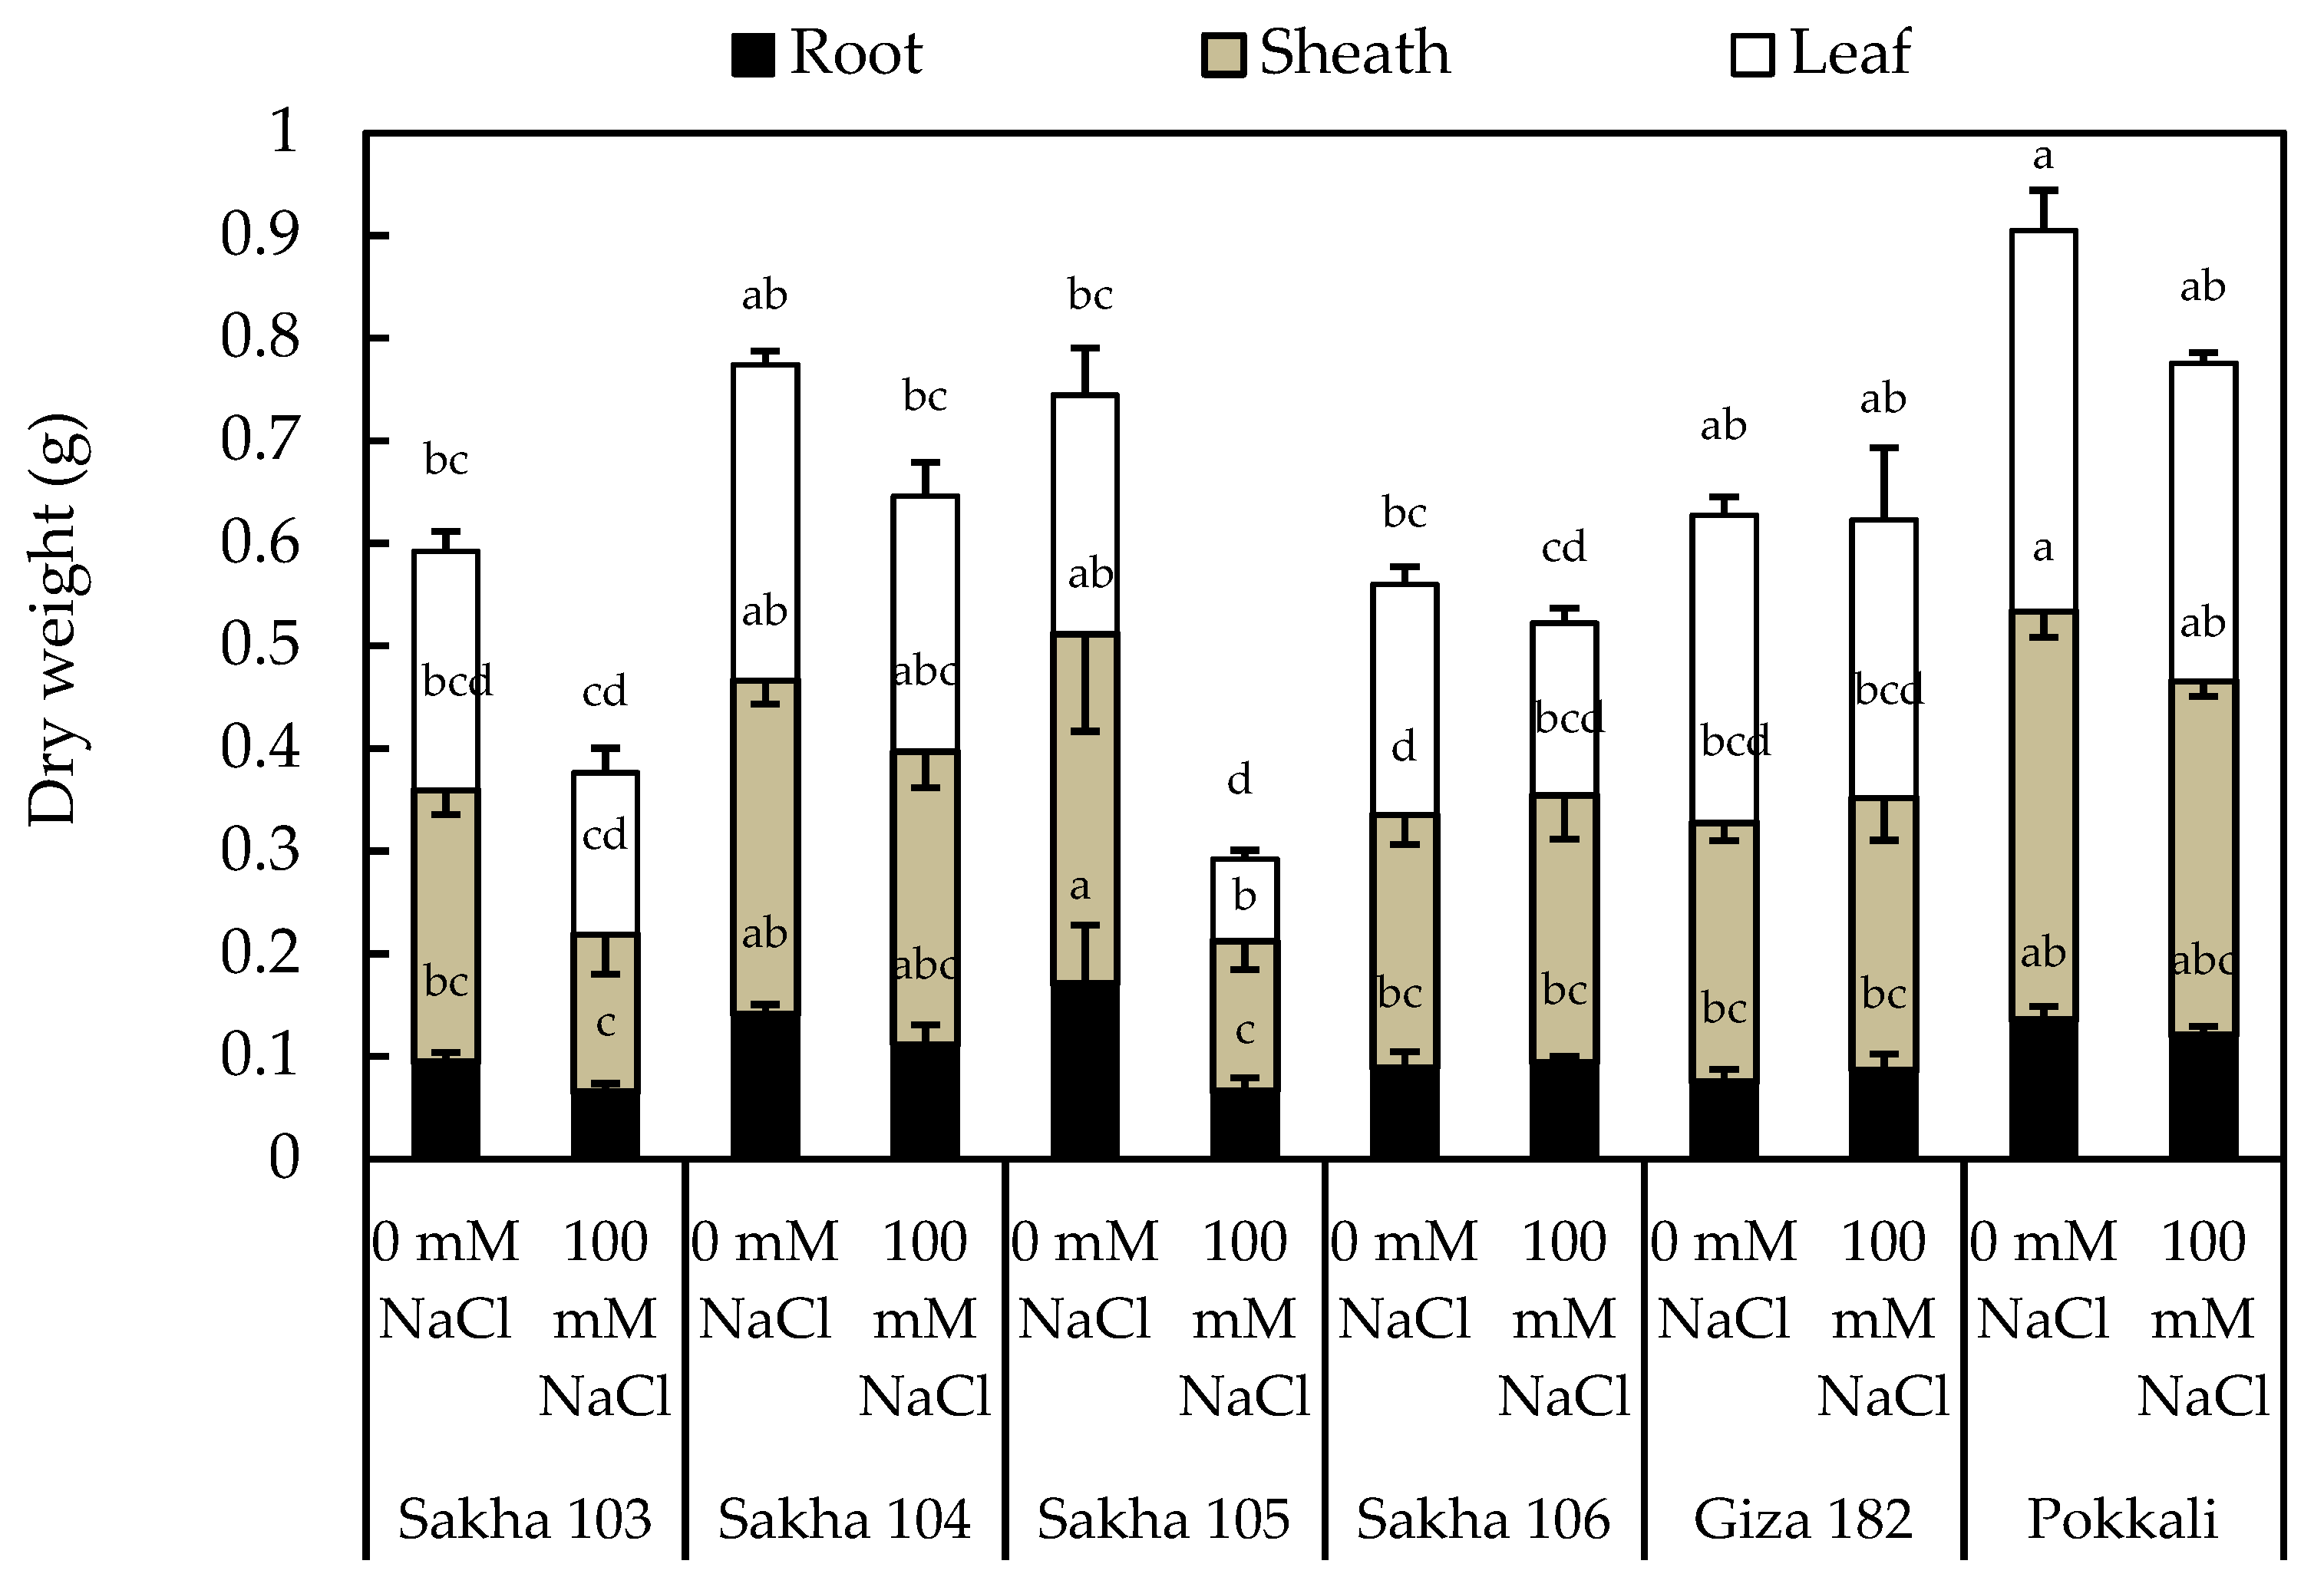
3.1. Screening of Rice Genotypes under Salinity Stress and Effects on Seedling Growth

Out of the five screened rice varieties, Giza 182 and Sakha 105 were selected as the salinity-tolerant and salinity-susceptible cultivars, respectively, based on the standard evaluation system (SES) (International Rice Research Institute, [16]) of visual salt injury at the seedling stage (Figure 1; Supplementary Figure S1). This selection was also based on changes in dry mass production between the salt and non-salt treatments (Figure 1) and patterns of Na+ accumulation and/or the Na+/K+ ratio in different plant organs, particularly in the leaf blades (Figure 2 and Figure 3). Although under non-salt conditions, both Sakha 104 and 105 produced similar biomass compared with Giza 182 and Pokkali; Sakha 105 exhibited growth retardation following salt treatment—lower leaves rolled, and most of the old leaves dried and died, while only the three young leaves were green and elongated (Supplementary Figure S1). In contrast, in Giza 182, only the old leaves wilted and rolled, while young leaves stayed green and healthy in the salinity stress treatment (Supplementary Figure S1).
Salt treatment resulted in a significant reduction in the elongation of shoots and roots of the Sakha 105 cultivar. However, the shoot and root lengths of the other cultivars were not markedly affected, and the shoot and root lengths in Pokkali were not altered by salinity stress (Supplementary Figure S2). Compared with the control plants, the dry weight of Sakha 103–106 was inhibited to a greater extent than Giza 182 and Pokkali (Figure 1). Sakha 105, in particular, exhibited a strong reduction in the dry weights of the leaf blades, sheaths and roots: 65.7%, 57.0%, and 61.4%, respectively (Figure 1). The tolerant Pokkali was found to have a slight decline in the dry weights of shoots and roots. The results show that Giza 182 and Pokkali are more tolerant to salinity stress than other varieties.

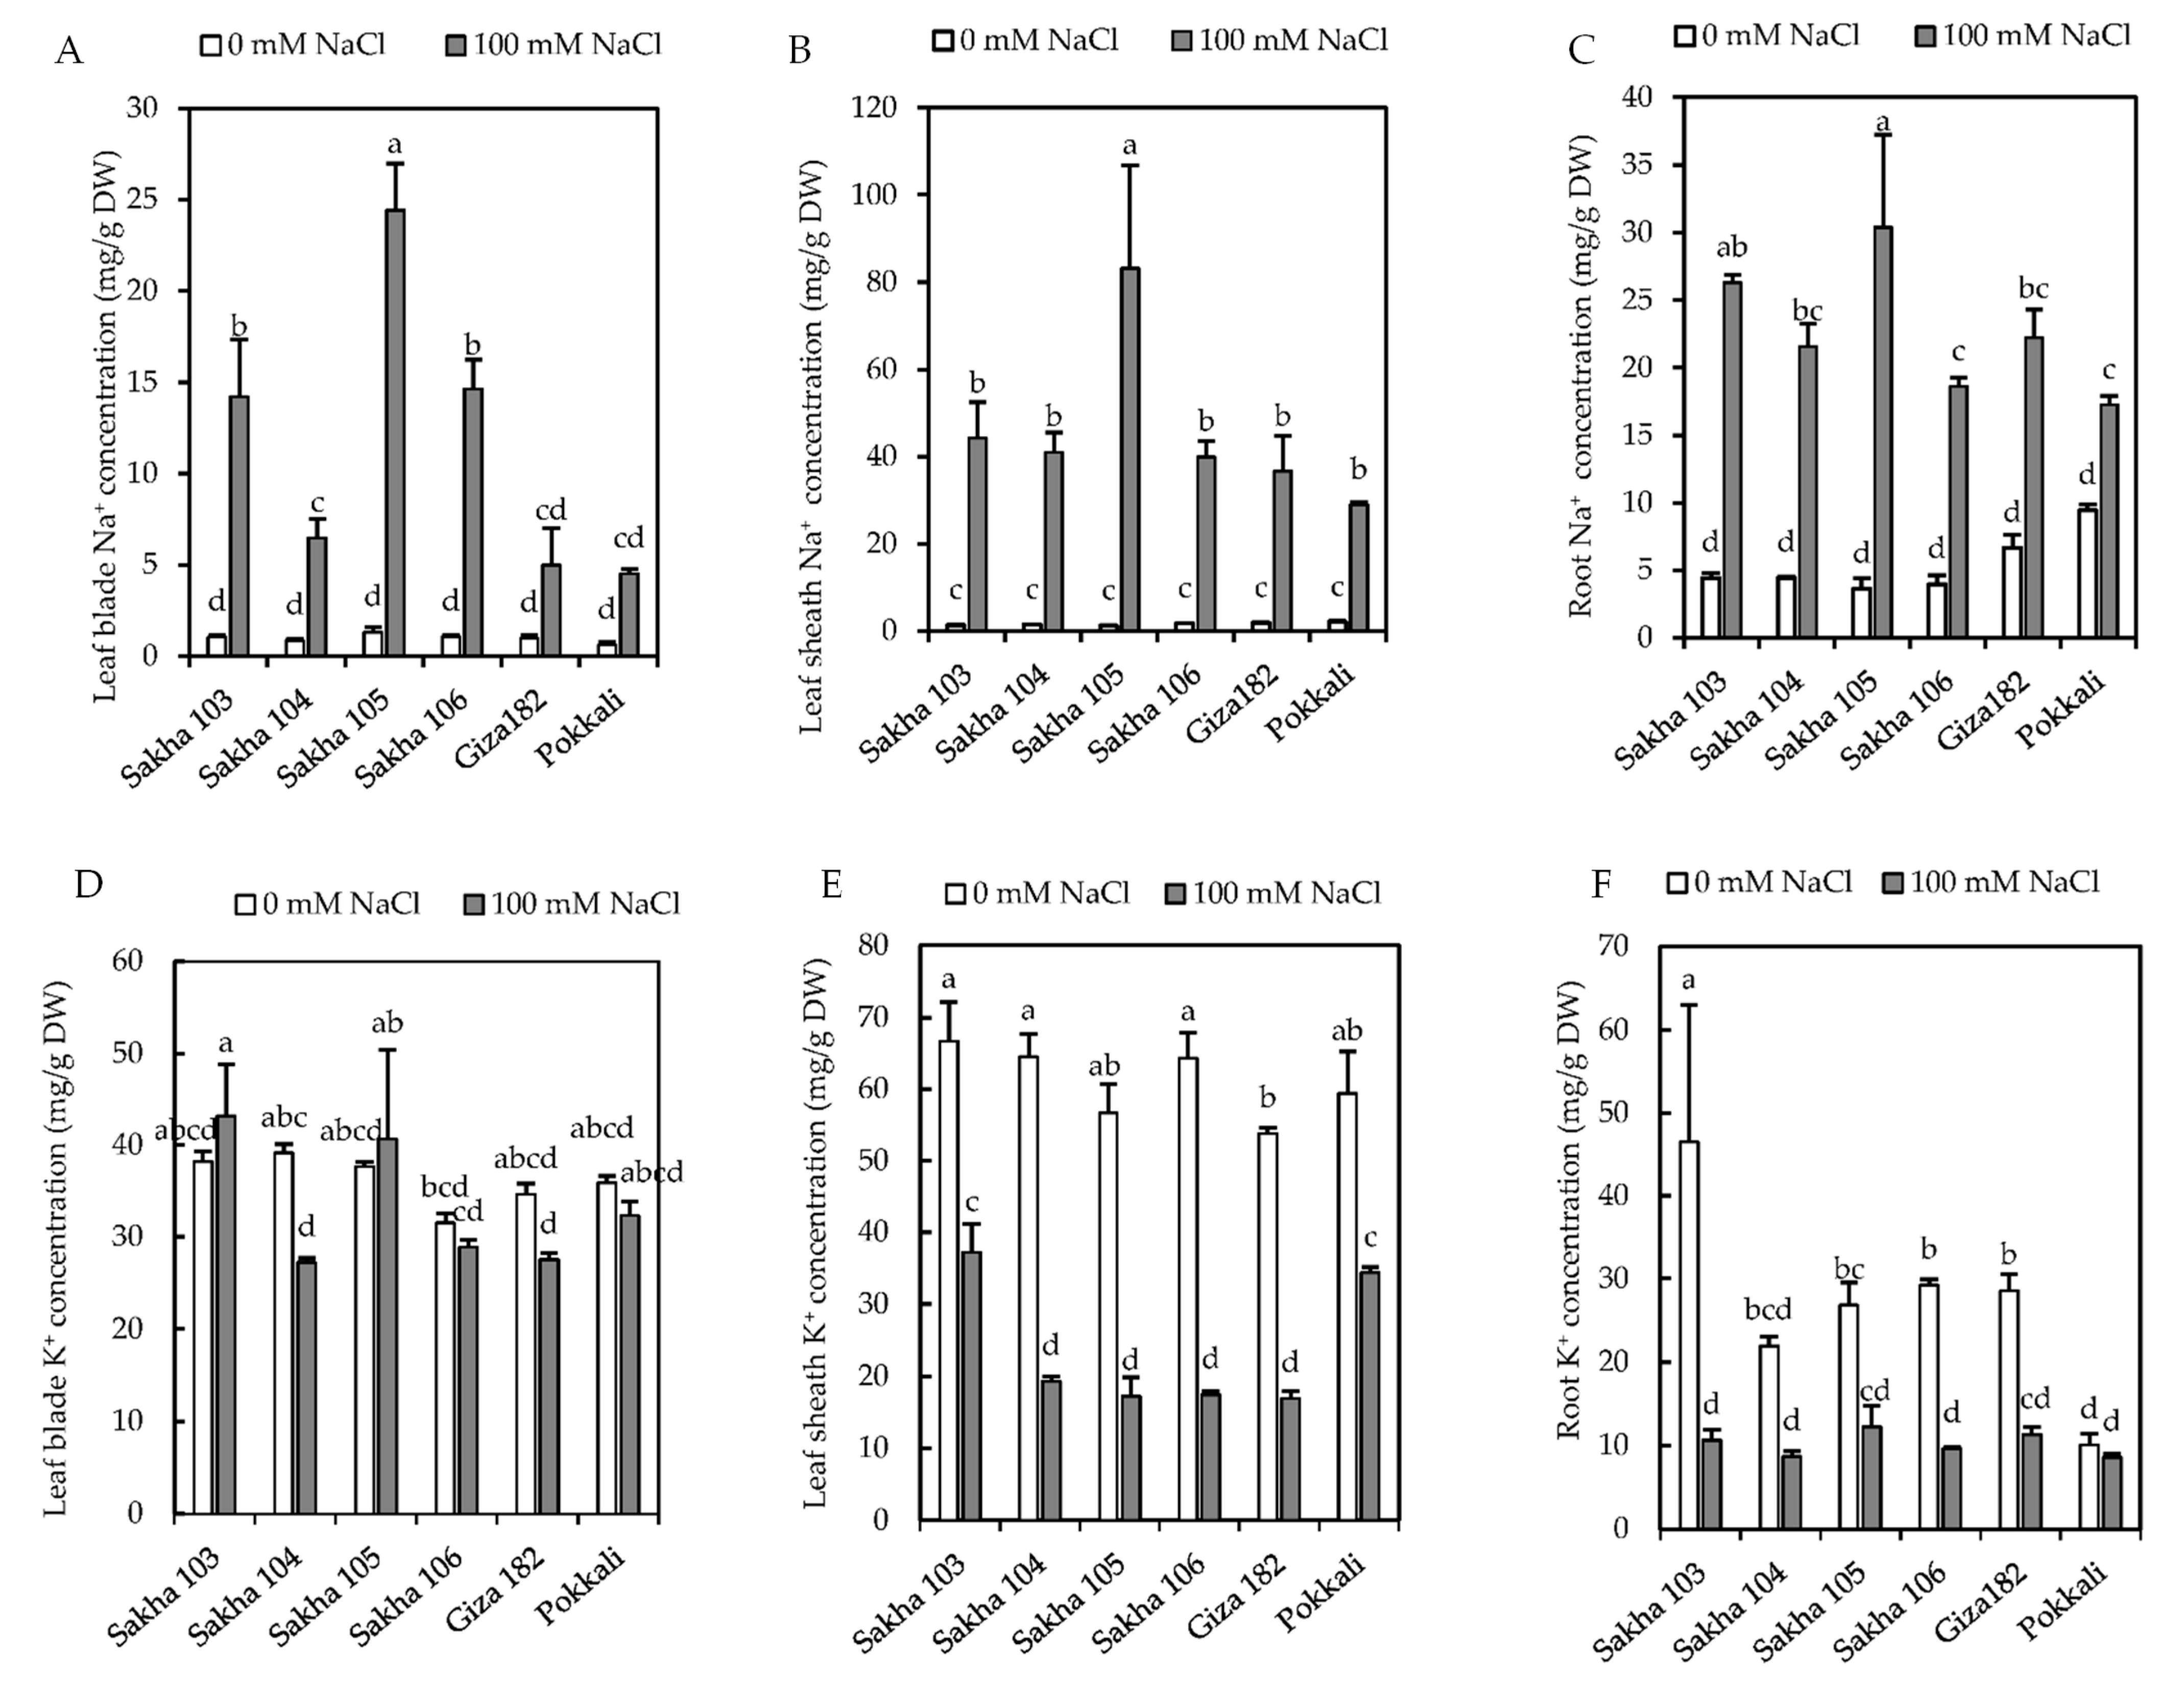
3.2. Accumulation of Na+ and K+ under Salinity Stress

Salinity treatment increased Na+ accumulation in the leaf blades and sheaths and roots of the six examined cultivars (Figure 2). The Na+ concentration of Sakha 105 was significantly higher than in the other varieties (Figure 2). In the leaf blades and sheaths, the highest concentration of Na+ was observed in Sakha 105. The level of Na+ accumulation in the leaf blades of Sakha 105 (susceptible) increased approximately 5-fold compared to both Giza 182 and Pokkali leaves (Figure 2) (tolerant varieties).
Salinity stress significantly reduced the K+ concentration in the roots and leaf sheaths, although the levels varied among the tested cultivars (Figure 2), while in leaf blades, the concentration of K+ did not significantly vary (Figure 2). When the effect of NaCl on theNa+/K+ ratio in the leaf blades, sheaths, and roots was examined (Figure 3), it was found that the Na+/K+ ratio in the salinity-sensitive Sakha 105 was significantly higher than in other cultivars. The two tolerant varieties, Giza 182 and Pokkali, exhibited remarkably lower Na+/K+ ratios, particularly in the leaf blades. However, in the roots, the differences between cultivars were not as great as those observed in the leaf blades and sheaths, although the Na+/K+ ratio in Sakha 105 was markedly higher than in Giza 182 and Pokkali (Figure 3).

3.3. Accumulation of Proline Following Salinity Treatment

The proline content in the roots of Sakha 105 and Giza 182 was not different. Following treatment with 100 mM NaCl, Giza 182 showed a significantly increased proline quantity, whereas no change was observed in the roots of Sakha 105 (Figure 4). Similarly, there was no significant difference in the proline concentration in the leaf blades between Sakha 105 and Giza 182. However, following salinity stress, the quantity of proline increased by approximately 3-fold in Sakha 105 and 5-fold in Giza 182. The concentration of leaf proline in Giza 182 was 43.3% greater than in Sakha 105 (Figure 4). The greater extent of proline accumulation in Giza 182 might be related to cellular osmotic regulation and, thus, indicates a greater physiological adaptation to salinity stress.

3.4. Effect of Salinity Treatment on Lipid Peroxidation

Figure 5 shows that the dose of 100 mM NaCl induced a significant increase in the MDA concentration in the leaves of both rice cultivars compared to the non-treated plants. In detail, in Giza 182, the MDA concentration (38.8%) was relatively much lower than in Sakha 105 (50.0%) in comparison to controls. In the roots, the concentration of MDA was not significantly altered in either variety (Figure 5).

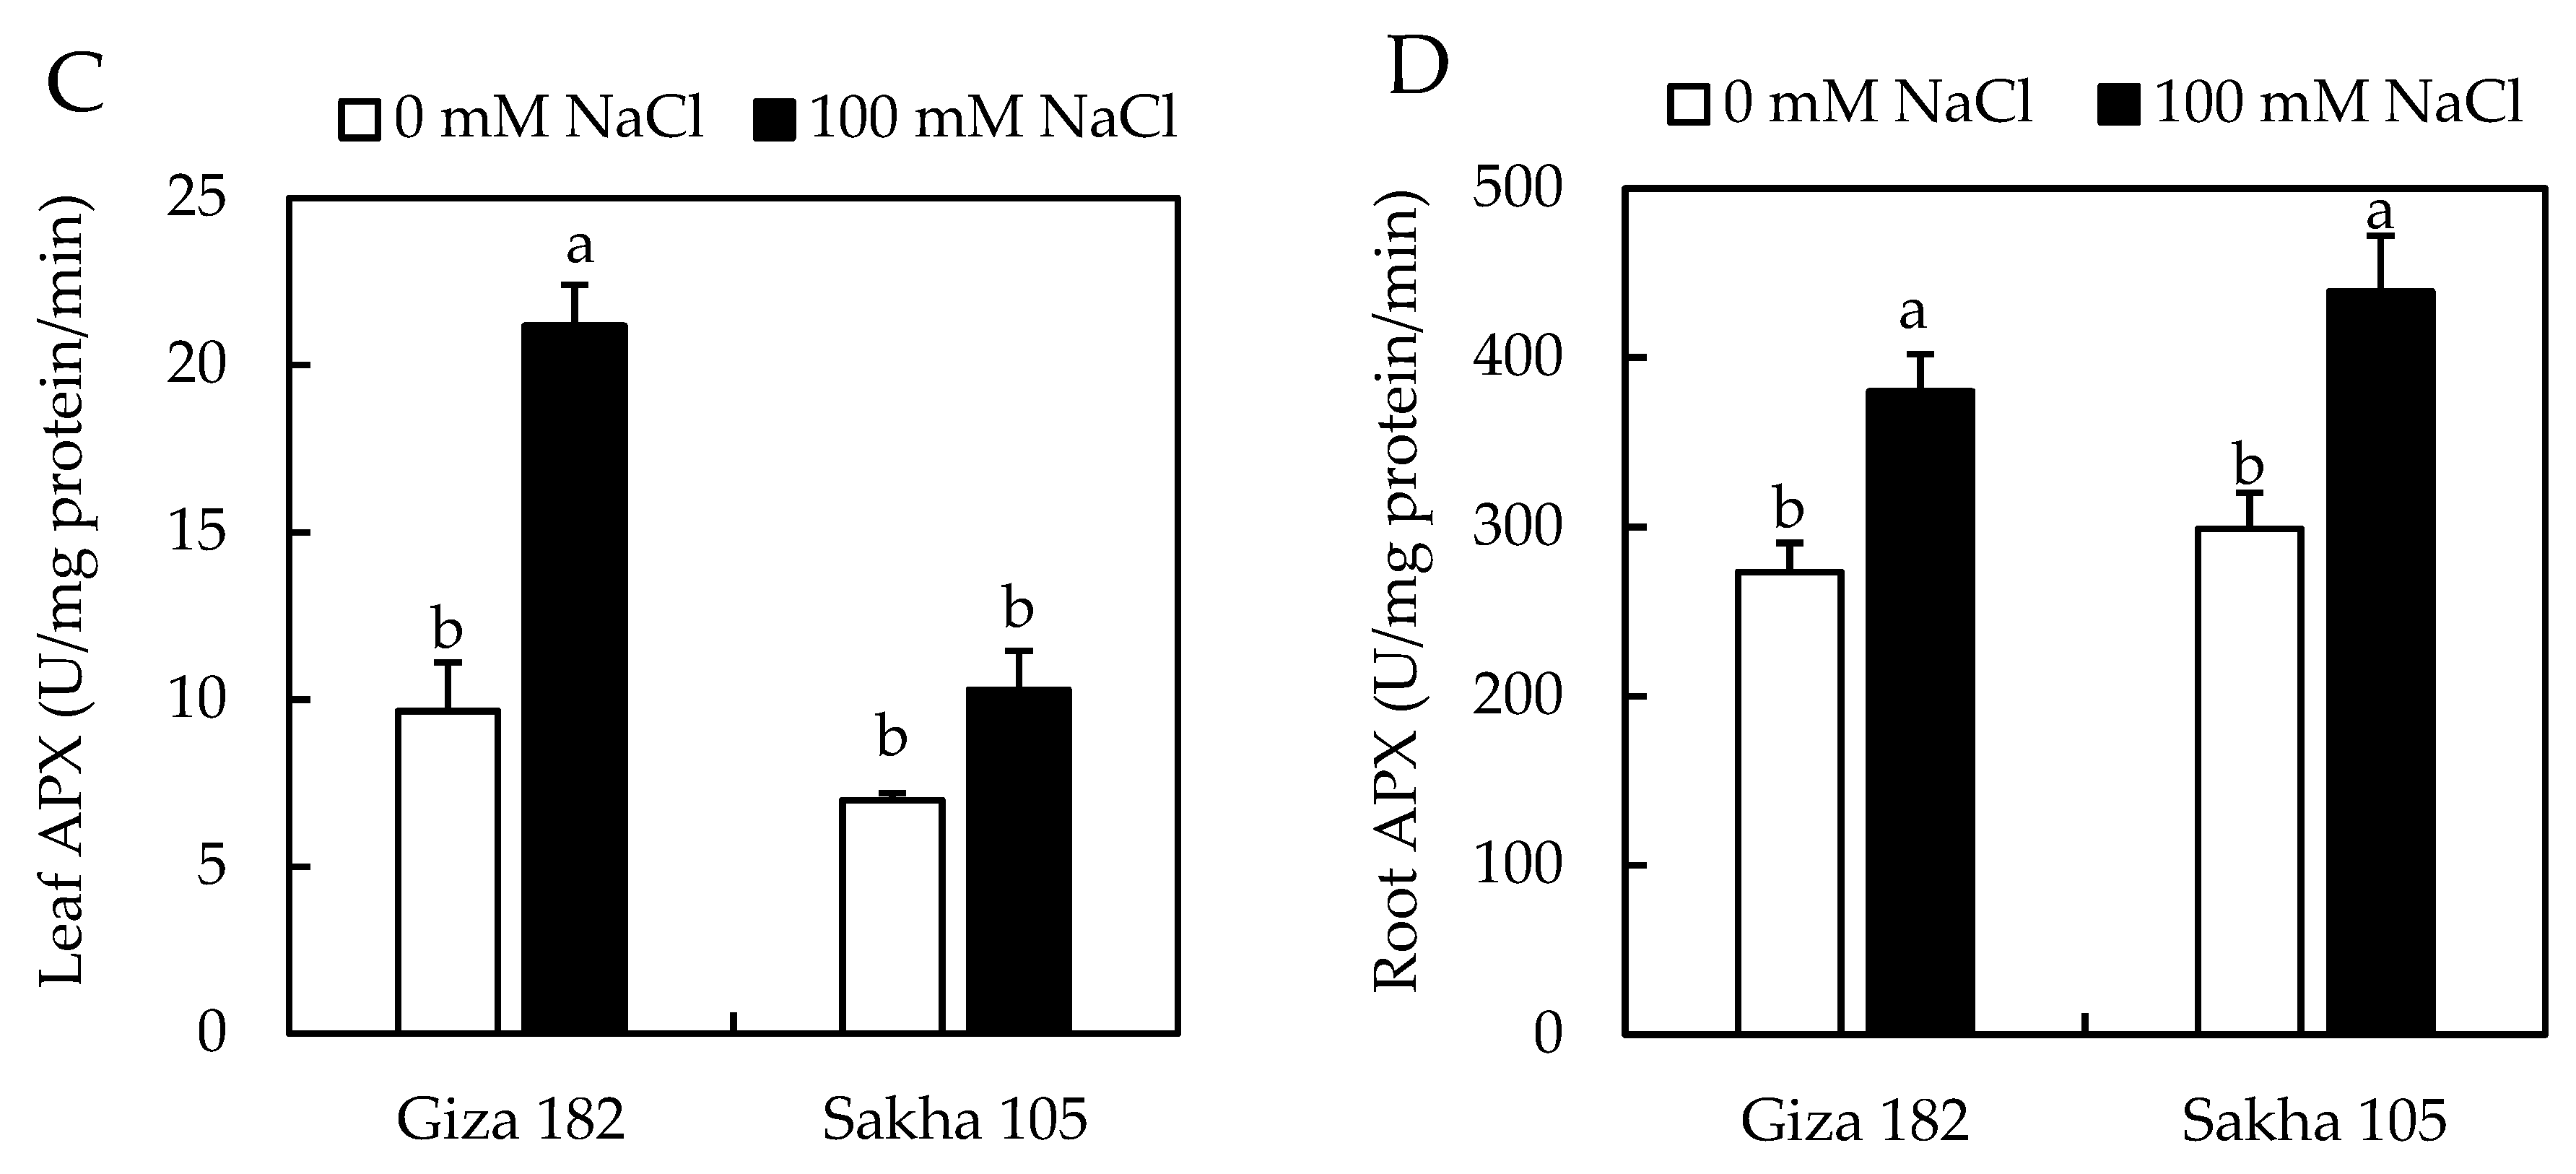
3.5. Activity of Antioxidant Enzymes

The activity of CAT and APX is presented in Figure 6. Salinity treatment induced a significant increase in the activity of CAT in the leaves of both cultivars with relatively much higher induction in Giza 182 (48.0%) than in Sakha 105 (31.0%) in comparison to controls (Figure 6A). However, in the roots, a significant decline in CAT activity was observed in both varieties (Figure 6B). Similarly, APX activity significantly increased in the leaves of both cultivars following NaCl treatment, whereas in Giza 182, the increase in APX activity was approximately 2-fold higher than that in Sakha 105 (Figure 6C). In the roots, APX activity increased by 28.0% and 31.9% in Giza 182 and Sakha 105, respectively, in comparison to control plants (Figure 6D).

4. Discussion

In this study, five rice cultivars were tested under salinity stress conditions. Giza 182 was shown to be the most tolerant, while Sakha 105 was highly susceptible to the stress. Giza 182 displayed better growth, as it maintained greater shoot and root elongation and a larger amount of dry weight (Figure 1; Supplementary Figure S2) and accumulated proline at higher concentrations, while it had a lower Na+ concentration and Na+/K+ ratio and a lower level of lipid peroxidation (MDA) in comparison to Sakha 105 (Figure 2, Figure 3, Figure 4 and Figure 5). The Na+/K+ ratio appeared to be one of the key traits for salinity tolerance in rice. Adaptation to salinity is attained principally by Na+ exclusion from the shoots, particularly the leaf blades [17,18,19,20]. Thus, Giza 182, which exhibited a lower Na+ concentration in the leaf blades, is better adapted to salinity stress. Na+ exclusion from rice roots is crucial for maintaining the optimal cytosolic Na+/K+ ratio needed for normal cellular functions [7].
Proline is important for plants as it is an osmolyte, cytosolic pH regulator, antioxidant, and stabilizer of proteins [21]. Proline was shown to be crucial for the adaptation of purslane (Portulaca oleracea L.) plants [22] and sesame (Sesamum indicum L.) [23] to salt stress. In this study, the accumulation of proline in the salinity-tolerant cultivar was higher than in the salinity-susceptible variety (Figure 4); thus, it is proposed that proline may play a protective role as an osmolyte. In addition, proline can act as a ROS scavenger and has been shown to enhance both the expression of antioxidant enzyme-coding genes and their activity [24,25]. Okuma et al. [26] suggested that proline acts as a free radical scavenger that alleviates salt stress and reduces the oxidation of lipid membranes. Therefore, proline provides protection against NaCl-induced oxidative damage by decreasing the levels of ROS accumulation and lipid peroxidation, as well as improving the membrane integrity. It is possible that the increase in proline accumulation in Giza 182 might have contributed to the lower oxidative damage (lower MDA concentration) (Figure 5), and thus greater salinity tolerance in this cultivar.
Na+ toxicity triggers the production of ROS, leading to increased membrane damage due to lipid peroxidation [27] and the formation of malondialdehyde (MDA) as the final product of lipid peroxidation during oxidative stress [28]. Low MDA accumulation implies protection against oxidative stress and is correlated with a rise in antioxidant enzyme activity in plants [23,29]. In this study, Giza 182 had a lower MDA concentration than the susceptible Sakha 105 under salinity stress conditions (Figure 5), indicating that Giza 182 had less membrane damage. Similar observations were described for salinity-tolerant barley, which maintained a lower concentration of MDA and elevated antioxidant enzyme activity under salinity stress [30].
Under stress conditions, antioxidant enzymes, such as CAT and APX, are known to protect the cellular structures from oxidative damage as they can provide stress protection via ROS scavenging, thus leading to increased stress tolerance [8]. CAT directly catalyzes the conversion of H2O2 to H2O and O2, and accordingly, CAT is crucial for the fast removal of excess H2O2 from cells. Peroxidases (e.g., APX), which have a higher affinity for H2O2, fulfill the function of CAT, which has a low affinity for H2O2, by regulating the concentration of intracellular H2O2 to a non-toxic level [31]. In this study, the activity of CAT and APX was generally greater in Giza 182 than in the salinity-susceptible Sakha 105, which clearly suggests their roles in the stress tolerance of the Giza 182. In the roots of both cultivars, the activity of CAT declined following salinity treatment (Figure 6), indicating that the stress effects induced by Na+ accumulation are more significant in the leaves than in the roots. Similarly, Sharma and Dubey [32] reported a decrease in CAT activity in rice seedlings following drought stress. In another study, CAT and APX activity decreased in the shoots of rice seedlings exposed to salinity stress [33]. Being the central point of metabolic activities of plants, leaf biochemical and physiological functions are essential for maintaining growth and productivity. Thus, the increased activities of the antioxidant enzymes in leaf blade tissues likely played a critical role in the superior tolerance of Giza 182. Xuan and Khang [34] indicated that the genes correlated with antioxidant enzymes as well as tolerance against environmental stress on rice may play important roles; therefore, an analysis of the expression of genes encoding CAT, APX, and other Na+ transporters relevant to the salinity tolerance of Giza 182 should be investigated.
In this study, Pokkali was shown to be highly tolerant of salinity, but its yielding ability was low (11.93 g compared with 21.48 g and 20.10 g per hill−1 of commercial MR 219 and MR 232, respectively [35] or 2.2–2.3 tons ha−1 [36]), and it showed poor grain quality (amylose content: 23.34%) [37]. It is commonly used as a control cultivar to check the salinity tolerance [35,38]. The Saltol QTL (quantitative trait locus) was mapped on chromosome 1 in an F8 Recombinant Inbred Line (RIL) population from a cross between Pokkali (salt tolerant) and IR29 (salt sensitive) [38]. In Pokkali, the Saltol QTL explained 64.3%–80.2% of the variability in the shoot Na+/K+ ratio [39]. However, the Egyptian rice varieties used in this study were of a higher quality than Pokkali (the amylose contents of Sakha 103–106 and Giza 182 were 19.1, 19.2, 19.1, 19.3, and 22.2, respectively) [40]. In addition, Sakha 103–106 and Giza 182 were all high yield varieties (7.04, 7.33, 7.92, 7.28, and 7.97 tons ha−1) [41]. The findings of this study revealed that the salinity tolerance of Pokkali was greater than the other five Egyptian rice varieties (Supplementary Figure S2). Giza 182 was the most promising cultivar for cultivation in salinity-affected soil. However, although the growth of Giza 182 was the least affected, the examination of how salinity stress influences its yield and quality should be further elaborated.

5. Conclusions

This study highlighted that the salinity tolerance of rice depends on Na+ exclusion from rice leaf blades, a low balance in the Na+/K+ ratio, and a low level of lipid peroxidation (MDA). The accumulation of proline and the enhanced activity of the antioxidant enzymes CAT and APX were related to the level of salinity tolerance, although further investigation on the possible roles of individual antioxidant enzymes should be conducted. Giza 182, with its high yield of acceptable quality [40,41], was more salinity-tolerant than the other commercial and high-yield Egyptian varieties. It may have the potential to be cultivated in salinity-affected areas.

Supplementary Materials

The following are available online at https://www.mdpi.com/2077-0472/8/11/166/s1, Figure S1: Visual symptoms of salt injury of different rice varieties after 14 day treatment; Figure S2: Effect of salinity stress (100 mM NaCl) on root and shoot lengths of Sakha 103, Sakha 104, Sakha 105, Sakha 106, Giza 182, and Pokkali varieties after 14 day treatment. Data represent means ± SE (n = 4). Similar letters in a bar indicate no significant difference (p ≤ 0.05).

Author Contributions

Conceived and designed the experiments: M.N.A., A.M.M.M., T.D.X. Performed the experiments: M.N.A. and A.M.M.M. Analyzed the data: M.N.A., A.M.M.M., H.W. Wrote and revised the paper: M.N.A., A.M.M.M., T.D.K., T.D.X. All authors read and approved the final version of the paper.

Funding

This research received no external funding.

Acknowledgments

The authors would like to thank Hirofumi Saneoka, the Head of the Plant Nutritional Physiology Laboratory, Graduate School of Biosphere Science, Hiroshima University for providing the tools and equipment needed for this research.

Conflicts of Interest

The authors declare no conflict of interest.

References

  1. Munns, R. Genes and salt tolerance: Bringing them together. New Phytol. 2005, 167, 645–663. [Google Scholar] [CrossRef] [PubMed]
  2. Zhu, J.K. Plant salt tolerance. Trends Plant Sci. 2001, 6, 66–71. [Google Scholar] [CrossRef]
  3. Munns, R.; Tester, M. Mechanisms of salinity tolerance. Annu. Rev. Plant Biol. 2008, 59, 651–681. [Google Scholar] [CrossRef] [PubMed]
  4. Yaish, M.W. Proline accumulation is a general response to abiotic stress in the date palm tree (Phoenix dactylifera L.). Gene. Mol. Res. 2015, 14, 9943–9950. [Google Scholar] [CrossRef] [PubMed]
  5. Ueda, A.; Shi, W.; Shimada, T.; Miyake, H.; Takabe, T. Altered expression of barley proline transporter causes different growth responses in Arabidopsis. Planta 2008, 227, 277–286. [Google Scholar] [CrossRef] [PubMed]
  6. Rhodes, D.; Nadolska-Orczyk, A.; Rich, P.J. Salinity, osmolytes and compatible solutes. In Salinity: Environment—Plants—Molecules; Läuchli, A., Lüttge, U., Eds.; Springer: Heidelberg, Germany, 2004; pp. 181–204. [Google Scholar]
  7. Tester, M.; Davenport, R. Na+ tolerance and Na+ transport in higher plants. Ann. Bot. 2003, 91, 503–527. [Google Scholar] [CrossRef] [PubMed]
  8. Mittler, R. Oxidative stress, antioxidants and stress tolerance. Trends Plant Sci. 2007, 7, 405–410. [Google Scholar] [CrossRef]
  9. Sharma, P.; Jha, A.B.; Dubey, R.S.; Pessarakli, M. Reactive oxygen species, oxidative damage, and antioxidative defense mechanism in plants under stressful conditions. J. Bot. 2012. [Google Scholar] [CrossRef]
  10. Ma, J.F.; Goto, S.; Tamai, K.; Ichii, M. Role of root hairs and lateral roots in silicon uptake by rice. Plant Physiol. 2001, 127, 1773–1780. [Google Scholar] [CrossRef] [PubMed]
  11. Kushizaki, M. An extraction procedure of plant materials for the rapid determination of Mn, Cu, Zn, and Mg by the atomic absorption analysis. J. Sci. Soil Manure Jpn. 1968, 39, 489–490. [Google Scholar]
  12. Bates, L.S.; Waldren, R.P.; Teare, I.D. Rapid determination of free proline for water stress studies. Plant Soil. 1973, 39, 200–207. [Google Scholar] [CrossRef]
  13. Assaha, D.V.M.; Liu, L.; Mekawy, A.M.M.; Ueda, A.; Nagaoka, T.; Saneoka, H. Effect of salt stress on Na+ accumulation, antioxidant enzyme activities and activity of cell wall peroxidase of Huckleberry (Solanum scabrum) and eggplant (Solanum melongena). Int. J. Agric. Biol. 2015, 17, 1149–1156. [Google Scholar] [CrossRef]
  14. Dionisio-Sese, M.L.; Tobita, S. Antioxidant responses of rice seedlings to salinity stress. Plant Sci. 1998, 135, 1–9. [Google Scholar] [CrossRef]
  15. Takagi, H.; Yamada, S. Roles of enzymes in anti-oxidative response system on three species of chenopodiaceous halophytes under NaCl-stress condition. Soil Sci. Plant Nutr. 2013, 59, 603–611. [Google Scholar] [CrossRef] [Green Version]
  16. Gregorio, G.B.; Senathira, D.; Mendaza, R.D. Screening Rice for Salinity Tolerance; IRRI: Manila, Philippines, 1997. [Google Scholar]
  17. Assaha, D.V.M.; Mekawy, A.M.M.; Liu, L.; Noori, M.S.; Kokulan, K.S.; Ueda, A.; Nagaoka, T.; Saneoka, H. Na+ retention in the root is a key adaptive mechanism to low and high salinity in the glycophyte, Talinum paniculatum (Jacq.) Gaertn. (Portulacaceae). J. Agron. Crop Sci. 2017, 203, 56–67. [Google Scholar] [CrossRef]
  18. Assaha, D.V.M.; Ueda, A.; Saneoka, H.; Al-Yahyai, R.; Yaish, M.W. The role of Na+ and K+ transporters in salt stress adaptation in glycophytes. Front. Physiol. 2017, 8, 509. [Google Scholar] [CrossRef] [PubMed]
  19. Mekawy, A.M.M.; Assaha, D.V.M.; Yahagi, H.; Tada, Y.; Ueda, A.; Saneoka, H. Growth, physiological adaptation, and gene expression analysis of two Egyptian rice cultivars under salt stress. Plant Physiol. Biochem. 2015, 87, 17–25. [Google Scholar] [CrossRef] [PubMed]
  20. Ueda, A.; Yahagi, H.; Fujikawa, Y.; Nagaoka, T.; Esaka, M.; Calcaño, M.; González, M.M.; Martich, J.D.H.; Saneoka, H. Comparative physiological analysis of salinity tolerance in rice. Soil Sci. Plant Nutr. 2013, 59, 896–903. [Google Scholar] [CrossRef] [Green Version]
  21. Ashraf, M.; Foolad, M.R. Roles of glycine betaine and proline in improving plant abiotic stress resistance. Environ. Exp. Bot. 2007, 59, 206–216. [Google Scholar] [CrossRef]
  22. Yazici, I.; Türkan, I.; Sekmen, A.H.; Demiral, T. Salinity tolerance of purslane (Portulaca oleracea L.) is achieved by enhanced antioxidative system, lower level of lipid peroxidation and proline accumulation. Environ. Exp. Bot. 2007, 61, 49–57. [Google Scholar] [CrossRef]
  23. Koca, H.; Bor, M.; Özdemir, F.; Türkan, I. The effect of salinity stress on lipid peroxidation, antioxidative enzymes and proline content of sesame cultivars. Environ. Exp. Bot. 2007, 60, 344–351. [Google Scholar] [CrossRef]
  24. Hoque, M.A.; Okuma, E.; Banu, M.N.A.; Nakamura, Y.; Shimoishi, Y.; Murata, Y. Exogenous proline mitigates the detrimental effects of salt stress more than exogenous betaine by increasing antioxidant enzyme activities. J. Plant Physiol. 2007, 164, 553–561. [Google Scholar] [CrossRef] [PubMed]
  25. Banu, M.N.A.; Hoque, M.N.; Sugimoto, M.W.; Matsuoka, K.; Nakamura, Y.; Shimoishi, Y.; Murata, Y. Proline and glycinebetaine induce antioxidant defense gene expression and suppress cell death in cultured tobacco cells under salt stress. J. Plant Physiol. 2009, 166, 146–156. [Google Scholar] [CrossRef] [PubMed]
  26. Okuma, E.; Murakami, Y.; Shimoishi, Y.; Tada, M.; Murata, Y. Effects of exogenous application of proline and betaine on the growth of tobacco cultured cells under saline conditions. Soil Sci Plant Nutr. 2004, 50, 1301–1305. [Google Scholar] [CrossRef] [Green Version]
  27. Neto, A.D.A.; Prisco, J.T.; Filho, J.E.; Abreu, C.E.B.; Filho, E.G. Effect of salt stress on antioxidative enzymes and lipid peroxidation in leaves and roots of salt-tolerant and salt-sensitive maize genotypes. Environ. Exp. Bot. 2006, 56, 87–94. [Google Scholar] [CrossRef]
  28. Meloni, D.A.; Oliv, A.; Martinez, M.A.; Campraia, J.C.A. Photosynthesis and activity of superoxide dismutase, peroxidase and glutathione reductase in cotton under salt stress. Environ. Exp. Bot. 2003, 49, 69–76. [Google Scholar] [CrossRef]
  29. Demiral, T.; Türkan, I. Comparative lipid peroxidation, antioxidant defense systems and proline content in roots two rice cultivars differing in salt tolerance. Environ. Exp. Bot. 2005, 53, 247–257. [Google Scholar] [CrossRef]
  30. Elsawy, H.I.; Mekawy, A.M.M.; Elhity, M.A.; Abdel-dayem, S.M.; Abdelaziz, M.N.; Assaha, D.V.; Ueda, A.; Saneoka, H. Differential responses of two Egyptian barley (Hordeum vulgare L.) cultivars to salt stress. Plant Physiol. Biochem. 2018, 127, 425–435. [Google Scholar] [CrossRef] [PubMed]
  31. Noctor, G.; Foyer, C.H. Ascorbate and glutathione: Keeping active oxygen under control. Annu. Rev. Plant Physiol. Plant Mol. Biol. 1998, 49, 249–279. [Google Scholar] [CrossRef] [PubMed]
  32. Sharma, P.; Dubey, R.S. Modulation of nitrate reductase activity in rice seedlings under aluminium toxicity and water stress: Role of osmolytes as enzyme protectant. J. Plant Physiol. 2005, 162, 854–864. [Google Scholar] [CrossRef] [PubMed]
  33. Mekawy, A.M.M.; Abdelaziz, M.N.; Ueda, A. Apigenin pretreatment enhances growth and salinity tolerance of rice seedlings. Plant Physiol. Biochem. 2018, 130, 94–104. [Google Scholar] [CrossRef] [PubMed]
  34. Xuan, T.D.; Khang, D.T. Effects of exogenous application of protocatechuic acid and vanillic acid to chlorophylls, phenolics and antioxidant enzymes of rice (Oryza sativa L.) in submergence. Molecules 2018, 23, 620. [Google Scholar] [CrossRef] [PubMed]
  35. Hakim, M.A.; Juraimi, A.S.; Hanafi, M.M.; Ismail, M.R.; Selamat, A.; Rafii, M.Y.; Latif, M.A. Biochemical and anatomical changes and yield reduction in rice (Oryza sativa L.) under varied salinity regimes. Biomed. Res. Int. 2014. [Google Scholar] [CrossRef] [PubMed]
  36. Baloch, A.W.; Soomro, A.M.; Javed, M.A.; Bughio, H.R.; Alam, S.M.; Gughio, M.S.; Mohamed, T.; Mastoi, N.N. Induction of salt tolerance in rice through mutation breeding. Asian J. Plant Sci. 2003, 2, 273–276. [Google Scholar]
  37. Rebeira, S.P.; Wickramasinghe, H.A.M.; Samarasinghe, W.L.G.; Prashantha, B.D.R. Diversity of grain quality characteristic of traditional rice (Oryza sativa L.) varieties in Sri Lanka. Trop. Agric. Res. 2014, 25, 570–578. [Google Scholar] [CrossRef]
  38. Waziri, A.; Kumar, P.; Purty, R.S. Saltol QTL and their roe in salinity tolerance in rice. Austin J. Biotechnol. Bioeng. 2016, 3, 1067. [Google Scholar]
  39. Thomson, M.J.; de Ocampo, M.; Egdane, J.; Rahman, M.A.; Sajise, A.G.; Adorada, D.L.; Tumimbang-Raiz, E.; Blumwald, E.; Seraj, Z.I.; Singh, R.K.; et al. Characterizing the Saltol quantitative trait locus for salinity tolerance in rice. Rice 2010, 3, 148–160. [Google Scholar] [CrossRef]
  40. Abd-El Salam, M.H.K.; El-Dalil, A.E.M.; Abd El Ghany, K.E.E. Mean performance and genetic variability of some grain quality characteristics of rice (Oryza sativa L.). Alexandria Sci. Exch. J. 2016, 37, 1. [Google Scholar]
  41. Metwally, T.F.; El-Zun, H.M.; Abdelfattah, A.H.N. Performance of some rice genotypes sown on different dates in yield, quality traits, and infestation by lesser grain borer. J. Plant Prod. Mansoura Univ. 2016, 7, 793–982. [Google Scholar]
Figure 1. Effect of salinity stress (100 mM NaCl) on dry weight of Sakha 103–106, Giza 182, and Pokkali after 14 days of treatment. Data represent the means ± SE (standard errors, n = 4). The bars with the same letter on the top are not significantly different (p ≤ 0.05). The terms sheath and leaf indicate the leaf sheath and leaf blade, respectively.
Agriculture 08 00166 g001
Figure 2. The Na+ (A–C) and K+ (D–F) concentrations increased in the leaf blades and sheaths and roots of Sakha 103–106, Giza 182, and Pokkali under control conditions and salinity stress at 14 days after treatment. The bars represent the means ± SE (standard errors) (n = 4). The bars with same letter on the top are not significantly different (p ≤ 0.05).
Agriculture 08 00166 g002
Figure 3. Na+/K+ ratio in the leaf blades (A), sheaths (B), and roots (C) of Sakha 103–106, Giza 182, and Pokkali under control conditions and salinity stress at 14 days after treatment. The bars represent means ± SE (standard errors) (n = 4). The bars with same letter on the top are not significantly different (p ≤ 0.05).
Agriculture 08 00166 g003
Figure 4. Proline concentration in the roots and leaves of Giza 182 and Sakha 105 under control conditions and 100 mM NaCl stress for 14 days. Data represent the means ± SE (standard errors) (n = 4). FW: fresh weight. The bars with same letter on the top are not significantly different (p ≤ 0.05).
Agriculture 08 00166 g004
Figure 5. Malondialdehyde (MDA) concentration in the roots and leaves of Giza 182 and Sakha 105 under control conditions and 100 mM NaCl stress for 14 days. The bars represent means ± SE (standard errors) (n = 4), FW: fresh weight. The bars with same letter on the top are not significantly different (p ≤ 0.05).
Agriculture 08 00166 g005
Figure 6. Activity of catalase (CAT) (A,B) and ascorbate peroxidase (APX) (C,D) in the roots and leaf blades of Giza 182 and Sakha 105 under control conditions and 100 mM NaCl stress for 14 days. The bars represent means ± SE (standard errors) (n = 4). The bars with the same letter on the top are not significantly different (p ≤ 0.05).
Agriculture 08 00166 g006aAgriculture 08 00166 g006b

