Article

Screening for Salt Tolerance in Four Local Varieties of Phaseolus lunatus from Spain

by
Sugenith Arteaga
1,
Mohamad Al Hassan
1,2,
Wijesinghe M. Chaminda Bandara
1,3,
Lourdes Yabor
1,4,
Josep V. Llinares
5,
Monica Boscaiu
5,* and
Oscar Vicente
1
1
Institute for Plant Molecular and Cellular Biology (UPV-CSIC), Universitat Politècnica de València, Camino de Vera s/n, 46022 Valencia, Spain
2
The New Zealand Institute for Plant & Food Research, Auckland 1025, New Zealand
3
Hayleys Agro Farms (Pvt) Limited, Hayleys Agriculture Holdings 25, Foster Lane, Colombo 10, Sri Lanka
4
Laboratory for Plant Breeding and Conservation of Genetic Resources, Bioplant Center, University of Ciego de Avila, 69450 Ciego de Ávila, Cuba
5
Mediterranean Agroforestry Institute, Universitat Politècnica de València, Camino de Vera s/n, 46022 Valencia, Spain
*
Author to whom correspondence should be addressed.
Agriculture 2018, 8(12), 201; https://doi.org/10.3390/agriculture8120201
Submission received: 30 October 2018 / Revised: 6 December 2018 / Accepted: 13 December 2018 / Published: 15 December 2018
(This article belongs to the Special Issue Response and Tolerance of Agricultural Crops to Salinity Stress)

Abstract

:
This study assessed the responses of four local Spanish cultivars of Phaseolus lunatus (lima bean) to moderate salinity. For three weeks, plants were exposed to increasing salinity (50–150 mM NaCl) under greenhouse conditions. At the end of the experiment, several growth and biochemical parameters were determined. Salt stress reduced the fresh weight of aerial organs, allowing us to rank the four genotypes according to their tolerance to salinity. The concentration of most photosynthetic pigments remained unaltered, except carotenoids that were reduced in the least salt-tolerant cv. (cultivar) VPH-79. Leaf Na+ and Cl concentrations increased with increased salt concentration of irrigation water, but K+ either remained constant, as in the most tolerant ‘BGV-15410’, or increased in the other cultivars, resulting in an unchanged K+/Na+ ratio under stress in two of the selected cultivars. Moreover, proline increased in all cultivars, most notably in cv. VPH-79, with the highest absolute concentrations registered in the more salt tolerant cultivars. Interestingly, these cultivars already had a relatively higher proline concentration in non-stressed plants. These findings indicate that P. lunatus is moderately salt tolerant and that its main mechanisms to adjust to salinity stress are the maintenance of high concentrations of K+ and proline accumulation in leaves.

1. Introduction

Lima bean, Phaseolus lunatus L., is an important crop, which ranks second among beans—only superseded by common beans, Phaseolus vulgaris—regarding consumption and cultivated land [1]. Though originating from Mesoamerica and the Andes [2], its area of cultivation has spread over time, covering many tropical and subtropical areas around the world, notably in Africa and North America, with the United States now the leading producer of P. lunatus [3]. In Europe, it is cultivated at a small scale in the Mediterranean countries, mostly in Spain, where it is an ingredient of the traditional rice dish “paella”.
Following its spread from its original distribution area, the species, as many others crops with American origin, diversified through adaptation and hybridisation into many local genotypes, due to the need to acclimate to different climatic and ecologic conditions [4]. However, this diversity is being threatened by contamination, climate change, and changes in land use (urbanisation, industrialisation, or cultivation of other more valuable crops).
The different P. lunatus varieties have been developed, selected, and bred by farmers for many centuries and represent an important source of genetic variability. However, as traditional farming methods are being replaced by industrialised cultivation led by large agricultural companies, the maintenance of local varieties and, hence, diversity is being lost [5]. This loss is irreversible, affects the stability of agro-ecosystems, and increases the vulnerability of crops. The reduction of genetic diversity decreases the chance of adapting agriculture to future challenges triggered mostly by climate change [6], especially since the genotypes used extensively in agriculture were selected for their high productivity or resistance to some diseases and pests, but not bred for increased tolerance to abiotic stresses [7].
Nonetheless, selection of genotypes better adapted to abiotic stress is recently gaining interest due to the forecasted worsening environmental conditions caused by climate change, desertification, and pollution. This is especially important in Mediterranean countries, where extended, frequent, and severe drought periods are predicted to occur in upcoming years [8]. This bleak situation is further compounded with the scarcity of water suitable for irrigation, especially in arid and semi-arid areas, making unavoidable the use of low-quality, brackish irrigation water. The progressive accumulation of salts dissolved in irrigation water will step up, thus worsening the problem of secondary salinisation that is significantly contributing to the reduction of crop yields worldwide and has been causing the loss of more than 10 million hectares of arable land every year since the beginning of this century [7,9]. These losses could be explained by the deleterious effects of salt on plants, affecting their water potential and their ability to uptake some mineral nutrients, and causing ionic imbalance and toxicity, associated with oxidative stress [10,11]. Plant tolerance to salt stress is extremely complex, as numerous interactions take place between stress-induced factors and the physiological and biochemical processes affecting plant development [12,13]. All plants, tolerant or not, activate the same basic responses against increased salinity, including inhibition of growth, degradation of photosynthetic pigments, regulation of ion transport, accumulation of compatible solutes, and activation of antioxidant systems [12,13,14,15,16]. The efficiency in the use and balance of these mechanisms, under specific conditions, will determine the relative degree of salt tolerance of a given species.
The present work focuses on salt tolerance mechanisms in four Spanish landraces of P. lunatus. Studies on the effects of abiotic stress on lima bean are scarce [17,18] and, to our knowledge, this is the first report on the physiological and biochemical responses to salt stress in this species. Our working hypothesis was that genotypes better adapted to salinity, if any could be identified, will rely for their tolerance on some of the conserved response mechanisms described above. Therefore, growth responses to saline stress of four genotypes were correlated with stress-induced changes in leaf concentrations of photosynthetic pigments, monovalent ions, proline, and total soluble sugars. Apart from contributing to the elucidation of the mechanisms of salt tolerance in this species, this study may also have a direct practical application for the efficient screening of local landraces to identify tolerant genotypes.

2. Materials and Methods

2.1. Plant Material

Seeds of four local cultivars of P. lunatus from Spain were provided by the Germplasm Bank of COMAV (Institute for Conservation and Improvement of Valencian Agrodiversity, Universitat Politècnica de València, Valencia, Spain). Three cultivars originated from the Province of Valencia (BGV-12848 collected at Benavites; VPH-79 from Benaguacil, and BGV-15410 from Meliana), and one (BGV-1588) originated from Soller, Mallorca, in the Balearic Isles, were used in this study.

2.2. Plant Growth and Stress Treatments

Seeds were individually germinated in 1 L pots (11 cm in diameter) with a standard substrate (peat and vermiculite, 1:1) moistened with half-strength Hoagland nutrient solution prepared with deionised water and with an electrical conductivity (EC) of ~0.8 dS m−1 [19]. When plants acquired one to three pairs of trifoliate leaves and reached a height of about 25 cm, the pots were placed in 55 × 40 cm plastic trays (10 pots per tray) and salt treatments (50, 100, and 150 mM NaCl) were started. Control plants were watered twice a week by adding 1.5 L half-strength Hoagland nutrient solution to each tray, whereas those under salt treatments were watered by adding to the trays the same volume of nutrient solution supplemented with NaCl at the final concentrations indicated above; trays were thoroughly washed with tap water and then rinsed with deionised water before each new addition of saline solutions. The treatments were applied during three weeks in a growth chamber under the following controlled conditions: long day photoperiod (16 h of light and 8 h of darkness), temperature of 23 °C during the day and 17 °C at night, and relative humidity ranging between 50% and 80%. Five plants (biological replicas) were used per cultivar and per treatment.

2.3. Soil Analysis

The electrical conductivity (EC1:5) of the substrate was checked at the end of the treatments. Soil samples were taken from five individual pots per treatment, air-dried, and then passed through a 2-mm sieve. A soil:water (1:5) suspension was prepared with distilled water and stirred for one hour at 600 rpm at room temperature. EC was measured with a Crison Conductivity meter 522 (Crison Instruments SA, Barcelona, Spain) and expressed in dS m−1.

2.4. Plant Growth Parameters

At the conclusion of the experiment, plant materials (roots, stems, and leaves) were sampled separately. The following growth parameters were analysed: root and stem length, basal stem diameter, number of leaves, and fresh weight of roots, stems, and leaves. Part of the harvested leaf material from each sample was weighed (FW), dried in an oven at 65 °C for 48 to 72 h until constant weight, and then reweighed (DW) to calculate the water content, in percentage, of each sample, with the following formula: WC = [(FW − DW)/FW] × 100 [20]. Fresh material was stored at −20 °C for further analyses.

2.5. Photosynthetic Pigments

Photosynthetic pigments, including chlorophyll a (Chl a), chlorophyll b (Chl b), and carotenoids (Caro), were quantified using 100 mg of fresh leaf material ground in 30 mL ice-cold 80% aqueous acetone. The sample was centrifuged 10 min at 12,000 rpm, the absorbance of the supernatant was measured at 663, 646, and 470 nm, and pigment concentrations were calculated according to validated formulas [21]:
  • Chl a (µg mL−1) = 12.21 (A663) − 2.81 (A646),
  • Chl b (µg mL−1) = 20.13 (A646) − 5.03 (A663),
  • Caro (µg mL−1) = (1000A470 − 3.27[chl a] − 104[chl b])/227.
  • Final values were expressed in mg g−1 DW.

2.6. Ion Concentration Measurements

Samples were extracted by incubating 0.15 g of ground dry leaf material in 25 mL of water for one hour at 95 °C in a water bath, followed by filtration [22]. Sodium and potassium were measured in a PFP7 flame photometer (Jenway Inc., Burlington, VT, USA), and chloride was measured using a chloride analyser.

2.7. Osmolyte Quantification

Proline (Pro) determination was performed following the classical method described by Bates et al. [23], with small laboratory modifications, as previously described [20]. Fresh leaf material was extracted in a 3% (w/v) sulfosalicylic acid solution, then mixed with acid ninhydrin, incubated for one hour at 95 °C, cooled on ice, and extracted with two volumes of toluene. After collecting the upper organic phase, its absorbance was read at 520 nm, with toluene used as a blank. Total soluble sugars (TSS) were extracted from dry leaf material with 80% (v/v) methanol, mixed on a rocker shaker for 24 h and then quantified spectrophotometrically at 490 nm, following the phenol/sulphuric acid method [24]. The concentrations of TSS were expressed as “mg equivalent of glucose” per g DW.

2.8. Statistical Analysis

The program Statgraphics Centurion XVI (Statpoint Technologies, Warrenton, VA, USA) was used for the statistical analysis of the generated data. Before variance analysis, the validity of the normality assumption was checked by the Shapiro-Wilk test and the homogeneity of variance using the Levene test. Once it was established that ANOVA (Analysis of Variance) requirements were fulfilled, one-way ANOVA, followed by post-hoc Tukey HSD (honestly significant difference) test, was applied to analyse the effect of salinity within each variety; two-way ANOVAs were used to check the effect of both treatment and variety, and their interactions. All results were expressed as means (n = 5) followed by standard errors (SEs), and ANOVA was performed at the 95% confidence level. A principal component analysis (PCA) was performed to analyse the effect of salinity, indicated by the substrates EC, on the four cultivars.

3. Results

3.1. Substrate and Plant Growth Analyses

After three weeks of salt treatments, the electric conductivity of the substrates showed a significant increment in all four studied cultivars and all saline treatments (Table 1). As expected, the highest EC was registered in the pots watered with 150 mM NaCl, recording about a four-fold increase in comparison with EC measured in the respective controls. On the other hand, no significant inter-cultivar differences were detected, as shown in Table 2.
The morphological parameters analysed in roots (Table 1) indicated a high variability between the cultivars (Table 2). We could not detect any clear trend for changes in the root length in relation to the applied treatments, as the measurements showed fluctuations with increasing amounts of added salt. Root fresh weight (Root FW) did not vary significantly in the cultivars VPH-70 and BGV-12848, whereas in the remaining two (BGV-1541 and BGV-1588) it increased in the presence of 100 or 150 mM NaCl. On the other hand, root water content (Root WC) was similar among cultivars and did not change significantly in the different treatments. Stem length and stem diameter had significant changes under salt stress only for the cultivar BGV-1588, though a strict concentration-dependence with increasing external NaCl was not observed. Stem fresh weight largely varied, not only between genotypes but also between samples, whereas stem water content differed significantly between genotypes—especially in control plants—but not when comparing salt-stressed and non-stressed plants. Therefore, considering changes in root and stem parameters, a tendency of growth reduction with increasing salinity was noticed in the four cultivars, but no clear patterns of variation were observed (Table 1).
The number of leaves diminished significantly in all four cultivars under salinity, and this reduction was most profound in the leafier cultivar VPH-79, which in the control had an average of 44 leaves per plant. Leaf FW weight also decreased in all cultivars. Leaf water content did not vary as a consequence of the salt treatment, except for the slight (about 8%) but significant decrease observed in the cultivar BGV-12848, indicating that P. lunatus is quite resistant to salt-induced leaf dehydration (Table 1).
To gain a better understanding of the effects of salinity on plant growth, the fresh weights of roots, stems, and leaves of each plant were summed and the obtained values were expressed as the percentages of FW reduction with respect to their respective controls (last rows in Table 1). In this way, salt-induced growth inhibition for each cultivar and their relative degree of salt tolerance were established. Cultivar VPH-79, with a FW reduction of almost 74%, appeared to be the most sensitive to salinity, followed by BGV-12848, whereas BGV-15410—which lost only ~37% of the control FW in the presence of the highest NaCl concentration tested (150 mM)—would be the most tolerant according to this criterion.

3.2. Photosynthetic Pigments

A common effect of salt stress is the degradation of photosynthetic pigments (chlorophyll a and b, and carotenoids). In the lima bean cultivars analysed here, there were only small, non-significant variations of chlorophylls concentrations. Total carotenoids concentration was significantly reduced only in cultivar VPH-79 or increased in BGV 15888 (Table 3). Differences between cultivars were significant for chlorophyll a and carotenoids (Table 2).

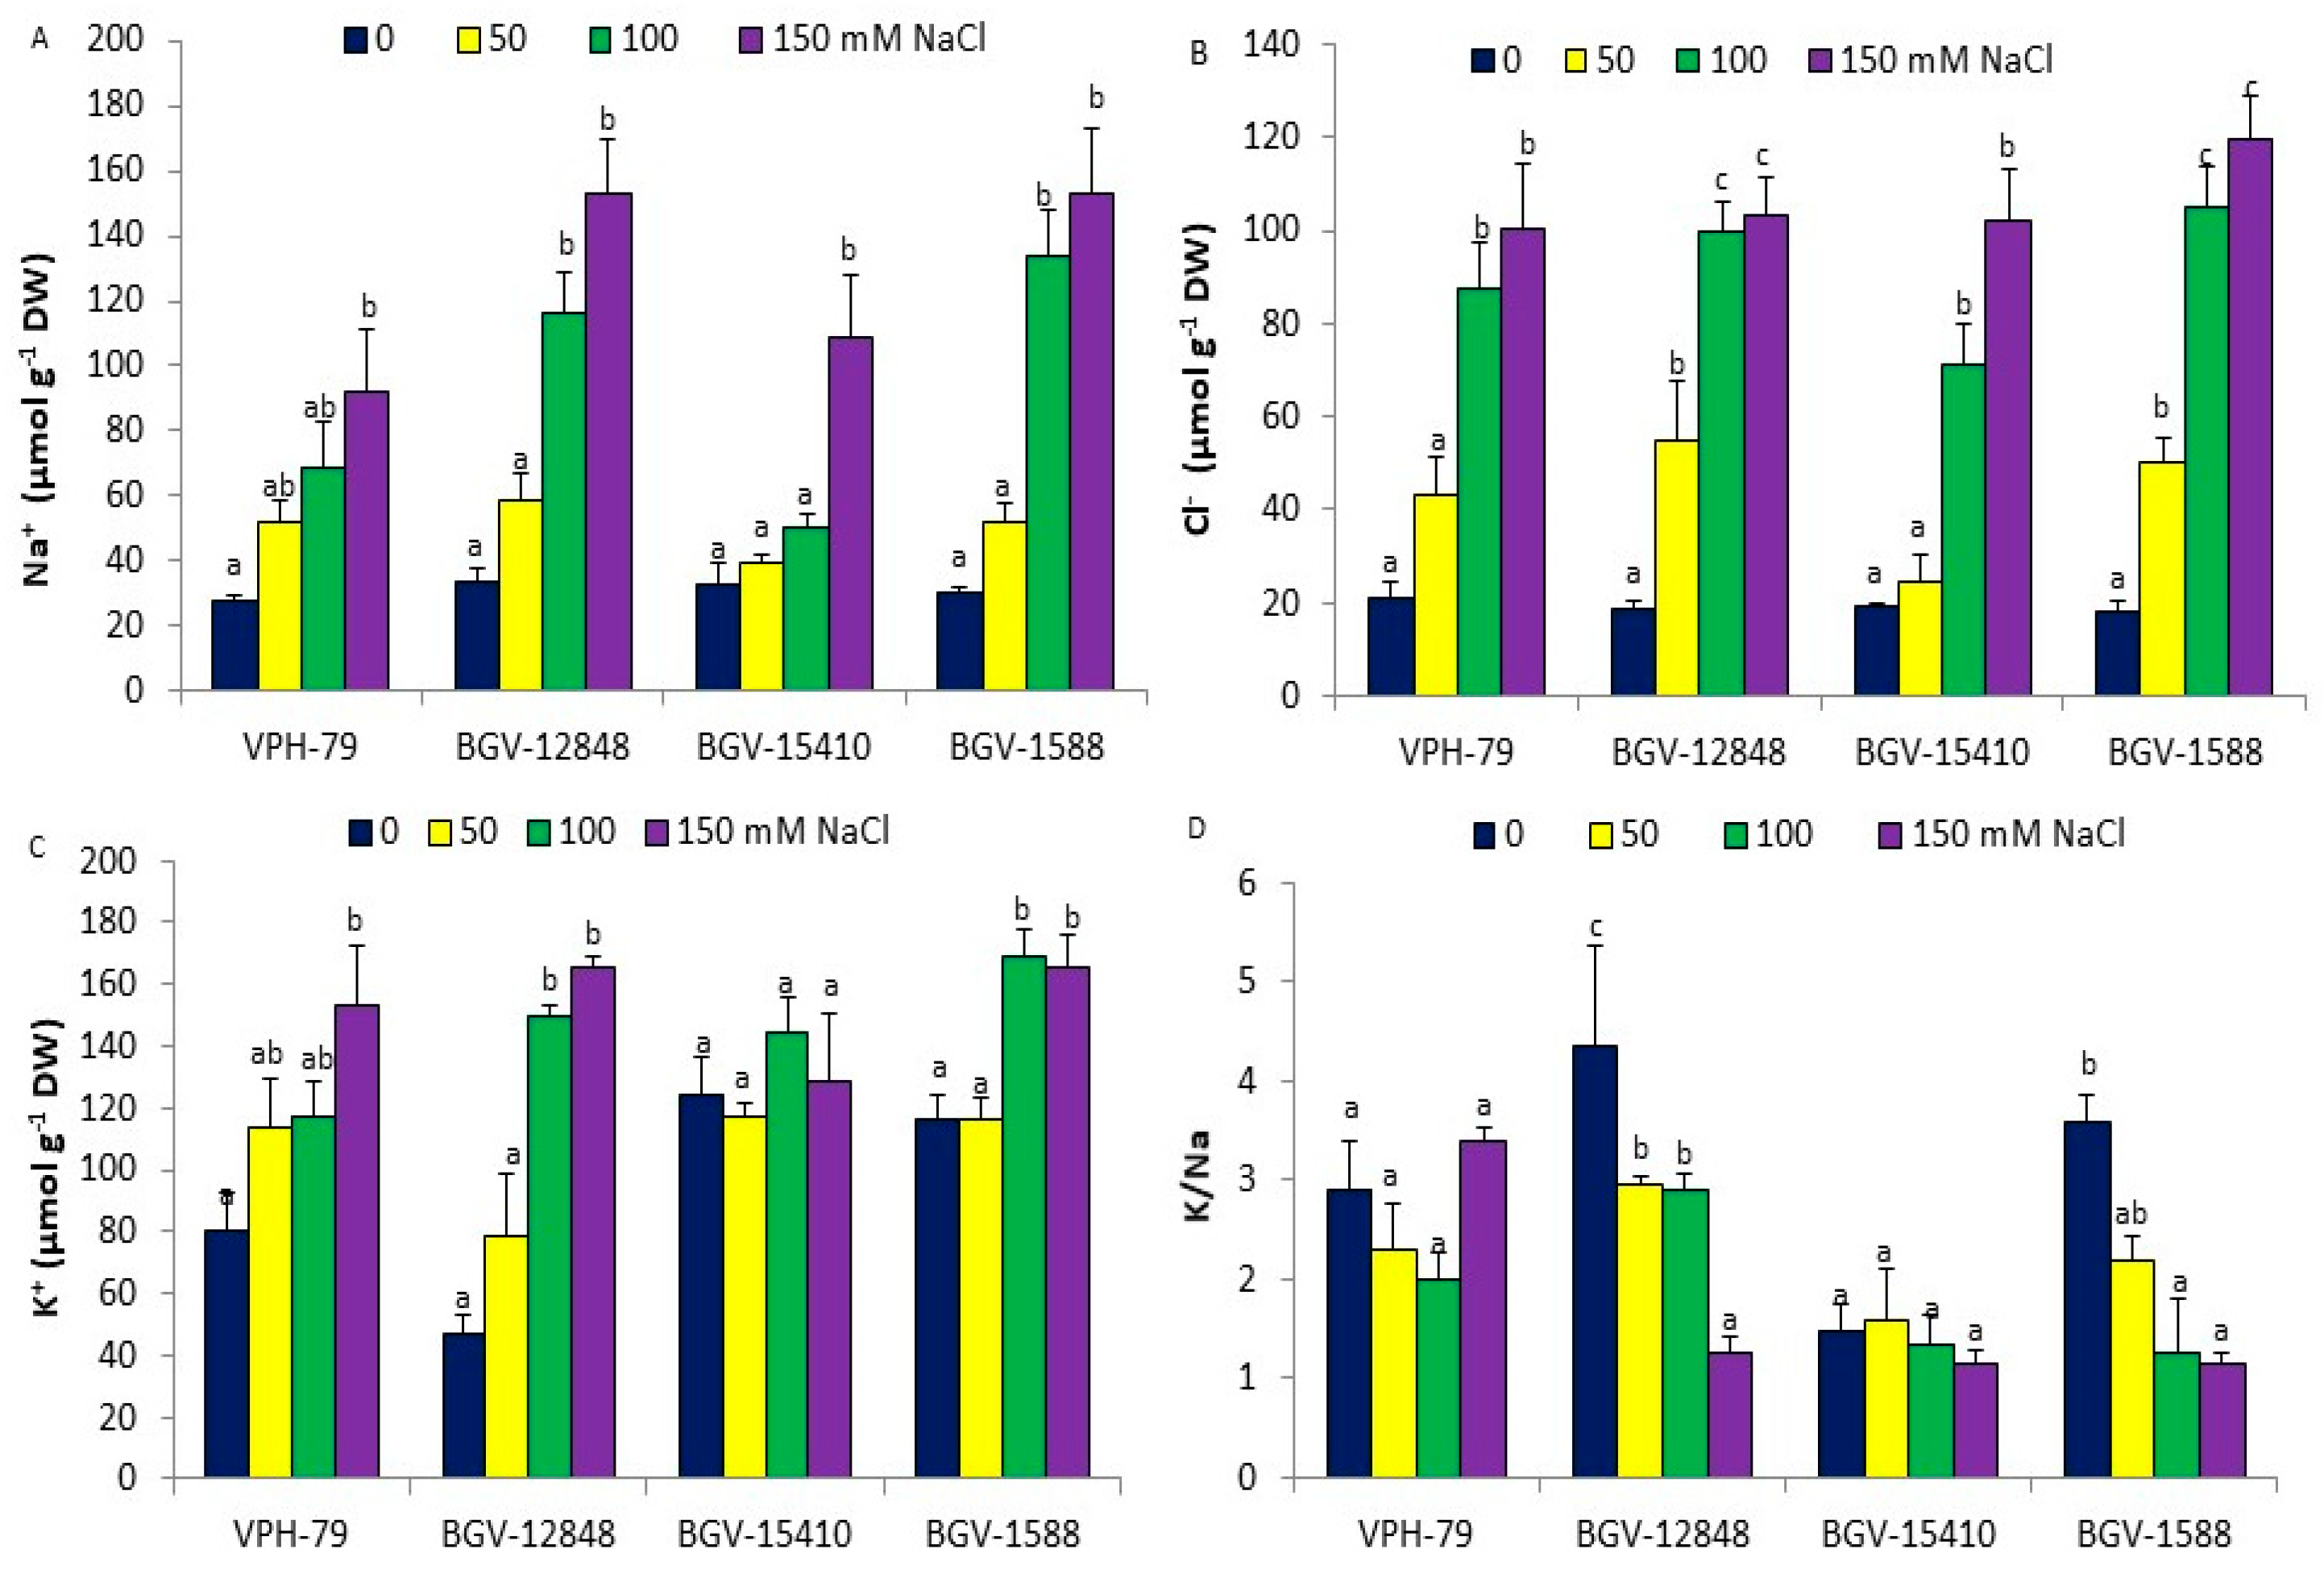
3.3. Ions Accumulation

Leaf concentrations of sodium (Na+) and chloride (Cl) increased in the four cultivars in parallel with increasing salinity (Figure 1A). Maximum absolute concentrations of both ions were therefore registered in the presence of 150 mM NaCl. The relative increases with respect to the corresponding controls, grown in the absence of salt, varied between 3- and 5-fold for Na+ and between 5- and 7-fold for Cl, approximately. Interestingly, K+ concentrations did not vary significantly in the most salt-tolerant cultivar, BGV-15410, whereas K+ increased in the leaves of salt-treated plants of the remaining cultivars; it should be mentioned that, in the absence of external NaCl, K+ concentration was higher in BGV-15410 and BGV-1588, the most tolerant cultivars, than in the most salt-sensitive, VPH-79 and BGV-12848 (Figure 1C). The combined variation in Na+ and K+ concentrations resulted in a reduction in K+/Na+ ratios in two cultivars (BGV-12848 and BGV-1588), but no changes in the remaining two cultivars (Figure 1D).

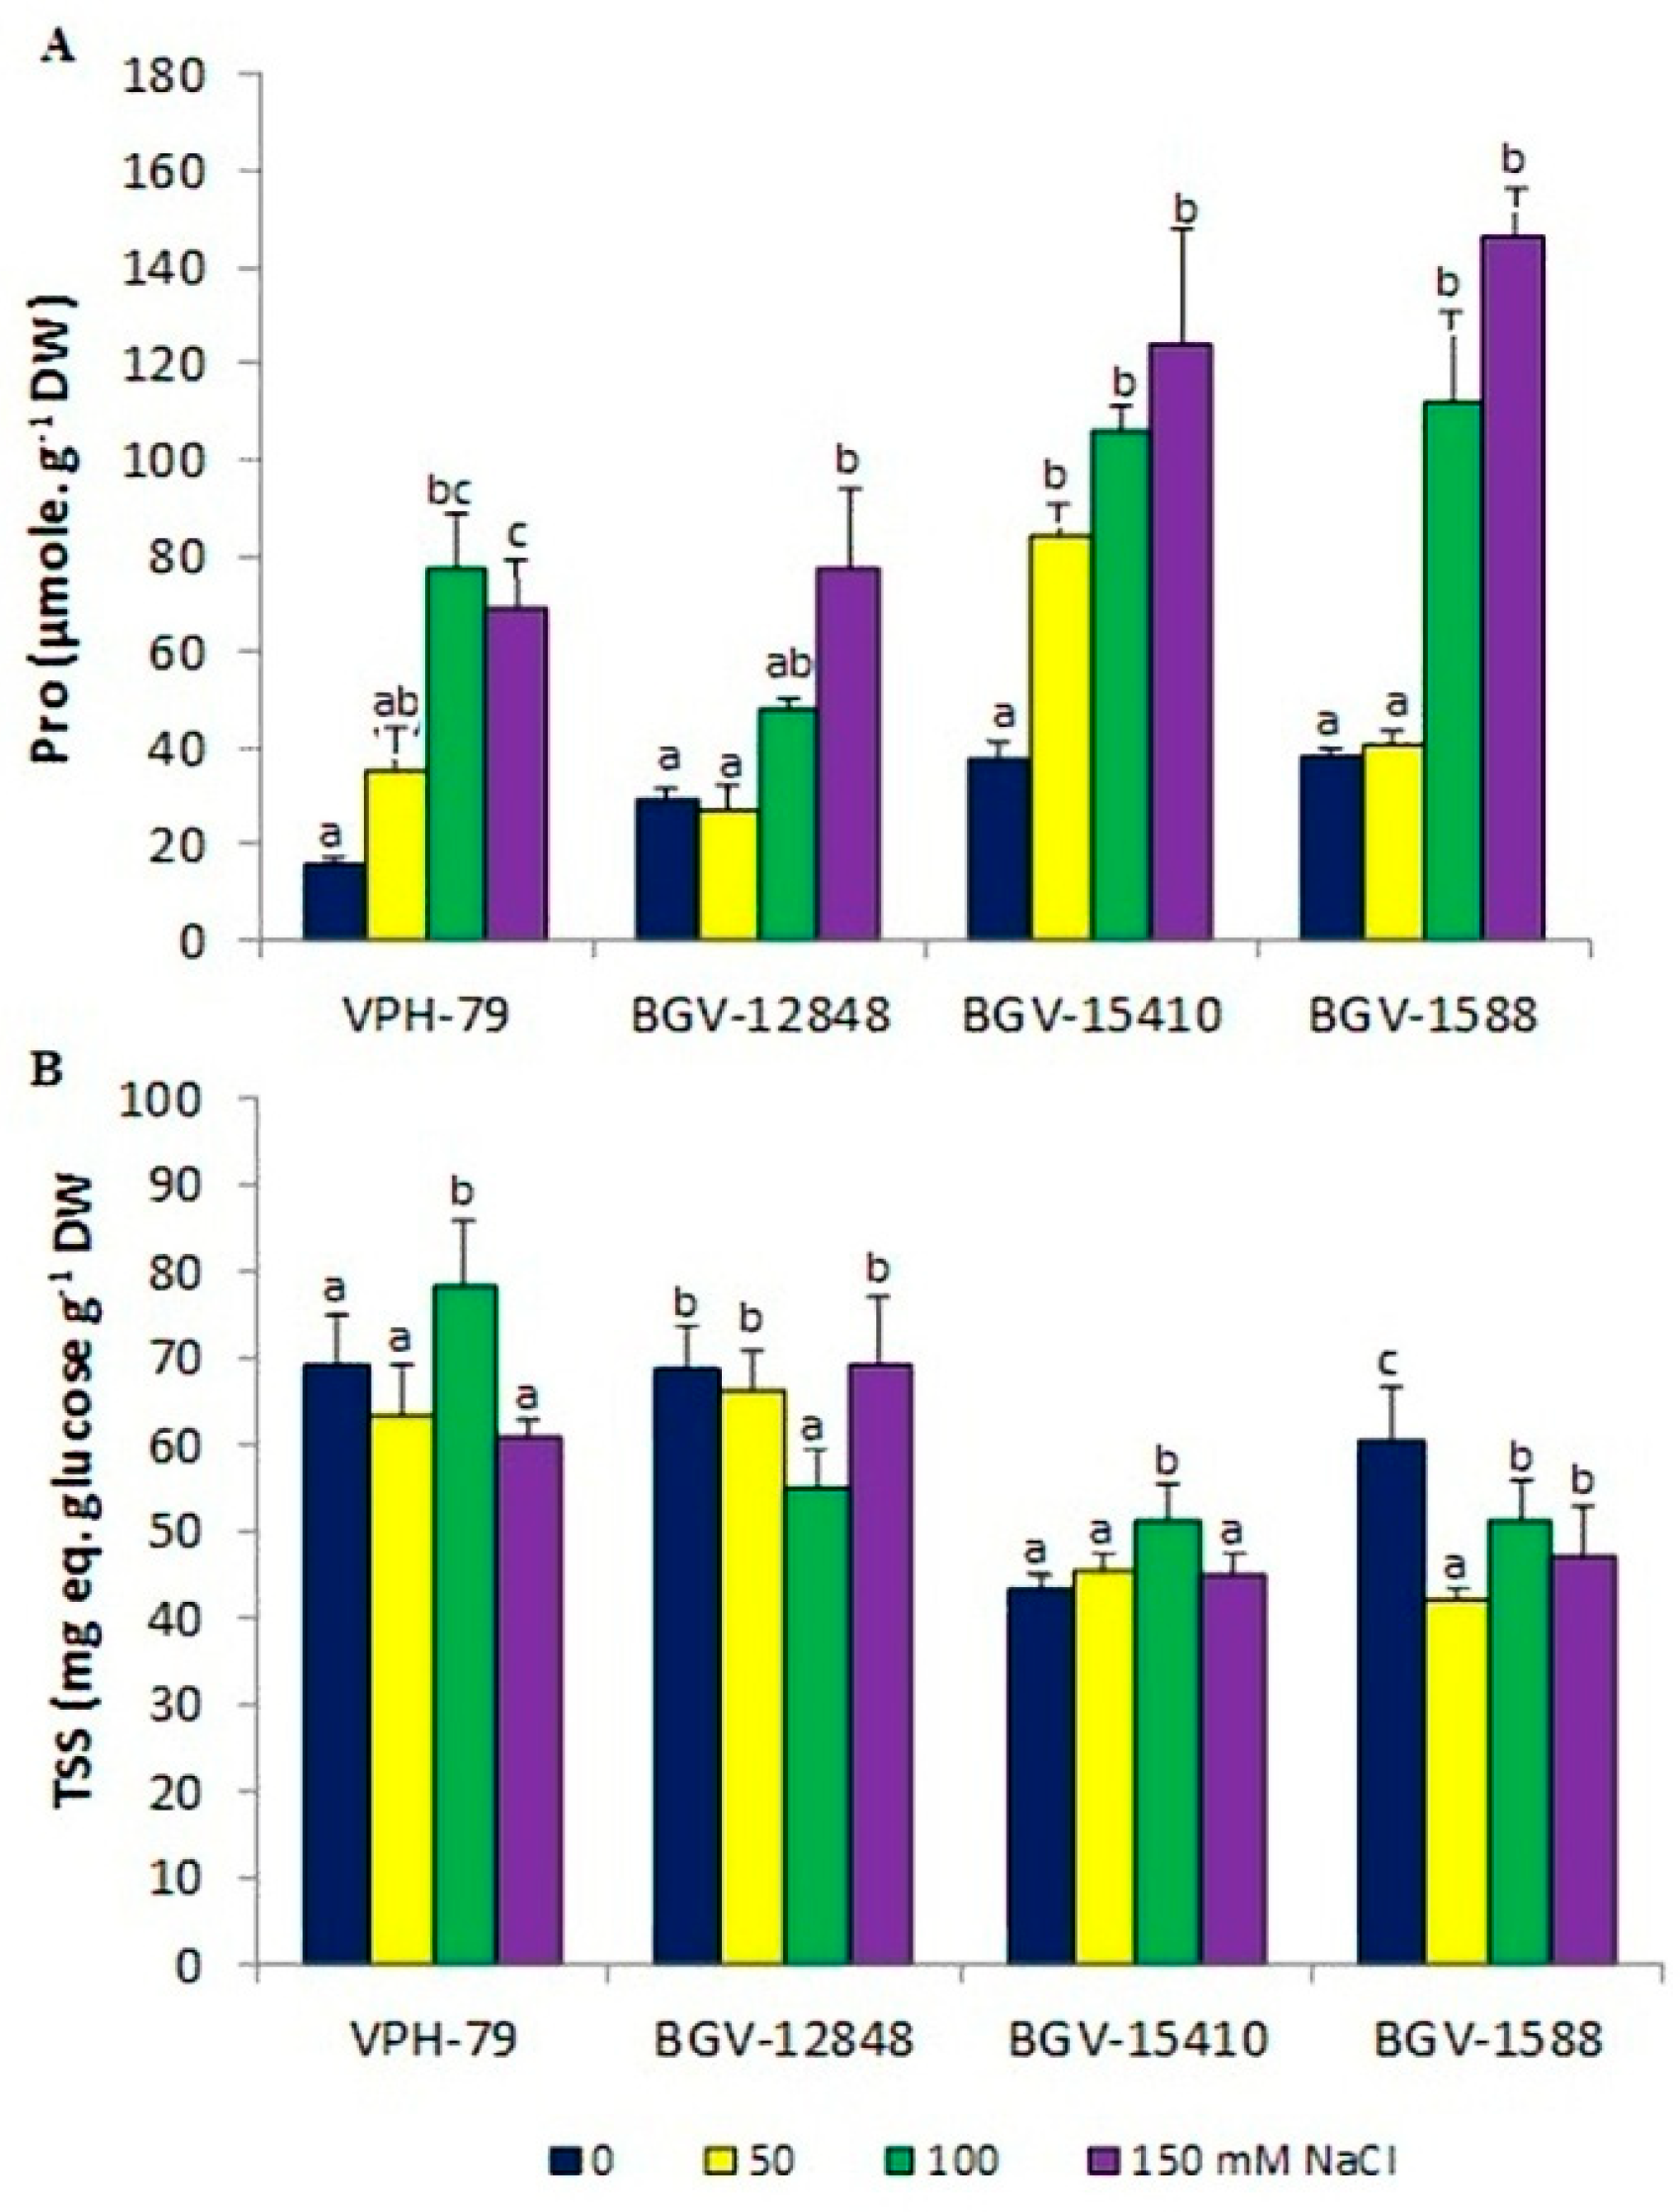
3.4. Osmolytes Accumulation

Cellular osmotic adjustment requires the synthesis and accumulation of compatible solutes or osmolytes under conditions that generate osmotic stress, as generated by the salt treatments used in this work. Leaf proline (Pro) concentrations increased in response to increasing external NaCl in a concentration-dependent manner (Figure 2A). Pro concentrations were the highest in leaves of the two most salt-tolerant cultivars (BGV-1540 and BGV-1588), both in control and in stressed plants (Figure 2A). The concentrations of total soluble sugars (TSS) differed in the selected P. lunatus cultivars, but did not vary significantly in any of them in response to the stress treatment (Figure 2B and Table 2).

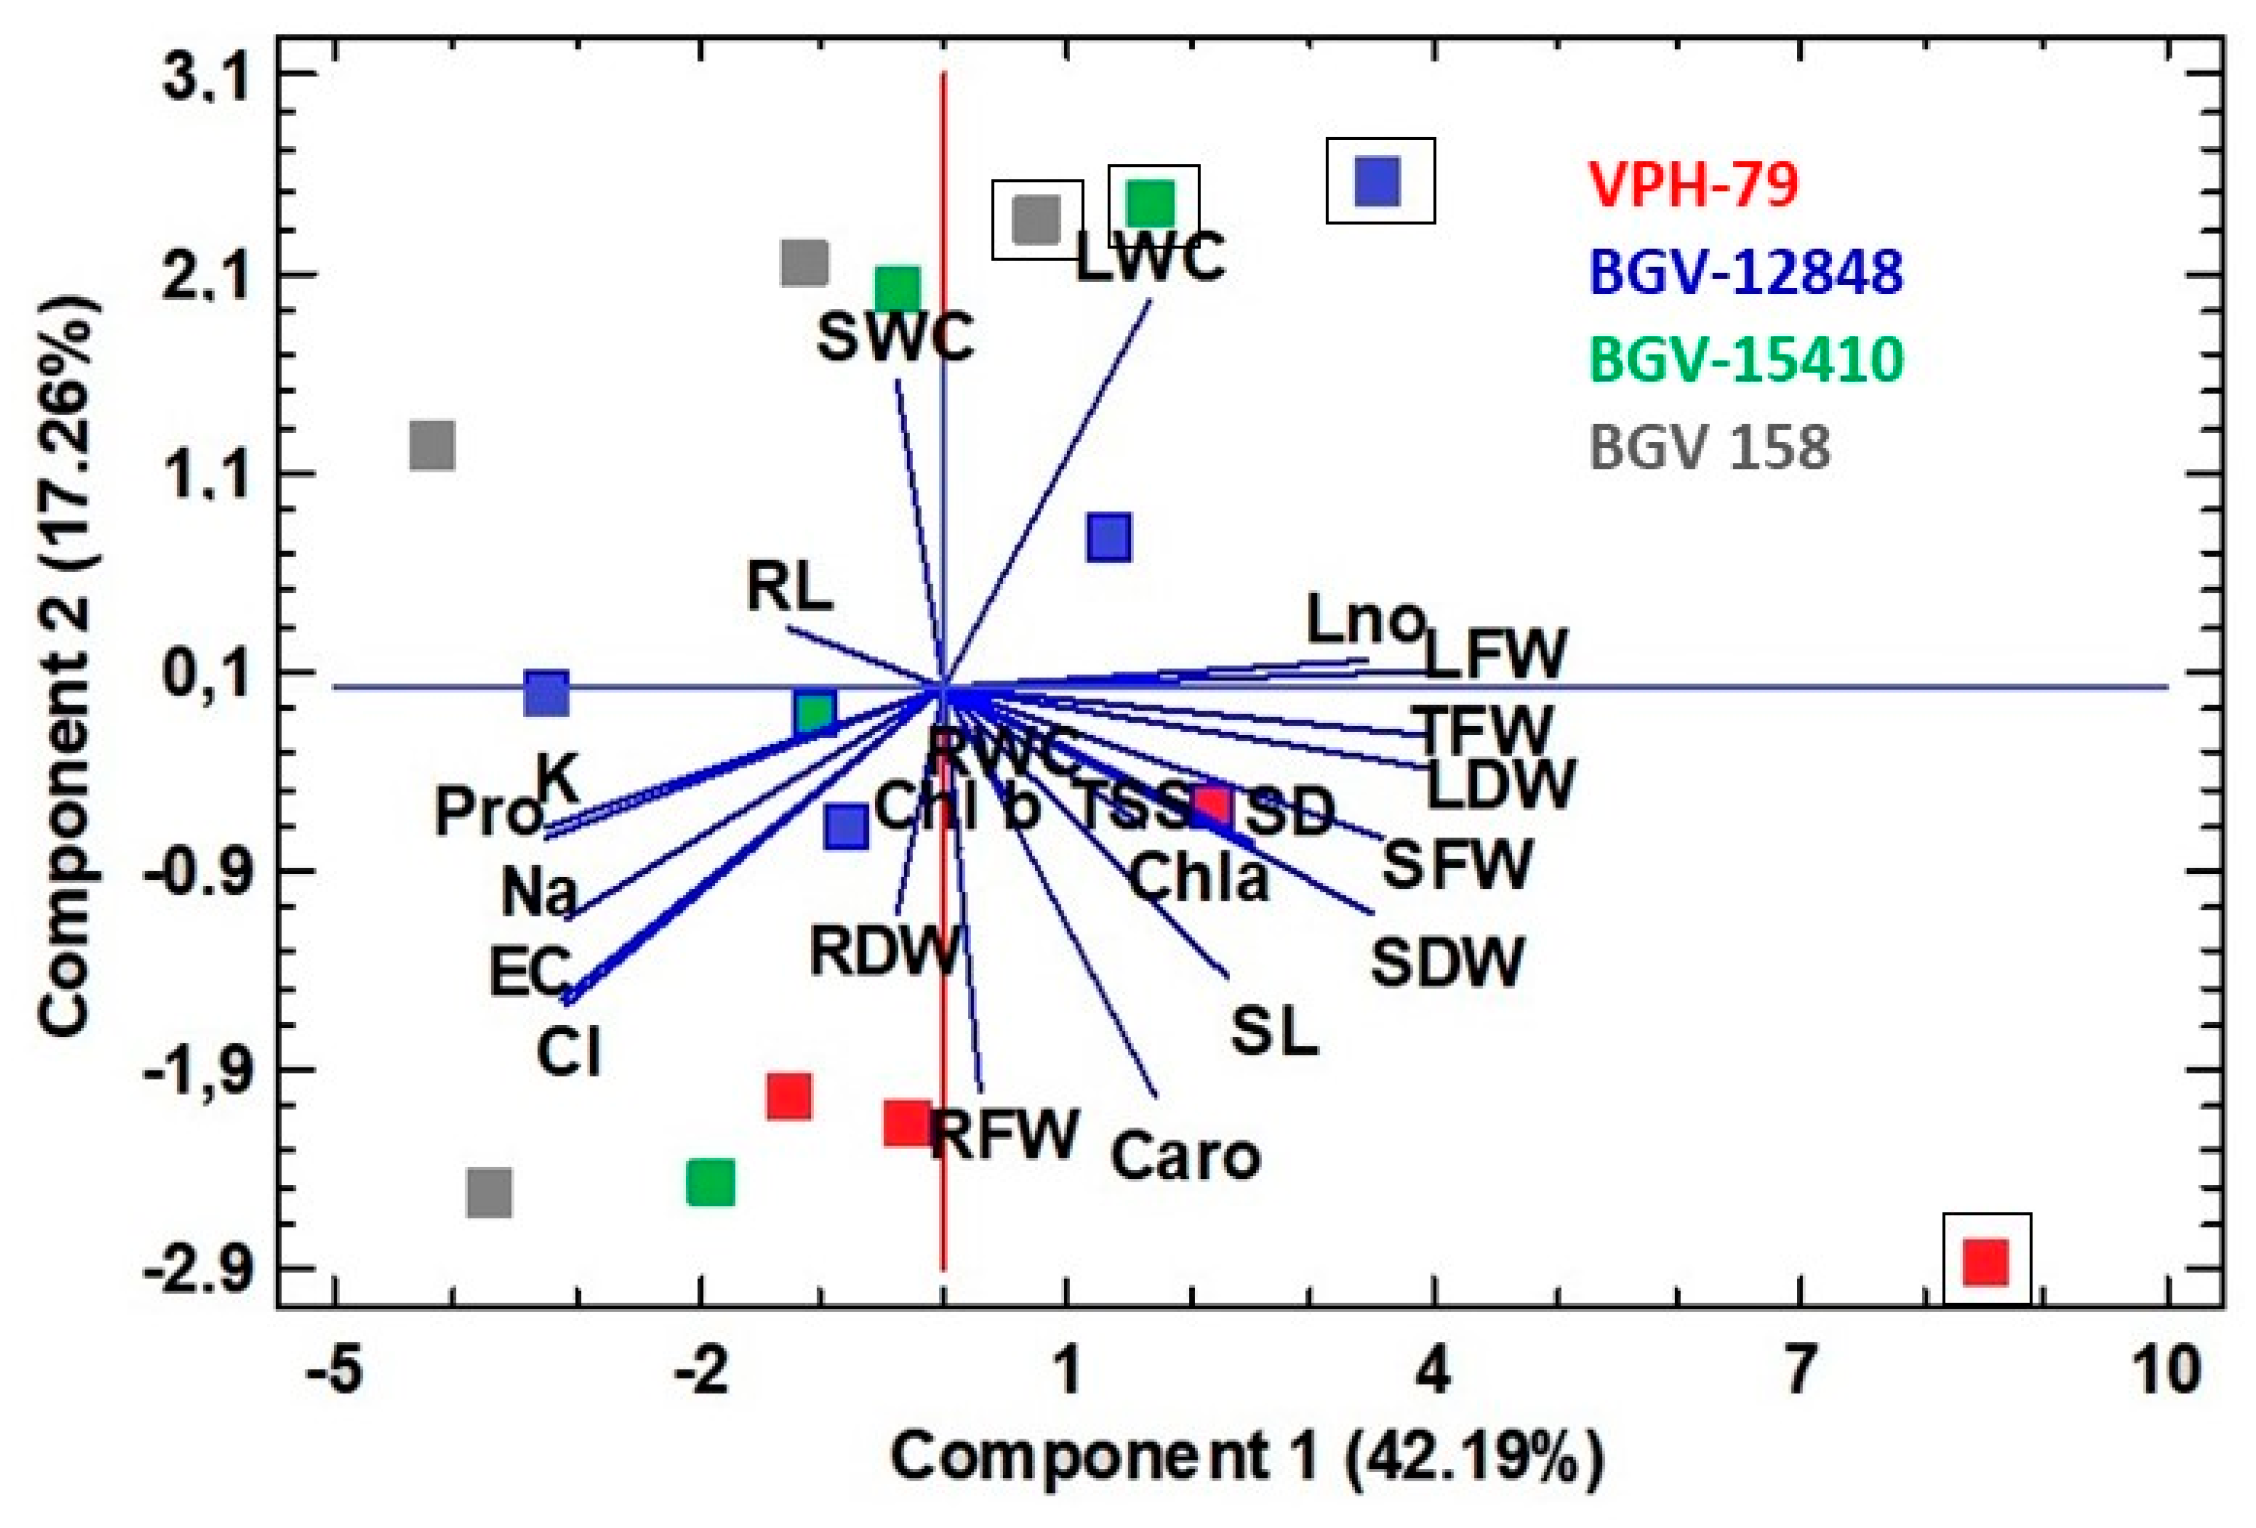
3.5. Principal Component Analysis (PCA)

A PCA was performed including all measured parameters in the four analysed L. lunatus cultivars. The biplot of the two main components, which together explain 60% of the total variability, is shown in Figure 3. The electric conductivity of the substrate (i.e., salinity) is positively and strongly correlated with the concentrations of monovalent ions and proline, and negatively correlated with growth parameters, especially with leaf fresh weight, leaf water content or number of leaves, as well as with total fresh weight. Only in the absence of stress, and not for the salt treatments, a clear separation of the four cultivars can be observed in Figure 3, where symbols corresponding to non-stressed controls are framed. Cultivars BGV-15410 and BGV-1588 appear very close to each other, whereas VPH-79 is very distant from the other three due to its particular morphological features, as this cultivar has a considerably higher number of leaves, the longest stem, and the highest fresh weight.

4. Discussion

The work presented here represents, to our knowledge, the first report on the effects of, and the responses to, salt stress in Phaseolus lunatus. The information gained from these experiments performed on four local Spanish lima bean cultivars may contribute to the development of efficient screening methods to select Phaseolus genotypes relatively tolerant to salinity for the benefit of breeders and farmers, and to help conserve genetic diversity in this crop.
Growth reduction is a general response in all glycophytes facing salt stress. Even among halophytes (‘salt-loving’ plants), only some extremely tolerant dicotyledonous succulent taxa have been reported to improve growth in the presence of low or moderate salt concentrations [25]. A reduced growth rate allows the redirection of plant resources towards the defence against stress factors [26]. Quantitative assessment of growth inhibition under saline conditions is extremely reliable when ranking genotypes according to their relative degree of tolerance [27]. Of the four lima bean genotypes analysed in this study, cultivar BGV-15410 proved to be the most salt tolerant, whereas VPH-79 was the most sensitive to salt stress. The effects of salt stress were more clearly observed in the leaves of the plants, which showed significant reductions in their number and fresh weight. However, aside from BGV-12848, water content percentages in the tested plants did not decrease, indicating the presence of efficient mechanisms to avoid salt-induced dehydration, counteracting the osmotic stress generated by salinity; therefore, growth impairment probably resulted from the ‘ion toxicity’ component of salt stress.
In an attempt to pinpoint the mechanisms likely to be responsible for salt tolerance in this species, the concentrations of several biochemical markers associated with specific response pathways were determined in control and salt-stressed plants. A decrease in chlorophyll concentration has been observed in many legume species under high salinity conditions [28,29]; this is due to both the inhibition of enzymes associated with chlorophyll synthesis and the activation of the chlorophyllase responsible for its degradation [30,31]. However, no significant changes in chlorophylls concentrations were detected in any of the four P. lunatus cultivars. On the other hand, carotenoids had a significant reduction in the most salt-sensitive cv. VPH-79, but did not vary in BGV-12848 and BGV-15410, and increased in BGV-1588. The absence of variation in the chlorophyll content does not implicitly mean salt tolerance, as other factors (not considered here) may result in the significant drop of leaf number and biomass observed in the most sensitive cultivars. Nevertheless, the lack of salt-induced chlorophyll degradation observed in our experiments probably contributes to a higher resistance to salinity of P. lunatus in comparison to other legume species. Salt resistance in several Phaseolus species, and also in different P. vulgaris cultivars, has been associated with Na+ exclusion from the aerial part of the plants, as well as with the maintenance of steady K+ concentrations in the leaves [20,32,33,34,35,36,37]. Potassium is considered to be one of the ‘physiological’ cations essential for plant metabolism, growth, and development [38], whereas high Na+ concentrations have harmful effects on non-halophytic plants, inhibiting many enzymatic activities and cellular processes [39,40]. Moreover, increased concentrations of Na+ are generally associated with a reduction of K+, as both cations compete for the same binding sites, and Na+ reduces K+ uptake into the cell by using its membrane transport proteins. Many salt-tolerant plants can maintain high concentrations of K+ when exposed to salinity, as has been described, for example, in Thellungiella halophila, a salt-tolerant relative of the glycophyte Arabidopsis thaliana [41]. Leaf K+ concentrations were maintained or increased—especially at high external NaCl concentrations—in response to the salt treatments in the lima bean cultivars analysed here. Interestingly, K+ concentrations in non-stressed plants were higher in BGV-15410 and BGV-1588, the two most salt tolerant cultivars. Higher K+ contents in the absence of salt may represent an innate defence mechanism, which could enable these two cultivars to better adjust to saline conditions. Ensuring high concentrations of K+ in leaves of salt-stressed plants can be considered as a basic, general mechanism of tolerance in lima beans. These data are in agreement with the essential role of K+ in the responses of plants to salinity (and to other biotic and abiotic stresses), reiterating the necessity to optimise K+ fertilisation to avoid its deficiency in the soil [42] when cultivating lima beans, as for many other crops.
The biochemical parameter that clearly separated the four studied cultivars was the concentration of proline measured in leaves at the end of the salt treatments. Proline is a common osmolyte in plants, which accumulates not only under conditions of salt stress, but also in response to other abiotic stresses such as drought, extreme temperatures, nutritional deficiencies, presence of heavy metals, air pollution, or high UV radiation and, in some cases, to pathogen infection in plants [43,44,45]. Besides its key role in cellular osmotic adjustment under stress, it is also involved in the stabilisation of macromolecular structures, such as membranes and proteins [45], and in free radical scavenging [46,47]. In our study, BGV-1540 and BGV-1588, the two cultivars that showed the highest salt tolerance (considering the relative degree of growth inhibition), recorded significantly higher leaf concentrations of Pro in comparison to the other two cultivars, both under salt stress and in control conditions.
There is no clear correlation between Pro concentrations and stress tolerance in species of the genus Phaseolus. In common beans, some reports detected higher Pro concentrations in the most tolerant cultivars [48], whereas in others the highest levels were found in the most sensitive cultivars [49]. Al Hassan et al. [37] measured lower Pro concentrations in the most tolerant P. vulgaris cultivars analysed, but total Pro concentrations were well below those determined in P. lunatus in the present work. Proline appears to play an important role in osmotic adjustment in lima beans, and the higher Pro concentrations present in the two most salt-tolerant cultivars most likely are responsible, at least partially, for this tolerance.

5. Conclusion

In conclusion, the data presented here showed that, during vegetative growth, some cultivars of P. lunatus could tolerate three weeks of exposure to salinities as high as 150 mM NaCl, in agreement with previous reports indicating that this crop could be moderately salt-tolerant. However, these studies must be extended to longer saline treatments during a complete life cycle, including the assessment of the effects of salinity on agronomic traits, such as crop yield and quality, before concluding on the salt tolerance of lima bean cultivars. In any case, our results provide information on the basic mechanisms contributing significantly to salinity tolerance in this species, which include the maintenance, or increase, of K+ concentrations and the accumulation of Pro in leaves, in response to the salt stress treatment. These mechanisms appear to be, in part, innate, as relatively higher K+ and Pro levels have been measured in the most tolerant cultivars also in the absence of stress. Therefore, determination of leaf concentrations of Pro and K+ may represent a rapid and simple strategy to screen large numbers of lima bean cultivars in order to pre-select those genotypes with a higher probability to be more salt tolerant.

Author Contributions

Conceptualization: O.V. and M.B.; methodology: S.A., W.M.C.B, J.V.L., and L.Y.; software: M.A.H.; validation: M.B., M.A.H., and O.V.; formal analysis: J.V.L.; investigation: S.A.; resources: O.V.; data curation: S.A.; writing—original draft preparation: M.B.; writing—review and editing: M.A.H. and O.V.; visualization: M.B.; supervision: O.V.; project administration: O.V.; funding acquisition: O.V.

Funding

This research received no external funding.

Conflicts of Interest

The authors declare no conflict of interest.

References

  1. López-Alcocer, J.J.; Lépiz-Ildefonso, R.; González-Eguiarte, D.R.; Rodríguez-Macías, R.; López-Alcocer, E. Morphological variability of wild Phaseolus lunatus from the western region of Mexico. Rev. Fitotec. Mex. 2016, 39, 49–58. [Google Scholar]
  2. Martínez-Castillo, J.; Camacho-Pérez, L.; Villanueva-Viramontes, S.; Andueza-Noh, R.H.; Chacón-Sánchez, M.I. Genetic structure within the Mesoamerican gene pool of wild Phaseolus lunatus (Fabaceae) from Mexico as revealed by microsatellite markers: Implications for conservation and the domestication of the species. Am. J. Bot. 2014, 101, 851–864. [Google Scholar] [CrossRef]
  3. Baudoin, J.P. Phaseolus lunatus L. In Protabase; Brink, M., Belay, G., Eds.; PROTA (Plant Resources of Tropical Africa/Ressources végétales de l’Afrique tropicale): Wageningen, The Netherlands, 2006. [Google Scholar]
  4. De Ron, A.M.; Santalla, M.; Rodiño, A.P.; González, A.M.; Godoy, L.; Mansilla, J.P.; Blair, M. Judia. In Las Variedades Locales en la Mejora Genética de Plantas; Ruiz de Galarreta, J.I., Prohens, J., Tierno, R., Eds.; Servicio Central de Publicaciones del Gobierno Vasco: Donostia-San Sebastián, Spain, 2016; pp. 155–170. ISBN 978-84-457-3395-0. [Google Scholar]
  5. Casado, S.; Gonzáles, J.M.; Varela, F.; Rosselló, J.; Carrascosa, M.; Soriano, J.J.; Camarillo, J.M. Estudio Diagnóstico Sobre la Biodiversidad Cultivada y la Agricultura Ecológica; Sociedad Española de Agricultura Ecológica—Red de Semillas “Resembrando e Intercambiando”: Seville, Spain, 2009. [Google Scholar]
  6. Jackson, M.; Ford-Lloyd, B.; Parry, M. Plant Genetic Resources and Climate Change; CABI Climate Change: Wallingford, UK, 2013; Volume 4. [Google Scholar]
  7. Fita, A.; Rodríguez-Burruezo, A.; Boscaiu, M.; Prohens, J.; Vicente, O. Breeding and domesticating crops adapted to drought and salinity: A new paradigm for increasing food production. Front. Plant Sci. 2015, 6, 978. [Google Scholar] [CrossRef] [PubMed]
  8. IPCC. Intergovernmental panel on climate change. In Proceeding of the 5th Assessment Report, WGII, Climate Change 2014: Impacts, Adaptation, and Vulnerability; Cambridge University Press: Cambridge, UK; Available online: http://www.ipcc.ch/report/ar5/wg2/ (accessed on 15 July 2018).
  9. Owens, S. Salt of the earth. Genetic engineering may help to reclaim agricultural land lost due to salinisation. EMBO Rep. 2001, 2, 877–879. [Google Scholar] [CrossRef] [PubMed]
  10. Grattan, S.; Grieve, C.M. Salinity–mineral nutrient relations in horticultural crops. Sci. Hortic. 1999, 78, 127–157. [Google Scholar] [CrossRef]
  11. Parida, A.K.; Das, A.B. Salt tolerance and salinity effects on plants: A review. Ecotoxicol. Environ. Saf. 2005, 60, 324–349. [Google Scholar] [CrossRef] [PubMed]
  12. Gupta, B.; Huang, B. Mechanism of salinity tolerance in plants: Physiological, biochemical, and molecular characterization. Int. J. Genomics 2014, 2014, 701596. [Google Scholar] [CrossRef]
  13. Munns, R.; Tester, M. Mechanisms of salinity tolerance. Annu. Rev. Plant Biol. 2008, 59, 651–681. [Google Scholar] [CrossRef]
  14. Szabados, L.; Savouré, A. Proline: A multifunctional amino acid. Trends Plant Sci. 2010, 15, 89–97. [Google Scholar] [CrossRef]
  15. Ashraf, M.; Foolad, M.R. Roles of glycine betaine and proline in improving plant abiotic stress resistance. Environ. Exp. Bot. 2007, 59, 206–216. [Google Scholar] [CrossRef]
  16. Volkov, V. Salinity tolerance in plants. Quantitative approach to ion transport starting from halophytes and stepping to genetic and protein engineering for manipulating ion fluxes. Front. Plant Sci. 2015, 6, 873. [Google Scholar] [CrossRef]
  17. Bayuelo-Jiménez, J.S.; Debouck, D.G.; Lynch, J.P. Salinity Tolerance in Phaseolus species during early vegetative growth. Crop Sci. 2002, 42, 2184–2192. [Google Scholar] [CrossRef]
  18. Rodrigues Do Nascimento, M.G.; Ursulino Alves, E.; Mauricio da Silva, M.L.; Marques Rodrigues, C. Lima bean (Phaseolus lunatus L.) seeds exposed to different salt concentrations and temperatures. Rev. Caatinga 2017, 30, 738–747. [Google Scholar] [CrossRef]
  19. Hoagland, D.R.; Arnon, D.I. The Water-Culture Method for Growing Plants without Soil; Circular 347, 2nd ed.; University of California Agricultural Experiment Station: Berkeley, CA, USA, 1950. [Google Scholar]
  20. Gil, R.; Bautista, I.; Boscaiu, M.; Lidón, A.; Wankhade, S.; Sánchez, H.; Lilinares, J.; Vicente, O. Responses of five Mediterranean halophytes to seasonal changes in environmental conditions. AoB Plants 2014, 6, plu049. [Google Scholar] [CrossRef] [PubMed]
  21. Lichtenthaler, H.K.; Wellburn, A.R. Determinations of total carotenoids and chlorophylls a and b of leaf extracts in different solvents. Biochem. Soc. Trans. 1983, 11, 591–592. [Google Scholar] [CrossRef]
  22. Weimberg, R. Solute adjustments in leaves of two species of wheat at two different stages of growth in response to salinity. Physiol. Plant. 1987, 70, 381–388. [Google Scholar] [CrossRef]
  23. Bates, L.S.; Waldren, R.P.; Teare, I.D. Rapid determination of free proline for water stress studies. Plant Soil 1973, 39, 205–207. [Google Scholar] [CrossRef]
  24. Dubois, M.; Gilles, K.A.; Hamilton, J.K.; Reberd, P.A.; Smith, F. Colorimetric method for determination of sugars and related substances. Anal. Chem. 1956, 28, 350–356. [Google Scholar] [CrossRef]
  25. Flowers, T.J.; Colmer, T.D. Salinity tolerance in halophytes. New Phytol. 2008, 179, 945–963. [Google Scholar] [CrossRef]
  26. Zhu, J.K. Plant salt tolerance. Trends Plant Sci. 2001, 6, 66–71. [Google Scholar] [CrossRef]
  27. Al Hassan, M.; Pacurar, A.; López-Gresa, M.P.; Donat-Torres, M.P.; Llinares, J.V.; Boscaiu, M.; Boscaiu, M. Effects of salt stress on three ecologically distinct Plantago species. PLoS ONE 2016, 11, e0160236. [Google Scholar] [CrossRef] [PubMed]
  28. Taffouo, V.D.; Wamba, O.F.; Youmbi, E.; Nono, G.V.; Akoa, A. Growth, yield, water status and ionic distribution response of three bambara groundnut (Vigna subterranea (L.) Verdc.) landraces grown under saline conditions. Int. J. Bot. 2010, 6, 53–58. [Google Scholar] [CrossRef]
  29. Taïbi, K.; Taïbi, F.; Abderrahim, L.A.; Ennajah, A.; Belkhodja, M.; Mulet, J.M. Effect of salt stress on growth, chlorophyll content, lipid peroxidation and antioxidant defense systems in Phaseolus vulgaris L. S. Afr. J. Bot. 2016, 105, 306–312. [Google Scholar] [CrossRef]
  30. Soussi, M.; Ocana, A.; Lluch, C. Effect of salt stress on growth, photosynthesis and nitrogen fixation in chickpea (Cicer arietinum L.). J. Exp. Bot. 1998, 49, 1329–1337. [Google Scholar] [CrossRef]
  31. Santos, C.V. Regulation of chlorophyll biosynthesis and degradation by salt stress in sunflower leaves. Sci. Hort. 2004, 103, 93–99. [Google Scholar] [CrossRef]
  32. Jacobi, B. Function of bean roots and stems in sodium retention. Plant Physiol. 1964, 39, 445–449. [Google Scholar] [CrossRef]
  33. Kramer, D.; Läuchli, A.; Yeo, A.R.; Gullasch, J. Transfer cells in roots of Phaseolus coccineus: Ultrastructure and possible function in exclusion of sodium from the shoot. Ann. Bot. 1977, 41, 1031–1040. [Google Scholar] [CrossRef]
  34. Seemann, J.R.; Critchley, C. Effects of salt stress on the growth, ion content, stomatal behaviour and photosynthetic capacity of a salt-sensitive species, Phaseolus vulgaris L. Planta 1985, 164, 151–162. [Google Scholar] [CrossRef]
  35. Bayuelo-Jiménez, J.S.; Jasso-Plata, N.; Ochoa, I. Growth and physiological responses of Phaseolus species to salinity stress. Int. J. Agron. 2012, 80, 207–222. [Google Scholar] [CrossRef]
  36. Gama, P.B.S.; Inanaga, S.; Tanaka, K.; Nakazawa, R. Physiological response of common bean. (Phaseolus vulgaris L.) seedlings to salinity stress. Afr. J. Biotechnol. 2007, 6, 79–88. [Google Scholar]
  37. Al Hassan, M.; Morosan, M.; López-Gresa, M.P.; Prohens, J.; Vicente, O.; Boscaiu, M. Salinity-induced variation in biochemical markers provides insight into the mechanisms of salt tolerance in common (Phaseolus vulgaris) and runner (P. coccineus) beans. Int. J. Mol. Sci. 2016, 17, 1582. [Google Scholar] [CrossRef] [PubMed]
  38. Gierth, M.; Mäser, P. Potassium transporters in plants- Involvement in K+ acquisition, redistribution and homeostasis. FEBS Lett. 2007, 581, 2348–2356. [Google Scholar] [CrossRef] [PubMed]
  39. Rodriguez-Navarro, A.; Rubio, F. High-affinity potassium and sodium transport systems in plants. J. Exp. Bot. 2006, 57, 1149–1160. [Google Scholar] [CrossRef] [PubMed] [Green Version]
  40. Adams, E.; Shin, R. Transport, signaling, and homeostasis of potassium and sodium in plants. J. Integr. Plant Biol. 2014, 56, 231–249. [Google Scholar] [CrossRef] [PubMed] [Green Version]
  41. Volkov, V.; Wang, B.; Dominy, P.J.; Fricke, W.; Amtmann, A. Thellungiella halophila, a salt-tolerant relative of Arabidopsis thaliana, possesses effective mechanisms to discriminate between potassium and sodium. Plant Cell Environ. 2003, 27, 1–14. [Google Scholar] [CrossRef]
  42. Wang, M.; Zheng, Q.; Shen, Q.; Guo, S. The critical role of potassium in plant stress response. Int. J. Mol. Sci. 2013, 14, 7370–7390. [Google Scholar] [CrossRef]
  43. Hare, P.D.; Cress, W.A. Metabolic implications of stress induced proline accumulation in plants. Plant Growth Regul. 1997, 21, 79–102. [Google Scholar] [CrossRef]
  44. Saradhi, P.; Alia, P.; Arora, S.; Prasad, K.V. Proline accumulates in plants exposed to UV radiation and protects them against UV induced peroxidation. Biochem. Biophys. Res. Commun. 1995, 209, 1–5. [Google Scholar] [CrossRef]
  45. Siripornadulsil, S.; Train, S.; Verma, D.P.S.; Sayre, R.T. Molecular mechanisms of proline mediated tolerance to toxic heavy metals in transgenic microalgae. Plant Cell 2002, 14, 2837–2847. [Google Scholar] [CrossRef]
  46. Verbruggen, N.; Hermans, C. Proline accumulation in plants: A review. Amino Acids 2008, 35, 753–759. [Google Scholar] [CrossRef]
  47. Smirnoff, N.; Cumbes, Q.J. Hydroxyl radical scavenging activity of compatible solutes. Phytochemistry 1989, 28, 1057–1060. [Google Scholar] [CrossRef]
  48. Cárdenas-Avila, M.L.; Verde-Star, J.; Maiti, R.K.; Foroughbakhch-P, R.; Gámez-González, H.; Martínez-Lozano, S.; Núñez-González, M.A.; García Díaz, G.; Hernández-Piñero, J.L.; Morales-Vallarta, M.R. Variability in accumulation of free proline on in vitro calli of four bean (Phaseolus vulgaris L.) cultivars exposed to salinity and induced moisture stress. Phyton 2006, 75, 103–108. [Google Scholar]
  49. Jiménez-Bremont, J.F.; Becerra-Flora, A.; Hernández-Lucero, E.; Rodríguez-Kessler, M.; Acosta-Gallegos, J.A.; Ramírez Pimentel, J.G. Proline accumulation in two bean cultivars under salt stress and the effect of polyamines and ornithine. Biol. Plant. 2006, 50, 763–766. [Google Scholar] [CrossRef]
Figure 1. Leaf concentrations (µmol g−1 DW) of monovalent ions, Na+ (A), Cl- (B), K+ (C), and K+/Na+ ratios (D), in plants of the four Phaseolus lunatus cultivars, grown for three weeks in the presence of the indicated NaCl concentrations. Means followed by SE (n = 5). Different letters indicate significant differences within each cultivar according to Tukey’s test (α = 0.05).
Agriculture 08 00201 g001
Figure 2. Leaf osmolyte concentrations in plants of the four Phaseolus lunatus cultivars, grown for three weeks in the presence of the indicated NaCl concentration. Proline (Pro) (A) and total soluble sugar (TSS) concentrations (B). Means followed by SE (n = 5). Different letters indicate significant differences within each cultivar according to Tukey’s test (α = 0.05).
Agriculture 08 00201 g002
Figure 3. Principal component analysis (PCA). Changes in growth parameters, photosynthetic pigments monovalent ions, and osmolytes concentrations in plants growth under salt stress conditions for three weeks, with respect to the corresponding control, non-stressed plants of the four local cultivars of Phaseolus lunatus: VPH-79 (red), BGV-12848 (blue), BGV-15410 (green), and BGV 158 (grey). Squares surrounded by a box correspond to control treatments. The percentages of the total variability explained by the first two components are shown (in parentheses) on the X and Y axes, respectively. Abbreviations: EC, substrate electric conductivity; RL, root length; RFW, root fresh weight, RDW, root dry weight; RWC, root water content; SL, stem length; SD, stem diameter; SFW, stem fresh weight; SDW, stem dry weight; SWC, stem water content; Lno, leaf numbers; LFW, leaf fresh weight; LDW, leaf dry weight; LWC, leaf water content; TFW, total fresh weight; Chl a, chlorophyll a; Chla b, chlorophyll b; Caro, carotenoids; Na, sodium; K, potassium; Cl, chlorine; Pro, proline; TSS, total soluble sugars.
Agriculture 08 00201 g003
Table 1. Effect of salinity on electric conductivity (EC) in the pots and on plant growth parameters for the four Phaseolus lunatus cultivars. FW, fresh weight; WC, water content. Means followed by SE (n = 5). Different letters indicate significant differences within each cultivar according to Tukey’s test (α = 0.05). p values according to one-way ANOVA.
TraitTreatment (mM NaCl)VPH-79BGV-12848BGV-15410BGV 1588
Soil EC1:500.40 ± 0.03 a0.33 ± 0.05 a0.28 ± 0.02 a0.47 ± 0.14 a
500.81 ± 0.12 a1.02 ± 0.11 ab1.02 ± 0.29 b1.09 ± 0.21 ab
1001.57 ± 0.11 b1.39 ± 0.15 b1.68 ± 0.07 c1.31 ± 0.19 b
1501.82 ± 0.15 b1.81 ± 0.44 b1.81 ± 0.05 c1.77 ± 0.07 b
p0.0000.0000.0000.000
Root length (cm)027.20 ± 3.33 a26.60 ± 1.80 a39.75 ± 3.60 45.20 ± 3.82
5031.50 ± 1.37 a32.50 ± 1.5 b33.00 ± 2.58 35.67 ± 2.40
10040.00 ± 1.15 b25.20 ± 1.95 a37.50 ± 4.33 34.00 ± 4.97
15027.00 ± 3.05 a30.00 ± 1.00 b39.00 ± 3.9041.00 ± 6.54
p0.0000.0260.4970.297
Root FW (g)04.65 ± 0.83 3.02 ± 0.59 2.78 ± 0.18 a2.48 ± 0.17 ab
503.54 ± 0.41 2.81 ± 0.41 2.59 ± 0.36 a1.99 ± 0.47 a
1003.67 ± 0.35 2.73 ± 0.41 4.17 ± 0.59 ab3.37 ± 0.80 ab
1503.81 ± 1.14 2.52 ± 0.37 6.24 ± 1.07 b4.03 ± 0.56 b
p0.2400.8820.0010.046
Root WC (%)088.60 ± 0.46 91.18 ± 1.02 83.71 ± 1.25 84.08 ± 6.67
5089.09 ± 0.84 98.87 ± 0.51 86.26 ± 2.07 84.03 ± 0.98
10087.64 ± 0.24 91.01 ± 0.70 81.83 ± 4.61 87.74 ± 0.75
15088.23 ± 5.50 89.17 ± 0.52 85.33 ± 0.73 87.14 ± 0.59
p0.4450.4620.8680.109
Stem length (cm)0188.56 ± 0.85 115.00 ± 12.7 131.40 ± 11.1 162.20 ± 11.5 b
50162.67 ± 15.9 150.25 ± 8.51 148.90 ± 25.9 121.20 ± 11.5 ab
100172.83 ± 11.7 147.20 ± 9.98 129.50 ± 6.85 88.20 ± 5.04 a
150155.33 ± 21.4 115.33 ± 11.6 159.00 ± 7.37 132.75 ± 21.5 ab
p0.0730.0680.6360.002
Stem diameter (cm)05.88 ± 0.16 b6.01 ± 0.09 5.00 ± 0.36 4.49 ± 0.33 ab
504.75 ± 0.41 a5.09 ± 0.36 4.49 ± 0.21 5.03 ± 0.24 b
1004.91 ± 0.14 ab5.36 ± 0.34 5.16 ± 0.25 3.99 ± 0.11 a
1505.34 ± 0.29 ab4.13 ± 0.60 4.49 ± 0.21 4.92 ± 0.20 b
p0.0370.0790.3060.014
Stem FW (g)030.79 ± 2.73 b14.99 ± 5.12 17.54 ± 2.08 16.78 ± 2.85 b
5016.77 ± 4.12 a12.81 ± 2.78 10.62 ± 1.87 11.79 ± 1.17 ab
10013.61 ± 1.24 a11.65 ± 1.48 11.20 ± 2.35 7.77 ± 1.12 a
15012.78 ± 1.33 a6.96 ± 0.93 13.02 ± 1.67 13.89 ± 0.79 ab
p0.0040.2570.0980.011
Stem WC (%)081.22 ± 0.88 a85.53 ± 2.12 a84.29 ± 2.57 a83.25 ± 10.55 a
5077.90 ± 0.76 a80.93 ± 2.03 a83.07 ± 2.45 a81.50 ± 1.36 a
10079.00 ± 1.47 a81.01 ± 0.55 a83.07 ± 1.25 a84.67 ± 1.03 a
15078.28 ± 1.51 a81.90 ± 0.55 a81.76 ± 0.57 a83.37 ± 0.49 a
p0.1620.1070.8970.153
Leaf number044.80 ± 2.80 b19.20 ± 4.02 33.20 ± 4.04 b27.20 ± 3.70 b
5022.83 ± 5.61 a16.25 ± 4.44 18.60 ± 3.64 ab19.00 ± 1.89 ab
10017.83 ± 0.98 a15.20 ± 1.15 24.67 ± 3.65 ab10.60 ± 1.16 a
15012.67 ± 1.45 a9.33 ± 1.52 13.75 ± 3.38 a10.80 ± 1.73 a
p0.0010.1150.0200.000
Leaf FW (g)061.18 ± 5.53 b42.49 ± 8.25 b25.05 ± 3.64 b20.26 ± 3.47 b
5026.80 ± 9.83 a25.05 ± 3.64 a20.95 ± 3.91 b13.05 ± 2.68 ab
10012.12 ± 2.44 a18.85 ± 2.51 a19.23 ± 4.20 b5.08 ± 1.90 a
1508.89 ± 1.40 a7.04 ± 1.29 a9.82 ± 4.16 a5.08 ± 1.90 a
p0.0000.0150.0200.000
Leaf WC (%)085.27 ± 0.18 a89.88 ± 2.33 b86.53 ± 0.91 84.78 ± 0.60
5082.63 ± 2.29 a85.14 ± 0.65 ab87.98 ± 2.12 84.78 ± 0.60
10081.64 ± 2.26 a84.66 ± 0.28 ab79.24 ± 10.64 85.09 ± 0.41
15078.66 ± 3.57 a83.07 ± 1.52 a80.99 ± 4.18 78.89 ± 6.49
p0.0000.0350.6100.104
Total FW Reduction (%)00 a0 a0 a0 a
5051.25 b32.77 b38.21 b32.09 b
10069.57 bc45.08 b24.67 b55.73 b
15073.63 c59.39 b36.68 b41.78 b
p0.0000.0000.0430.000
Table 2. Significance of variation (p values) according to two-way ANOVA testing the effect of treatment (Variable 1, VAR 1) and genotype (Variable 2, VAR 2) and their interactions (VAR 1 × VAR 2) for all morphological and biochemical traits analysed. Chl a, chlorophyll a; Chl b, chlorophyll b; Caro, total carotenoids; Pro, proline; TSS, total soluble sugars.
ParameterTreatment (VAR 1)Species (VAR 2)VAR1 × VAR2
EC0.0000.9320.785
Root length0.8710.0000.004
Root FW0.0020.0010.012
Root WC0.4930.5570.309
Stem diameter0.0820.0570.027
Stem length0.4040.0000.017
Stem FW0.0000.0000.033
Stem WC0.0630.0000.763
Leaves no.0.0000.0000.763
Leaf FW0.0000.0000.000
Leaf WC0.0440.2320.632
Total FW0.0000.0000.000
Chl a0.6470.0000.715
Chl b0.7850.9890.008
Caro0.0140.0000.000
Pro0.0000.0000.002
Na+0.0000.0000.010
K+0.0000.0020.010
Cl0.0000.0030.606
K+/Na+0.0000.0000.009
TSS0.5390.0000.041
Table 3. Effect of salinity on photosynthetic pigments (Chl a, chlorophyll a; Chl b, chlorophyll b; Caro, carotenoids) concentrations in plants of the four Phaseolus lunatus cultivars. Means followed by SE (n = 5). Different letters indicate significant differences within each cultivar according to Tukey’s test (α = 0.05). p values according to one-way ANOVA.
Pigment (mg g−1 DW)Treatment (mM NaCl)VPH-79BGV-12848BGV-15410BGV 1588
Chl a06.33 ± 0.07 6.24 ± 0.77 5.14 ± 0.44 4.17 ± 0.66
505.60 ± 0.44 5.71 ± 0.85 6.05 ± 0.37 3.81 ± 0.27
1005.41 ± 0.97 6.50 ± 0.98 5.84 ± 1.02 3.03 ± 0.85
1505.25 ± 0.28 6.02 ± 0.65 5.25 ± 0.28 3.89 ± 0.88
p0.5600.6690.9170.315
Chl b03.17 ± 0.49 2.37 ± 0.26 2.80 ± 0.22 2.22 ± 0.07
502.35 ± 0.26 2.14 ± 0.39 2.43 ± 0.41 2.38 ± 0.11
1001.89 ± 0.39 2.32 ± 0.18 2.44 ± 0.78 2.77 ± 0.80
1501.58 ± 0.13 2.13 ± 0.14 1.93 ± 0.69 2.02 ± 0.38
p0.0540.9850.5210.77
Caro02.69 ± 1.04 b0.67 ± 0.09 0.49 ± 0.04 0.54 ± 0.15 a
500.97 ± 0.25 a0.91 ± 0.16 0.73 ± 0.14 0.63 ± 0.21 ab
1001.26 ± 0.13 a0.90 ± 0.14 0.62 ± 0.22 0.84 ± 0.17 ab
1501.48 ± 0.16 ab1.29 ± 0.14 1.08 ± 0.24 1.32 ± 0.11 b
p0.0450.2630.0870.030

