Article

The Efficiencies, Environmental Impacts and Economics of Energy Consumption for Groundwater-Based Irrigation in Oklahoma

1
Department of Biosystems and Agricultural Engineering, Oklahoma State University, Stillwater, OK 74078, USA
2
Department of Plant and Soil Sciences, Oklahoma State University, Stillwater, OK 74078, USA
*
Author to whom correspondence should be addressed.
Agriculture 2019, 9(2), 27; https://doi.org/10.3390/agriculture9020027
Submission received: 22 December 2018 / Revised: 21 January 2019 / Accepted: 27 January 2019 / Published: 1 February 2019
(This article belongs to the Special Issue Agricultural Irrigation)

Abstract

:
Irrigation pumping is a major expense of agricultural operations, especially in arid/semi-arid areas that extract large amounts of water from deep groundwater resources. Studying and improving pumping efficiencies can have direct impacts on farm net profits and on the amount of greenhouse gases (GHG) emitted from pumping plants. In this study, the overall pumping efficiency (OPE), the GHG emissions, and the costs of irrigation pumping were investigated for electric pumps extracting from the Rush Springs (RS) aquifer in central Oklahoma and the natural gas-powered pumps tapping the Ogallala (OG) aquifer in the Oklahoma Panhandle. The results showed that all electric plants and the majority of natural gas plants operated at OPE levels below achievable standard levels. The total emission from the plants in the OG region was 49% larger than that from plants in the RS region. However, the emission per unit irrigated area and unit total dynamic head of pumping was 4% smaller for the natural gas plants in the OG area. A long-term analysis conducted over the 2001–2017 period revealed that 34% and 19% reductions in energy requirements and 52% and 20% decreases in GHG emissions can be achieved if the OPE were improved to achievable standards for plants in the RS and OG regions, respectively.

Graphical Abstract

1. Introduction

Irrigated agriculture around the world relies heavily on energy resources to extract freshwater and to convey it to application sites. This is especially the case in arid/semi-arid regions, where large amounts of irrigation water are required to sustain crop production. As a result, the availability and cost of energy are among major factors influencing the economic viability of irrigated agriculture in these regions. In addition, energy consumption for irrigation has major environmental consequences, mainly due to the emission of greenhouse gases [1,2]. Wang et al. [3] have reported that pumping groundwater for irrigation accounts for 3% of total emissions from agriculture in China. A similar study in Iran has found that groundwater pumping is responsible for 3.6% of total carbon emissions in the country [4]. In India, groundwater pumping is estimated to be the source of nearly 6% of India’s total emissions [5]. In the U.S., carbon emissions due to pumping irrigation water have been reported to be about three million metric tons per year, with electric pumps responsible for 46% of the total emission, followed by diesel (32%) and natural gas (19%) [6].
Energy consumption and its associated costs and greenhouse gas emissions can be reduced by improving pumping efficiency [7]. In a study in central Tunisia, improving pumping efficiency was found to result in 33% cost reduction on average [8]. An average cost saving of 17% following efficiency improvement was also reported in [9] for an irrigated area in southeastern Spain. Pump efficiency is primarily dependent on operating conditions such as total dynamic head (TDH) and the condition of the pump. Any deviation from optimum conditions can lead to reduced efficiency and increased costs and emissions.
One deviation from optimum conditions is the change in TDH, caused by declines in groundwater levels. This is especially the case in irrigated areas that experience large declines due to increasing groundwater extraction. In the North China Plain, Qui et al. [10] estimated that groundwater declines from 1996 to 2013 have led to a 22% increase in energy consumption and a 42% increase in greenhouse gas emissions. Increases in groundwater depth will not only increase TDH and consequently energy use, but will also result in a gradual deviation from design parameters used in selecting the most efficient pump and hence a reduction in system efficiency.
Irrigated agriculture in Oklahoma has been facing similar energy-related challenges. In 2013, Oklahoma producers spent over USD 22 million to power more than 5,300 pumps [11]. Electricity was the main source of pumping energy, supplying water to 46% of all irrigated areas in the state. This was closely followed by natural gas, which powers pumps to irrigate 42% of all irrigated lands [11]. The remainder of irrigation pumps typically use diesel or propane units. In addition, Oklahoma producers who rely on groundwater resources have been experiencing a decline in water availability, reflected in a reduction in average well flow rates from 0.032 m3 s−1 in 2008 to 0.026 m3 s−1 in 2013 [11]. The groundwater decline has been significant in the Panhandle region due to increased usage, drought periods, and negligible recharge rates. Identifying energy consumption efficiencies and improved practices can have a considerable impact on the profitability of agricultural production in Oklahoma.
The goal of this study was to identify the overall efficiency and environmental impact of irrigation pumping in two agricultural regions of central and western Oklahoma that rely on two aquifers with significantly different depths to groundwater. The more specific objectives included: (i) to estimate the overall pumping efficiency for several pumping plants in each region; (ii) to conduct a life cycle assessment and calculate greenhouse gas emissions under existing and achievable efficiencies; and (iii) to investigate the impacts of changing groundwater depths and energy prices on the economics and emissions of irrigation pumping plants over a 17-year period. To the best of our knowledge, only a few previous studies have identified the overall efficiency of agricultural irrigation pumping. For example, Luc [8] has determined the efficiency of 18 electric pumps in central Tunisia. The lack of data in this field is most probably due to large human, technical, and financial resources required to carry out field evaluations of pumping plants. As a result, many previous life cycle assessment studies have assumed or approximated pumping efficiencies in their analysis as opposed to using measured values [2,3,4,7,10]. This study combines efficiencies measured through field audits with greenhouse gas analysis and uses the results to explore long-term effects of changing groundwater levels on energy costs and emissions. The results will give Oklahoma agricultural producers, water managers, and other decision makers an insight into current economics and the environmental footprint of irrigation pumping in the study areas, as well as potentials for improvement. Moreover, the results will be transferable to areas with similar agro-climatological and groundwater resources conditions.

2. Materials and Methods
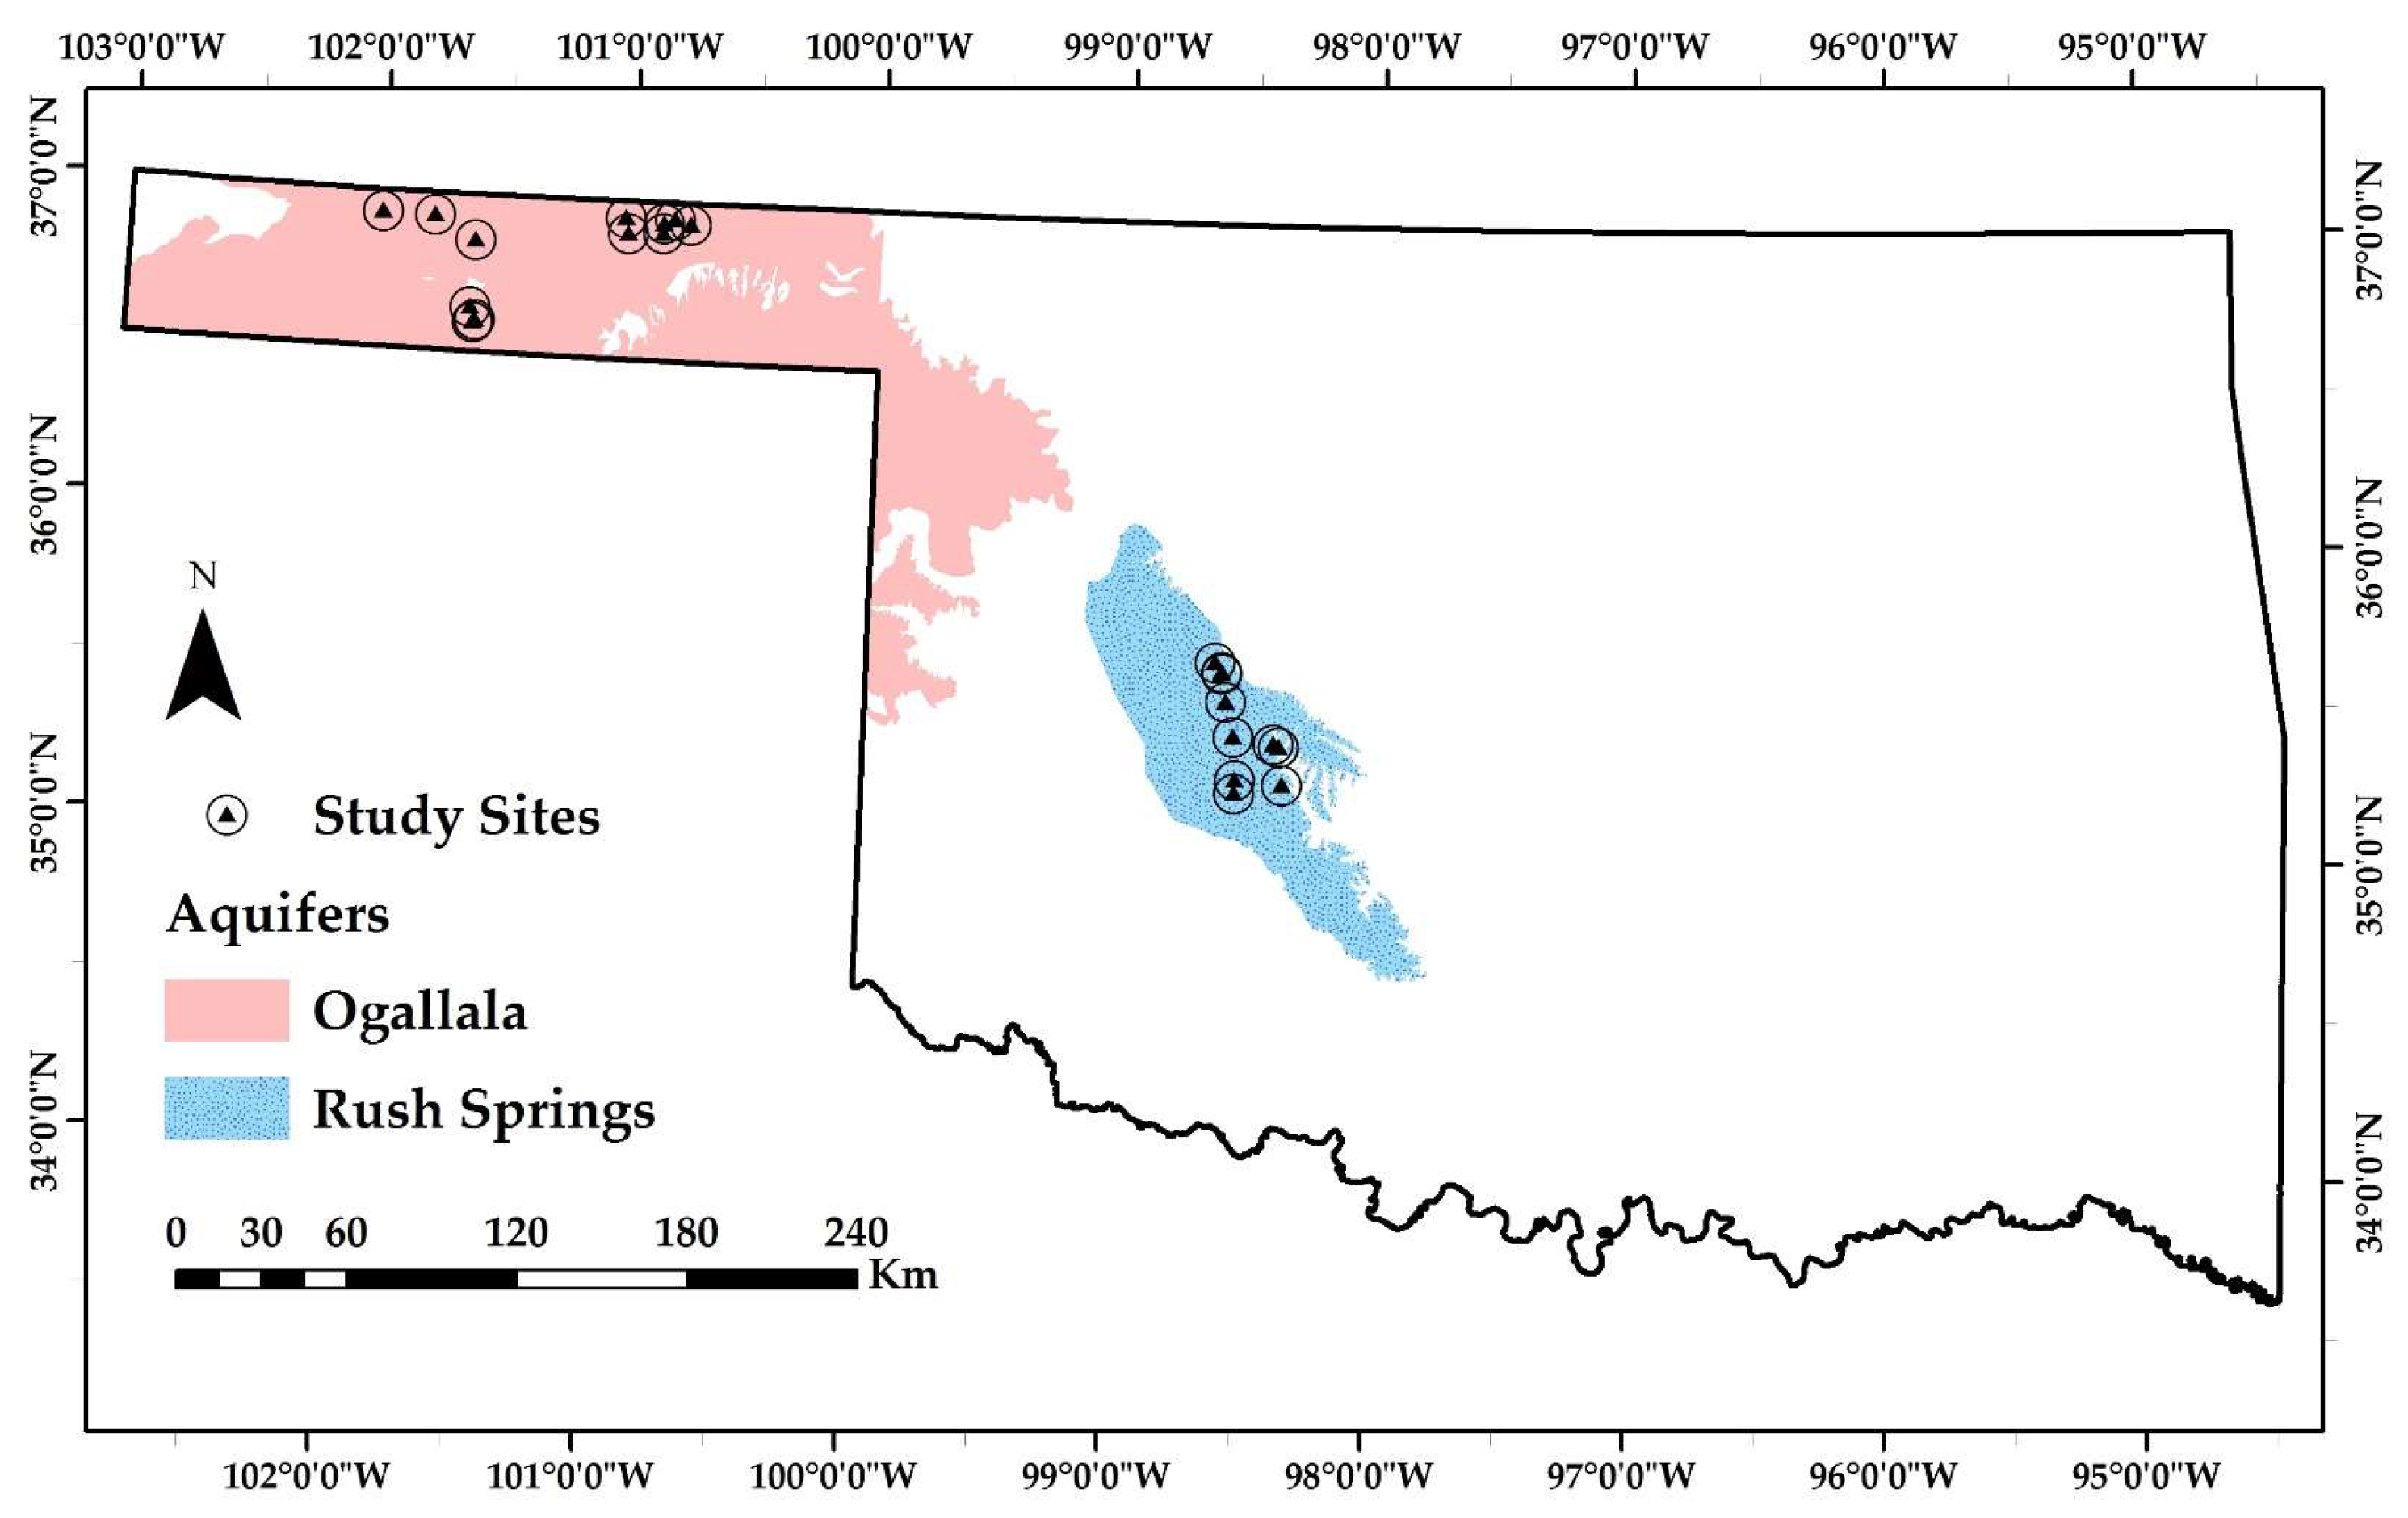
2.1. Study Area

A total of 24 irrigation pumping plants in central and Panhandle regions of Oklahoma were tested between 2015 and 2018 with the aim of determining their energy consumption efficiencies, emissions, and expenses. Of the pumping plants evaluated, fourteen were located within the Ogallala (OG) aquifer and ten within the Rush Springs (RS) aquifer (Figure 1). The OG sites were all natural gas internal combustion powered and the RS sites were electricity-powered pumping plants. The Ogallala is one of the most important aquifers in Oklahoma, supplying more than 98% of total water demand in the Panhandle regions. It is classified as an unconfined bedrock aquifer composed of semi-consolidated clay, silt, sand, and gravel layers [12]. The maximum thickness of the aquifer is 213 m and the groundwater flow direction is toward the east/southeast, similar to the land surface elevation gradient. OG water quality is considered good, with an average pH of 7.3 and specific conductance of 0.64 decisiemens per metre (dS m−1) [12]. RS is another important bedrock aquifer in the state and provides irrigation water to numerous fields in central Oklahoma. This aquifer is composed of Rush Springs sandstone on top of the Marlow formation. The maximum thickness of RS is 101 m, with groundwater moving in a south/southeast direction [12]. Similar to OG, the water quality of RS is good, with an average pH of 7.2 and specific conductance of 1.08 dS m−1 [12]. The depth to groundwater, however, is much larger in the OG (with a 2018 average of 57.1 m), and it has experienced a steady decline over the past several decades, while RS is shallower (with a 2018 average of 18.2 m) and is more sensitive to inter-annual variations in precipitation [11,12].

2.2. Energy Audits

The energy audits included determining several basic irrigation well and pump parameters such as groundwater depth (GWD), water pressure, and discharge rate. These parameters were then used to estimate the overall pumping efficiency (OPE), a widely used metric for assessing the efficiency of irrigation pumping plants. The OPE is the ratio of the output work the pump exerts on the water at the pump outlet, known as water horsepower (WHP), to the required energy input or energy horsepower (EHP) of the driving unit required to pump the measured water output [13], and is calculated as
O P E = W a t e r   o u t p u t   ( W H P ) E n e r g y   i n p u t   ( E H P ) × 100
The WHP (kW) can be determined as
W H P = Q   ×   T D H F
where Q is the discharge rate (m3 s−1), TDH is the total dynamic head (m) and F is a conversion factor equal to 0.102 (m4 s−1 kW−1). In this study, Q was measured using an ultrasonic flow meter (Portaflow-C, Fuji Electric Co., Japan) on the discharge pipe from the pump. The accuracy of the ultrasonic flow meter was tested previously against a calibrated flow device and found to be acceptable [14].
The TDH is the total equivalent pressure that must be applied to the water column being pumped while also taking into account the losses due to friction [13]. It may be expressed as
TDH = pumping lift + pressure head
where pumping lift is the vertical distance between the pumping water level and center of the pump outlet (m) and pressure head is the pressure required at the pump outlet (m). The pumping lift was measured by lowering a water level meter (model 102, Solinst Canada Ltd., Canada) probe through an access hole in the pump base-plate while a pressure gauge close to the pump outlet was used to measure the pressure head [15].
The estimation procedure for energy horsepower (EHP) depends on the type of energy used and differs among electric motors in the Rush Springs aquifer region and natural gas engine driven pumps in the Ogallala aquifer region.

2.2.1. Electric Motors

In Oklahoma, electric motor driven irrigation pumps tend to be used where the ground water depth is less than 80 m and three-phase power is available. These pumps usually require less maintenance and operational activity than internal combustion engines. For electric motors, the energy input (kW) is the electrical power supplied to the motor and can be calculated using the following equation for a three-phase motor [16]:
E H P = V   ×   I   ×   P F   ×   1.732 1000
where V is voltage (V), I is current (A), PF is the power factor, and 1.732 is a conversion factor. In this study V, I, and PF were measured using a three-phase electric meter. The current of each of the three legs was first measured individually and then averaged together. The voltage was measured across all three legs and also averaged.

2.2.2. Natural Gas Engines

The natural gas consumption of the internal combustion engines was measured by a rotary gas meter (Dresser Roots® Series B, General Electric, Boston, MA, USA). The gas meter was installed by first turning off the gas supply to the engine at the gas meter. Next, the main fuel line running to the intake manifold was disconnected and the rotary meter was installed in-line with this gas line, which was then reconnected to the engine. The engine was allowed to run until in steady state operating temperature. The irrigation water pump was also allowed to bring the entire irrigation system up to operating pressure (with water delivery from all nozzles). Then the engine and pump system were allowed to run for 30–45 min, at which time average fuel consumption readings and correction factors were recorded. Removing the rotary meter was the reverse of the installation procedure. The meter auto-corrects for gas pressure, density, and temperature. The display gives readings of cubic feet per minute, which were converted to mechanical power and used as the input fuel power.
The estimated OPE of the audited pumping plants was compared against the widely used Nebraska Pumping Plant Performance Criteria (NPPPC). According to the NPPPC, the OPE of accurately designed and appropriately maintained electricity- and natural gas-driven pumping plants should be 66% and 17%, respectively [16]. With the electric pumping plants, their OPE was also compared against thresholds proposed by Hanson [17] for different required corrective actions.

2.3. Life Cycle Assessment

The greenhouse gas (GHG) emissions for the pumping sites were calculated using the GREET® (GREET.NET version 2017, Argonne National Laboratory, Argonne, IL, USA) and the U.S. Environmental Protection Agency (EPA) Greenhouse Gas Inventory Guidance [18]. The GREET Life Cycle Assessment (LCA) tool is an online resource that is well established and supported in the LCA focus area. While the GREET model is basically a transportation LCA tool used to model vehicle emissions due to different energy sources (e.g., biofuels, natural gas, electricity, etc.), it can also provide a good approximation for stationary power systems. The GREET model examines fuels and energy production from raw materials (e.g., coal or crude oil), extraction and processing (the “well”), to storage (the “pump”). This technique in GREET is called “well to pump” (WTP).
In the case of electricity where the end-use is essentially emission-free for both stationary and vehicle uses, the WTP model can be used alone for stationary irrigation pumping plants without the need for any additional modification. The “U.S. Central and Southern Pains” Utility Mix category was chosen to represent the electrical grid generator composition for Oklahoma. In all cases, the emissions were calculated for 1000 h of irrigation system operation. In the case of natural gas, there are on-site emissions due to the engine combustion process. Therefore, the GREET WTP analysis (extraction, transmission, and distribution) was added to an established EPA stationary engine emissions calculation technique [18] to give an approximation of the total GHG emissions for stationary engines from raw material extraction to end-use combustion. In short, the electricity production generates its GHGs at different points from the natural gas engines. Both generate GHGs in preparing the fuel/energy, but the natural gas engines contribute large percentages of GHGs at the end-use (combustion) phase. Of course, current electrical production also generates combustion GHGs at the generation phase depending on the generator technology mix. GREET captures this in the electrical WTP technique.
The EPA end-use GHG estimation for the natural gas methodology employed was based on using the natural gas volume consumed (measured) during the audit field tests with a gas flow meter. The methodology is may be given as
Em = Fuel × HHV × EF
where Em is the mass of CO2, CH4, or N2O emitted, Fuel is the mass or volume of fuel combusted, HHV is the fuel heat content (higher heating value) in units of energy per mass of fuel, and EF is the emission factor of CO2, CH4, or N2O per energy unit. The HHV and EF values reported in [18] for natural gas combustion were used in this study. For the total GHG emissions from combustion, CO2 equivalence factors of 25 for CH4 and 298 for N2O were applied. As with electric motor pumps, the emissions for natural gas pumping engines were reported for 1000 h of irrigation system operation. Readers should be aware that the LCA approach implemented in this study has uncertainties beyond those caused by errors in the input data, mainly due to assumptions and simplifications adopted in the procedure.

2.4. Long-Term Trends

Irrigated agriculture in the study area relies heavily on groundwater. Hence, it is of great importance to investigate the impacts of long-term fluctuations in groundwater levels on the efficiencies, emissions, and economics of irrigation pumping. The first step to conducting this analysis was to estimate variations in energy requirement in response to changes in groundwater depth for each of the studied aquifers (Ogallala and Rush Springs). Several previous studies have investigated energy required for pumping groundwater as a function of depth to groundwater [4,7,19,20]. These studies have used the following equation or a variation of it; it has been selected in the present study and applied to estimate annual energy requirements over the 17-year period from 2001 to 2017:
E n e r g y = T D H   ×   M   ×   g 3.62 × 10 6   × O P E
where energy is in kWh, M is the total mass of groundwater pumped for irrigation (kg), g is the gravitational acceleration (9.8 m s−2), and other parameters are as they were defined above.
Since actual long-term TDH data for audited systems were not available, this parameter was approximated through developing a linear regression model to predict TDH from groundwater depth based on the data collected during energy audits. The assumption was that GWD is by far the largest portion of TDH, especially since all tested center pivot systems were of mid-elevation spray application type and thus required significantly lower operating pressures compared to center pivots equipped with impact sprinklers. The close proximity of irrigation wells to irrigation systems meant that pressure losses during water conveyance were small too. Once this relationship was developed it was applied to the average annual GWD estimated during the 2001–2017 period based on readings reported by the Oklahoma Water Resources Board at 42 and 22 observation wells in the Ogallala and Rush Springs aquifers, respectively. The readings were made on an annual basis (in winter) using electric tapes. The observation wells were selected in a way as to to represent the entire aquifer. The number of wells with continuous GWD data dropped quickly for years before 2001, which is why the 17-year period from 2001 to 2017 was selected for analysis in this study.
The discharge rates obtained during the energy audits were averaged for each studied aquifer and used in obtaining M, assuming 1000 h of pump operation per year. The OPE was estimated in a similar fashion, assuming that the average OPE of audited systems in each region was a reasonable representative of the average OPE of all systems in that region. In addition, this average OPE was assumed to be an acceptable representative of average OPE over the long-term period considered (2001–2017). After obtaining annual energy requirements, the LCA analysis explained in the previous section was implemented to estimate variations in GHG emissions as impacted by fluctuations in groundwater depth.

2.5. Economic Analysis

The economic implications of improving OPE at studied pumping plants was also investigated. Irrigation energy costs can be one of the largest categories of costs a producer in Oklahoma will incur over a season, reaching about 22 million USD [11]. Improving OPE to the levels recommended by the NPPPC could decrease irrigation pumping costs. In this study, energy cost analysis was conducted in two parts. The first part focused on estimating the energy cost of pumping 1000 h per year under current efficiencies and potential savings if the OPE of each tested pumping plant was improved to NPPPC levels. Unit energy costs of 0.05 USD per kWh for electricity-powered and 3.30 USD per 1000 cubic feet (MCF) of fuel for natural gas-powered plants were used in the analysis based on costs reported in the U.S. Energy Administration Information web portal for Oklahoma for the year when the tests were conducted [21].
The second part examined changes in long-term (2001–2017) pumping costs for the average OPE in each aquifer region by taking into account annual variations in groundwater depth and energy costs. The cost of electricity in Oklahoma varied from 0.04 USD kWh−1 in 2002 to 0.06 USD kWh−1 in 2008 and 2014 [21]. It should be noted that the actual blended rates would be higher than the projected rates used here. Hence, the actual pumping costs for these plants will be larger than those estimated in the present study. Compared to the cost of electricity, greater inter-annual variations were observed in natural gas costs in Oklahoma, ranging from 2.94 USD MCF−1 in 2016 to 13.03 USD MCF−1 in 2008 [21]. Finally, the energy costs for all electric and natural gas pumping plants in Oklahoma were approximated by assuming the estimates for audited sites are statistically representative of all corresponding plants in the state. This assumption may not be accurate, but it provides an estimate of the magnitude of statewide energy expenses for irrigation pumping.

3. Results and Discussion

3.1. Energy Audits

The measured parameters showed significant differences among audited sites in the Rush Springs and Ogallala aquifer regions. The average static groundwater depths for instance, were 24.4 and 79.7 m for RS and OG, respectively. Barefoot [22] has tested 13 natural gas irrigation pumping plants in the Oklahoma Panhandle region (OG) and reported a similar average pumping lift of 80.4 m. The average dynamic GWD, measured 15 min after starting the pump, was 30.7 and 89.1 m for the same aquifers, respectively. The measured water pressure was larger for irrigation systems in RS, resulting in a smaller difference in TDH compared to GWD. The average TDH was 67.8 and 105.9 m for the RS and OG aquifers, respectively.
The difference in TDH was accompanied by a corresponding difference in input energy. With an average value of 270 kW (362 Hp), the input power requirement in the OG was nearly five times larger than that in the RS region, which had an average of 56 kW (75 Hp). This probably explains the preference of natural gas engines over electric motors as an energy source for powering OG pumping plants since large electric motors have specific wiring and utility constraints. The water discharge rates were similar in the two study regions, with average values of 36.2 and 36.0 l s−1 for the RS and OG aquifers, respectively. The average discharge reported in [22] was 47.9 l s−1 in the OG aquifer region, about 33% larger than the value found in the present study.
The overall pumping efficiency of the sites in the RS aquifer region (electricity-powered) varied from 24.9% to 62.6%. Of the ten pumping plants evaluated, seven had an OPE of less than 50%, which was proposed in [17] as the threshold below which repairing or replacing the pump should be considered. All of the systems had efficiencies smaller than the recommended OPE of 66% by the NPPPC standard. The average OPE for the RS region was 43.3%. The difference between the estimated OPE and the NPPPC standard implies that nearly 23% of electrical energy is wasted on average due to poor efficiency of the pumping plant in the RS region. The average OPE in this study compares well with the average OPE of 42.6% reported in [23] and 47.0% in [24] for pumping plants in the High Plains and Trans-Pecos areas of Texas. The range of efficiencies in [24] was also similar to that in this study, with values varying from 16.8% to 70.6%. However, DeBoer et al. [25] have reported a larger average OPE of 58% in for electricity-driven pumping plants in west central Minnesota, North Dakota, and South Dakota. The plants tested in DeBoer’s study were fairly new, with 74% being less than six years old. The younger age of the pumps could be the cause of higher average efficiency.
The OPE of the natural gas-powered pumping plants in the OG aquifer region ranged from 5.7% to 21.4%. Out of 14 audited pumping plants, ten had an OPE less than the NPPPC recommended standard of 17% for natural gas internal combustion engines pumping plants. The average OPE for the OG region was 13.6%, close to average OPEs of 13.2%, 11.7%, and 13.1% as reported for natural gas-powered pumping plants in Oklahoma and Texas by Barefoot [22], Fipps et al. [23], and New and Schneider [24], respectively. The range of OPEs in [24] was 2.2–21.6%, similar to the range of OPEs estimated in the present study.
Linear regression analysis conducted on data collected at each site and the two sites combined revealed no significant relationship between OPE and the two parameters of TDH and discharge rate (p values larger than 0.37). This suggests that the performance of audited systems was impacted by other factors such as the type, age, and condition of the pumping plants. Small sample sizes of systems tested may have also contributed to the lack of correlation. Table 1 presents the average values of key parameters for tested plants in the two study areas.

3.2. Life Cycle Assessment

The LCA of electric motor pumps in the RS region examined the greenhouse gas (GHG) emissions at an electric generation station for 1000 h of pump operation. The total emissions from these pumping plants ranged from 28.4 to 52.9 and averaged 40.1 metric tons of equivalent CO2 (t CO2e) emissions. In order to facilitate comparison with other studies, it is useful to report emissions for the unit irrigated area and unit TDH. The pumping plants in the present study were all serving a standard-size center pivot system, with an irrigated area of about 50.8 ha per system. Hence, the average emission from electrical pumps per unit area of irrigated land and unit TDH would be 11.8 kg CO2 e ha−1 m−1. This is within the range of 4–93 kg CO2 e ha−1 m−1 reported in [7] for a variety of crops irrigated by electrical pumps in the Haryana state of India.
LCA of natural gas driven pumps examined the emissions through a two-part analysis that used GREET WTP and EPA calculations for stationary engines. The first part of the analysis provided estimates for natural gas extraction, processing, storage, and transportation (off-site), while the second part resulted in emission estimates for end-use at the irrigation field (on-site). The total off-site GHG emissions estimated for natural gas pumping plants in the OG region averaged 11.0 and had a range of 6.0–17.6 t CO2e. The on-site emissions varied from 26.7 to 78.1 and averaged 48.8 t CO2e. The average total emission from off- and on-site analyses was 59.8 t CO2e. This is equal to 11.4 kg CO2e ha−1 m−1 when expressed in terms of emission per unit area of irrigated land and unit TDH. The maximum total emission was 95.7 t CO2e and belonged to a pumping plant that had the fourth lowest OPE and the seventh largest groundwater depths, a combination resulting in the maximum amount of energy use.
On average, the total GHG emission from pumping plants in the OG region was 49% larger than that of the pumping plants in the RS region. However, the emission per unit irrigated land and unit TDH was 4% smaller. This indicates that TDH, which is greatly impacted by groundwater depth, plays a significant role in determining the GHG emissions from agricultural pumping plants. The emissions can also be reported per unit volume of water extracted from aquifers. This analysis resulted in emission ranges of 0.20–0.45 and 0.34–0.99 kg CO2 e m−3 for pumping plants in the RS and OG regions, respectively. These estimates are similar to the range of 0.18–0.60 kg CO2 e m−3 reported in [3] for all 31 provinces in China with variable proportions of electricity and diesel driven pumps.

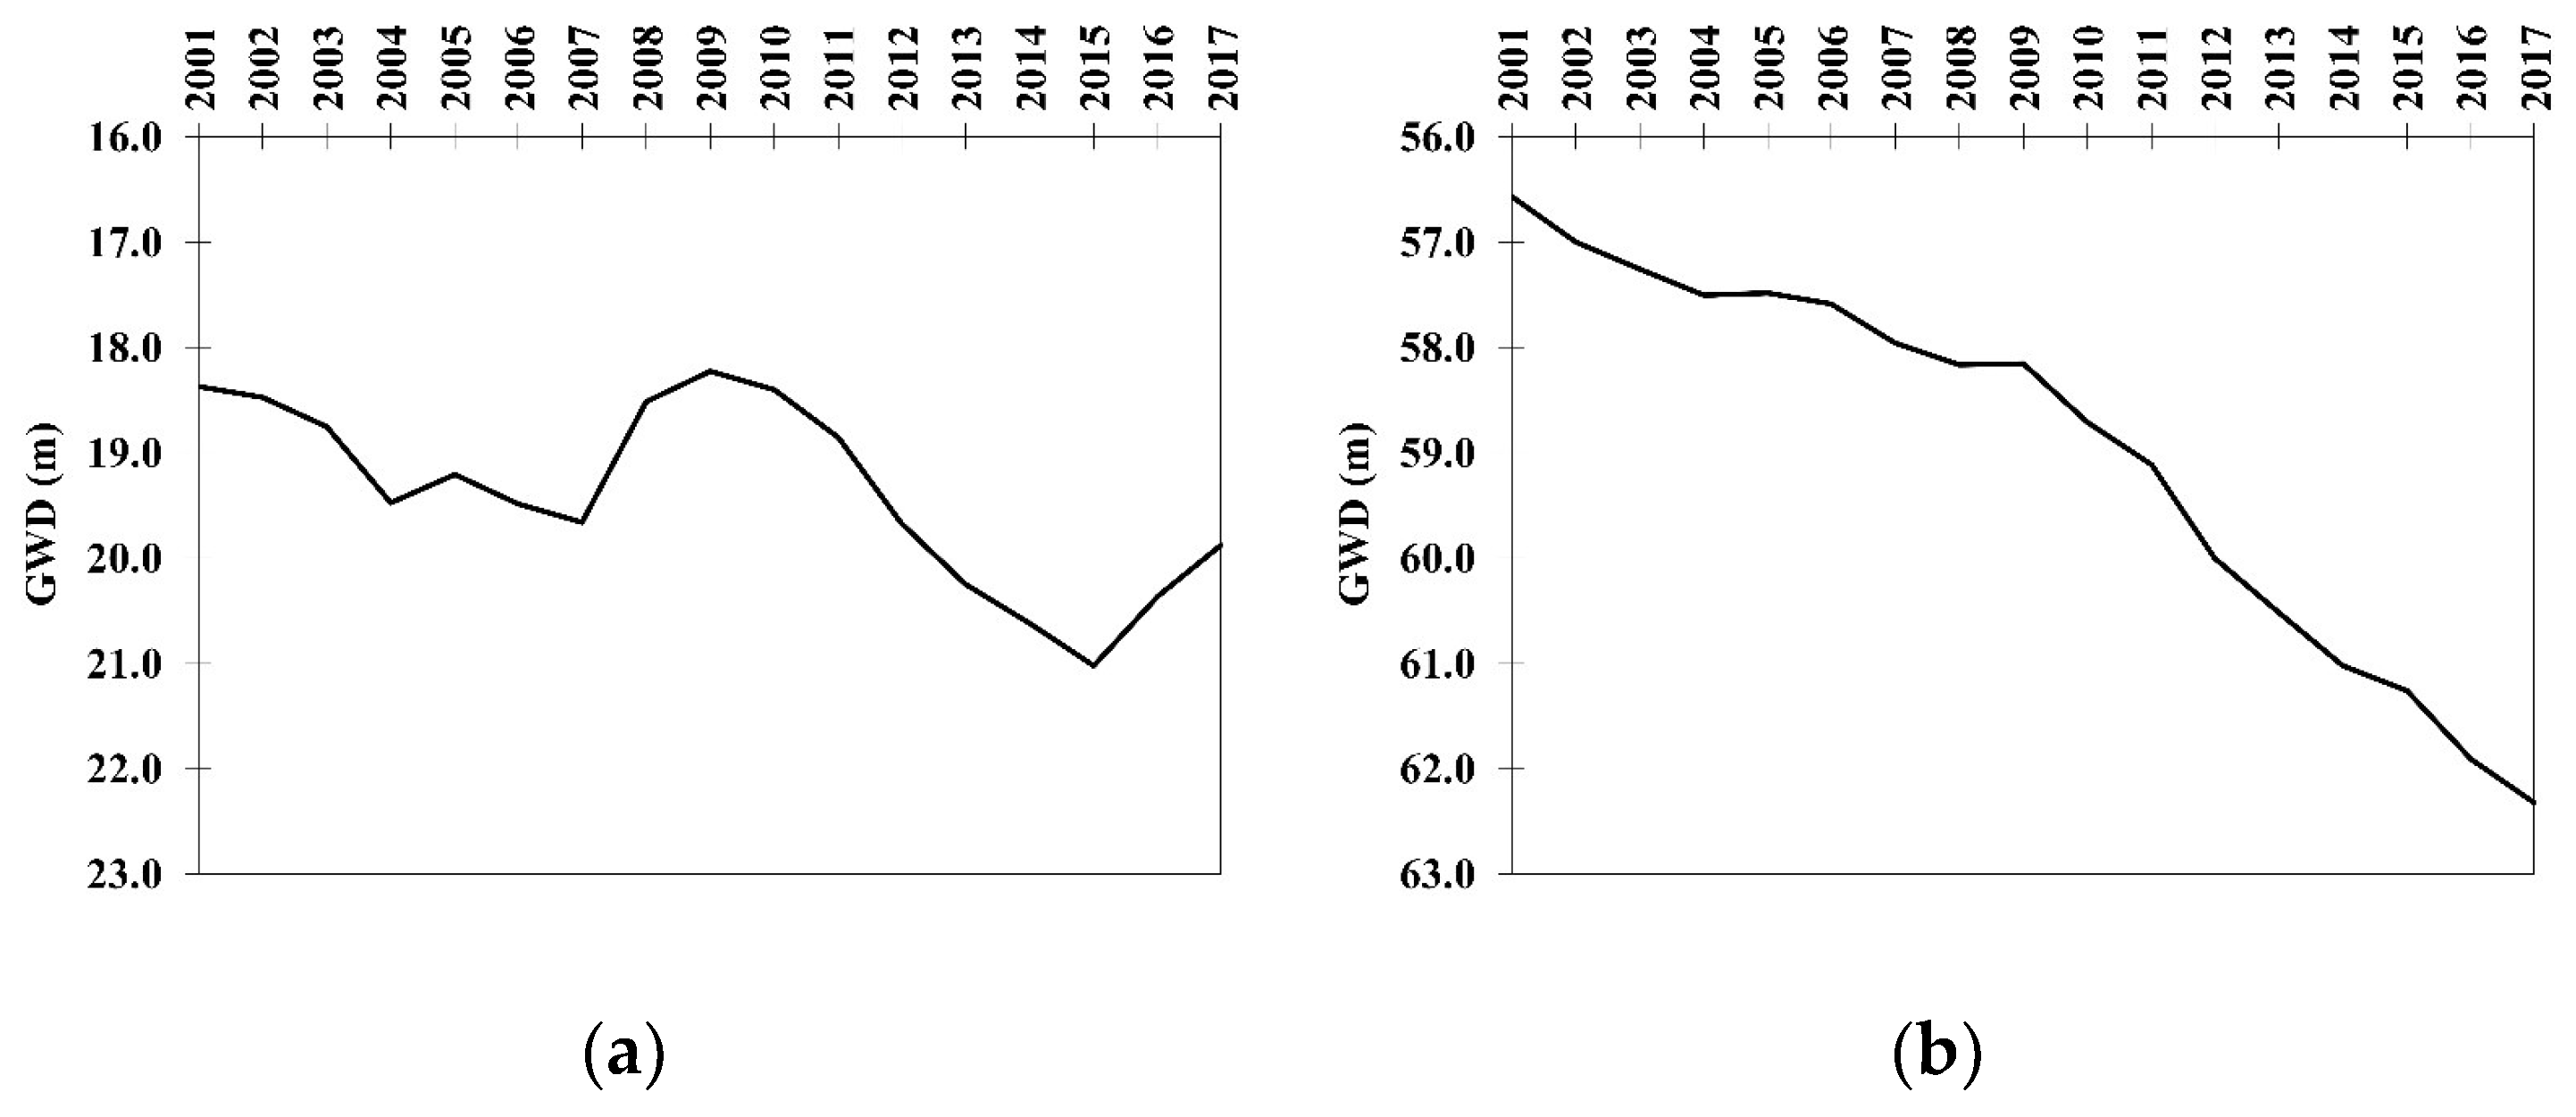
3.3. Long-Term Trends

Examination of the observed groundwater depth data showed that the Rush Springs aquifer levels varied between 18.2 and 21.0 m below the ground surface over the 17-year period, with a net decline of 1.5 m (Figure 2a). On the other hand, the Ogallala aquifer GWD experienced a steady decline from 56.6 to 62.3 m below the ground surface (Figure 2b). The OG aquifer has significantly smaller recharge rates. As a result, no rise in water level was observed in the OG aquifer during wet periods in 2005, 2007–2009, and 2015–2017, while the RS aquifer experienced rises in groundwater level. The rate of decline in water levels was greater during the drought years of 2011–2014 compared to wet and normal years for both aquifers, an indication of increased pumping for irrigation during this dry period.
The TDH and GWD measurements at audited sites were strongly correlated, with a Pearson coefficient of 0.88. The linear relationship developed based on TDH and GWD is presented below:
TDH = 0.67 × GWD + 53.76,
This relationship was statistically significant (p < 0.001) and had a coefficient of determination (R2) of 0.78, suggesting that over three-fourths of variability in TDH could be explained by changes in GWD. A similar approach was employed in [3], where the slope, intercept, and R2 were 0.91, 21.75, and 0.62 for a linear relationship between pump lift and GWD.
As expected, the variations in energy requirement during the 2001–2017 period had a pattern similar to that of GWD in each aquifer region. In the case of RS, the energy requirement for 1000 h of pump operation per year varied from 53,721 to 55,247 kWh during the 17 years considered and had an average of 54,344 kWh. The energy requirement was much larger at OG and increased over time, with a range of 233,175–242,980 kWh and an average of 237,277 kWh (Figure 3). This was more than four times larger than the average in RS. When considering energy requirements per unit volume of pumped water, the RS and OG regions had average rates of 0.42 and 1.84 kWh m−3, respectively. These values are similar to energy use rates of 0.21 to 0.66 kWh m−3 reported in [3] across all provinces in China.
In OG, the increase in energy requirements due to increases in GWD over the 17-year period was 4% of the initial (2001) amount. Qiu et al. [10] have reported a significantly larger increase of 22% in energy use in China between 1996 and 2013. However, the rate of groundwater level decline in their study was 0.6 m year−1, two times larger than the drop rate of 0.3 m year−1 observed in the present study. The results also revealed that improving the OPE in each region to achievable levels recommended by the NPPPC would result in 34% and 19% reductions in average energy requirements in the RS and OG regions, respectively.
The increase in energy requirements in the OG aquifer region over the long-term period resulted in a continuous increase in total GHG emissions from 51.7 t CO2e in 2001 to 53.9 t CO2e in 2017. In the RS aquifer region, the total GHG emissions varied between 38.3 t CO2e in 2009 and 39.4 t CO2e in 2015, the year that marked the end of a severe drought that caused significant declines in groundwater levels. Apart from the groundwater level, the OPE had a large influence on the energy use rate and emissions. Improving the OPE of electricity-powered pumping plants in the RS aquifer region to the NPPPC recommended standard of 66% could on an average reduce total GHG emissions by nearly 52%. Similarly, improving the OPE of natural gas-powered pumping sites from an average of 13.75% to the NPPPC recommended 17% level in the OG aquifer region could potentially reduce emissions by 20%. In India, it has been reported that improving electric pumping system efficiency (OPE) to 51% from an existing 34.7% level could lead to a decline of 32% in CO2 emissions [7].

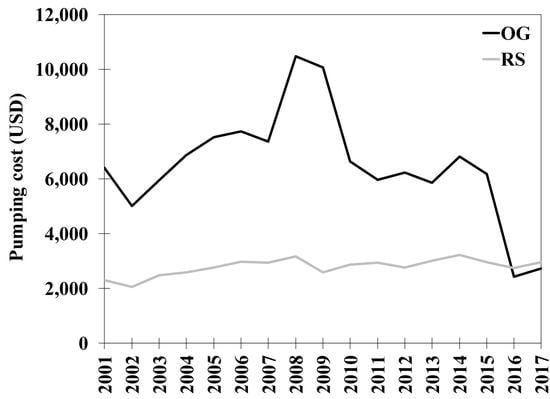
3.4. Economic Analysis

Based on the audit results, the current seasonal pumping cost for 1000 h was highly variable among pumping plants, with an average of 2827 USD for electricity-powered pumping sites in the RS aquifer region. The pumping expense was also variable among natural gas-powered pumping sites, with an average of 3042 USD, which was only 8% larger than that of electric plants. Such a small difference despite significant differences in energy use is due to low natural gas prices during the study period. It should be also noted that producers may run their pumps longer than 1000 h per year depending on crop type, weather conditions, and well yield. A longer operating hour will result in a linear increase in energy consumption costs. A significant potential for reduction in pumping costs was estimated if OPE was improved to meet NPPPC standards. The average saving for electric pumps was 35% of the current pumping costs. With the prices at the time of study, this amount of saving was equal to 1000 USD or one USD per every hour of pumping. For natural gas-powered pumping plants, the average saving was 23% of existing pumping costs, equal to 711 USD (71 cents per every hour of pumping). As mentioned before, this study was conducted when natural gas prices were among the smallest in the past several years in Oklahoma. Higher costs would have resulted in larger dollar values of saving. The results obtained here are consistent with the findings of Hardin and Lacewell [26] who reported significant decreases in fuel costs and increases in farm profits if the OPE of irrigation pumping plants in the Texas High Plains was improved to achievable levels.
Our long-term analysis showed that pumping cost for electric plants ranged from 2052 USD in 2002 to 3219 USD in 2014 and averaged 2788 USD for 1000 h of pumping per year (Figure 4). In the case of natural gas, inter-annual fluctuations were significantly larger. The pumping costs for these plants varied between 2429 USD in 2016 and 10,482 USD in 2008 and averaged 6490 USD for 1000 h of pumping per year (Figure 4). According to the most recent Farm and Ranch Irrigation Survey (FRIS) conducted by the U.S. Department of Agriculture, 3456 electricity-powered and 1354 natural gas-powered pumping plants are used for irrigation in Oklahoma [27]. Assuming that these plants have pumping costs similar to those estimated in this study, the total annual cost of irrigation pumping in Oklahoma can be approximated at 9.6 and 8.8 million USD for electric and natural gas plants, respectively. These estimates are similar to the total energy expenditure of 9.5 and 10.5 million USD reported for the same two sources of energy in [27], respectively.

4. Conclusions

The future of irrigated agriculture is largely dependent on its financial and environmental sustainability. In arid/semi-arid regions where large amounts of irrigation water is required to meet crop demand and where available water resources are usually limited or difficult to extract, energy consumption for irrigation pumping can play a significant role in both environmental and financial sustainability of agricultural production. In this study, the efficiencies, environmental footprint, and economics of irrigation pumping were investigated in two Oklahoma areas that rely heavily on groundwater resources. The first area was in central Oklahoma where electric pumps are used to extract water from the Rush Springs aquifer and the second area was in the Oklahoma Panhandle where natural gas-powered pumps remove water from the declining Ogallala aquifer. Field visits were conducted in the period from 2015 to 2018 to collect required data for analysis. The results confirmed significant differences among the regions in terms of depth to groundwater. It was also revealed that all electric pumps and the majority of natural gas plants had an overall pumping efficiency below the standard rates achievable under field conditions. The range and average OPE obtained in this study were similar to those reported in previous studies, including those that were conducted a few decades ago.
The life cycle assessment results showed a significant difference in total emissions, with natural gas-powered plants emitting 49% more greenhouse gases when considering the entire process from the extraction and transportation of natural gas to its combustion at the pump site. However, the average emission expressed per unit irrigated area and unit total dynamic head of pumping was slightly smaller for the natural gas plants in the OG region. In the same region, the energy required for pumping increased by 4% between 2001 and 2017 due to continuous declines in OG water levels. The results showed that improving the OPE to achievable standards could have resulted in 34% and 19% reductions in average energy consumption during the 2001–2017 period in the RS and OG regions, respectively. The reductions in GHG emissions would have been 52% and 20% for the same study areas, respectively.
The cost of irrigation pumping was also estimated for the pumping plants tested and for the two regions over the 2001–2017 period. Compared to RS, large inter-annual variations in the cost of pumping were found for agricultural producers in the OG, mainly due to the large fluctuations in the natural gas price. Assuming that the pumping plants audited in the present study represent all electric and natural gas plants in Oklahoma, the statewide energy expenses were estimated and found to be in good agreement with those reported in surveys conducted by the U.S. Department of Agriculture. The results of this study highlight the need for regular evaluation of pumping plant efficiencies to identify systems with poor performance and taking corrective actions to improve farm profitability and reduce environmental consequences of energy consumption for irrigation extraction.

Author Contributions

Conceptualization, R.S.F. and S.T.; Methodology, R.S.F. and S.T.; Formal analysis, D.H., R.S.F., and S.T.; Investigation, D.H., R.S.F., S.T., and J.G.W.; Writing—original draft preparation, D.H., R.S.F., S.T., and J.G.W.; Writing—review and editing, D.H., R.S.F., S.T., and J.G.W.; Project administration, R.S.F.; Funding acquisition, R.S.F.

Funding

This research was funded by a joint research and extension program funded by the Oklahoma Agricultural Experiment Station (Hatch funds) and Oklahoma Cooperative Extension (Smith-Lever funds) received from the National Institute for Food and Agriculture, U.S. Department of Agriculture. Additional support was provided by the Oklahoma Water Resources Center through the U.S. Geological Survey 104(b) grants program.

Acknowledgments

The authors are grateful to Mr. Chris Stoner and Mr. Donald Sternitzke from the Oklahoma Natural Resources Conservation Service, U.S. Department of Agriculture, for their support. We are also thankful to all agricultural producers who collaborated with us on this project.

Conflicts of Interest

The authors declare no conflict of interest.

References

  1. Khan, M.A.; Khan, M.Z.; Zaman, K.; Naz, L. Global estimates of energy consumption and greenhouse gas emissions. Renew. Sustain. Energy Rev. 2014, 29, 336–344. [Google Scholar] [CrossRef]
  2. Pradeleix, L.; Roux, P.; Bouarfa, S.; Jaouani, B.; Lili-Chabaane, Z.; Bellon-Maurel, V. Environmental impacts of contrasted groundwater pumping systems assessed by life cycle assessment methodology: Contribution to the water-energy nexus study. Irrig. Drain. 2015, 64, 124–138. [Google Scholar] [CrossRef]
  3. Wang, J.; Rothausen, S.G.; Conway, D.; Zhang, L.; Xiong, W.; Holman, I.P.; Li, Y. China’s water–energy nexus: Greenhouse-gas emissions from groundwater use for agriculture. Environ. Res. Lett. 2012, 7, 014035. [Google Scholar] [CrossRef]
  4. Karimi, P.; Qureshi, A.S.; Bahramloo, R.; Molden, D. Reducing carbon emissions through improved irrigation and groundwater management: A case study from Iran. Agric. Water Manag. 2012, 108, 52–60. [Google Scholar] [CrossRef]
  5. Shah, T. Climate change and groundwater: India’s opportunities for mitigation and adaptation. Environ. Res. Lett. 2009, 4, 035005. [Google Scholar] [CrossRef] [Green Version]
  6. Follett, R.F. Soil management concepts and carbon sequestration in cropland soils. Soil Tillage Res. 2001, 61, 77–92. [Google Scholar] [CrossRef]
  7. Patle, G.T.; Singh, D.K.; Sarangi, A.; Khanna, M. Managing CO2 emission from groundwater pumping for irrigating major crops in trans indo-gangetic plains of India. Clim. Chang. 2016, 136, 265–279. [Google Scholar] [CrossRef]
  8. Luc, J.P.; Tarhouni, J.; Calvez, R.; Messaoud, L.; Sablayrolles, C. Performance indicators of irrigation pumping stations: Application to drill holes of minor irrigated areas in the Kairouan plains (Tunisia) and impact of malfunction on the price of water. Irrig. Drain. 2006, 55, 85–98. [Google Scholar] [CrossRef]
  9. Mora, M.; Vera, J.; Rocamora, C.; Abadia, R. Energy efficiency and maintenance costs of pumping systems for groundwater extraction. Water Resour. Manag. 2013, 27, 4395–4408. [Google Scholar] [CrossRef]
  10. Qiu, G.Y.; Zhang, X.; Yu, X.; Zou, Z. The increasing effects in energy and GHG emission caused by groundwater level declines in North China’s main food production plain. Agric. Water Manag. 2018, 203, 138–150. [Google Scholar] [CrossRef]
  11. Taghvaeian, S. Irrigated Agriculture in Oklahoma. Oklahoma Cooperative Extension, Publication BAE-1530. 2014. Available online: http://pods.dasnr.okstate.edu/docushare/dsweb/Get/Document-9561/BAE-1530web.pdf (accessed on 10 October 2018).
  12. Oklahoma Water Resources Board. Oklahoma Groundwater Report. Beneficial Use Monitoring Program. 2017. Available online: https://www.owrb.ok.gov/quality/monitoring/bump/pdf_bump/Reports/GMAPReport.pdf (accessed on 10 October 2018).
  13. Brar, D.; Kranz, W.L.; Lo, T.H.; Irmak, S.; Martin, D.L. Energy conservation using variable-frequency drives for centerpivot irrigation: Standard systems. Trans. ASABE 2017, 60, 95–106. [Google Scholar]
  14. Masasi, B.; Frazier, R.S.; Taghvaeian, S. Review and Operational Guidelines for Portable Ultrasonic Flowmeters. Oklahoma Cooperative Extension, Publication BAE-1535. 2017. Available online: http://pods.dasnr.okstate.edu/docushare/dsweb/Get/Document-10723/BAE-1535web.pdf (accessed on 10 October 2018).
  15. Frazier, R.S.; Taghvaeian, S.; Handa, D. Measuring Depth to Groundwater in Irrigation Wells. Oklahoma Cooperative Extension, Publication BAE-1538. 2017. Available online: http://pods.dasnr.okstate.edu/docushare/dsweb/Get/Document-10865/BAE-1538web.pdf (accessed on 10 October 2018).
  16. Ross, E.A.; Hardy, L.A. National Engineering Handbook; Irrigation Guide; USDA: Beltsville, MD, USA, 1997.
  17. Hanson, B. Improving pumping plant efficiency does not always save energy. Calif. Agric. 2002, 56, 123–127. [Google Scholar] [CrossRef] [Green Version]
  18. U.S. Environmental Protection Agency. Greenhouse Gas Inventory Guidance; United States Environmental Protection Agency: Washington, DC, USA, 2016. [Google Scholar]
  19. Rothausen, S.G.; Conway, D. Greenhouse-gas emissions from energy use in the water sector. Nat. Clim. Chang. 2011, 1, 210–219. [Google Scholar] [CrossRef]
  20. Shahdany, S.M.H.; Firoozfar, A.; Maestre, J.M.; Mallakpour, I.; Taghvaeian, S.; Karimi, P. Operational performance improvements in irrigation canals to overcome groundwater overexploitation. Agric. Water Manag. 2018, 204, 234–246. [Google Scholar] [CrossRef]
  21. U.S. Energy Information Administration. Available online: https://www.eia.gov/ (accessed on 10 October 2018).
  22. Barefoot, A.D. Investigation of Factors Affecting Energy for Irrigation Pumping; Oklahoma Water Resources Research Institute: Stillwater, OK, USA, 1980. [Google Scholar]
  23. Fipps, G.; Neal, B. Texas Irrigation Pumping Plant Efficiency Testing Program; Texas A & M University System: College Station, TX, USA, 1995. [Google Scholar]
  24. New, L.; Schneider, A.D. Irrigation Pumping Plant Efficiencies, High Plains and Trans-Pecos Areas of Texas; Texas Agricultural Experiment Station, Texas A & M University System: College Station, TX, USA, 1988. [Google Scholar]
  25. DeBoer, D.W.; Lundstrom, D.R.; Wright, J.A. Efficiency analysis of electric irrigation pumping plants in the upper Midwest, USA. Energy Agric. 1983, 2, 51–59. [Google Scholar] [CrossRef]
  26. Hardin, D.C.; Lacewell, R.D. Implication of improved irrigation pumping efficiency for farmer profit and energy use. J. Agric. Appl. Econ. 1979, 11, 89–94. [Google Scholar] [CrossRef]
  27. U.S. Department of Agriculture 2013 Farm and Ranch Irrigation Survey. Available online: https://www.nass.usda.gov/Publications/AgCensus/2012/Online_Resources/Farm_and_Ranch_Irrigation_Survey/ (accessed on 10 October 2018).
Figure 1. Location of tested pumping plants and their corresponding aquifers.
Agriculture 09 00027 g001
Figure 2. Annual variations in groundwater depth (GWD) for plants in the (a) Rush Springs, and (b) Ogallala aquifers.
Agriculture 09 00027 g002
Figure 3. Annual variations in energy requirements for 1000 h of operation per year for plants in the (a) Rush Springs, and (b) Ogallala aquifers.
Agriculture 09 00027 g003
Figure 4. Annual variations in pumping cost for 1000 h of operation per year for the Ogallala and Rush Springs aquifers.
Agriculture 09 00027 g004
Table 1. Average values of the main characteristics of studied pumping plants in the Rush Springs (RS) and Ogallala (OG) aquifer regions.
ParameterRSOG
Static groundwater depth (m)24.479.7
Dynamic groundwater depth (m)30.789.1
Total dynamic head (m)67.8105.9
Discharge (l s−1)36.236.0
Overall pumping efficiency (%)43.313.6

