Article

Numerical Investigation of Local Scour Protection around the Foundation of an Offshore Wind Turbine

1
School of Water Resources and Hydropower Engineering, North China Electric Power University, Beijing 102206, China
2
Institute of Geotechnical and Underground Engineering, Beijing University of Technology, Beijing 100124, China
3
College of Aerospace and Civil Engineering, Harbin Engineering University, Harbin 150009, China
*
Author to whom correspondence should be addressed.
J. Mar. Sci. Eng. 2024, 12(5), 692; https://doi.org/10.3390/jmse12050692
Submission received: 14 March 2024 / Revised: 17 April 2024 / Accepted: 20 April 2024 / Published: 23 April 2024
(This article belongs to the Special Issue New Era in Offshore Wind Energy)

Abstract

:
The pile foundations of offshore wind turbines face serious problems from scour damage. This study takes offshore wind turbine monopile foundations as the research object and proposes an innovative anti-scour device for the protection net. A numerical simulation research method based on CFD-DEM was used to model the local scour of the pile foundation and protection net. The validity of the numerical model was verified by comparing the simulation results of the local scour of the pile foundation under the condition of clear water scour and the results of the flume test. The permeability rate was defined to characterize the overwatering of the protection net, and numerical simulations were performed for protection nets with permeability in the range of 0.681 to 0.802. The flow field perturbations, changes in washout pit morphology, and changes in washout depth development due to the protective netting were also analyzed. It was found that the protection net can effectively reduce the flow velocity around the pile, cut down the intensity of the submerged water in front of the pile, and provide scouring protection. Finally, the analysis and summary of the protection efficiency of the different protection nets revealed that the protection efficiency within the nets was consistently the highest. On the outside of the net, the protection efficiency is poor at a small permeability rate but increases with an increasing permeability rate.

1. Introduction

In recent years, wind energy, a major source of renewable energy, has played an irreplaceable and important role in the energy supply of today’s power systems [1]. After decades of research, the technology of wind power generation has reached a relatively mature and stable state, and its coverage has also developed from land to sea. Compared with onshore wind power, offshore wind power undoubtedly has more abundant and stable wind energy resources and therefore has great potential for development. At the same time, offshore wind power also needs to face more serious safety issues in terms of construction and maintenance, as the crux of the problem [2]. Among the offshore wind power accidents that have occurred around the world in recent years, most of the safety accidents occurred during the operation period after the construction of the offshore wind turbines [3]. During this period, in addition to the wear and tear and the damage faced by the operation of the wind turbines themselves, the scouring problem faced by the wind power piling foundation should not be underestimated.
The pile foundation of offshore wind turbines is subjected to the action of waves, ocean currents, and other marine loads for a long time, forming a complex and variable flow field around the pile foundation, including submerged currents, horseshoe vortexes, and tail vortexes. The interaction between these hydrodynamic effects and soil particles around the pile leads to the soil around the pile foundation being very susceptible to localized scouring problems [4]. The streaks and rollers on the scour bed cause sediment transport downstream of the pile such that scour pits are formed [5]. The pile foundation then faces a series of safety problems caused by scour. Firstly, scour pits form due to the loss of soil particles around the pile, leading to a reduction in the effective burial depth of the pile foundation. Then, the bearing capacity of the pile foundation decreases accordingly, ultimately decreasing the pile foundation’s ability to cope with complex and extreme loads, which also poses a safety hazard for the operation of offshore wind turbines [6].
To cope with the threat of pile scour, in-depth research on pile scour-protection measures is one of the most important key points at present. The initial scour-protection measure is to consider the impact of scour at the beginning of the design, referring to the empirical formula and calculation method of the maximum scour depth of the pile perimeter [7,8,9] or further exploring stochastic prediction models to improve prediction accuracy [10] and increase the burial depth of the pile foundation to reduce the adverse effects of scour. However, various factors show that the effect of such a measure is not satisfactory. As a result, with the emergence of other protection programs, this measure has been gradually abandoned [11]. Localized scour around the pile is the result of fluid flow leading to the loss of soil particles around the pile. Therefore, changing the flow field around the pile or improving the scour resistance of the soil particles around the pile are both effective scour-protection measures. Today’s mainstream protection measures can be divided into two types according to whether there is an influence on the flow field around the pile: passive protection and active protection [12].
Passive protection refers to the application of different reinforcement measures to the soil around the pile to improve the scour resistance without changing the flow field around the pile. Currently, the more traditional methods include riprap [13], which studies have shown provides a good protective effect [14]. Riprap has been widely used in actual projects and has the advantage of convenient construction, but the flow field is more complicated in deeper waters, where the effect of riprap decreases. Accordingly, appropriate methods can be used instead of riprap [15], such as foundation grouting [16], concrete gabions [17], or geotextile bedding [18]. In addition to the above traditional protection measures, with the development of technology, more and more innovative protection measures have also entered researchers’ attention. Among them, the bionic grass protection layer has also begun to be applied to scour protection. The bionic grass protection layer can reduce the water flow velocity and promote sediment settling, which can ultimately achieve the purpose of protecting the seabed [19,20]. Solidified soil protection is based on the saturated nature of solidified soil, strong water stability, anti-scour, and boundary ductility to form a scour-protection structure. There are now studies proving the effectiveness of solidified soil in resisting scour in underwater environments, but its applicability to projects has yet to be verified [21,22]. With reference to the establishment of instream vegetation, the density of vegetation is also an important factor influencing the surface destabilization of the seabed. It has been proved that a lower density of instream vegetation results in a lower frequency of particle entrainment, which means a lower probability of riverbed destabilization [23]. In addition, considering the environmental and ecological impacts, microbial-induced carbonate precipitation, a soil-stabilization method, has been introduced into the scour protection of monopile foundations [24]. All of the above innovative methods have different degrees of advantages and application prospects, but most of the current studies on these measures are still focused on experiments, and the application effects in actual projects are still affected by many complex factors.
Another protection measure is to design different types of disturbance devices at the bottom or around the piles to reduce the water flow velocity or change the direction of water flow and attenuate the influence of submerged water and horseshoe vortexes. Because passive protection does not eliminate the root cause of scour, secondary scour may still occur, so the protective effect of active protection is relatively more reliable. Setting up sacrificial piles [25] or spoilers [26] in different arrangements upstream of the piles can change the direction of water flow in front of the piles while cutting down the water flow velocity, reducing the scouring of the pile foundation part. Sacrificial piles are available in different rows, including transverse and triangular arrangements. It has been verified in flume tests that triangular rows have better scour resistance in most cases, and the effect is further improved by combining them with bed sill [27]. The spoiler mainly affects the direction of water flow to divert it in front of the pile, and its protective effect is affected by the angle of the top corner [28].As for the spoiler structure set in the pile foundation part, we can refer to the scour protection of bridge abutment and consider adopting the simple structure of circular type scour guard ring [29,30]. After the flume test and numerical model simulation studies, it can be determined that a more obvious effect of scour prevention can be discerned [31]. On the basis of the circular type, there are also other forms with more complicated shapes and structures, such as by changing the circular shape into a wing-type washer guard ring [32]; or increasing the thickness of the guard ring to form a neck ring [33] and changing the outer diameter of the guard ring on the basis of the neck ring to form a narrower flare at the top and a wider flare at the bottom [34]. These optimization schemes have improved the anti-scouring effect of the guard ring to varying degrees. In addition to fixing the spoiler in the direction of incoming flow, the spoiler can also be connected and fixed to the pile foundation, which can directly weaken the strength of the horseshoe vortex around the pile [35]. The design of the spoiler on the pile itself is also an important direction; for example, research has been conducted into the design of different structures of grooves or bionic corrugated shapes on the pile itself to achieve the purpose of the spoiler [36]. Other spoilers with more complex structures have also been applied for scour protection. For example, the protective effect of a rectangular pore structure is affected by parameters such as the angle of attack, the porosity, and the number of layers of the structure, among which the angle of attack has the most significant effect on scour protection [37]. In active protection, the impact on the ecological aspects is also emphasized. Therefore, artificial reefs are considered for introduction into scour protection, and numerical simulations have verified that they can block the water flow, weaken the horseshoe vortex, and play a role in scour protection [38].
Research has shown that these active protection measures have different degrees of scour protection effects. However, an evaluation showed that many of the protective countermeasures were tested in a water bath test, which means that the results obtained would have been limited by the experimental environment [39]. At the same time, in an actual project, there are still many difficulties faced in the application of these devices, and the complex flow field environment brings great difficulties in design, construction, and maintenance. For example, although sacrificial piles can reduce the scour at the pile foundations, when the intensity of the flow field is further increased, extremely severe scouring occurs at the laterally aligned sacrificial piles, while the effect of the triangularly aligned sacrificial piles decreases significantly. Scour-protection rings have been shown to have a good protective effect, but because they need to be fixed on the pile, they may affect the overall vibration characteristics of the wind turbine and therefore pose a great challenge to the design of the pile. The improvement of the piles themselves also faces the problem of increased construction costs and cannot be applied to wind turbines that have already been put into use.
This study takes the offshore wind turbine monopile foundation as the research object. An anti-scour device with a novel structure is proposed, and the effects of this device on the flow field and sediment seafloor are investigated simultaneously using the CFD-DEM method. Its structure is shown in Figure 1. The protection net is partly submerged in the sand bed and partly in the fluid domain, with the height not exceeding the horizontal plane. The novelty of the design of the protection net is that, on the one hand, due to its design fully surrounding the pile foundation, it can cope with the complex flow field with different incoming flow directions. On the other hand, this protective net is not connected to the pile foundation itself, which does not affect the characteristics of the pile foundation itself. Therefore, it can be applied to wind turbines that have already been put into use. In this study, based on the numerical simulation research method of CFD-DEM, the computational fluid dynamics software Fluent2020R2 and discrete element software EDEM2020.3 are used to establish the local scour model of the pile foundation and the protection net. Firstly, the validity of the numerical model is verified by comparing the simulation results of the local scouring of pile foundation under clear water scouring conditions with the results of the flume test to further study the protection net. Secondly, the permeability rate is defined to characterize the overwatering of the protection net, and numerical simulations of different values of the protection net are carried out with this variable to analyze the disturbance of the flow field, the change in the scour pit morphology, and the development of the scour depth caused by the protection net. Finally, the protection efficiency of different protection nets is analyzed and summarized, and the tendency of the value of the permeability rate is obtained to improve the protection efficiency.

2. Mathematical Model

2.1. Computational Fluid Dynamics (CFD) Modeling

The CFD method refers to computer numerical calculations. The system contains physical phenomena related to fluid flow analysis and simulation methods. The CFD method treats the fluid phase as a continuous phase controlled by governing equations [40] and then solves these equations to obtain the distribution of basic physical quantities, such as velocity and pressure, at various locations in the flow field, as well as the changes in these physical quantities with time.
The controlling equations for the flow field are the N–S (Navier–Stokes) equations, including the continuity equation and momentum conservation equation, which are expressed as follows for an incompressible viscous fluid [41]:
t α f ρ f + · α f ρ f u f = 0
t α f ρ f u f + · α f ρ f u f u f = α f p + · α f τ f + α f ρ f g f
where αf is the volume fraction of the fluid; ρf is the fluid density; t is the time; uf is the instantaneous velocity of the fluid; p is the static pressure of the fluid; τf is the fluid stress tensor, τ f = μ u f + u f T ; μ is the kinetic viscous coefficient of the fluid; and f is the momentum exchange phase term of the fluid and the particles in the unit volume grid.
In this study, the turbulence model is selected as the standard k-ε model, in which the turbulent viscosity in the eddy–viscosity assumption proposed by Boussinesq can be expressed by the turbulent kinetic energy and the turbulent dissipation rate with the following equation:
μ t = ρ f C μ k 2 ε
where k is the turbulent kinetic energy, ε is the turbulent dissipation rate, and the corresponding transport equations are, respectively,
t α f ρ f k + · α f ρ f k u f = · α f ξ k k + α f P k α f ρ f ε
t α f ρ f ε + · α f ρ f ε u f = · α f ξ ε ε + α f C 1 P k ε k α f ρ f C 2 ε 2 k
In this equation, ξ k = μ + μ t / σ k , ξ ε = μ + μ t / σ ε , where σk and σε are the Prandtl numbers corresponding to the turbulent kinetic energy and turbulent dissipation rate, taking the values of 1.0 and 1.3; Cμ, C1, and C2 are empirical constants, taking the values of 0.09, 1.44, and 1.92, respectively; and Pk is the generating term of the turbulent kinetic energy k, induced by the time-averaged velocity gradient, P k = μ t u f · u f + u f T . The initial value of k is 3.7 × 10⁻³ m2/s2, and the initial value of ε is 0.1257 m2/s3.

2.2. Discrete Element Method (DEM) Modeling

The traditional discrete element method calculates the advection and rotation of the particles according to Newton’s second law, which mainly takes into account the inter-particle interactions, fluid effects, and various volume forces. The governing equations of motion of the particles are as follows:
m p d u p d t = m p g + F N + F T + F
I P ω P t = M p
where mp is the mass of the particle; F is the fluid action force on the particle; Ip is the rotational inertia of the particle; ωp is the rotational angular velocity of the particle; Mp is the total torque on the particle; and FN and FT are the normal and tangential contact forces on the particle by the other particles and the geometry, respectively, which are determined by the Hertz–Mindlin no-slip contact model [42]. As shown in Figure 2, the Hertz–Mindlin no-slip contact model simplifies the force between particles into elements, such as dampers and springs, where the springs represent the elastic portion of the particles in contact with each other, while the dampers produce viscous damping and thus represent the energy dissipation between the particles in contact.
The particle contact force consists of contact force and damping force. The normal contact force F N e is a function of the normal overlap δN, and the tangential contact force F T e is a function of the tangential displacement δT, which are mainly used to represent the elastic response of the particles during the collision with the following equations:
F N e = 2 3 S N δ N · n
F T e = min S T δ T , μ S F N e · t
The normal damping force F N d , and the tangential damping force F T d are mainly used to represent the energy dissipation during particle collision with the following equations:
F N d = 2 5 6 ln e ln 2 e + π 2 S N m * · v N r e l
F T d = 2 5 6 ln e ln 2 e + π 2 S T m * · v T r e l
The rolling friction of the particles is expressed by applying the reversing moment τ on the contact surface of the particles, which is given by the following equation:
τ = μ r F N e R
where SN is the normal stiffness, S N = 2 E * R * δ N ; ST is the tangential stiffness, S T = 8 G * R * δ N ; E* is the equivalent Young’s modulus, E * = 1 v i 2 E i + 1 v j 2 E j 1 ; G* is the equivalent shear modulus, G * = 2 2 v i 1 + v i E i + 2 2 v j 1 + v j E j 1 ; n is the normal unit vector at the contact point; t is the tangential unit vector at the contact point; R* is the equivalent radius, R * = 1 R i + 1 R j 1 ; m* is the equivalent mass, m * = 1 m i + 1 m j 1 ; Ei, vi, Ri, mi and Ej, vj, Rj, mj are the Young’s modulus, Poisson’s ratio, radius, and mass of the two contacting particles, respectively; e is the collision recovery coefficient; v N r e l is the normal component of the relative velocity; v T r e l is the tangential component of the relative velocity; μs is the sliding friction coefficient; μr is the rolling friction coefficient; and R is the distance from the contact point to the center of mass.

2.3. CFD-DEM Coupling Model

The CFD-DEM coupling model is mainly used to describe the interphase interaction between the fluid and the particles, and the Gidaspow traction model [43] is chosen to characterize it. In this model, the effects of buoyancy and trailing force on particles are mainly considered, and the equations are as follows:
f = f b + f d
F = ω i · V c e l l · f
In this equation, fb and fd are the momentum transfer of the fluid due to buoyancy and trailing force to all particles in the grid cell per unit volume of the grid; Vcell is the volume of the grid cell; and ωi is the distribution coefficient of the interphase force of the ith particle in the grid cell.
The buoyancy force is mainly caused by the pressure difference between the upper and lower surfaces, which is given by the following equation:
f b = α p ρ p ρ f · g
where αp is the volume fraction of the particles and ρp is the density of the particles.
The trailing force is mainly due to the relative motion between the fluid micro-cluster and the particles; the surface of the particles will produce flow resistance to the fluid, and the fluid will also exert a trailing force on the particles. The equation is as follows:
f d = K f p u f u p
where up is the velocity of the particles and Kfp is the fluid–solid momentum exchange coefficient, which is given by the following equation:
K f p = 3 4 C D α f α p ρ f u f u p d p α f 2.65 , α f > 0.8 150 μ α p 2 α f d p 2 + 1.75 ρ f α p u f u p d p , α f 0.8
where dp is the particle size and CD is the trailing force coefficient, which is given by
C D = 24 α f Re p 1 + 0.15 α f Re p 0.687
where Rep is the relative Reynolds number of particles, Re p = α f ρ f d p u f u p μ .

3. Numerical Model

3.1. Geometric Model

The computational model is shown in Figure 3, which includes the fluid domain, the sediment bed, the cylindrical pile foundation, and the protection net around it. Among these, the sediment bed model is a porous media domain filled with discrete particles established by EDEM, and the establishment of the sediment bed is completed before starting the scour calculation so that the particles are relatively uniformly distributed in the seabed area and fully settled. The part above the sediment seabed is the fluid domain for the scour calculation, which prevents the boundary effect from influencing the calculation results. It is necessary to reserve enough size in the vertical direction of the incoming flow in the fluid domain. Thus, in this study, the ratio of the slot width to the diameter of the pile foundation model is taken to be 20.
The local model of the protection network, shown in Figure 4, consists of a mesh structure around the pile foundation, partly in the sand bed and partly in the fluid domain. The diameter of the pile is D, and, referring to the results of the flume test and numerical simulation of the pile foundation scour pit, the diameter of the protection net is selected as 2.5D. The protection net is built from the bottom of the seabed model, and the overall height is chosen as 2.5D. The whole protection net comprises a square prismatic structure with a cross-sectional size of 8 × 8 mm.
To more accurately simulate the computational flow field, it is necessary to divide a finer mesh, but when the size of the discrete particles is greater than or equal to the size of the computational grid cells, it will affect the stability of the numerical calculations. Therefore, for the particle-unresolved CFD-DEM coupling method, the fluid mesh size generally needs to be larger than the particle size [44]. To fulfill this requirement, this study uses the software HyperMesh 2019 to mesh the model, and the grid size is kept between 10 and 18 mm. To improve the computational efficiency, the grid is encrypted in the area of the protection net and the seabed around the piles, while the grid of the other areas is relatively sparse; the results of the mesh division of the pile foundation and the part of the protection net are shown in Figure 5. The total number of grid cells is about 6 × 10⁵, which is slightly different depending on the specific working conditions.

3.2. Parameter Selection and Boundary Conditions

3.2.1. EDEM Parameter Setting

According to the local scour model of monopile foundation without protection net [44], the particle size of all sediment particles in this model is uniformly 5 mm, the density is 2670 kg/m3, Poisson’s ratio is 0.35, and the shear modulus is 5 MPa. The collision contact between sediment particles is described by the Hertz–Mindlin no-slip model, corresponding to the parameters to be determined in this model, which include the collision recovery coefficient, the static friction coefficient, and the rolling friction coefficient. The value of the collision-recovery coefficient is 0.45, the value of the static friction coefficient is 0.65, and the value of the rolling friction coefficient is 0.01, because the rolling friction of the particles in the water is small in this scouring model. The specific discrete element setting parameters are shown in Table 1.

3.2.2. Fluent Parameter Settings

The Fluent is set to transient calculation, and the fluid control equations are discretized using the finite volume method, with the SIMPLE algorithm based on pressure–velocity coupling and the first-order windward differential format. The inlet boundary of the fluid domain is set as the velocity inlet, the inlet mean flow velocity is 0.92 m/s, the direction is perpendicular to the inlet boundary, and the turbulence intensity is set to 5%. The outlet boundary is set as the pressure outlet, and the pressure is set as the standard atmospheric pressure; the side and the top surfaces are set as symmetric boundaries, and the rest of the boundaries are set as the non-slip solid walls. The turbulence model is set as the standard k-ε model, and the traction model is set as the Gidaspow traction model. The specific CFD setup parameters are shown in Table 2.

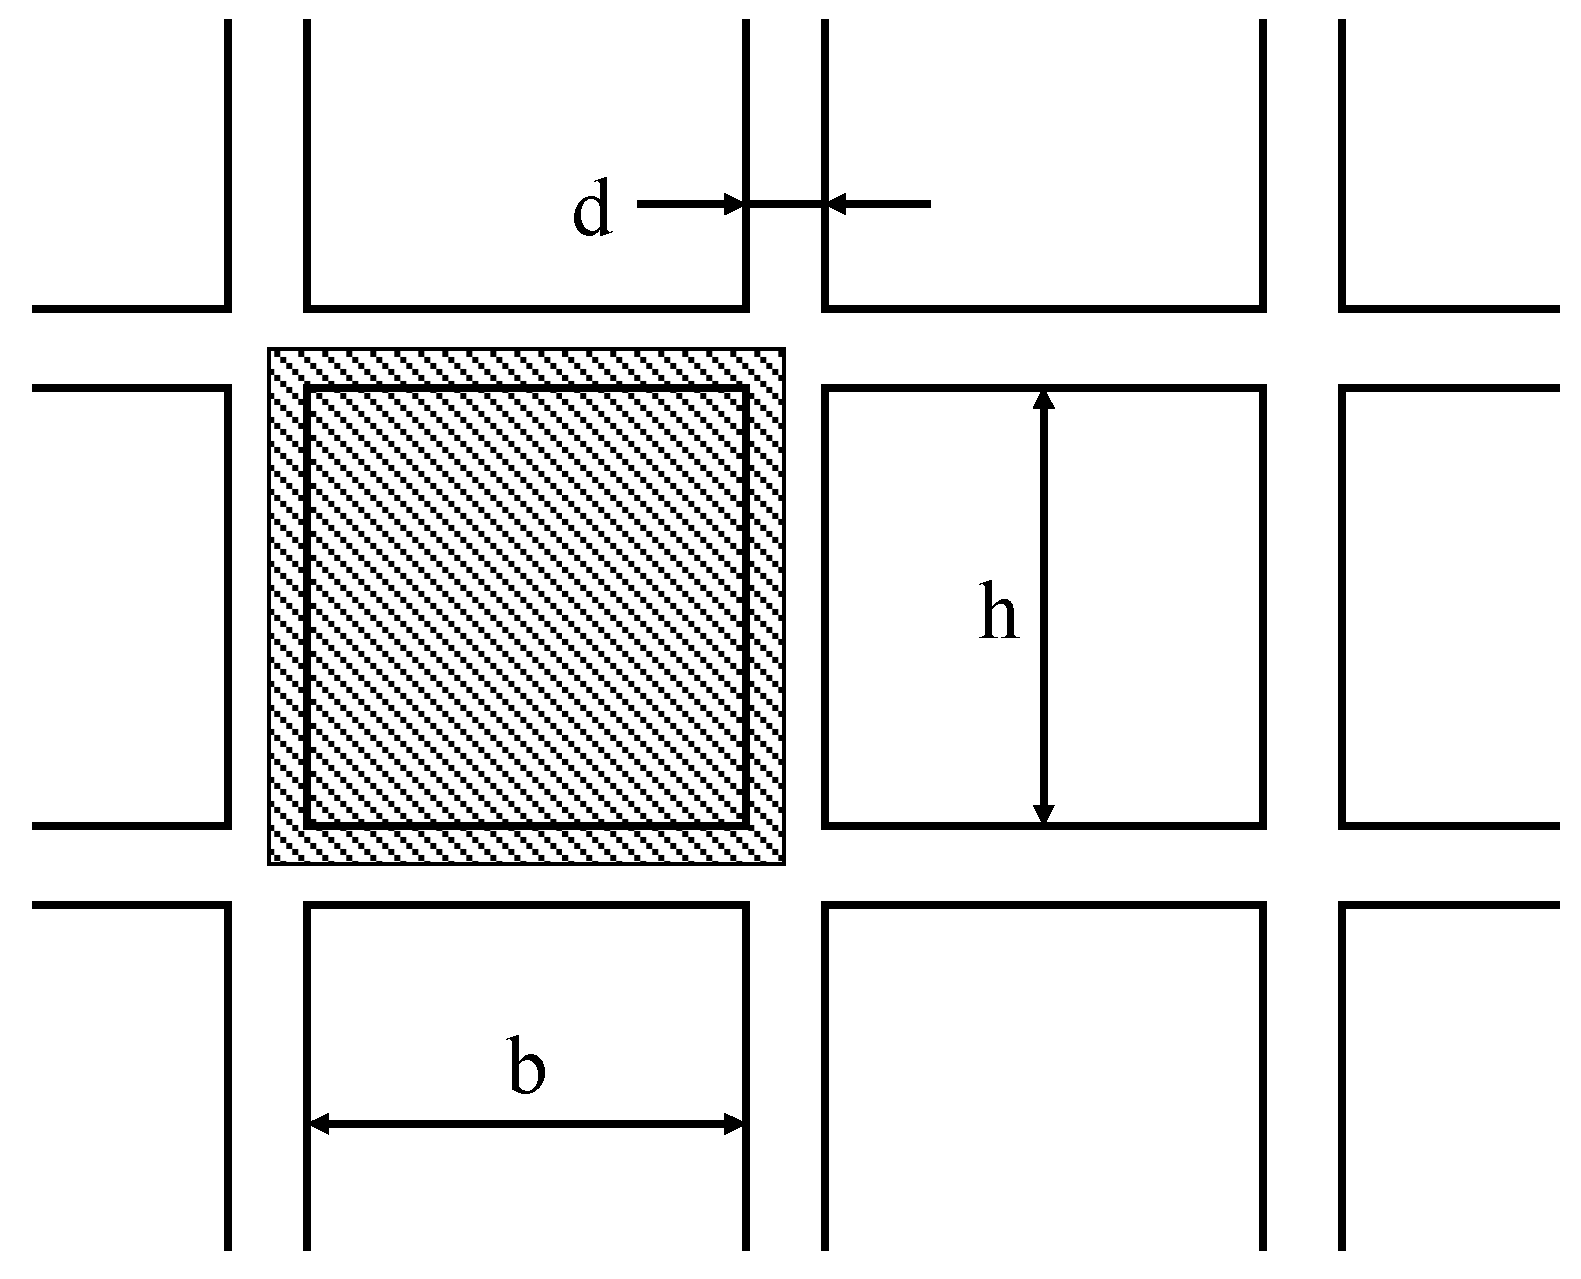
3.3. Cases’ Geometry

3.3.1. Selection of Variables

The protection net mainly affects the water flow field and reduces the water flow velocity to achieve the effect of scour protection, so a permeability rate φ is defined to describe the effect of the protection net on the water flow.
As shown in Figure 6, for the local structure of the protection net, where the shaded part is a grid cell in the protection net, the specific meaning of the permeability rate is that in a grid cell of the protection net, and the expression of the permeable part of the area of the total area of the cell ratio is
φ = b h b + d h + d
In this equation, φ denotes the water-permeability rate, b denotes the width of the grid cell, h denotes the height of the grid cell, and d denotes the size of the protection net structure.

3.3.2. Case Settings

In this study, one initial model without a protection net and six protective net models with different levels of water permeability are set up, and the specific parameter settings are shown in Table 3.

4. Results and Analysis

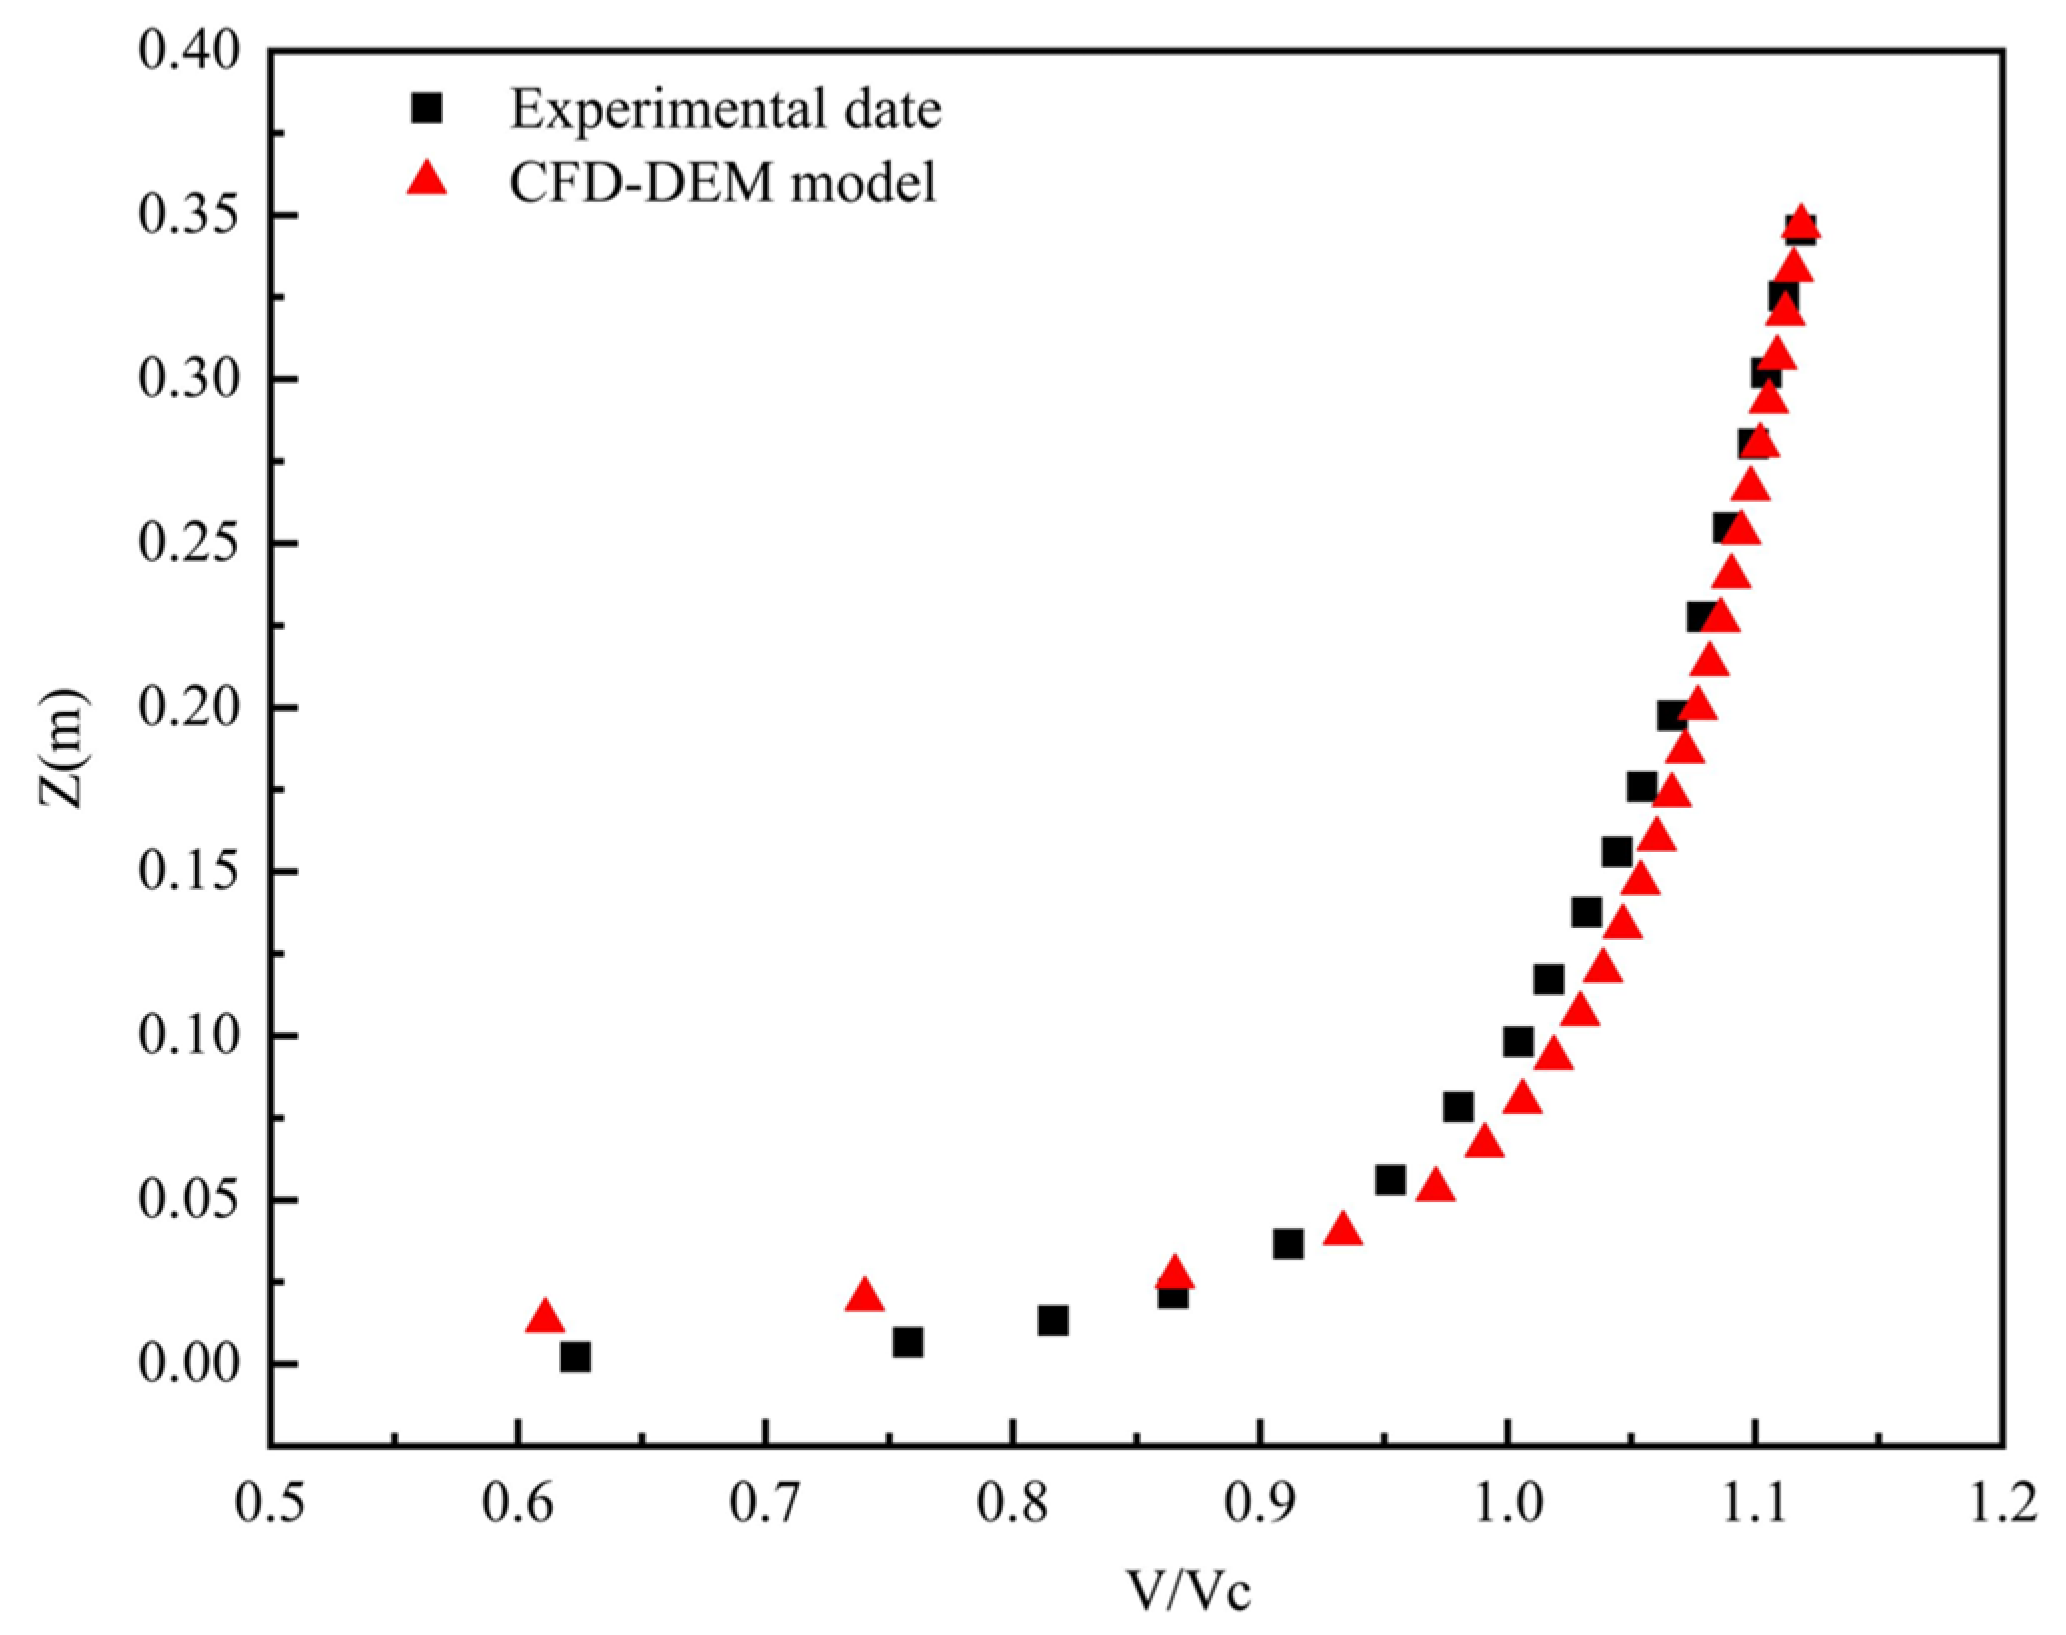
4.1. Model Validation

The model is validated by comparing it with the results of the unidirectional flow scouring test of flume [45], and the specific working condition parameters are shown in Table 4.

4.1.1. Flow Velocity Distribution

Before the study of numerical simulation results, the numerical model of the local scour of the pile foundation needs to be verified. Taking the model without the protection net as the object, its simulation calculation results are compared with the results of the flume test. For example, Figure 7 shows the change in the average flow velocity with the depth of water flow upstream of the numerical model and the flume test, in which the depth of the water flow is denoted by Z and the distribution of the average flow velocity of the water flow over the depth of the water flow is denoted by the ratio of it to the critical start-up flow velocity Vc. In this flume experiment, an acoustic Doppler flowmeter was used to measure the flow velocity. In addition, the probe configuration of the Doppler flow meter can be optimized to obtain more accurate results [46]. It can be seen that the numerical model results are in good agreement with the measured data of the flume test. The error between the model data and the experimental data was estimated and found to be within the range of no more than 10%. It is inevitable that numerical modeling produces errors compared to experiments, but the errors produced in this model are within acceptable limits.

4.1.2. Scour Time Course

In addition to verifying the flow velocity distribution, it is also necessary to verify the reasonableness of the selection of the granular bed data. Therefore, for the unprotected numerical model, the course of the maximum scour depth at the perimeter of the pile in the scouring process is extracted and compared with the test data over time. The results are shown in Figure 8, in which the horizontal coordinate is the ratio of the scour time to the simulation duration te. The final scour equilibrium depth achieved by the numerical model is about 85 mm, which is similar to the results obtained from the test. Additionally, it can be seen that the development of the scour depth of the numerical model is basically the same as the overall trend of the results of the flume test. The error between the model data and the experimental data was analyzed, and the maximum error generated during the whole process was about 9%, which is within the acceptable range. Therefore, the numerical model can be considered to better simulate the local scour process of the pile foundation, which can be further used in the study of the numerical model with a protection net.

4.2. Flow Field Disturbance

4.2.1. Flow Velocity

As shown in Figure 9, showing the local velocity cloud in the protection net part from Case 1 to Case 6, the size of the particle bed 700 mm × 700 mm is selected as the boundary and the velocity clouds at −50 mm, 50 mm and 150 mm are extracted in the longitudinal direction.
From Figure 9, it can be seen that, in the longitudinal scale within the protection range of the protection net, the flow velocity is smaller near the bottom. In the local velocity map of each layer, it can also be seen that the flow velocity inside the protection net is smaller than that outside the net, which initially confirms that the protection net reduces the flow velocity of the water. Comparing the velocity maps of different cases shows that the disturbance of the flow velocity is obviously larger when the permeable passage rate φ is smaller, as in Figure 9a (Case 1). The flow velocity inside the protection net is smaller than in other cases, but the flow velocity outside the protection net is also relatively larger. Correspondingly, the disturbance of the flow velocity is smaller when the permeable passage rate φ is larger, so the flow velocity is gently reduced both inside and outside the protection net, as in Figure 9f (Case 6).
To study the reduction degree of flow velocity by different φ values of protection net, the observation point of 30 mm in front and behind the protection net in front of the pile in the water-facing part of the pile in the direction of the water flow is selected to extract the distribution of the flow velocity in the z-axis direction of the point. The results are shown in Figure 10, where the graph is dimensionless, and where H is the height of the entire fluid domain. The minimum value of φ (φ = 0.681) is taken as an example for Case 1, and the maximum value of φ (φ = 0.802) is taken as an example for Case 6; meanwhile, the same position is also selected in Case 0, the observation position and results are shown in Figure 10, and below the reference line is the protection range of the protection net. It can be seen that, no matter whether the φ value is larger or smaller, the flow velocity is reduced to a greater extent in the protective range of the protection net and, by comparing the two conditions, it can be found that if the φ value is larger, the flow velocity is reduced to a greater extent. The average flow velocity at 30 mm after the protection net is not much different; the main difference is the flow velocity at 30 mm in front of the net, which is significantly smaller in Case 1 than in Case 6, mainly because the φ value of Case 1 is smaller. That is, that the tighter protection net will produce more disturbance to the flow field outside the protection net. In the same observation point, Case 1 has been affected by the relatively large impact at that place, so that the flow velocity has been reduced to less than Case 6 here. Therefore, a larger value of φ, as a sparser protection net, is more effective in reducing the flow velocity, and at the same time, the perturbation of the flow field can be controlled to a relatively small extent.

4.2.2. Streamline

In addition to reducing the flow velocity due to the protection net, changing the direction of the water flow can also weaken the scour to a certain extent and play the role of scour protection. The results of the extraction of the local streamline distribution in front of the pile foundation for Case 0, Case 1, and Case 6 in this model are shown in Figure 11, in which the reference lines I and II are the surface of the sand bed at the beginning of scouring and in the scouring equilibrium state, respectively.
In Figure 11a, showing the streamline distribution in front of the pile foundation without a protection net, it can be clearly seen that there is a large amplitude of downward water flow in the water-facing part in front of the pile foundation. For the granular bed, the water flow in this direction erodes the soil particles in the front of the side of the pile foundation and then flows along the side of the pile foundation and carries the soil particles to the back of the pile foundation. This is one of the main reasons for the formation of scour pits so, if the direction can be changed, it can also play a certain protective role in the granular bed. In the case of the protection net, as shown in Figure 11b,c, due to the existence of the protection net, there is a tendency for the water to dive before the protection net. Thus, the water will flow in the part before the pile foundation after the protection net and, although there is still a downward water flow, the amplitude is reduced to a certain extent compared with the absence of the protection net.
Now, the unprotected model is enlarged and observed at the place where the scour depth in front of the pile is the greatest, and it can be found that the angle of the downward flow at the reference line I is about 71° and the angle develops even more near the reference line II, reaching a degree close to the vertical. For the two cases with the protection net, two areas, A and B, are selected in front of the net and the pile, respectively, for further analysis. The value of φ for Case 1 is smaller, and it can be found that the deepest scour in this cross-section occurs in front of the net, where the angle of submerged water is about 63°, and the angle of submerged water in front of the pile, where the depth of the scour is smaller, is about 48°. The φ value for Case 6 is larger than it is for Case 1, where the depth of the scour is greater in the portion in front of the piles than in front of the nets, and the angle of the submerged flow in front of the nets is about 36°, while the angle of the submerged flow in front of the piles is about 60°. The angle of the submerged water in these two conditions is reduced to different degrees compared with that in the unprotected condition, and the overall trend of the scour depth decreases with the decrease in the submerged angle of the water. It has been proved that the protection net can change the direction of the water flow and cut down the submerged angle of the submerged water in the water-facing part. From the flow velocity component in the Z direction, it can be found that the place with the largest downward flow velocity of the submerged water tends to appear in the place with the largest submergence angle in front of the piles. The combination of these two factors makes a serious scouring phenomenon occur in front of the piles, and the protection net not only improves the submergence angle of the water flow but also attenuates the downward flow velocity of the water flow, which moderates the erosion of the submerged water flow on the granular bed and plays an effect in preventing scouring.

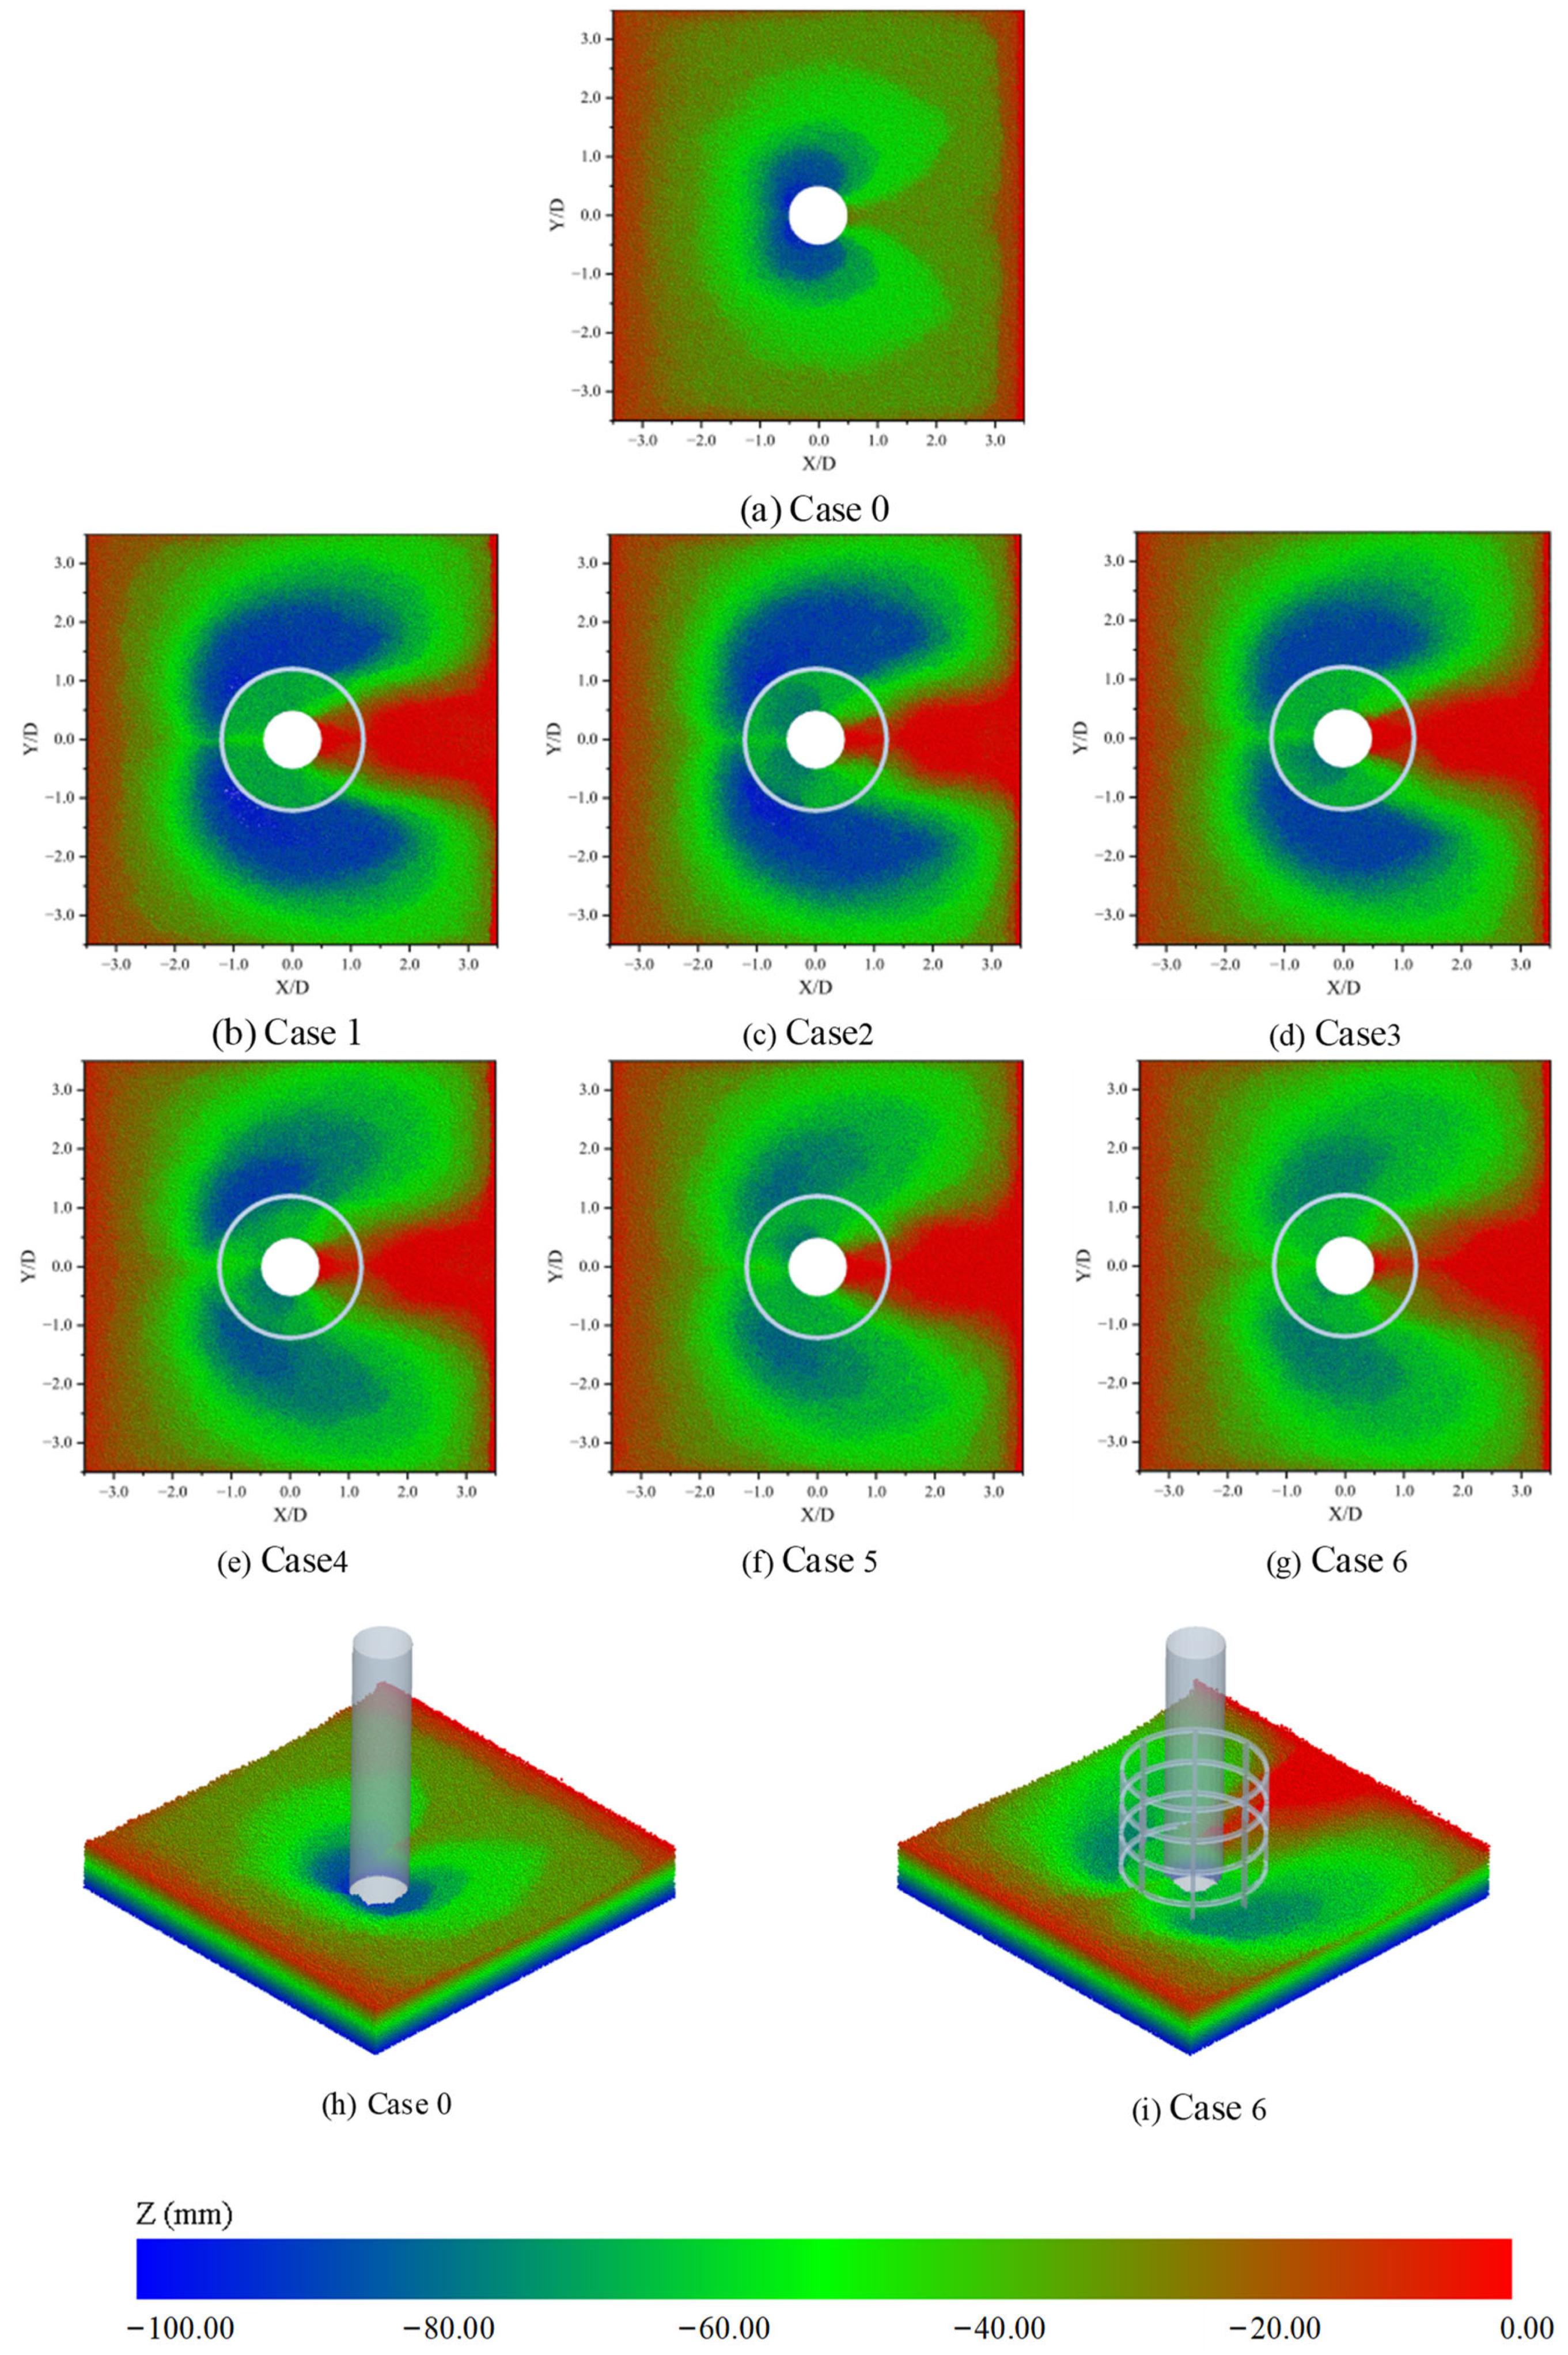
4.3. Morphology of Scour Pits

4.3.1. Pit Equilibrium Pattern

Figure 12 shows the equilibrium shape of the punching pit in different working conditions under a unidirectional flow. Due to the blocking effect of the pile foundation, the water reflects and decelerates in front of the pile to form submerged water, and the submerged water washes the bed to form the horseshoe-shaped vortex. The water flowing through the pile perimeter is accelerated in the lateral direction of the pile base due to the streamline contraction. After the scouring flow rate reaches the sediment starting flow rate, the sediment particles are rolled up to form the scouring pit due to the horseshoe vortex and the lateral water flow. Therefore, the scouring pit is mainly concentrated in a certain range around the pile foundation on the side facing the flow after reaching the scouring equilibrium, and the backwater part of the bed around the pile foundation is silted up by some of the sediment rolled up by the lateral flow due to the sheltering effect of the pile body, forming the siltation area.
When there is no protection net (Case 0), the size of the washout pit is small, and the symmetrical washout pits on the left and right are nearly through it. Due to the effect of the submerged water flow in front of the pile foundation and the accelerated bypassing flow on the side, deeper washout pits are formed on the parts immediately adjacent to the pile foundation. After the protection net is installed (Case 1~6), because of the energy-dissipation effect of the protection net, the submerged water flow through the net is weakened to a certain extent and, due to the existence of the protection net, the lateral flow line constriction is enhanced, so the size of the washout pit is larger, the depth of the washout pit is reduced, and the accumulation of sediment behind the pile is enhanced. Comparing working conditions 1~6 shows that, with the increase in the area of the protection net cell, the permeability rate φ also increases, the energy dissipation effect of the protection net is enhanced, the strength of the horseshoe vortex is weakened, and the depth of erosion is reduced when the equilibrium state is reached.

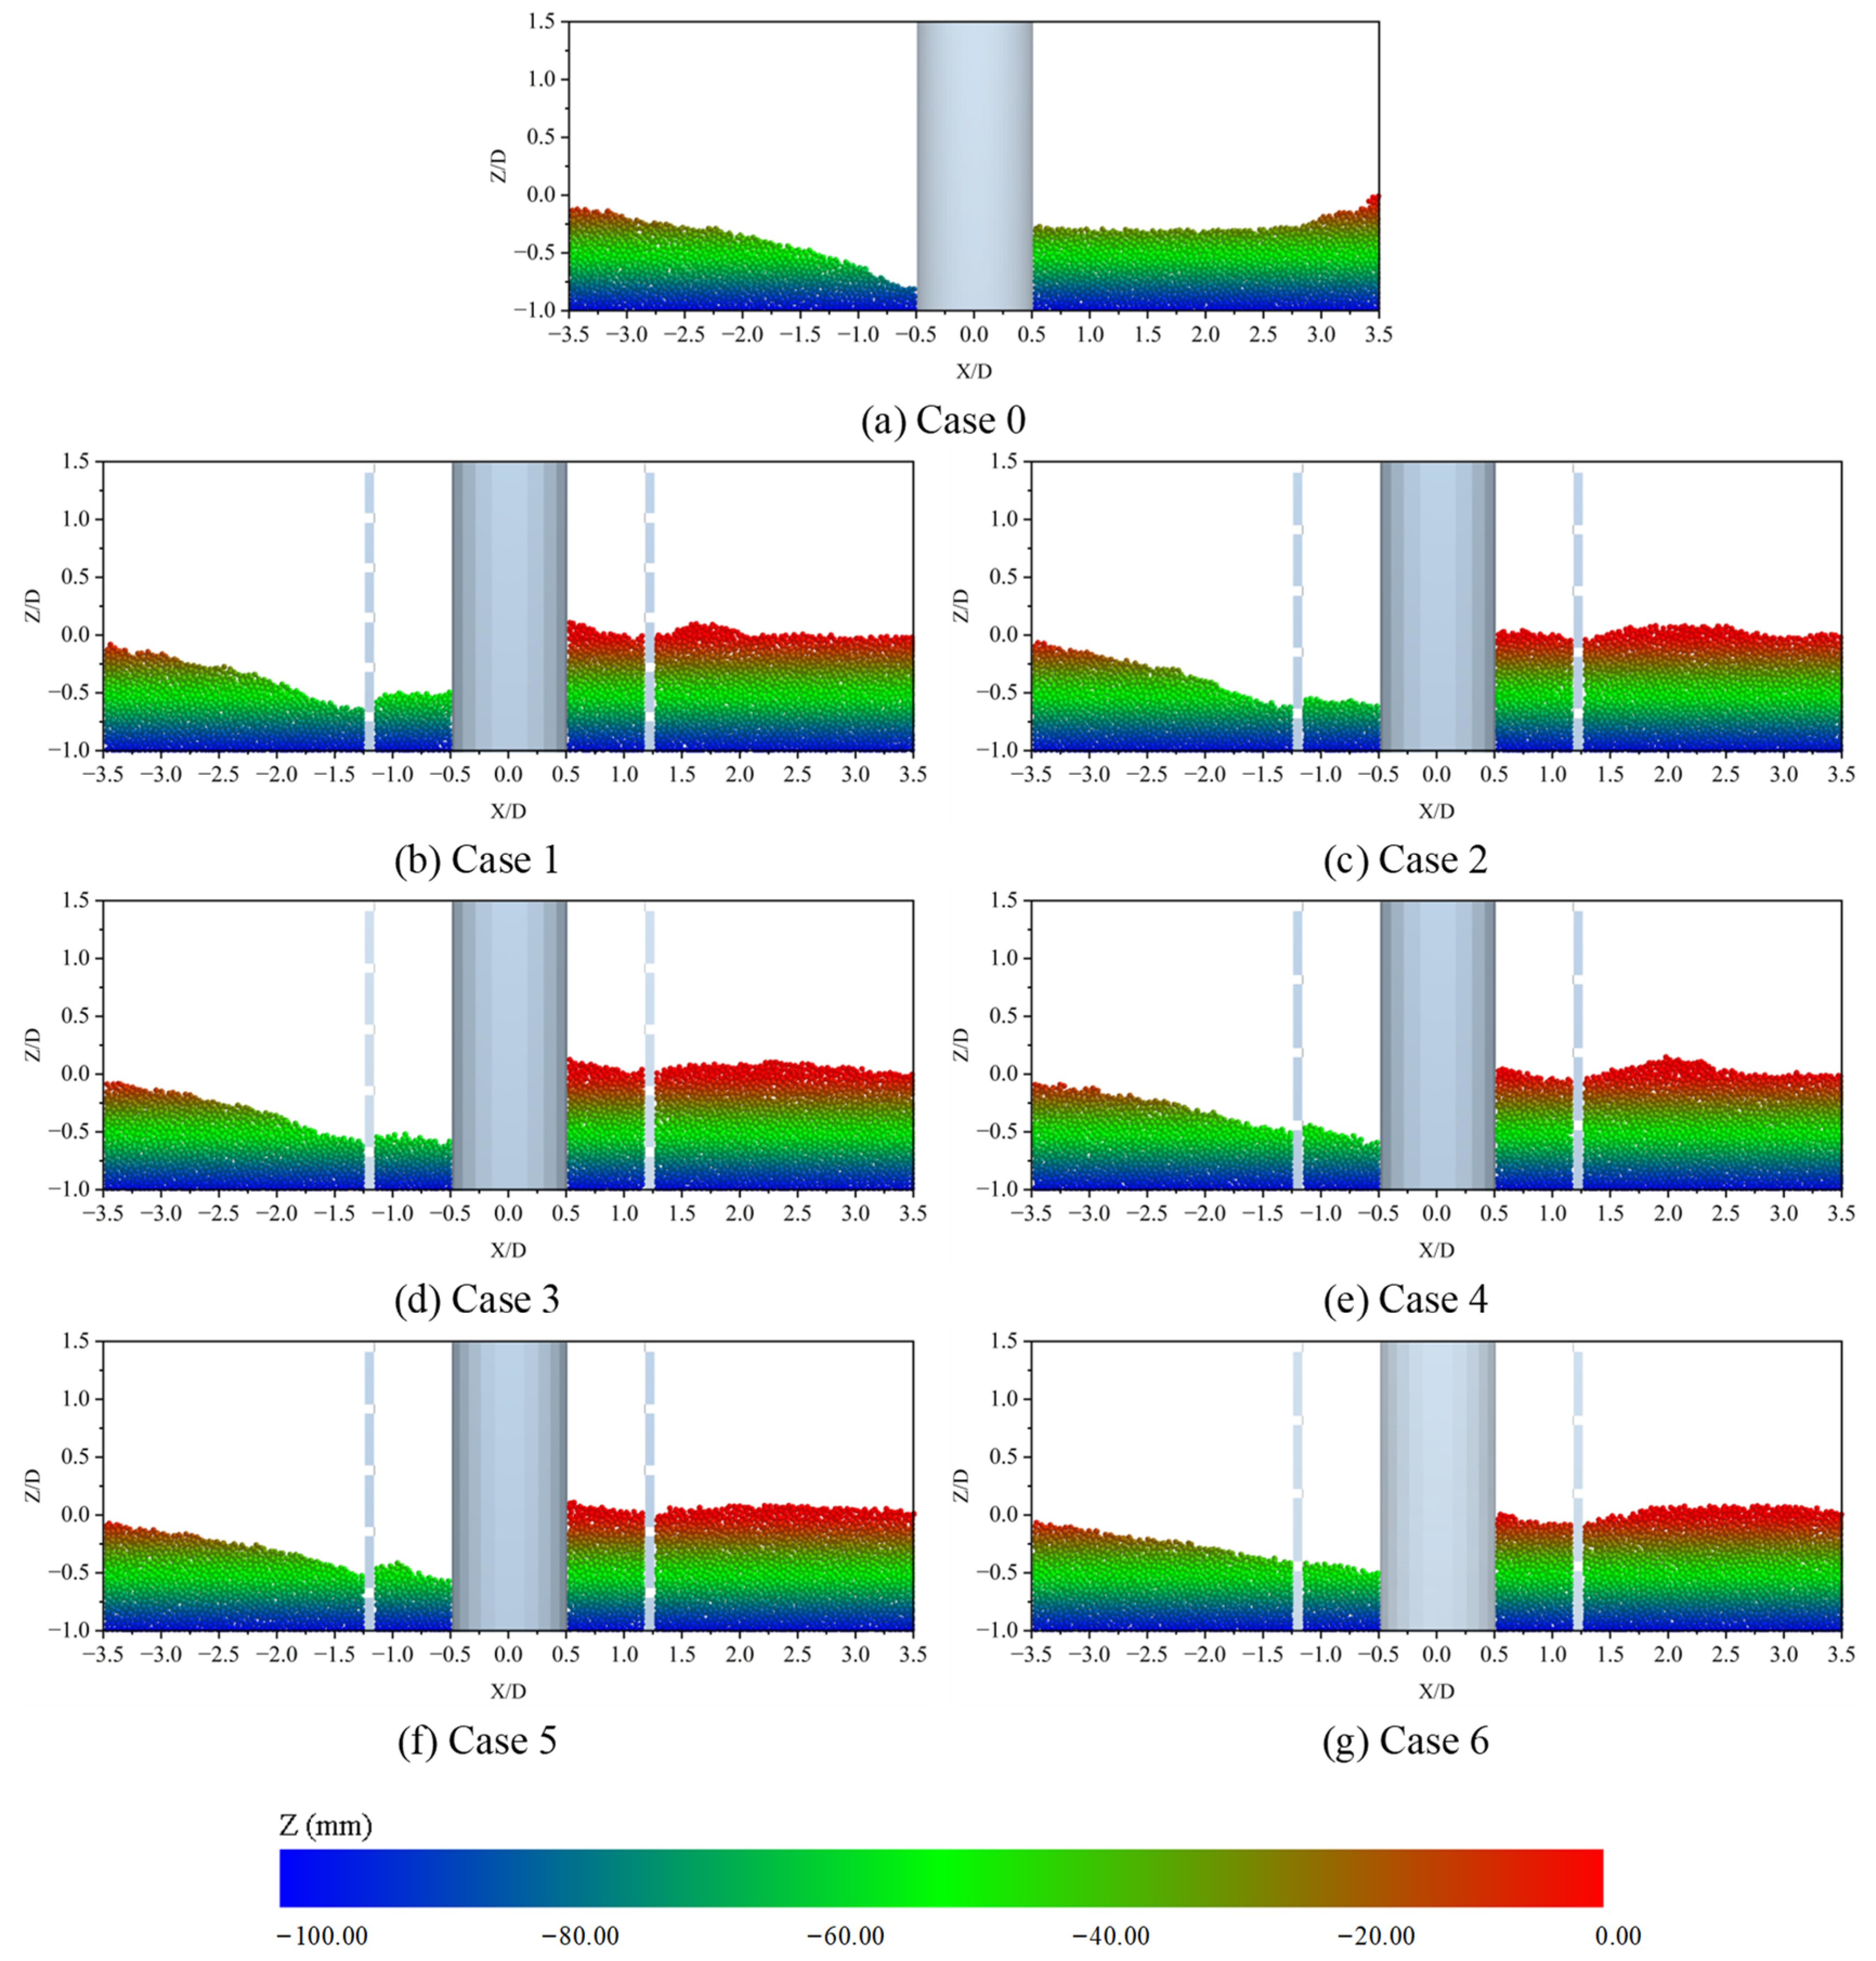
4.3.2. The Profile of the Puddle

In Figure 13, showing the profile of the scour slope at 0° in front of the pile, i.e., directly in front of the water-facing part, it can be clearly seen that the intensity of the downward water flow, driven by strong pressure in front of the pile foundation, can be weakened by installing the protection net, and the sheltering effect at the back of the pile foundation will be enhanced as well. With the increase in permeability φ, the reflected water flow generated on the outer side of the protection net is also weakened to a certain extent, and the depth of the scour pits on both the inner and outer sides of the protection net will be reduced.
Compared with the scour pit profile in front of the pile, the 45° scour slope profile in front of the pile changes more obviously with the value of φ, as shown in Figure 14. According to the scour pit equilibrium pattern in Figure 12, it can be found that the maximum scour pit depth is about 45° in front of the pile or in front of the net, and the protection net will increase the lateral flow constriction effect and increase the size of the scour pit. However, it will weaken the strength of the lateral bypass flow, and the deepest part of the lateral washout pit is located at the bottom of the protection net. As the permeability rate φ increases, the depth of the washout inside the mesh becomes relatively small and maintains a good protective effect. The depth of scour outside the net changes a lot, especially in cases 1~3, and obvious faults can be seen in the profile. After the value of φ continues to increase, the profile morphology becomes closer and closer to the natural state of the scour pits when there is no protection net, which is also in line with the law that, the larger the value of φ, the smaller the perturbation of the flow field.

4.4. Development of Scour Depth

In Figure 15, inside and outside the network, the deepest areas of scour pits are generally in the shaded portion of the figure. In the shaded area, scour depth data extraction was performed on the scour pit. The results are shown in Figure 16 and Figure 17, where the graphs are dimensionless and Hp is the height of the particle bed. From the time course of the scour depth development in Figure 16 and Figure 17, it can be seen that, in the initial stage of pile scour development, the intensity of the water flow in the vicinity of the piles and the protection net increases. As a result, the scour depth develops rapidly, and a large scour depth is produced in a short time. In a certain period of time, the scouring speed inside the protection net even exceeds the scouring speed on the outside of the protection net. This is mainly because the horseshoe vortex in front of the pile provides the main local scouring force on the seabed. The protection net restricts the activity range of the horseshoe vortex in the net, and the vortex energy is also concentrated in the protection net, which increases the local bed shear stress in the inner side of the protection net. The bed surface in front of the pile in the protection net was first scoured, and the sediment accumulated behind the pile and then was taken out of the protection net. As the scouring process proceeds, a height difference gradually forms, and the energy behind the piles in the protection net is not enough to lift most of the sediment particles to that height and cannot continue to transport sediment outside the net, resulting in a slowdown of the scour rate inside the net, so equilibrium is reached more quickly. On both sides of the protection net, the net scouring depth starts to be generated, and the scouring speed outside the protection net also slows down gradually due to the limited reflection and bypassing effect outside the protection net.
Comparing the development of the scour depth under different working conditions, with the increase in permeability rate φ, the scour depth outside the protection net gradually decreases, and the scour depth inside the protection net shows an increasing and then a decreasing trend.

4.5. Protection Efficiency

4.5.1. Reduction Rate of Maximum Scour Depth

To analyze the protection efficiency of the protection net in general, based on the maximum depth-of-impact reduction η for different protection network conditions compared to the unprotected condition, the results obtained are shown in Figure 18. When φ is small, such as in Case 1 and Case 2, the flow field outside the net is disturbed, so the scour depth outside the net increases compared with that under the unprotected condition. However, inside the net, the flow velocity is greatly reduced, so the protection effect inside the net is better. The reduction rate of the maximum scour depth is more than 20%. Especially for Case 1, the reduction rate inside the net is 28.18%, which is the highest among all the cases. Correspondingly, the maximum negative effect occurs outside the net in this case. As the value of φ increases, the influence of the protection net on the outer area of the net gradually decreases, so the maximum reduction rate of the scour depth outside the net also increases and, when the value of φ reaches 0.745, the maximum reduction rate of the scour depth outside the net becomes positive, as the scour depth outside the net is no longer deepened. The in-network shows the opposite trend to the out-network but, after the value of φ increases to a certain extent, the maximum depth-reduction rate in the in-network also rises, as in Case 5 and Case 6. This is mainly due to the fact that the scour depth inside the net is limited by the flow field, as well as by the net itself, especially when the value of φ is small. For example, obvious faults inside and outside the net can be seen from the graph of the washout pit morphology in Case 6 so, when the value of φ increases gradually, the scour depth is deepened along with the increase in φ. However, after the value of φ is further increased, the main factor affecting the depth of the scour in the net becomes the flow field. The limiting effect of the protection net on the particles is weakened, and the depth of scour inside and outside the net is not an obvious fault. Because the disturbance of the protection net on the flow field is small at this time, the depth of the scour is instead reduced, and the scouring from Case 5 to Case 6 is deepened again, which follows the law that, the larger value of φ, the more the depth of scour increases.
Generally speaking, after setting up the protection net, the area inside the net has a better scour-resistance effect, which is more than 15%, while the outside of the net is more affected by the value of φ and even has a negative effect when the value of φ is small. Therefore, considering the maximum rate of scour depth reduction inside and outside the net, it can be concluded that, within the range of the φ value in Cases 1~6, the larger the value of φ, the better the scouring effect of the protection net.

4.5.2. Particle Loss Rate

To study the anti-scouring effect of the protection net in a more detailed way, taking Case 0, Case 1, and Case 6 as examples, three prismatic observation areas were selected that are centered on the center of the cross-section of the protection net, with clockwise angles of 0°, 45°, 90°, and close to the outside of the protection net, as shown in Figure 19. For the case of the unprotected net, the area immediately adjacent to the pile foundation was selected. The size of the measurement area is 20 × 20 × 100 mm, and the rate of particle loss within this area is studied.
The results are shown in Figure 20, where N is the number of particles in the observation area during the scouring process, and N0 is the initial number of particles in the observation area. It can be seen that, in the absence of a protection net, all three observation areas have a fast particle loss rate at the beginning, and then the particles almost no longer change after the equilibrium state is reached quickly. For Case 1, although the final scour is greater at 45° and 90°, the net slows down the rate of equilibrium, while Case 6 has a better result, not only in slowing down the rate of particle loss but also in improving the final scour result. Comprehensive observation of Case 1 and Case 6 with the protection net shows that, although the φ values of the two are quite different, the protection net slows down the particle loss rate near the net to different degrees, especially in the observation area of 0° in front of the net, which reflects the anti-scouring effect of the protection net.

5. Conclusions

This study proposed a new type of anti-scour protection net for the scour phenomenon occurring in offshore wind power pile foundations, and a local scour model of pile foundation with protection net was established based on the CFD-DEM method. The overwatering characteristics of the protection net were characterized by the permeability rate, six different working conditions of the protection net were examined with this as a variable, and numerical simulations were carried out. Then, this study analyzed and discussed the influence of different levels of water permeability on the flow field around the pile and the sand bed at the bottom and summarized the rule governing the change in protection efficiency with water permeability. The following main conclusions can be drawn.
(1) In terms of protection mechanisms, the protection net achieves the purpose of scour protection by reducing the water flow rate and changing the direction of water flow. The study of different cases of flow velocity and streamlines showed that the protection net not only reduces the flow velocity of water around the pile but also weakens the strength of the submerged water flow in front of the piles and reduces the occurrence of the scour phenomenon by combining the influences of various aspects.
(2) In terms of the protection effect, a larger permeability of the protection net has a better protective effect on the sediment seabed of the pile foundation. In terms of the morphology of the scour pits, the protection net expands the scope of the scour pits and changes the scour pit morphology to a certain extent. However, in terms of the development of the scour depth, the protection net greatly reduces the scour depth inside the net. The scour depth outside the net, on the other hand, shows a tendency to increase and then decrease with an increase in the permeability rate. Finally, in terms of protection efficiency, it was shown that the protection net is consistently more effective in protecting the inside of the net. However, the protective effect on the outside of the net is greatly influenced by the permeability rate, and the larger its value, the better the protective effect on the outside of the net.
Overall, the protection net has a certain degree of reduction in the scour phenomenon occurring in the pile foundation part, and the larger the water permeability rate of the net, the better the effect of scour prevention. However, the research in this paper faced the following problems:
(1) The design of the protection net still needs to be optimized. On the one hand, the existence of the protection net expands the range of influence of the scour pit. When the permeability rate is low, the protection net will bring some negative impact on the scour protection of the area outside the net. This is mainly because, when the permeability is small, the protection net is close to a larger cylinder, which can lead to stronger downflow and horseshoe vortexes. Furthermore, there is a risk that the holes in the protection net will be blocked, which will greatly affect the application effect and service life of the net. Therefore, it is still necessary to optimize the structure of the protection net.
(2) The numerical model needs to be optimized. In this model, only unidirectional-flow clear-water scour was considered, but there are many elements that affect scour, including wave interactions and the state of the sedimentary seabed. Therefore, further improvements to the model are needed to explore scour protection in more complex environments. In addition, the turbulence model and coupling methods used in the model need to be updated and optimized.
(3) Numerical simulations have limitations. The research in this paper is based on numerical simulation, but it is quite different from the actual engineering and can only provide a framework and trend prediction. The performance of protective countermeasures still needs to be supported by the results of large-volume flume tests if they are to be studied with greater confidence.

Author Contributions

Resources—N.Z., S.Y., C.G., J.Z. and F.K.; project administration—N.Z. and C.G.; conceptualization—S.Y., J.Z. and F.K.; formal analysis—B.Y., W.Z. and G.Q.; writing—original draft, B.Y., W.Z. and G.Q.; writing—review and editing, N.Z. and C.G. All authors have read and agreed to the published version of the manuscript.

Funding

This research was funded by the National Natural Science Foundation of China (grant number U2106224, U1906234, 52278385, and 51974124), and the APC was funded by the National Natural Science Foundation of China (grant number U2106224).

Institutional Review Board Statement

Not applicable.

Informed Consent Statement

Not applicable.

Data Availability Statement

Data are contained within the article.

Conflicts of Interest

The authors declare no conflicts of interest.

References

  1. Rowell, D.; McMillan, D.; Carroll, J. Offshore wind H&S: A review and analysis. Renew. Sustain. Energy Rev. 2024, 189, 113928. [Google Scholar] [CrossRef]
  2. Seyr, H.; Muskulus, M. Safety Indicators for the Marine Operations in the Installation and Operating Phase of an Offshore Wind Farm. Energy Procedia 2016, 94, 72–81. [Google Scholar] [CrossRef]
  3. Du, Z.; Liu, Z.; Zhou, Q.; Zhao, Y.; Sun, Z.; Li, L. Research on process safety of offshore wind turbines installation: A theoretical model and empirical evidence. Process Saf. Environ. Prot. 2024, 181, 493–501. [Google Scholar] [CrossRef]
  4. Gazi, A.H.; Afzal, M.S. A review on hydrodynamics of horseshoe vortex at a vertical cylinder mounted on a flat bed and its implication to scour at a cylinder. Acta Geophys. 2020, 68, 861–875. [Google Scholar] [CrossRef]
  5. Tafarojnoruz, A.; Lauria, A. Large eddy simulation of the turbulent flow field around a submerged pile within a scour hole under current condition. Coast. Eng. J. 2020, 62, 489–503. [Google Scholar] [CrossRef]
  6. Guan, D.-W.; Xie, Y.-X.; Yao, Z.-S.; Chiew, Y.-M.; Zhang, J.-S.; Zheng, J.-H. Local scour at offshore windfarm monopile foundations: A review. Water Sci. Eng. 2022, 15, 29–39. [Google Scholar] [CrossRef]
  7. Amini, A.; Mohammad, T.A. Local scour prediction around piers with complex geometry. Mar. Georesources Geotechnol. 2017, 35, 857–864. [Google Scholar] [CrossRef]
  8. Saha, R.; Lee, S.O.; Hong, S.H. A Comprehensive Method of Calculating Maximum Bridge Scour Depth. Water 2018, 10, 1572. [Google Scholar] [CrossRef]
  9. Dai, G.; Gao, L.; Chen, X.; Wan, Z.; Zhu, M.; Du, S. A Calculation Model of the Equilibrium Scour Depth for Monopile Foundations Under Waves and Currents. Arab. J. Sci. Eng. 2021, 46, 5023–5029. [Google Scholar] [CrossRef]
  10. Sharafati, A.; Tafarojnoruz, A.; Yaseen, Z.M. New stochastic modeling strategy on the prediction enhancement of pier scour depth in cohesive bed materials. J. Hydroinform. 2020, 22, 457–472. [Google Scholar] [CrossRef]
  11. Zhang, F.; Chen, X.; Yan, J.; Gao, X. Countermeasures for local scour around offshore wind turbine monopile foundations: A review. Appl. Ocean Res. 2023, 141, 103764. [Google Scholar] [CrossRef]
  12. Tafarojnoruz, A.; Gaudio, R.; Dey, S. Flow-altering countermeasures against scour at bridge piers: A review. J. Hydraul. Res. 2010, 48, 441–452. [Google Scholar] [CrossRef]
  13. Zhang, Z. Study on Local Scour Protection Countermeasures of Bridge Pier. Highlights Sci. Eng. Technol. 2022, 28, 464–470. [Google Scholar] [CrossRef]
  14. Pagliara, S.; Carnacina, I.; Cigni, F. Sills and gabions as countermeasures at bridge pier in presence of debris accumulations. J. Hydraul. Res. 2010, 48, 764–774. [Google Scholar] [CrossRef]
  15. Chen, J.; Qu, Y.; Sun, Z. Protection mechanisms, countermeasures, assessments and prospects of local scour for cross-sea bridge foundation: A review. Ocean Eng. 2023, 288, 116145. [Google Scholar] [CrossRef]
  16. Zhang, F.; Chen, X.; Feng, T.; Wang, Y.; Liu, X.; Liu, X. Experimental study of grouting protection against local scouring of monopile foundations for offshore wind turbines. Ocean Eng. 2022, 258, 111798. [Google Scholar] [CrossRef]
  17. Nishold, S.S.P.; Sundaravadivelu, R.; Saha, N. Physical model study on geo-tube with gabion boxes for the application of coastal protection. Arab. J. Geosci. 2019, 12, 164. [Google Scholar] [CrossRef]
  18. Zhu, Y.; Xie, L.; Su, T.-C. Scour Protection Effects of a Geotextile Mattress with Floating Plate on a Pipeline. Sustainability 2020, 12, 3482. [Google Scholar] [CrossRef]
  19. Zhang, Y.; Lai, X.; Jiang, J. The impact of plant morphology on flow structure: Comparative analysis of two types of submerged flexible macrophyte. Hydrol. Sci. J. 2016, 61, 2226–2236. [Google Scholar] [CrossRef]
  20. Fu, C.; Wang, J.; Zhao, T.; Xu, Y.; Lv, Y. Experimental Study on Flow Velocity Structure and Turbulence Characteristics in Open Channel with Biomimetic Grass. Adv. Civ. Eng. 2021, 2021, 6660256. [Google Scholar] [CrossRef]
  21. Ma, C.; Sheng, C.; Lian, J.; Liu, F. Solidification sludge as a scour countermeasure in ocean engineering. Ocean Eng. 2022, 244, 110423. [Google Scholar] [CrossRef]
  22. Hu, R.; Lu, Y.; Leng, H.; Liu, H.; Shi, W. A novel countermeasure for preventing scour around monopile foundations using Ionic Soil Stabilizer solidified slurry. Appl. Ocean Res. 2022, 121, 103121. [Google Scholar] [CrossRef]
  23. Xu, Y.; Valyrakis, M.; Gilja, G.; Michalis, P.; Yagci, O.; Przyborowski, Ł. Assessing Riverbed Surface Destabilization Risk Downstream Isolated Vegetation Elements. Water 2022, 14, 2880. [Google Scholar] [CrossRef]
  24. Li, Y.; Guo, Z.; Wang, L.; Yang, H.; Li, Y.; Zhu, J. An Innovative Eco-friendly Method for Scour Protection around Monopile Foundation. Appl. Ocean Res. 2022, 123, 103177. [Google Scholar] [CrossRef]
  25. Wang, C.; Liang, F.; Yu, X. Experimental and numerical investigations on the performance of sacrificial piles in reducing local scour around pile groups. Nat. Hazards 2017, 85, 1417–1435. [Google Scholar] [CrossRef]
  26. Wang, Y.; Shen, X.; Chen, J.; Chen, Z.; Liu, J. Research on the Wing-Type Antiscour Device of Pier Based on Scour Test and Numerical Simulation. Adv. Civ. Eng. 2021, 2021, 2491707. [Google Scholar] [CrossRef]
  27. Javidi Vahdati, V.; Ahmadi, A.; Abedini, A.; Heidarpour, M. Efficacy of the Combined Use of Bed Sill and Sacrificial Piles to Control Local Scour around Circular Bridge Piers. Shock. Vib. 2024, 2024, 5527946. [Google Scholar] [CrossRef]
  28. Ibrahim, M.M.; Refaey, M.A.; Hashem, H.M.; Ibraheem, A.M. Evaluation of angled splitters as scour countermeasure at circular piers. Alex. Eng. J. 2023, 74, 481–494. [Google Scholar] [CrossRef]
  29. Wang, S.; Wei, K.; Shen, Z.; Xiang, Q. Experimental Investigation of Local Scour Protection for Cylindrical Bridge Piers Using Anti-Scour Collars. Water 2019, 11, 1515. [Google Scholar] [CrossRef]
  30. Zarrati, A.R.; Gholami, H.; Mashahir, M.B. Application of collar to control scouring around rectangular bridge piers. J. Hydraul. Res. 2004, 42, 97–103. [Google Scholar] [CrossRef]
  31. Tang, Z.; Melville, B.; Shamseldin, A.; Guan, D.; Singhal, N.; Yao, Z. Experimental study of collar protection for local scour reduction around offshore wind turbine monopile foundations. Coast. Eng. 2023, 183, 104324. [Google Scholar] [CrossRef]
  32. Gupta, L.K.; Pandey, M.; Raj, P.A. Impact of airfoil collar on scour reduction around the bridge pier. Ocean Eng. 2023, 290, 116271. [Google Scholar] [CrossRef]
  33. Zhang, Q.; Tang, G.; Lu, L.; Yang, F. Scour protections of collar around a monopile foundation in steady current. Appl. Ocean Res. 2021, 112, 102718. [Google Scholar] [CrossRef]
  34. Luo, K.; Si, Y.; Lu, S.; Liang, B.; Qi, H. Characteristics of reducing local scour around cylindrical pier using a horn-shaped collar. J. Eng. Appl. Sci. 2022, 69, 105. [Google Scholar] [CrossRef]
  35. Li, H.; Qiu, X.; Yan, S.; Zhao, H.; Ma, W. Numerical investigation on the influence of a spoiler structure for local scour protection. Appl. Ocean Res. 2023, 138, 103675. [Google Scholar] [CrossRef]
  36. Li, J.; Lian, J.; Guo, Y.; Wang, H.; Yang, X. Numerical study on scour protection effect of monopile foundation based on disturbance structure. Ocean Eng. 2022, 248, 110856. [Google Scholar] [CrossRef]
  37. Xie, L.; Yu, Y.; Li, H.; Jin, P. Experimental Investigation of Local Scour Protection Using Cuboid Pore Structures. Iran. J. Sci. Technol. Trans. Civ. Eng. 2022, 46, 3895–3904. [Google Scholar] [CrossRef]
  38. Yang, M.; Tang, Y.; Zhao, F.; Xu, S. Numerical simulation of offshore wind power pile foundation scour with different arrangements of artificial reefs. Front. Mar. Sci. 2023, 10, 1178370. [Google Scholar] [CrossRef]
  39. Tafarojnoruz, A.; Gaudio, R.; Calomino, F. Evaluation of Flow-Altering Countermeasures against Bridge Pier Scour. J. Hydraul. Eng. 2012, 138, 297–305. [Google Scholar] [CrossRef]
  40. El Geitani, T.; Golshan, S.; Blais, B. Toward High-Order CFD-DEM: Development and Validation. Ind. Eng. Chem. Res. 2023, 62, 1141–1159. [Google Scholar] [CrossRef]
  41. Kuruneru, S.T.W.; Marechal, E.; Deligant, M.; Khelladi, S.; Ravelet, F.; Saha, S.C.; Sauret, E.; Gu, Y. A Comparative Study of Mixed Resolved–Unresolved CFD-DEM and Unresolved CFD-DEM Methods for the Solution of Particle-Laden Liquid Flows. Arch. Comput. Methods Eng. 2019, 26, 1239–1254. [Google Scholar] [CrossRef]
  42. Mindlin, R.D.; Deresiewicz, H. Elastic Spheres in Contact Under Varying Oblique Forces. J. Appl. Mech. 2021, 20, 327–344. [Google Scholar] [CrossRef]
  43. Gidaspow, D. Multiphase Flow and Fluidization: Continuum and Kinetic Theory Description. Multiph. Flow Fluid. Contin. Kinet. Theory Descr. 1994, 42, 1197–1198. [Google Scholar]
  44. Liu, Q.; Wang, Z.; Zhang, N.; Zhao, H.; Liu, L.; Huang, K.; Chen, X. Local Scour Mechanism of Offshore Wind Power Pile Foundation Based on CFD-DEM. J. Mar. Sci. Eng. 2022, 10, 1724. [Google Scholar] [CrossRef]
  45. Xu, Y. Experimental Investigation of Scour around Vertical Piles in Steady Currents; Dalian University of Technology: Dalian, China, 2018. [Google Scholar]
  46. Liu, D.; Alobaidi, K.; Valyrakis, M. The assessment of an acoustic Doppler velocimetry profiler from a user’s perspective. Acta Geophys. 2022, 70, 2297–2310. [Google Scholar] [CrossRef]
Figure 1. Schematic diagram of monopile foundation with protection net.
Jmse 12 00692 g001
Figure 2. Hertz–Mindlin no-slip model.
Jmse 12 00692 g002
Figure 3. Overall schematic of the geometric model (unit: mm).
Jmse 12 00692 g003
Figure 4. Localized schematic of the protection net and seabed model.
Jmse 12 00692 g004
Figure 5. Local meshing results for pile foundation and protection net.
Jmse 12 00692 g005
Figure 6. Localized structure of the protection net.
Jmse 12 00692 g006
Figure 7. Dimensionless mean flow velocity distribution.
Jmse 12 00692 g007
Figure 8. Time course of maximum scour depth.
Jmse 12 00692 g008
Figure 9. Localized velocity cloud of the protection net.
Jmse 12 00692 g009
Figure 10. Flow velocity distribution before and after the protection net.
Jmse 12 00692 g010
Figure 11. Localized streamlines in front of the pile.
Jmse 12 00692 g011
Figure 12. Scour equilibrium patterns of scour pits in different cases.
Jmse 12 00692 g012
Figure 13. Profile of 0° scour slope in front of the pile.
Jmse 12 00692 g013
Figure 14. Profile of the 45° scour slope in front of pile.
Jmse 12 00692 g014
Figure 15. Approximate area of the maximum scour depth inside and outside the net.
Jmse 12 00692 g015
Figure 16. Time course of the maximum scour depth outside the net.
Jmse 12 00692 g016
Figure 17. Time course of maximum scour depth inside the net.
Jmse 12 00692 g017
Figure 18. Reduction rate of the maximum scour depth for different values of φ.
Jmse 12 00692 g018
Figure 19. Schematic representation of selected observation areas in the granular bed.
Jmse 12 00692 g019
Figure 20. Development of particle loss over time.
Jmse 12 00692 g020
Table 1. Discrete element method (DEM) parameters and parameter values.
Parameter NameParameter Value
Particle size d (mm)5
Poisson’s ratio v0.35
Density ρp (kg/m3)2670
Shear modulus G (Pa)5 × 10⁶
Collision recovery coefficient e0.45
Coefficient of static friction μs0.65
Coefficient of rolling friction μr0.01
Time step (s)5 × 10⁻⁵
Data saving interval (s)0.1
Table 2. Computational fluid dynamics (CFD) parameters and parameter values.
Parameter NameParameter Value
Grid cell size (mm)8~18
Inlet mean velocity (m/s)0.92
Outlet relative pressure (Pa)0
Fluid density ρf (kg/m3)1000
Fluid dynamic viscosity ν (Pa·s)1 × 10⁻³
Absolute convergence residual1 × 10−3
Time step (s)5 × 10⁻³
Number of simulation time step10,000
Table 3. Numerical simulation cases and parameter values.
CasesPile Diameter D
(mm)
Diameter of Protection Net Dn
(mm)
Net Cell
Width b (mm)
Net Cell
Height h (mm)
Net Structure
Cross-Sectional Dimensions d (mm)
Permeability Rate φ
case 0100-----
case 110025041.0873580.681
case 210025041.0874580.711
case 310025057.4504580.745
case 410025057.4505580.766
case 510025090.1754580.780
case 610025090.1755580.802
Table 4. Comparison of test and model scour conditions.
ParameterV1D3 TestCFD-DEM
Diameter of pile D (m)0.10.1
Average flow velocity V (m/s)0.2860.92
Traveling water depth H (m)0.40.4
Median grain size of sediment d50 (mm)0.295
Natural angle of repose of sediment (°)3333
Shields number θ0.0350.048
Critical Shields number θcr0.0380.052
θ/θcr0.920.92
Disclaimer/Publisher’s Note: The statements, opinions and data contained in all publications are solely those of the individual author(s) and contributor(s) and not of MDPI and/or the editor(s). MDPI and/or the editor(s) disclaim responsibility for any injury to people or property resulting from any ideas, methods, instructions or products referred to in the content.

