Article

Controls on Deep and Shallow Gas Hydrate Reservoirs in the Dongsha Area, South China Sea: Evidence from Sediment Properties

1
Key Laboratory of Polar Geology and Marine Mineral Resources, Ministry of Education, China University of Geosciences (Beijing), Beijing 100083, China
2
Laboratory for Marine Mineral Resources, Laoshan Laboratory, Qingdao 266237, China
3
School of Ocean Sciences, China University of Geosciences (Beijing), Beijing 100083, China
4
Qingdao Institute of Marine Geology, China Geological Survey, Qingdao 266237, China
*
Authors to whom correspondence should be addressed.
J. Mar. Sci. Eng. 2024, 12(5), 696; https://doi.org/10.3390/jmse12050696
Submission received: 28 March 2024 / Revised: 15 April 2024 / Accepted: 20 April 2024 / Published: 23 April 2024
(This article belongs to the Special Issue Advances in Marine Gas Hydrate Exploration and Discovery)

Abstract

:
The Dongsha area, a key region in the northern South China Sea (SCS), features both diffusive deep and seepage shallow gas hydrate reservoirs. Utilizing sediment samples from gas hydrate reservoirs and adjacent layers at sites W08 and W16 in the Dongsha area, this study aims to uncover the sediment property differences between deep and shallow gas hydrate reservoirs and their impact on gas hydrate accumulation through grain size, X-ray diffraction, and specific surface area (SSA) analyses. The findings classify the study intervals into four distinct layers: shallow non-gas hydrate layer (shallow-NGHL), shallow gas hydrate reservoir (shallow-GHR), deep non-gas hydrate layer (deep-NGHL), and deep gas hydrate reservoir (deep-GHR). In the clayey silt sediment reservoirs, grain size has a minor influence on gas hydrate reservoirs. Both shallow and deep NGHLs, characterized by high smectite content and SSA, possess a complex structure that impedes gas and fluid migration and offers limited potential reservoir space. Consequently, both shallow and deep NGHLs function as sealing beds. The deep GHR, having low smectite content and SSA, exhibits a strong capacity for gas and fluid migration and greater potential reservoir space. As a result, sediment properties significantly influence the deep GHR. Seepage primarily controls the shallow GHR.

1. Introduction

Gas hydrates are increasingly recognized as a promising clean energy alternative to traditional fossil fuels, due to their abundant reserves and high thermal efficiency [1,2,3]. Meanwhile, the environmental impacts and geohazards resulting from gas hydrate decomposition are increasingly the focus of research [4,5,6,7]. Gas hydrate reservoirs are located globally in permafrost and marine sediments, including the Malik in Canada [8], the Qilian Mountains in western China [9], the Alaminos Canyon [10], the Cascadia subduction zone [11], the Hikurangi Margin of New Zealand [12], the northern South China Sea (SCS) [13], the Nankai Trough [14], the Ulleung Basin [15], and the Krishna–Godavari Basin [16]. Most gas hydrates globally are found in seafloor sediments. However, the northern SCS’s gas hydrates are found in clayey silt, a sediment significantly finer than the well-studied sandy gas hydrate reservoirs [13,17,18]. Most of offshore gas hydrates are located in fine-grained sediments [10,19]. Successful trial productions in the northern SCS during 2017 and 2020 demonstrated the feasibility of recovering and utilizing gas hydrate resources in fine-grained sediments [13,20,21]. Nevertheless, further research is required on the theory of gas hydrate accumulation in fine-grained sediment reservoirs.
The Dongsha area is a critical zone for gas hydrate exploration in the northern SCS. Geophysical techniques, including seismic and logging data analysis, have characterized gas hydrate reservoirs in the Dongsha area [22,23,24,25]. Several studies have synthesized diverse gas hydrate accumulation models on a macroscale [25,26,27,28]. In the Dongsha area, there are two types of gas hydrate reservoirs: deep (below approximately 60 m below the seafloor [mbsf]) and shallow (within approximately 25 mbsf). High-flux methane seepage predominantly influences shallow reservoirs, while low-flux methane diffusion primarily governs deep reservoirs [26]. At the macroscale, methane flux and migration pathways, including fractures and gas chimneys, dictate gas hydrate accumulation. However, the determinants and mechanisms behind gas hydrate accumulation at the microscale, especially in fine-grained reservoirs, are still not well understood. Prior research has demonstrated that sediment properties influence gas hydrate accumulation. Generally, an increase in coarse-grained components within sediments positively impacts gas hydrate accumulation [3,14,29,30,31]. However, research in the Shenhu area of the northern SCS revealed that sediment properties’ influence on gas hydrates in fine-grained sediment reservoirs differs from their impact in sandy gas hydrate reservoirs. The controlling effect of grain size on gas hydrate accumulation is weaker than that of sedimentary processes or mineral composition [32,33]. The Dongsha area, proximate to the Shenhu region, exhibits a more complex gas hydrate occurrence compared with Shenhu [28]. Numerous studies have focused on the gas resources [34], distribution of gas hydrate reservoirs [17,24,35], and morphology of gas hydrates in the Dongsha area [17]. In the Dongsha area, the canyon sedimentary system and sediment waves play a crucial role in controlling gas hydrate accumulation on a macro scale [23,36]. Analysis of geophysical and geochemical data reveals that the process of gas hydrate accumulation in the Dongsha area is complex, involving multiple stages of formation and decomposition [25,37]. Consequently, sediment properties potentially exert significant influence on gas hydrate accumulation. However, detailed studies on the impact of sediment properties on gas hydrate control in the Dongsha area are scarce, and the variations in sediment properties between deep and shallow gas hydrate reservoirs have not been documented. Identifying potential differences in sediment properties between deep and shallow gas hydrate reservoirs, along with understanding the control mechanisms of sediment properties on gas hydrate accumulation, could be crucial for refining the microscale gas hydrate accumulation model.
In 2013, the Guangzhou Marine Geological Survey’s second gas hydrate expedition (GMGS-2) began in the Dongsha area, leading to the discovery of high-quality gas hydrate layers at multiple locations [17,33,35]. During GMGS-2, cores were collected from the gas hydrate reservoir and adjacent sediment layers across multiple sites. The collected cores spanned both deep and shallow gas hydrate reservoirs in the Dongsha area [17]. Analyzing sediment properties differences, such as grain size, mineral composition, and biological content, between deep and shallow gas hydrate reservoirs, we identified key factors influencing gas hydrate enrichment and clarified the unique accumulation patterns of deep and shallow gas hydrates at the microscale.

2. Geological Setting

The SCS is one of the largest marginal seas in the western Pacific Ocean. Located in a transitional zone, the northern slope of the SCS connects quasi-passive and active continental margins [2]. This region features a complex geological structure, containing several large and medium-sized Cenozoic sedimentary basins with deposition thicknesses over 10,000 m [23]. In the northern SCS, sedimentation rates for late Pleistocene and Holocene strata range from 17.9 to 19.6 cm/ka and 9.6 to 14.6 cm/ka, respectively, at water depths of 200 to 3400 m and temperatures of 2 to 5 °C [23]. The rapid deposition rates, combined with favorable temperature and pressure conditions, promote the formation of gas hydrates [35].
The Dongsha area is in the eastern part of the Pearl River Mouth Basin, mainly located near the central uplift area of the Taixinan Basin, where the water depth gradually increases from 600 m to more than 2100 m (Figure 1a). The seabed topography of the GMGS2 in the Dongsha area is complex, with extensive occurrences of submarine ridges, canyons, and landslides. Faults and diapirs in the Dongsha area are highly active and can be divided into three types: inherent faults, minor normal faults that appear in the upper part of large gas chimneys, and strike–slip faults in deep water [35]. Gas chimneys have been widely observed in the Dongsha area, particularly on submarine ridges [17,23,24,35]. Faults and gas chimneys are important channels for upward fluid migration in the Dongsha area [17,23,25].
Logging data were obtained from 13 GMGS2 sites, with 8 indicating gas hydrate presence. Gas hydrate samples were collected through coring at sites W05, W07, W08, W09, and W16 (Figure 1b) [24,35]. In the Dongsha area, gas hydrates predominantly appear in massive, layered, vein-like, tubercular, and dispersed forms [17,23]. Gas hydrates in the study area were found in both deep (below ~60 mbsf) and shallow (within ~25 mbsf) reservoirs. The study area exhibited both dispersed and leaked gas hydrates. The gas hydrate-bearing layer reaches a maximum thickness of 32 m, with saturation levels exceeding 50% [17,35]. Sites W08 and W16 featured both deep and shallow gas hydrate reservoirs, in contrast with other sites in the study area, which had only one reservoir type [17]. Consequently, this study focused on sites W08 and W16 as key sites (Figure 1b).

3. Materials and Methods

3.1. Sites and Samples

The water depths at sites W08 and W16 were 801 m and 871 m, respectively. At site W08, shallow gas hydrates appeared 8–24 mbsf, mainly exhibiting massive, layered, vein-like, and tubercular forms. Deep gas hydrates appeared at 61–95 mbsf and were mainly massive (Figure 2a). Furthermore, some authigenic carbonate minerals have been found near the seabed and in the ~60 mbsf sediment layers [17]. At site W16, shallow gas hydrates appeared at 10–24 mbsf and mainly exhibited a tubercular form. Deep gas hydrates appeared at 182–206 mbsf and mainly exhibited dispersed and vein-like forms (Figure 2b) [17,38].
To delineate the differences more accurately between gas hydrate reservoirs and non-gas hydrate layers, this study extensively sampled sediments from both the hydrate-bearing layers and the adjacent non-hydrate layers. In the present study, 10 and 27 samples were collected from sites W08 and W16, respectively (Table 1 and Figure 2). A total of 37 samples were used for grain-size measurements, X-ray diffraction (XRD), and specific surface area (SSA) tests.

3.2. Grain-Size Measurements

Grain-size measurement methods followed the protocols outlined by [33,39]. A total of 37 samples were evenly divided into two groups for grain-size analysis. Each group underwent a distinct preprocessing method: either A-type or B-type. In the A-type preprocessing method, approximately 1 g of sediment was weighed and exposed to 10 mL of 15% hydrogen peroxide (H2O2) for 24 h to eliminate organic matter. Subsequently, 10 mL of 20% hydrochloric acid (HCl) was added for another 24 h to remove inorganic carbon. The sample was then treated with 10 mL of 2-M sodium carbonate (Na2CO3) in a hot bath at 85 °C for 5 h to dissolve biological opal. Afterward, the sample was rinsed thrice with distilled water to eliminate residual Na2CO3. Following the removal of the supernatant, 10 mL of 5.1% sodium hexametaphosphate (Na4P2O7 10H2O) was introduced as a dispersing agent before conducting the grain-size analysis. Conversely, the B-type preprocessing method retains all components within the sample. Therefore, it involves only the final step of the A-type method, which is the addition of 10 mL of 5.1% Na4P2O7 10H2O. Grain-size data derived from various preprocessing methods possess distinct geological implications [33]. The A-type preprocessing method, which removes organic matter, inorganic carbon, and biological opal, allows the grain-size data to reflect the hydrodynamic conditions more accurately during deposition. This is because biological components and organic matter primarily originate from the sedimentation and transformation of organisms’ post-mortem, rather than from hydrodynamic transport [18,33,40]. However, the B-type preprocessing method, which preserves all components within the sample, enables the grain-size data to represent the conditions conducive more effectively to gas hydrate formation.
After preprocessing, grain sizes were measured using a Marvin Mastersizer 3000 laser diffraction particle size analyzer. The calculation of sorting, kurtosis, and skewness was performed using the McManus method [41]. The analysis was conducted at the Beijing International Center for Gas Hydrates, Peking University, and the Key Laboratory of Polar Geology and Marine Mineral Resources, Ministry of Education, China University of Geosciences (Beijing).

3.3. X-ray Diffraction

XRD data for both whole rock and clay fractions were obtained using a D8 Advance instrument (Bruker Corp., Karlsruhe, Germany). The XRD analysis was performed in accordance with the methodologies below.
Sediment samples, with a dry weight exceeding 5 g, were dried at 45 °C for 24 h in a drying cabinet prior to analysis. For clay-size fraction XRD analysis, samples were ground to 200 mesh and both organic and calcareous components were removed. Fractions smaller than 2 μm were separated using centrifugation, in accordance with Stock’s Law. Subsequently, the clay component was combined with pure water to prepare aliquots for air-drying and ethylene glycol treatment prior to measurement [42,43]. The diffractometer, operating with a Cu K-alpha radiation source (λ = 0.154 nm) at 40 kV and 30 mA, was utilized. Scanning was conducted at a rate of 2° per minute over a range of 3° to 65°. Quantification of the results was achieved using Rockquan 2016 and ClayQuan 2016 software. The XRD analysis was carried out at the Micro Structure Analytical Laboratory, Peking University.

3.4. Specific Surface Area

SSA measurements were conducted with Quadrasorb EVO and Quantachrome Nova Station. The SSA was determined according to the method described by [33], utilizing the Brunauer–Emmet–Teller (BET) equation [44] for calculation. The SSA analysis was performed at the Institute of Analysis and Testing, Beijing Academy of Science and Technology.

4. Results

4.1. Lithology

The lithologies of sites W08 and W16 are the same, dominated by clayey silt (Figure 2). The grain-size data showed that the sand fraction in the 10 sediment samples from site W08 ranged from 0.11 to 9.60%, with an average of 2.30%. The silt fraction ranged from 63.75 to 73.18%, averaging 68.80%. The clay fraction ranged from 24.81 to 32.77%, averaging 28.90%. The grain-size data showed that the sand fraction in the 27 sediment samples from site W16 ranged from 0 to 2.71%, with an average of 0.95%. The silt fraction ranged from 65.36 to 73.79%, averaging 69.26%. The clay fraction ranged from 35.30 to 34.22%, averaging 29.80%.

4.2. Vertical Distribution of Gas Hydrate

According to previous research and cruise reports, the gas hydrate saturation of shallow and deep reservoirs at site W08 is estimated to be 10–14% and up to 33%, respectively, by the degassing of the pressure core (Figure 2a) [17]. Logging-while-drilling (LWD) data showed that the gas hydrate saturations of shallow and deep reservoirs at site W16 are ~42% and up to 50%, respectively (Figure 2b) [17,45].

4.3. Grain-Size Parameters

4.3.1. A-Type Preprocessing Method

Grain-size analysis using the A-type preprocessing method revealed that the median particle size of the 10 sediment samples from site W08 varied between 6.55 and 7.19 Φ (10.67 and 6.85 μm), averaging 6.84 Φ (8.73 μm). Sediment sorting values ranged from 1.22 to 1.48, with a mean of 1.37. Kurtosis values for the sediments spanned from 0.03 to 0.17, averaging 0.06. Sediment skewness varied from 0.92 to 1.17, with an average value of 1.02 (Figure 3a).
Analysis using the A-type preprocessing method indicated that the median particle size of the 27 sediment samples from site W16 ranged from 6.45 to 7.37 Φ (11.44 and 6.05 μm), with an average of 6.97 Φ (7.98 μm). Sorting values for the sediments ranged from 1.30 to 1.59, with a mean of 1.43. Kurtosis of the sediments was between −0.04 and 0.18, averaging 0.06. Skewness for the sediments was in the range of 0.93 to 1.13, with an average value of 1.02 (Figure 3b).

4.3.2. B-Type Preprocessing Method

Grain-size analysis, utilizing the B-type preprocessing method, revealed that the median particle size of the 10 sediment samples from site W08 varied between 6.57 and 7.25 Φ (10.53 and 6.57 μm), averaging 6.99 Φ (7.87 μm). Sediment sorting values ranged from 1.47 to 1.99, with a mean of 1.63. Kurtosis values for the sediments spanned from −0.05 to 0.15, averaging 0.05. Sediment skewness varied between 0.94 and 1.09, with an average value of 1.02 (Figure 3a).
Analysis of grain size, conducted with the B-type preprocessing method, indicated that the median particle size for the 27 sediment samples from site W16 was between 6.87 and 7.37 Φ (8.55 and 6.05 μm), with an average of 7.09 Φ (7.34 μm). Sorting values for the sediments were between 1.40 and 1.70, with a mean of 1.56. Kurtosis for the sediments ranged from −0.01 to 0.11, averaging 0.07. Skewness of the sediments varied from 0.97 to 1.09, with an average value of 1.02 (Figure 3b).

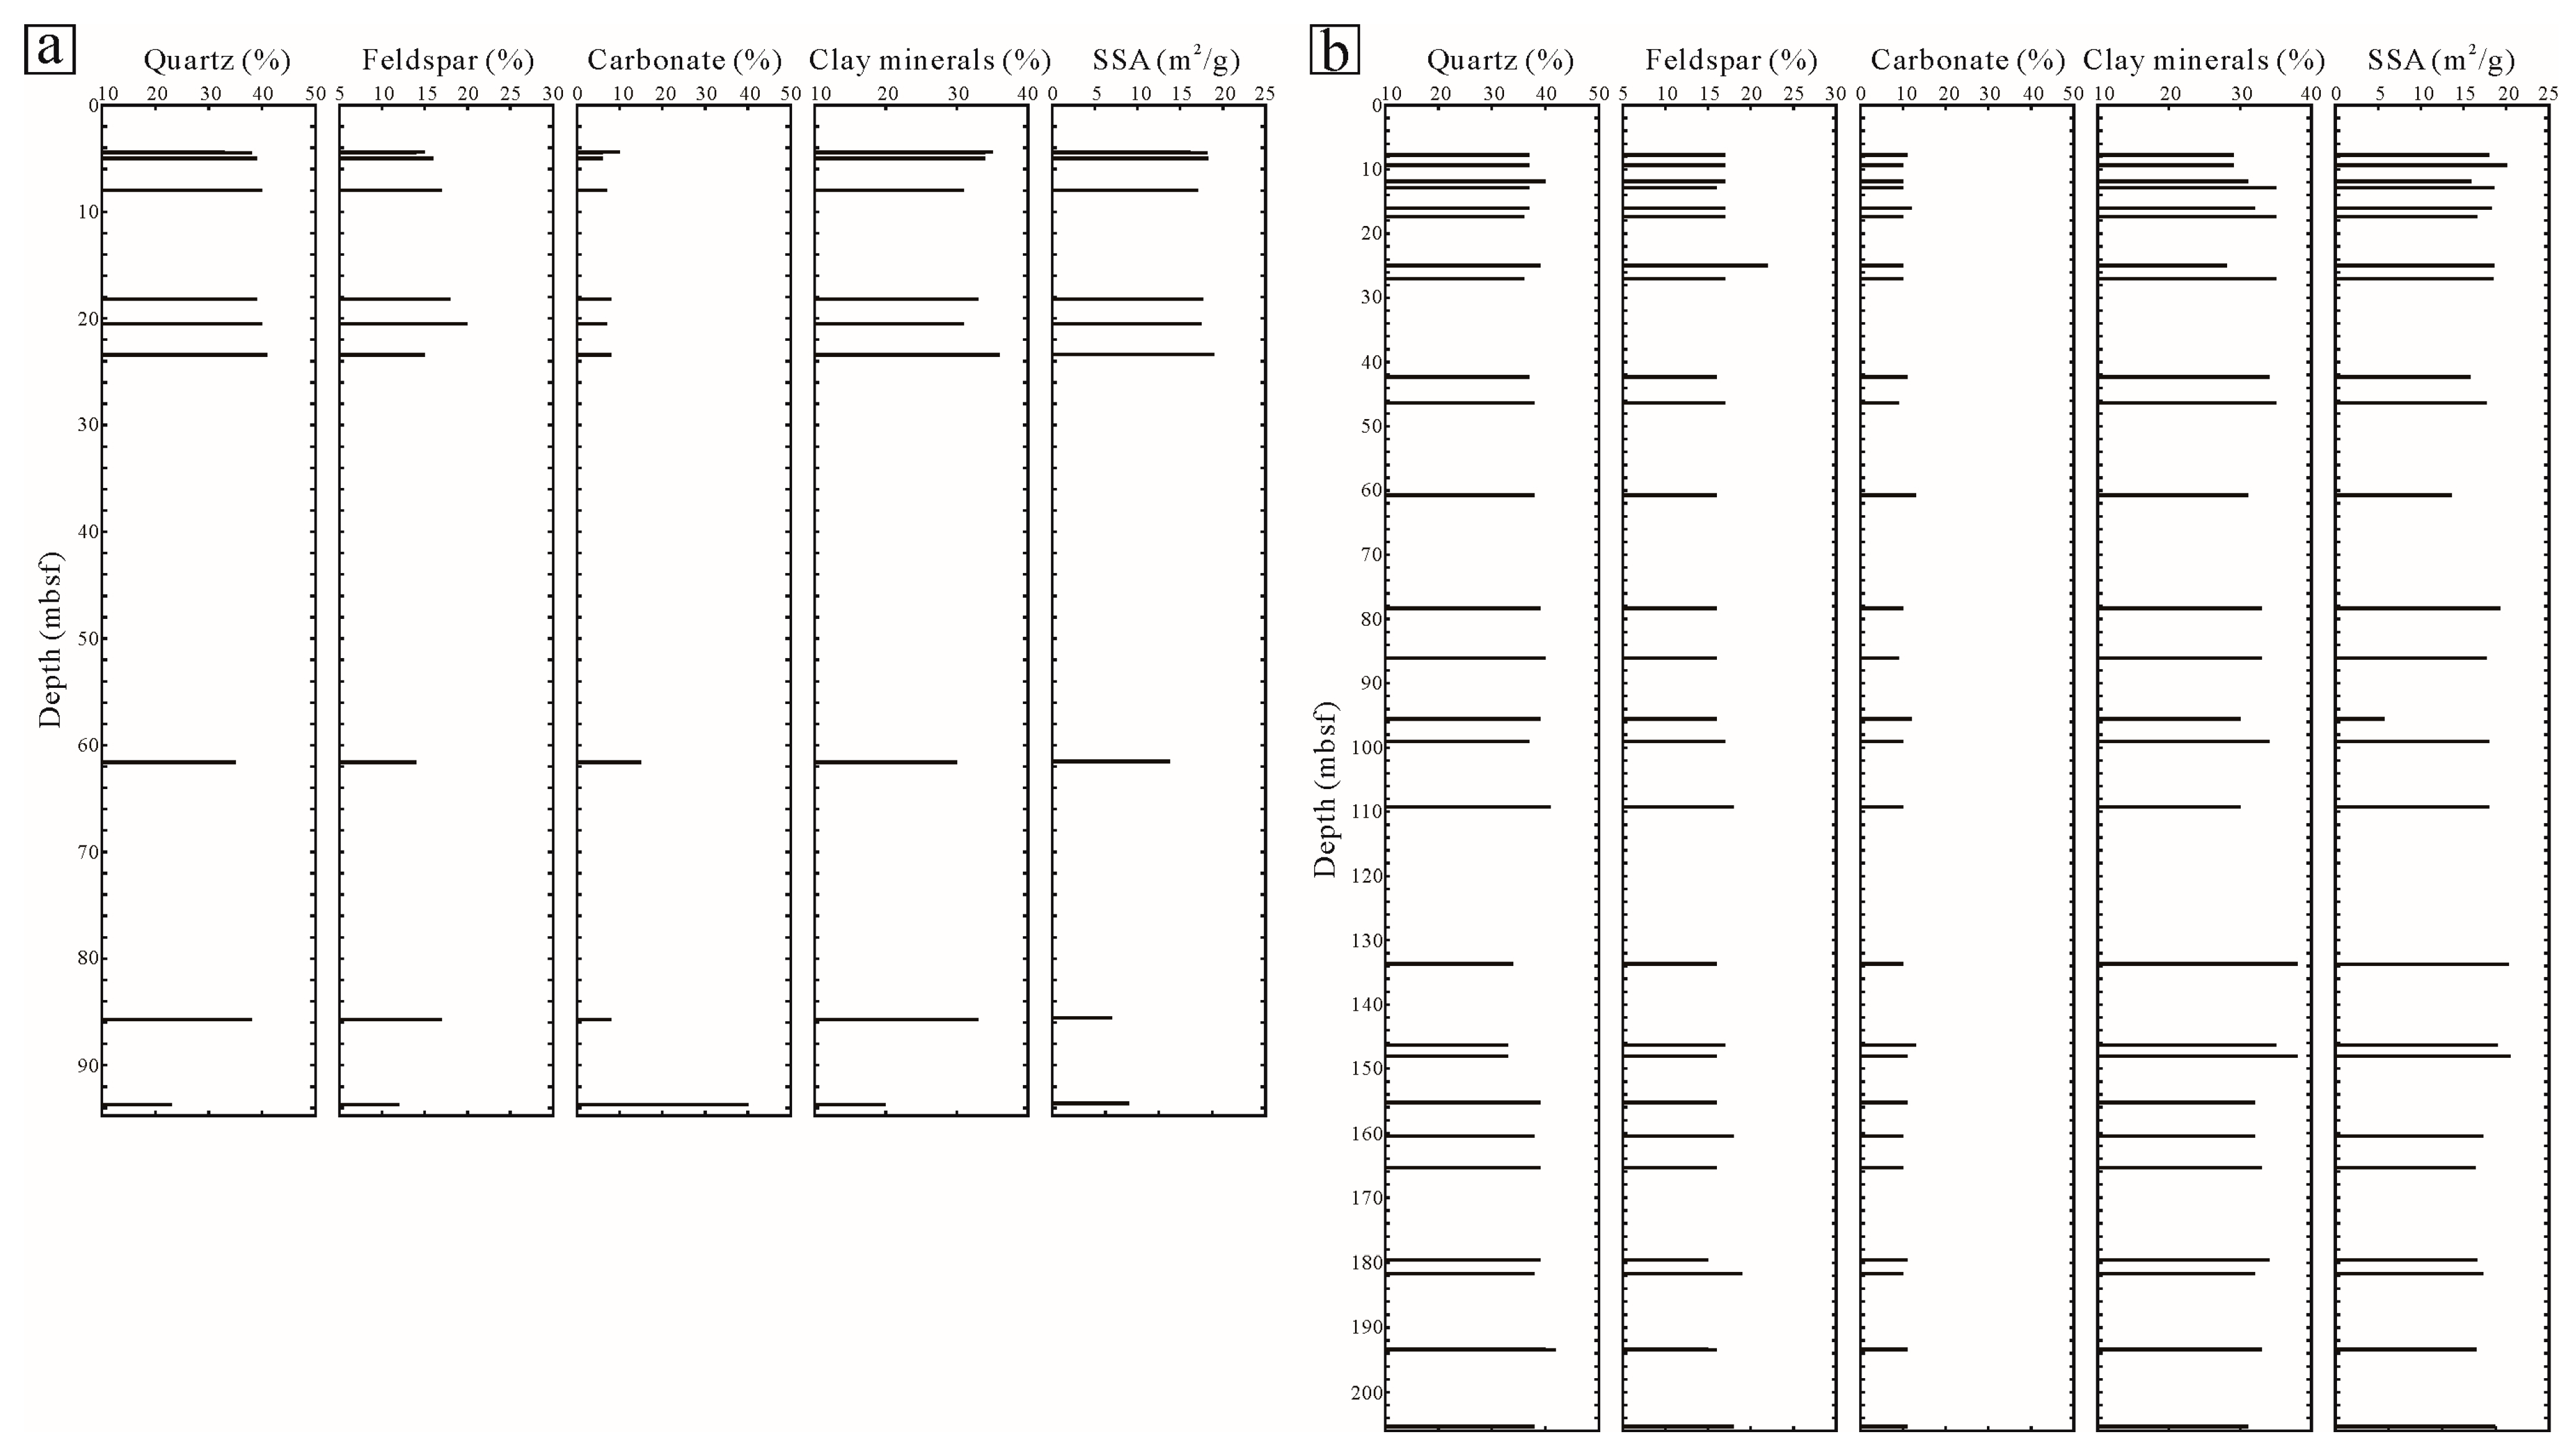
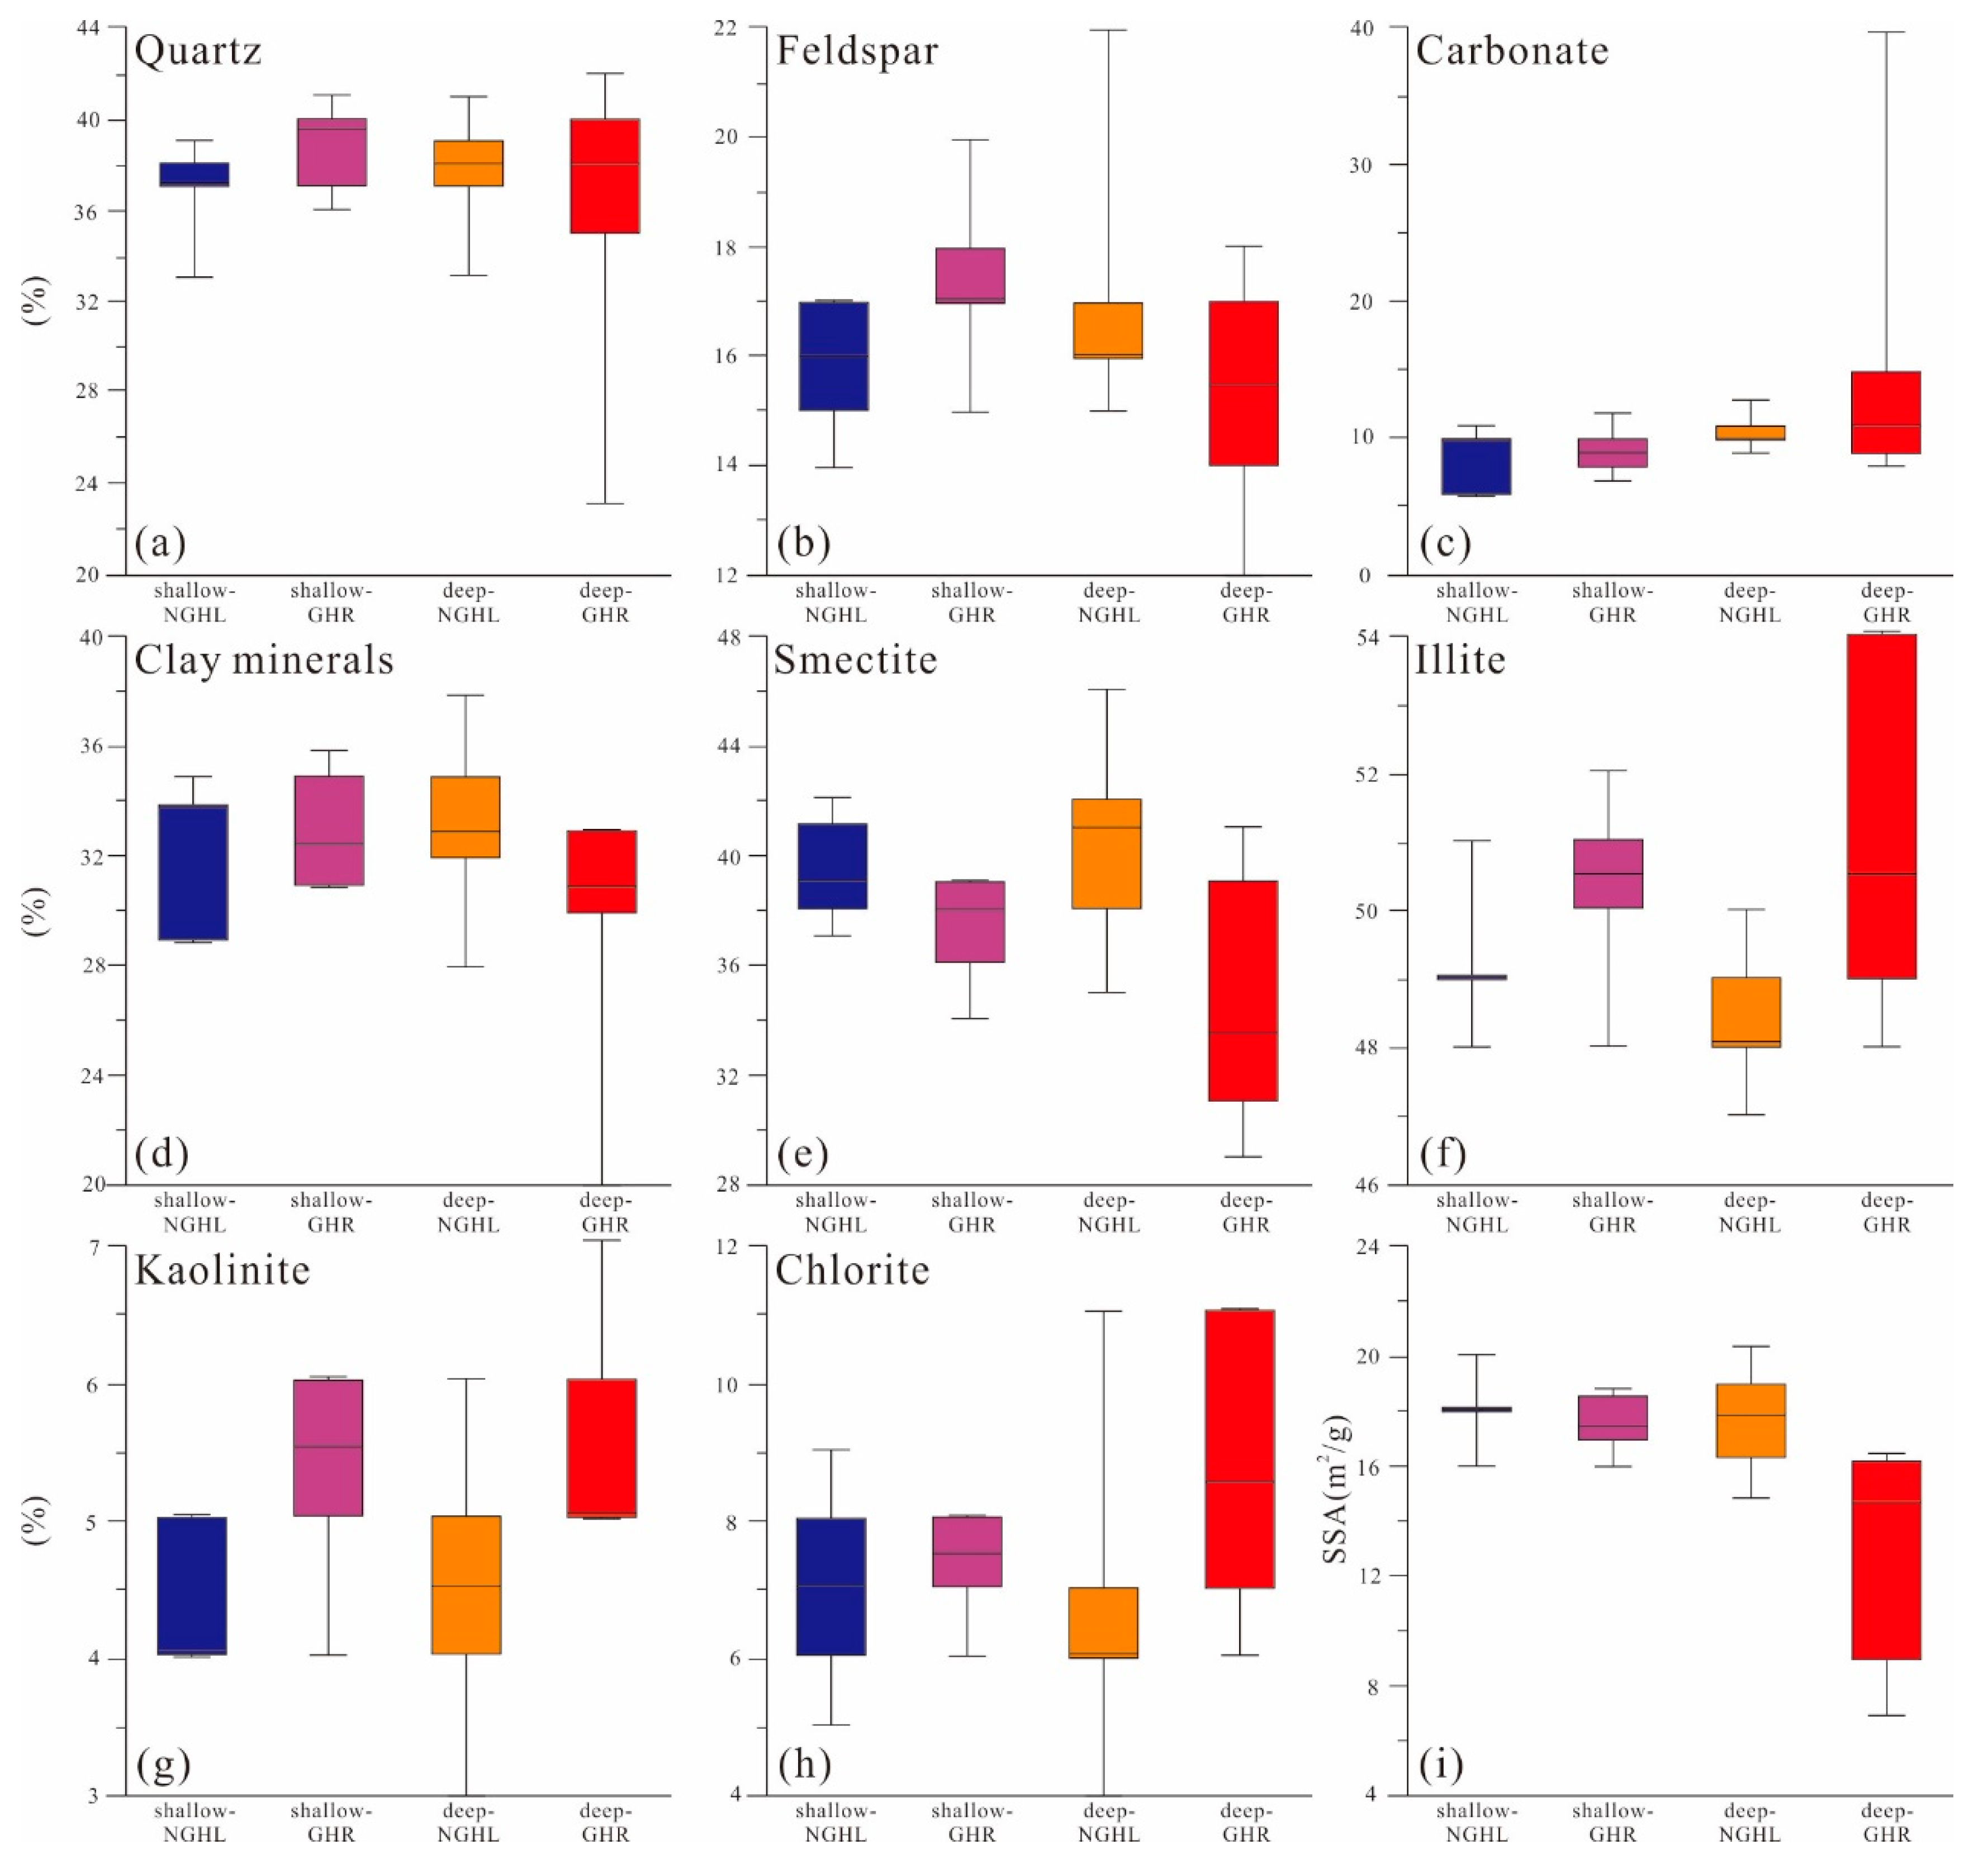
4.4. Mineral Components

Whole-rock XRD analysis of the 37 samples from sites W08 and W16 revealed a predominance of quartz, feldspar, carbonates, and clay minerals, complemented by minor amounts of pyrite and gypsum (Figure 4). Quartz content in the 10 samples from site W08 varied between 23% and 41%, averaging 36.6%. Feldspar content ranged from 12% to 20%, with an average of 15.8%. Carbonate content ranged from 6% to 40%, averaging 11.5%. Clay mineral content varied from 20% to 36%, with an average of 31.7% (Figure 4a). In the 27 samples from site W16, quartz content ranged from 3% to 42%, averaging 37.8%. Feldspar content in these samples ranged from 15% to 22%, with an average of 16.8%. Carbonate content in these samples varied from 9% to 13%, averaging 10.5%. Clay mineral content in these samples ranged from 28% to 38%, with an average of 32.7% (Figure 4b).
XRD analysis of the clay fraction revealed that the 37 samples from sites W08 and W16 predominantly contained smectite, illite, kaolinite, and chlorite (Figure 5). In the 10 samples from site W08, smectite content varied between 29% and 42%, averaging 36.5%. Illite content ranged from 48% to 54%, with a mean of 50.7%. Kaolinite content was between 4% and 6%, with an average of 5.1%. Kaolinite content was between 4% and 6%, with an average of 5.1%. For the 27 samples from site W16, smectite content ranged between 32% and 46%, with an average of 39.5%. Illite content in these samples ranged from 47% to 54%, with an average of 48.9%. Kaolinite content varied between 3% and 7%, averaging 4.8%. Chlorite content was found to be between 4% and 11%, with an average of 6.8% (Figure 5b).

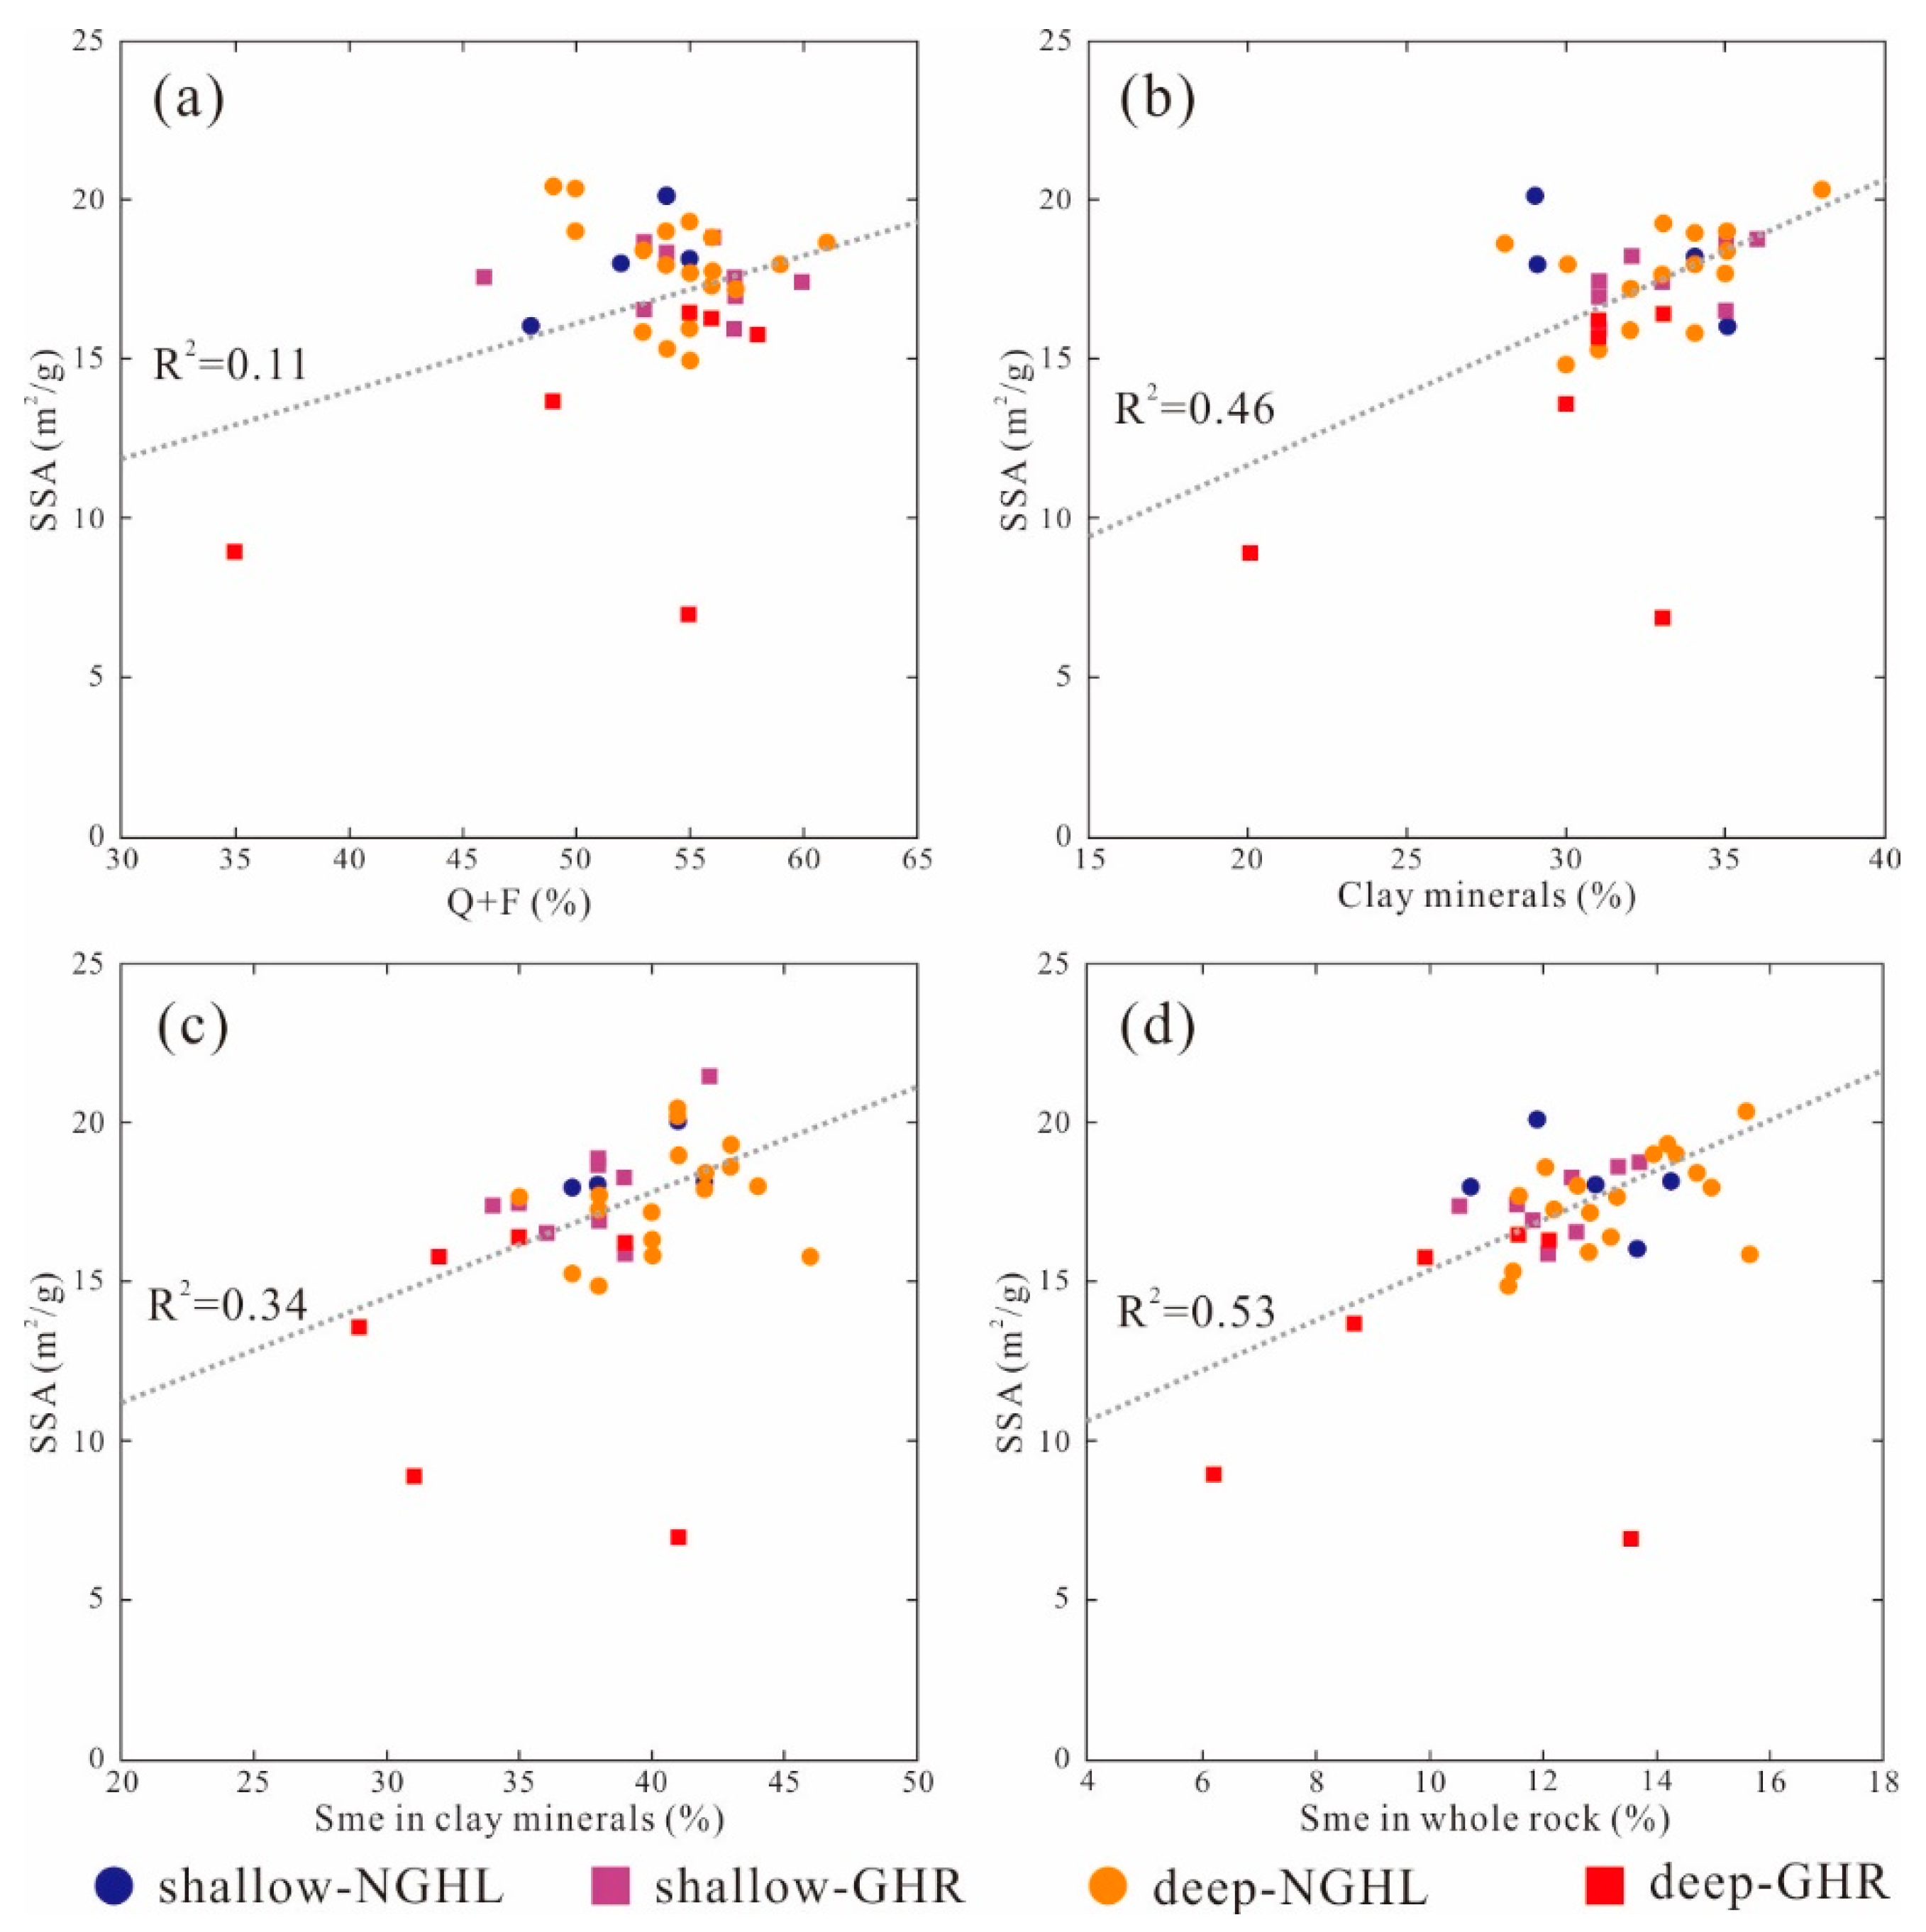
4.5. Specific Surface Area

Clay mineral content in these samples ranged from 28% to 38%, with an average of 32.7% (Figure 4b). The SSA of the 10 samples collected from site W08 varied between 6.94 and 18.82 m2/g, averaging 15.23 m2/g. The SSA of the 27 samples from site W16 ranged from 14.89 to 20.44 m2/g, with a mean value of 17.61 m2/g.

5. Discussion

5.1. Characteristics of Deep and Shallow Gas Hydrate Reservoirs

Gas hydrate enrichment levels are commonly assessed through resistivity logs, Cl- anomalies in pore water, and pressure core degassing [33,46,47,48]. Resistivity logs serve as the most straightforward and reliable indicators for identifying gas hydrate-rich layers, which typically exhibit high resistivity values [46,48,49]. At site W08, the intervals between 0–8 and 24–61 mbsf displayed low resistivity values, indicating an absence of gas hydrates during drilling [17]. Significant increases in resistivity were observed at 8–24 and 61–95 mbsf at site W08, accompanied by Cl anomalies in pore water and degassing in pressure core samples, suggesting gas hydrate presence in these intervals (Figure 2a) [35]. The distribution patterns of gas hydrates at site W16 mirror those observed at site W08. At site W16, intervals of 0–10 mbsf and 24–182 mbsf exhibited low resistivity without any gas hydrate detection. Significant increases in resistivity at 10–24 and 182–206 mbsf at site W16 were noted, with gas hydrates identified during drilling operations (Figure 2b) [17,35].
Previous studies have found that gas hydrates in shallow layers mostly fill fractures in [17]. Generally, the seepage of high-flux methane controls the gas hydrate in shallow layers, and the fluid migration channel is mainly a fault or gas chimney. The gas sources are the decomposition of gas hydrates in deep layers and the direct upward seepage of deep biological and thermal gases [28]. The gas hydrates in the deep layers were mainly dispersed and in some massive forms. Dispersed gas hydrates are formed under the control of low-flux methane diffusion [17]. Research in the Shenhu area in the northern SCS indicates that massive gas hydrates in the deep layer may also be formed by low-flux methane diffusion [33,50]. Therefore, the research intervals of sites W08 and W16 can be categorized into four units: shallow and deep non-gas hydrate layers (shallow-NGHL and deep-NGHL) and shallow and deep gas hydrate reservoirs (shallow-GHR and deep-GHR) (Table 2 and Figure 2). The shallow and deep GHRs were controlled by seepage and diffusion, respectively, and the gas hydrate saturation of the deep GHRs was higher than that of the shallow GHRs (Figure 2).

5.2. Influence of the Lithology and Sedimentary Process

The grain-size data obtained through the B-type preprocessing method reflect the sediments’ original geometric parameters during gas hydrate accumulation [33]. These data facilitate the lithological analysis of the study intervals at sites W08 and W16.
In the study interval, the sediments mainly consisted of clayey silt. There were no differences in lithology between the different units (Figure 6). The silt fraction was dominant, followed by the clay fraction. The sand fraction was rare (Figure 7). The differences in sand, silt, and clay fractions among the different units in the study intervals were not significant (Figure 7). The average sand fraction in the deep GHR was slightly higher, which was caused by the abnormally high sandy components in some samples. According to [17,51], there were many bioclasts at ~90 mbsf at site W08 and the grain size of these bioclasts is generally large, causing an increase in the sandy fraction.
The absence of lithological differentiation suggests that the sedimentary processes within the study intervals were likely straightforward and stable. Grain-size data, obtained through the A-type preprocessing method, are utilized to characterize sedimentary processes. The A-type preprocessing method eliminates organic matter, inorganic carbon, and biogenic opal. Minerals in the sediments, post-preprocessing and excluding some authigenic minerals, are transported and deposited through sedimentary processes. The grain size of these minerals aids in reconstructing the sedimentary processes [18,39,52].
There was a significant positive correlation between the median grain size and silt fraction, which indicated that the silt fraction was the primary particle size of the sediments transported during the sedimentary process (Figure 8a). The median grain size did not correlate with the sorting, skewness, or kurtosis (Figure 8b–d). There were no differences between the units in the study intervals, suggesting that the differences in sedimentary processes between the different units were very weak (Figure 8b–d).
As depicted in Figure 9, sediment data distribution within the study intervals aligns with the C-M baseline, suggesting gravity-driven processes dominated the study area. Research indicates that fine-grained turbidite layers result from sediment sliding along paleochannels [18,53,54,55]. Numerous studies demonstrate that fine-grained turbidite layers facilitate gas hydrate accumulation, a finding consistent across the Dongsha area [18,33,55,56]. However, the sedimentary processes of both deep and shallow GHRs, as well as between GHRs and NGHLs, showed no significant differences, suggesting the presence of microscale factors influencing gas hydrate enrichment in the study area.

5.3. Influence of Grain Size

Grain-size data obtained through B-type preprocessing are instrumental in analyzing gas hydrate accumulation. Statistical analysis of grain-size parameters revealed no significant differences in median particle size, skewness, and kurtosis across the study intervals (Figure 10a,c,d). The deep GHR exhibited a slightly coarser median particle size (Figure 10a) and poorer sorting (Figure 10b) compared with other units, aligning with its higher sand fraction. The most notable difference between group A and B samples’ grain-size parameters was in sorting, especially within the deep-GHR (Figure 3 and Figure 11a). The key distinction in preprocessing between group A and B samples lies in the preservation of organic matter, inorganic carbon, and biogenic opal. A clear positive correlation was observed between sorting differences and carbonate mineral content. The abundance of foraminiferal fossils in the Dongsha area suggests that foraminifera are the primary contributors to the poor sorting observed in the deep GHR. Prior research has shown that foraminifera, characterized by their chambered structure, are typically classified within the sandy fraction. Consequently, the high abundance of foraminifera is positively correlated with gas hydrate accumulation [17,33,40], potentially elucidating the enrichment of gas hydrates in the deep GHR.
In general, the difference in grain-size parameters between the GHRs and NGHLs is not significant, especially because the significance of grain-size parameters for shallow GHRs is weak. The sorting of the deep GHR is poor, reflecting the effect of foraminifera on the gas hydrate reservoir.

5.4. Influence of Mineral Components

Mineral components are another potential factor affecting gas hydrate accumulation. The quartz and feldspar contents were similar in different units of the study interval (Figure 12a,b). The carbonate mineral content was similar in the shallow-NGHL, shallow-GHR, and deep-NGHL and was relatively high in the deep-GHR (Figure 12c). This is because some samples in the deep-GHR have high foraminiferal abundance, which is consistent with the results of SEM, grain-size measurement, and lithology analysis. The clay mineral contents in the shallow-NGHL, shallow-GHR, and deep-NGHL were significantly higher than those in the deep-GHR (Figure 12d).
To further reveal the influence of clay minerals on gas hydrate accumulation, XRD analysis of the clay fraction was performed. During the study period, smectite and illite were the dominant types of clay minerals, accounting for more than 80% of all clay minerals. Thus, changes in the smectite and illite contents were the focus of this study. The smectite content in the shallow- and deep-GHRs was significantly lower than that in the shallow- and deep-NGHLs (Figure 12e), whereas the opposite was true for the illite content (Figure 12f). In the GHR, the smectite in the deep-GHR is lower than that in the shallow-GHR (Figure 12e), and the content of illite showed the opposite trend (Figure 12f). The kaolinite and chlorite contents were lower and similar in the different units of the study interval (Figure 12g,h). The difference in mineral components indicates that clay minerals, especially smectite, control the gas hydrate enrichment. Previous studies have indicated that the complex structure of smectite reduces its permeability and restricts fluid migration. The strong adsorption of free gas restricts gas migration [57,58,59]. To characterize the complexity of the sediment structure, we analyzed the SSA data of the samples. The results showed that the SSA of the deep-GHR was significantly lower than that of the shallow-NGHL, shallow-GHR, and deep-NGHL (Figure 12i). The SSA of the shallow-GHR is like that of the shallow- and deep-NGHLs (Figure 12i) because, although the shallow-GHR has less smectite content, the overall clay mineral content is not low (Figure 5). Further analysis of the correlation between SSA and mineral content showed that the correlation between the felsic mineral content (quartz and feldspar) and SSA was not significant (Figure 13a). In contrast, the content of all clay minerals and the content of smectite in the clay minerals were positively correlated with the SSA (Figure 13b,c). The smectite content in the whole rock was significantly and positively correlated with the SSA (Figure 13d). The correlation analysis indicated that clay minerals, especially smectite, controlled the SSA.
SSA serves as a robust indicator for assessing the deep-GHR, reflecting changes in sediment mineral composition. Specifically, smectite and other clay minerals hinder gas hydrate accumulation. A reduced smectite content in deep GHRs promotes gas hydrate accumulation. Clay minerals in shallow GHRs exert less influence on gas hydrate accumulation compared with those in deep GHRs. However, the abundant clay minerals and smectite in NGHLs above both deep and shallow GHRs could serve as a seal, aiding in the preservation of underlying gas hydrates.
Additionally, some studies suggest that the stronger binding of water in the smectite decreases the formation efficiency of gas hydrates [60,61], contributing to the poor accumulation in smectite-rich layers. Furthermore, the complex microstructure of the I/S, as indicated by the mineral composition and SSA of sediments, influences the enrichment of gas hydrates. The complex microstructure of the smectite strongly adsorbs gas and fluids, and the vertical overlap between smectite-rich and low smectite content layers likely plays a crucial role in the distribution of high-quality gas hydrate reservoirs.

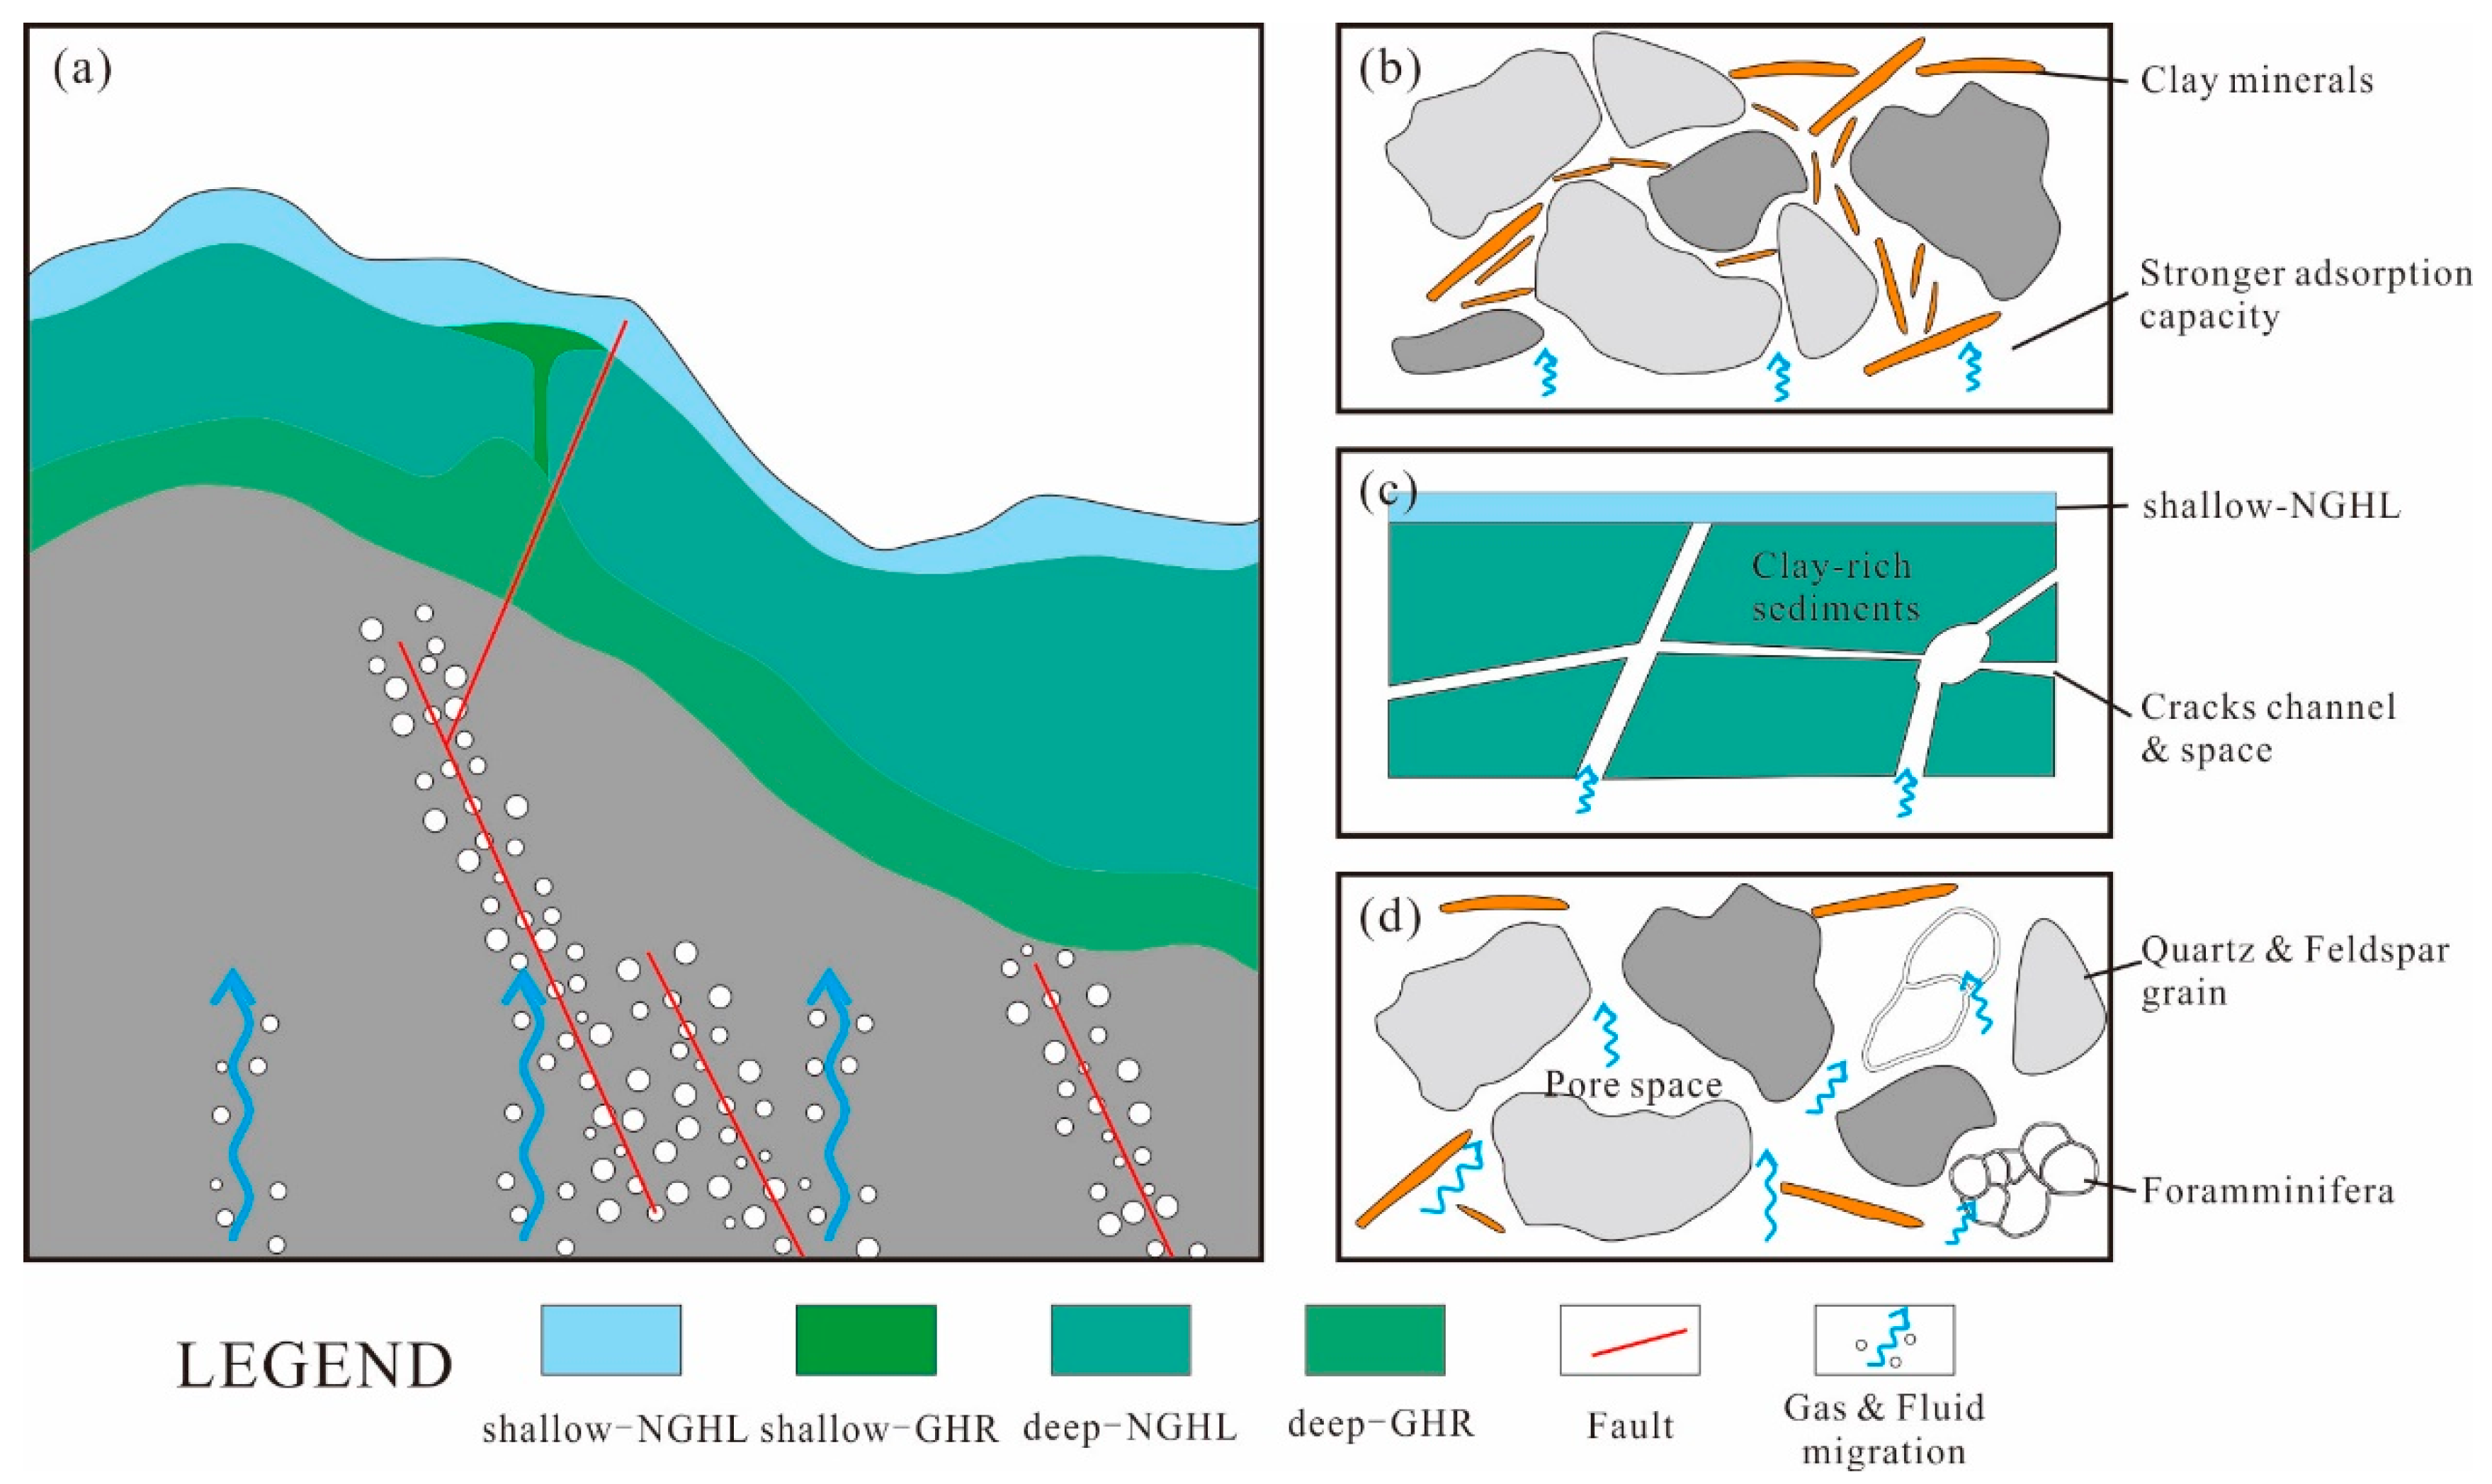
5.5. Constraints of Sediment Properties on Deep and Shallow Gas Hydrate Reservoirs

The sediment property data in the study interval indicate that mineral components may be key factors controlling gas hydrate accumulation in fine-grained sediments. In the Dongsha area, gas and fluid migrate along the gas chimney and fault to the gas hydrate stabilization zone (Figure 14a). In the deep-GHR, the smectite content was low, and the foraminiferal abundance was high. The sediment layer of the deep GHR had high permeability and a larger intergranular pore space, which improved the reservoir space and migration of gas and fluid conditions (Figure 14d). The deep NGHL had high smectite content. The sediment layer of the deep NGHL has a complex structure, poor permeability, and strong adsorption of gas, which makes it difficult for gas and fluid to migrate (Figure 14c). Thus, the vertical superposition of the deep-GHR and NGHL forms a “lithological trap” conducive to gas hydrate accumulation. When environmental changes lead to an increased methane flux from gas hydrate decomposition or gas chimneys and faults exist, gas and fluid can break through the sealing of the deep NGHL and continue to migrate upward [17,38,62]. With the release of pressure, the gas and fluid were blocked again when they migrated to the shallow NGHL and formed a shallow GHR (Figure 14b) [17,35]. Breakthroughs in deep-NGHL sealing require a pathway or overpressure release to impale the overlying layer. Thus, the shallow GHR is more clearly controlled by tectonism, in which gas hydrates are mostly found in fractures with vein-like and tubercular forms (Figure 14b). The control of the sediment properties in the shallow GHR was weaker than that in the deep GHR.

6. Conclusions

Gas hydrate reservoirs in the Dongsha region are classified into deep and shallow types. The deep reservoirs are primarily influenced by diffusion, whereas the shallow ones are affected by seepage. Both types are located within fine-grained sediments.
Grain-size parameters exert a minor influence on gas hydrate accumulation, whereas mineral composition, especially an increase in clay minerals like smectite, significantly impacts gas hydrate accumulation in fine-grained sediments, generally hindering it. The specific surface area of sediments, primarily determined by the content of clay minerals such as smectite, plays a crucial role in gas hydrate accumulation in deep diffusion reservoirs; a lower specific surface area is indicative of more favorable conditions.
Sediment properties exert limited control on gas hydrate accumulation in shallow seepage reservoirs. Tectonism primarily controls gas hydrate accumulation in shallow seepage reservoirs. However, the overlying reservoir with high smectite content acts as a seal, enhancing gas hydrate accumulation in shallow seepages. The deep diffusion gas hydrate reservoir, characterized by low smectite and high foraminiferal content, offers migration pathways and reservoir space. The overlying layer of the deep diffusion reservoir, rich in smectite, effectively impedes gas and fluid migration. The reservoir, with a high-smectite upper layer and a low-smectite lower layer, forms an optimal environment for gas hydrate accumulation.
Elucidating the influence of mineral composition, grain size, and sedimentary processes on gas hydrate accumulation aids in understanding the distribution patterns of gas hydrate reservoirs and supports further exploration and development efforts. Additionally, this analysis provides valuable insights into the laws governing gas hydrate accumulation in fine-grained sediments.

Author Contributions

Conceptualization, C.B. and H.W.; methodology, Y.Z. and X.X.; validation, Q.L.; formal analysis, Y.Z.; resources, H.W. and Q.L.; writing—original draft preparation, C.B.; writing—review and editing, H.W. and Q.L.; visualization, C.B.; project administration, H.W.; funding acquisition, H.W. and C.B. All authors have read and agreed to the published version of the manuscript.

Funding

This work was financially supported by the Laoshan Laboratory (No. LSKJ202203501) and the National Natural Science Foundation of China (No. 42376217).

Institutional Review Board Statement

Not applicable.

Informed Consent Statement

Not applicable.

Data Availability Statement

Datasets underpinning the study’s results and findings are available via Figshare (DOI: http://doi.org/10.6084/m9.figshare.22281625, accessed on 16 March 2023).

Acknowledgments

We extend our gratitude to all contributors to the China National Gas Hydrate Program Expedition 2.

Conflicts of Interest

The authors declare no conflicts of interest.

References

  1. Tréhu, A.; Ruppel, C.; Holland, M.; Dickens, G.; Torres, M.; Collett, T.; Goldberg, D.; Riedel, M.; Schultheiss, P. Gas Hydrates in Marine Sediments: Lessons from Scientific Ocean Drilling. Oceanography 2006, 19, 124–142. [Google Scholar] [CrossRef]
  2. Wu, S.; Wang, X.; Wong, H.K.; Zhang, G. Low-Amplitude BSRs and Gas Hydrate Concentration on the Northern Margin of the South China Sea. Mar. Geophys. Res. 2007, 28, 127–138. [Google Scholar] [CrossRef]
  3. Boswell, R.; Frye, M.; Shelander, D.; Shedd, W.; McConnell, D.R.; Cook, A. Architecture of Gas-Hydrate-Bearing Sands from Walker Ridge 313, Green Canyon 955, and Alaminos Canyon 21: Northern Deepwater Gulf of Mexico. Mar. Pet. Geol. 2012, 34, 134–149. [Google Scholar] [CrossRef]
  4. Vasheghani Farahani, M.; Hassanpouryouzband, A.; Yang, J.; Tohidi, B. Development of a Coupled Geophysical–Geothermal Scheme for Quantification of Hydrates in Gas Hydrate-Bearing Permafrost Sediments. Phys. Chem. Chem. Phys. 2021, 23, 24249–24264. [Google Scholar] [CrossRef]
  5. Vasheghani Farahani, M.; Hassanpouryouzband, A.; Yang, J.; Tohidi, B. Insights into the Climate-Driven Evolution of Gas Hydrate-Bearing Permafrost Sediments: Implications for Prediction of Environmental Impacts and Security of Energy in Cold Regions. RSC Adv. 2021, 11, 14334–14346. [Google Scholar] [CrossRef] [PubMed]
  6. Ruppel, C. Permafrost-Associated Gas Hydrate: Is It Really Approximately 1% of the Global System? J. Chem. Eng. Data 2015, 60, 429–436. [Google Scholar] [CrossRef]
  7. Ruppel, C.D.; Kessler, J.D. The Interaction of Climate Change and Methane Hydrates. Rev. Geophys. 2017, 55, 126–168. [Google Scholar] [CrossRef]
  8. Schoderbek, D.; Farrell, H.; Howard, J.; Raterman, K.; Silpngarmlert, S.; Martin, K.; Smith, B.; Klein, P. ConocoPhillips Gas Hydrate Production Test; ConocoPhillips Co.: Houston, TX, USA, 2013; p. 1123878. [Google Scholar]
  9. Zhu, Y.; Zhang, Y.; Wen, H.; Lu, Z.; Jia, Z.; Li, Y.; Li, Q.; Liu, C.; Wang, P.; Guo, X. Gas Hydrates in the Qilian Mountain Permafrost, Qinghai, Northwest China. Acta Geol. Sin. Eng. 2010, 84, 1–10. [Google Scholar] [CrossRef]
  10. Boswell, R.; Shelander, D.; Lee, M.; Latham, T.; Collett, T.; Guerin, G.; Moridis, G.; Reagan, M.; Goldberg, D. Occurrence of Gas Hydrate in Oligocene Frio Sand: Alaminos Canyon Block 818: Northern Gulf of Mexico. Mar. Pet. Geol. 2009, 26, 1499–1512. [Google Scholar] [CrossRef]
  11. Pohlman, J.W.; Kaneko, M.; Heuer, V.B.; Coffin, R.B.; Whiticar, M. Methane Sources and Production in the Northern Cascadia Margin Gas Hydrate System. Earth Planet. Sci. Lett. 2009, 287, 504–512. [Google Scholar] [CrossRef]
  12. Kroeger, K.F.; Crutchley, G.J.; Kellett, R.; Barnes, P.M. A 3-D Model of Gas Generation, Migration, and Gas Hydrate Formation at a Young Convergent Margin (Hikurangi Margin, New Zealand). Geochem. Geophys. Geosyst. 2019, 20, 5126–5147. [Google Scholar] [CrossRef]
  13. Li, J.; Ye, J.; Qin, X.; Qiu, H.; Wu, N.; Lu, H.; Xie, W.; Lu, J.; Peng, F.; Xu, Z.; et al. The First Offshore Natural Gas Hydrate Production Test in South China Sea. China Geol. 2018, 1, 5–16. [Google Scholar] [CrossRef]
  14. Fujii, T.; Suzuki, K.; Takayama, T.; Tamaki, M.; Komatsu, Y.; Konno, Y.; Yoneda, J.; Yamamoto, K.; Nagao, J. Geological Setting and Characterization of a Methane Hydrate Reservoir Distributed at the First Offshore Production Test Site on the Daini-Atsumi Knoll in the Eastern Nankai Trough, Japan. Mar. Pet. Geol. 2015, 66, 310–322. [Google Scholar] [CrossRef]
  15. Yi, B.Y.; Lee, G.H.; Kang, N.K.; Yoo, D.G.; Lee, J.Y. Deterministic Estimation of Gas-Hydrate Resource Volume in a Small Area of the Ulleung Basin, East Sea (Japan Sea) from Rock Physics Modeling and Pre-Stack Inversion. Mar. Pet. Geol. 2018, 92, 597–608. [Google Scholar] [CrossRef]
  16. Boswell, R.; Myshakin, E.; Moridis, G.; Konno, Y.; Collett, T.S.; Reagan, M.; Ajayi, T.; Seol, Y. India National Gas Hydrate Program Expedition 02 Summary of Scientific Results: Numerical Simulation of Reservoir Response to Depressurization. Mar. Pet. Geol. 2019, 108, 154–166. [Google Scholar] [CrossRef]
  17. Zhang, G.; Liang, J.; Lu, J.; Yang, S.; Zhang, M.; Holland, M.; Schultheiss, P.; Su, X.; Sha, Z.; Xu, H.; et al. Geological Features, Controlling Factors and Potential Prospects of the Gas Hydrate Occurrence in the East Part of the Pearl River Mouth Basin, South China Sea. Mar. Pet. Geol. 2015, 67, 356–367. [Google Scholar] [CrossRef]
  18. Su, M.; Luo, K.; Fang, Y.; Kuang, Z.; Yang, C.; Liang, J.; Liang, C.; Chen, H.; Lin, Z.; Wang, C.; et al. Grain-Size Characteristics of Fine-Grained Sediments and Association with Gas Hydrate Saturation in Shenhu Area, Northern South China Sea. Ore Geol. Rev. 2021, 129, 103889. [Google Scholar] [CrossRef]
  19. Boswell, R.; Collett, T.S. Current Perspectives on Gas Hydrate Resources. Energy Environ. Sci. 2011, 4, 1206–1215. [Google Scholar] [CrossRef]
  20. Ye, J.; Qin, X.; Xie, W.; Lu, H.; Ma, J.; Qiu, H.; Liang, J.; Lu, J.; Kuang, G.; Lu, C.; et al. Main progress of the second gas hydrate trial production in the South China Sea. Geol. China 2020, 47, 557–568, (In Chinese with English Abstract). [Google Scholar]
  21. Qin, X.; Lu, C.; Wang, P.; Liang, Q. Hydrate phase transition and seepage mechanism during natural gas hydrate production tests in the South China Sea: A review and prospect. Geol. China 2022, 49, 749–769, (In Chinese with English abstract). [Google Scholar] [CrossRef]
  22. Wang, X.; Liu, B.; Qian, J.; Zhang, X.; Guo, Y.; Su, P.; Liang, J.; Jin, J.; Luan, Z.; Chen, D.; et al. Geophysical Evidence for Gas Hydrate Accumulation Related to Methane Seepage in the Taixinan Basin, South China Sea. J. Asian Earth Sci. 2018, 168, 27–37. [Google Scholar] [CrossRef]
  23. Bai, C.; Zhang, G.; Lu, J.; Liang, J.; Yang, Z.; Yan, W.; Zhu, D.; Tian, Y. Deep-Water Sediment Waves as a Special Gas Hydrate Reservoirs in the Northeastern South China Sea. Mar. Pet. Geol. 2019, 101, 476–485. [Google Scholar] [CrossRef]
  24. Liu, B.; Chen, J.; Pinheiro, L.M.; Yang, L.; Liu, S.; Guan, Y.; Song, H.; Wu, N.; Xu, H.; Yang, R. An Insight into Shallow Gas Hydrates in the Dongsha Area, South China Sea. Acta Oceanol. Sin. 2021, 40, 136–146. [Google Scholar] [CrossRef]
  25. Guan, J.; Liang, Y.; Wang, S.; Wan, L.; Fan, S.; Su, P.; Zhang, W.; Liang, D. New Insight on the Stratigraphic-Diffusive Gas Hydrate System since the Pleistocene in the Dongsha Area of the Northeastern South China Sea. J. Mar. Sci. Eng. 2022, 10, 434. [Google Scholar] [CrossRef]
  26. Liang, J.; Zhang, G.; Lu, J.; Su, P.; Sha, Z.; Gong, Y.; Su, X. Accumulation characteristics and genetic models of natural gas hydrate reservoirs in the NE slope of the South China Sea. Nat. Gas Ind. 2016, 36, 157–162, (In Chinese with English Abstract). [Google Scholar]
  27. Wang, X.; Qian, J.; Collett, T.S.; Shi, H.; Yang, S.; Yan, C.; Li, Y.; Wang, Z.; Chen, D. Characterization of Gas Hydrate Distribution Using Conventional 3D Seismic Data in the Pearl River Mouth Basin, South China Sea. Interpretation 2016, 4, SA25–SA37. [Google Scholar] [CrossRef]
  28. Zhang, W.; Liang, J.; Liang, Q.; Wei, J.; Wan, Z.; Feng, J.; Huang, W.; Zhao, J.; Meng, M.; Deng, W.; et al. Gas Hydrate Accumulation and Occurrence Associated with Cold Seep Systems in the Northern South China Sea: An Overview. Geofluids 2021, 2021, 5571150. [Google Scholar] [CrossRef]
  29. Tsuji, Y.; Ishida, H.; Nakamizu, M.; Matsumoto, R.; Shimizu, S. Overview of the MITI Nankai Trough Wells: A Milestone in the Evaluation of Methane Hydrate Resources. Resour. Geol. 2004, 54, 3–10. [Google Scholar] [CrossRef]
  30. Sun, S.-C.; Liu, C.-L.; Ye, Y.-G.; Liu, Y.-F. Phase Behavior of Methane Hydrate in Silica Sand. J. Chem. Thermodyn. 2014, 69, 118–124. [Google Scholar] [CrossRef]
  31. Heeschen, K.U.; Schicks, J.M.; Oeltzschner, G. The Promoting Effect of Natural Sand on Methane Hydrate Formation: Grain Sizes and Mineral Composition. Fuel 2016, 181, 139–147. [Google Scholar] [CrossRef]
  32. Yang, C.; Lu, K.; Liang, J.; Lin, Z.; Zhang, B.; Liu, F.; Su, M.; Fang, Y. Control effect of shallow-burial deepwater deposits on natural gas hydrate accumulation in the Shenhu sea area of the northern South China Sea. Nat. Gas Ind. 2020, 40, 68–76, (In Chinese with English Abstract). [Google Scholar]
  33. Bai, C.; Su, P.; Su, X.; Cui, H.; Shang, W.; Han, S.; Zhang, G. Characterization of the Sediments in a Gas Hydrate Reservoir in the Northern South China Sea: Implications for Gas Hydrate Accumulation. Mar. Geol. 2022, 453, 106912. [Google Scholar] [CrossRef]
  34. Su, P.; Wei, W.; Shi, C.; Li, J.; Han, W.; Xiao, Z.; Liang, J.; Wang, F.; Wan, Z. Gas Production Characteristics of Biogenic Gas Simulated in Hydrate-Developing Area of Dongsha Area, South China Sea. Front. Mar. Sci. 2023, 10, 1184641. [Google Scholar] [CrossRef]
  35. Sha, Z.; Liang, J.; Zhang, G.; Yang, S.; Lu, J.; Zhang, Z.; McConnell, D.R.; Humphrey, G. A Seepage Gas Hydrate System in Northern South China Sea: Seismic and Well Log Interpretations. Mar. Geol. 2015, 366, 69–78. [Google Scholar] [CrossRef]
  36. Wang, X.; Kneller, B.; Sun, Q. Sediment Waves Control Origins of Submarine Canyons. Geology 2023, 51, 310–314. [Google Scholar] [CrossRef]
  37. Ruan, W.; Hu, C.; Li, Z.; Jia, Y. Effects of the Last Deglaciation Climate Warming on Hydrate Dissociation in the Northern South China Sea. J. Mar. Syst. 2024, 242, 103945. [Google Scholar] [CrossRef]
  38. Zhao, J.; Wang, J.; Phillips, S.C.; Liang, J.; Su, P.; Lin, Q.; Chen, C.; Liu, J. Non-Evaporitic Gypsum Formed in Marine Sediments Due to Sulfate-Methane Transition Zone Fluctuations and Mass Transport Deposits in the Northern South China Sea. Mar. Chem. 2021, 233, 103988. [Google Scholar] [CrossRef]
  39. Bista, D.; Kienast, S.S.; Hill, P.S.; Kienast, M. Sediment Sorting and Focusing in the Eastern Equatorial Pacific. Mar. Geol. 2016, 382, 151–161. [Google Scholar] [CrossRef]
  40. Chen, F.; Su, X.; Lu, H.; Zhou, Y.; Zhuang, C. Relations between biogenic component (Foraminifera) and highly saturated gas hydrates distribution from Shenhu Area, Northern South China Sea. Earth Sci. 2013, 38, 907–915, (In Chinese with English Abstract). [Google Scholar]
  41. Mcmanus, J. Grain Size Determination and Interpretation. In Techniques in Sdimentology; Blackwell: Hoboken, NJ, USA, 1988. [Google Scholar]
  42. Moore, D.M.; Reynolds, R.C. X-ray Diffraction and the Identification and Analysis of Clay Minerals; Oxford University Press: Oxford, UK; New York, NY, USA, 1989; ISBN 978-0-19-505170-4. [Google Scholar]
  43. Hillier, S. Quantitative Analysis of Clay and Other Minerals in Sandstones by X-ray Powder Diffraction (XRPD). In Clay Mineral Cements in Sandstones; Wiley-Blackwell: Hoboken, NJ, USA, 2003. [Google Scholar]
  44. Brunauer, S.; Emmett, P.H.; Teller, E. Adsorption of Gases in Multimolecular Layers. J. Am. Chem. Soc. 1938, 60, 309–319. [Google Scholar] [CrossRef]
  45. Wang, X.; Qian, J.; Lee, M. Methods for estimation of gas hydrate and free gas saturations and application to the northern slope of South China Sea. Mar. Geol. Quat. Geol. 2017, 37, 35–47, (In Chinese with English Abstract). [Google Scholar]
  46. Archie, G.E. The Electrical Resistivity Log as an Aid in Determining Some Reservoir Characteristics. Trans. AIME 1942, 146, 54–62. [Google Scholar] [CrossRef]
  47. Lu, S.; McMechan, G.A. Estimation of Gas Hydrate and Free Gas Saturation, Concentration, and Distribution from Seismic Data. Geophysics 2002, 67, 582–593. [Google Scholar] [CrossRef]
  48. Zhang, W.; Liang, J.; Wei, J.; Lu, J.; Su, P.; Lin, L.; Huang, W.; Guo, Y.; Deng, W.; Yang, X.; et al. Geological and Geophysical Features of and Controls on Occurrence and Accumulation of Gas Hydrates in the First Offshore Gas-Hydrate Production Test Region in the Shenhu Area, Northern South China Sea. Mar. Pet. Geol. 2020, 114, 104191. [Google Scholar] [CrossRef]
  49. Collett, T.S.; Lee, M.W.; Zyrianova, M.V.; Mrozewski, S.A.; Guerin, G.; Cook, A.E.; Goldberg, D.S. Gulf of Mexico Gas Hydrate Joint Industry Project Leg II Logging-While-Drilling Data Acquisition and Analysis. Mar. Pet. Geol. 2012, 34, 41–61. [Google Scholar] [CrossRef]
  50. Li, J.; Lu, J.; Kang, D.; Ning, F.; Lu, H.; Kuang, Z.; Wang, D.; Liu, C.; Hu, G.; Wang, J.; et al. Lithological Characteristics and Hydrocarbon Gas Sources of Gas Hydrate-Bearing Sediments in the Shenhu Area, South China Sea: Implications from the W01B and W02B Sites. Mar. Geol. 2019, 408, 36–47. [Google Scholar] [CrossRef]
  51. Zhuang, C.; Chen, F.; Cheng, S.; Lu, H.; Wu, C.; Cao, J.; Duan, X. Light Carbon Isotope Events of Foraminifera Attributed to Methane Release from Gas Hydrates on the Continental Slope, Northeastern South China Sea. Sci. China Earth Sci. 2016, 59, 1981–1995. [Google Scholar] [CrossRef]
  52. Passega, R. Grain Size Representation by CM Patterns as a Geologic Tool. J. Sediment. Res. 1964, 34, 830–847. [Google Scholar] [CrossRef]
  53. Li, X.S.; Zhou, Q.J.; Su, T.Y.; Liu, L.J.; Gao, S.; Zhou, S.W. Slope-Confined Submarine Canyons in the Baiyun Deep-Water Area, Northern South China Sea: Variation in Their Modern Morphology. Mar. Geophys. Res. 2016, 37, 95–112. [Google Scholar] [CrossRef]
  54. Jin, J.; Wang, X.; Chen, D.; Guo, Y.; Su, P.; Liang, J.; Qian, J. Distribution of gas hydrate in Shenhu area: Identified with well log and seismic multi-attributes. Mar. Geol. Quat. Geol. 2017, 37, 122–130, (In Chinese with English Abstract). [Google Scholar]
  55. Jiang, H.; Su, M.; Lei, X.; Kuang, Z.; Wu, N.; Liu, L.; Yang, R. Distribution of fine-grained turbidites on canyon ridges in the Shenhu area of northern South China Sea and its implications. Mar. Geol. Quat. Geol. 2018, 38, 52–62, (In Chinese with English Abstract). [Google Scholar]
  56. Su, M.; Sha, Z.; Zhang, C.; Wang, H.; Wu, N.; Yang, R.; Liang, J.; Qiao, S.; Cong, X.; Liu, J. Types, Characteristics and Significances of Migrating Pathways of Gas-Bearing Fluids in the Shenhu Area, Northern Continental Slope of the South China Sea. Acta Geol. Sin. Engl. Ed. 2017, 91, 219–231. [Google Scholar] [CrossRef]
  57. Ji, L.; Zhang, T.; Milliken, K.L.; Qu, J.; Zhang, X. Experimental Investigation of Main Controls to Methane Adsorption in Clay-Rich Rocks. Appl. Geochem. 2012, 27, 2533–2545. [Google Scholar] [CrossRef]
  58. Zhang, Y.; Chen, T.; Zhang, Y.; Ren, W. Calculation Methods of Seepage Coefficient for Clay Based on the Permeation Mechanism. Adv. Civ. Eng. 2019, 2019, 6034526. [Google Scholar] [CrossRef]
  59. Bai, C.; Su, P.; Su, X.; Guo, J.; Cui, H.; Han, S.; Zhang, G. Sediment Microstructure in Gas Hydrate Reservoirs and Its Association with Gas Hydrate Accumulation: A Case Study From the Northern South China Sea. Front. Earth Sci. 2022, 10, 876134. [Google Scholar] [CrossRef]
  60. Sun, Y.; Jiang, S.; Li, S.; Wang, X.; Peng, S. Hydrate Formation from Clay Bound Water for CO2 Storage. Chem. Eng. J. 2021, 406, 126872. [Google Scholar] [CrossRef]
  61. Jiang, S. Study on the Influence of Clay Minerals on Hydrate Formation and Reformation. Ph.D. Thesis, Jilin University, Changchun, China, 2023. [Google Scholar]
  62. Yang, J.; Wang, X.; Jin, J.; Li, Y.; Li, J.; Qian, J.; Shi, H.; Zhang, G. The Role of Fluid Migration in the Occurrence of Shallow Gas and Gas Hydrates in the South of the Pearl River Mouth Basin, South China Sea. Interpretation 2017, 5, SM1–SM11. [Google Scholar] [CrossRef]
Figure 1. Geological map of the study area: (a) depicts the geological and water depth of the northern slope of the SCS (modified by [38]); (b) shows an enlarged view of the black box in (a), highlighting the GMGS2 drilling area (modified by [17]).
Jmse 12 00696 g001
Figure 2. Column of sites W08 (a) and W16 (b). Due to the data limitations, gas hydrate saturation between 22 and 186 mbsf in site W16 are not obtained in this study. The left column displays the LWD resistivity values, represented by black curves. The middle columns represent lithology, plotted according to the fractions of sand, silt, and clay in the sediments. The right columns show GH (gas hydrate) saturation levels calculated using chlorinity (light purple triangles), pressure core (pink squares), and LWD resistivity values (red curves). The ‘Interval & Sample’ column indicates the study units and their respective sampling depths, marked by black arrows.
Jmse 12 00696 g002
Figure 3. Column of grain-size parameters (median grain size, sorting, kurtosis, and skewness) of sites W08 (a) and W16 (b). Red triangles and dashed lines represent grain-size parameters from A-type preprocessing method samples and their vertical trends. Blue “X” marks and dashed lines indicate grain-size parameters from B-type preprocessing method samples and their vertical trends.
Jmse 12 00696 g003
Figure 4. Column of whole rock minerals components and SSA from sites W08 (a) and W16 (b). Black lines show the proportions of minerals (quartz, feldspar, carbonate, or clay) in the whole rock, alongside SSA values.
Jmse 12 00696 g004
Figure 5. Column of clay minerals components from sites W08 (a) and W16 (b). Black lines denote the percentages of clay minerals (smectite, illite, kaolinite, chlorite) in the total clay mineral content. Sme, It, Kao, and Chl are short for smectite, illite, kaolinite, and chlorite, respectively.
Jmse 12 00696 g005
Figure 6. Ternary diagram showing lithological classification of sediments from sites W08 and W16.
Jmse 12 00696 g006
Figure 7. Box plot of the sand, silt, and clay fraction of different unit categories. (ac) show the statistical data of sand, silt, and clay fractions, respectively.
Jmse 12 00696 g007
Figure 8. Dispersion diagrams showing the relationship between median grain size and parameters. (a) shows the relationship between silt fraction and median grain size; (bd) show the relationship between sorting, skewness, and kurtosis and median grain size, respectively.
Jmse 12 00696 g008
Figure 9. C-M diagram of sediments from sites W08 and W16.
Jmse 12 00696 g009
Figure 10. Box plot of the grain-size parameters of different unit categories. (ad) show the statistical data of mean grain size, sorting, kurtosis, and skewness, respectively.
Jmse 12 00696 g010
Figure 11. Box plot of difference in sorting (between A- and B-type preprocessing methods) (a) and the relationship between the carbonate minerals component and difference in sorting (b).
Jmse 12 00696 g011
Figure 12. Box plot of the mineral components and SSA of different unit categories. (ad) show the statistical data of quartz, felspar, carbonate minerals, and clay minerals contents in the whole rock, respectively; (eh) show the statistical data of smectite, illite, kaolinite, and chlorite contents in the clay minerals, respectively; (i) shows the statistical data of SSA.
Jmse 12 00696 g012
Figure 13. Dispersion diagrams showing the relationship between minerals components and SSA. (a) is the correlation between the total content of quartz and feldspar and SSA; (b) is the correlation between the content of clay minerals and SSA; (c) is the correlation between the content of smectite in clay minerals and SSA; (d) is the correlation between the content of smectite in whole rock and SSA.
Jmse 12 00696 g013
Figure 14. Gas hydrate enrichment patterns in the deep and shallow layer. The geomorphic of the Dongsha area is drawn according to [35], and the vertical scale of the deposition layers is enlarged. (a) gas hydrate enrichment patterns in macroscale; (b) gas and fluid migration in the NGHL; (c) gas hydrate enrichment in the shallow GHR; (d) gas hydrate enrichment in the deep GHR.
Jmse 12 00696 g014
Table 1. The sample list of sites W08 and W16.
No.SiteSampleDepth (mbsf)No.SiteSampleDepth (mbsf)
1W08W08-14.420W16W16-1046.35
2W08-24.521W16-1160.7
3W08-3522W16-1278.3
4W08-4823W16-1386.1
5W08-518.224W16-1495.5
6W08-620.525W16-1599
7W08-723.426W16-16109.3
8W08-861.627W16-17133.7
9W08-985.728W16-18146.35
10W08-1093.729W16-19148
11W16W16-17.7530W16-20155.3
12W16-29.3531W16-21160.5
13W16-311.832W16-22165.35
14W16-412.8533W16-23179.5
15W16-51634W16-24181.65
16W16-617.3535W16-25193.35
17W16-72536W16-26193.41
18W16-82737W16-27205.3
19W16-942.3
Table 2. Classification of the study intervals at sites W08 and W16.
IntervalsSiteDepth Range (mbsf)Maximum Gas Hydrate Saturation (%) *
Shallow non-gas hydrate layers (NGHL)W080~8-
W160~10
Shallow gas hydrate reservoirs (GHR)W088~2414%
W1610~2442%
Deep non-gas hydrate layers (NGHL)W0824~61-
W1624~182
Deep gas hydrate reservoirs (GHR)W0861~9533%
W16182~20650%
* The data of gas hydrate saturation were obtained from [17,35].
Disclaimer/Publisher’s Note: The statements, opinions and data contained in all publications are solely those of the individual author(s) and contributor(s) and not of MDPI and/or the editor(s). MDPI and/or the editor(s) disclaim responsibility for any injury to people or property resulting from any ideas, methods, instructions or products referred to in the content.

