1. Introduction
Floating offshore wind energy research is focused on developing new platform concepts that fit the necessary requirements of the stability for a wind turbine design and also present competitive construction and operational costs.
As in the Oil and Gas (O&G) Industry, into the design stage of the new platform concepts, the motion and loads of the platform have to be assessed and well predicted in several load combinations to ensure the reliability of the structure and the mooring system. The main approaches to predict the whole platform behavior are the numerical simulation and the physical scale models. However, it is still widely accepted in the offshore industry that model testing is the most reliable procedure to validate the results and to be the final benchmark for the design of a platform.
The physical model testing is mainly performed in the ocean engineering basins, where the environmental conditions such as waves, currents and wind can be reproduced [
1,
2]. Furthermore, there are others facilities that can reproduce the ocean situations like wave flumes that are not commonly used due to their highly restrictive dimensions. On the other hand, the usage of these installations would help the development of the offshore wind technology allowing the performance of the model tests in more places and reducing costs in that research field.
Some wind offshore platforms model tests have been performed in wave flumes despite their limited width dimension. One example is a Tension Leg Platform (TLP) prototype tested in the CEHINAV (Canal de Ensayos Hidrodinámicos) [
3]. In this particular case, a flume is a suitable place for testing because of the inner configuration of a TLP, a buoyant platform moored with vertical tethers. Even a spread mooring system does not seem to fit well in a wave flume; Krawkosky
et al [
4] tested a spar scale model with a four line mooring system in a flume. The azimuthal angles between two adjacent mooring lines were of 90 degrees. The lines were scaled in two different ways, the lines placed in the longitudinal direction of the tank are well-scaled using proper tethers, while in the transverse direction the mooring lines are modeled as two constant forces. The forces were applied by two ropes hanging on both sides of the flume with weights on their extremes. However, this simplification does not allow changing the waves relative direction to the platform position because the scaled mooring system only works in the longitudinal direction. Furthermore, a three line mooring system could not be scaled in the same way because the different symmetry between the mooring system and the wave flume. Then, in order to perform tests with different wave directions using the same scaled mooring system, an equivalent system with shorter radius to anchor should be designed. In such a mooring system, the line length should be truncated to allow placing all mooring lines in the wave flume. Other scale models have been tested in bigger basins, [
5] uses truncated mooring lines attached to springs because the depth of the basin does not match the model in the selected scale. Another solution to overcome the width basin constraint was adopted by [
6], where the mooring line segment, constantly resting on the seabed during the tests, was removed. This lead to a shorter radius to anchor using the well scaled prototype mooring system.
Truncated mooring systems are a common scale method used in the O&G industry [
7,
8,
9,
10]. Since the tank basins sizes do not allow performing tests in the common scales for the upcoming ultra-deep waters, new systems have to be conceived to manage this challenge. The truncated passive system is the most widely used and feasible method of the hybrid model testing methods, which uses a combination of physical model tests and numerical modeling. In the passive method, all the model characteristics like platform properties, wave height, current velocity,
etc., are well scaled except the working depth and the mooring shape. This method uses an equivalent truncated mooring system for the scale tests and the results are used to interpret and adjust the model in order to perform a full depth numerical model.
Stansberg [
9] states the challenges for the development of the truncated passive methods. The new truncated mooring system set-up has to guarantee the following aspects: (1) the motion response should have the same behavior as the results of the full-depth mooring system and (2) the truncated mooring system should present the most similar physical properties as the full-depth system. To achieve the correct design of the truncated mooring system, Stansberg presents the following rules ordered by priority.
Model the total horizontal restoring force
Model the quasi-static coupling between vessel responses
Model a “representative” level of mooring and riser system damping, and current force
Model a “representative” single line tension characteristics (at least quasi-static)
In the field of the truncated mooring system design, optimization models to better adjust the truncated system approach to the real one commonly solve the problem. Zhang [
10] proposed an annealing simulation algorithm for hybrid discrete variables (ASFHDV) to optimize the static response of a single catenary and the whole catenary system static response in one direction. Further investigations propose an optimization model that accounts for the mooring-induced damping generated by the transverse motion of the mooring line due to the low-frequency surge oscillation using a genetic algorithm [
7]. In order to improve the behavior of the truncated mooring line, Qiao [
8] proposes the connection of viscous dampers joined to the mooring line to simulate the whole damping of the real mooring line. These models have been validated and widely used, but the quasi-static approach could underestimate the tension in the mooring lines due to dynamics when those are important [
11]. On the other hand, new methods have recently been developed to take into account the line dynamics and obtain a more realistic system behavior using the real scaled mooring line in the upper sections, where the line dynamics are more important, and using external actuators that replicate the truncated line segments behavior [
12].
The main contribution of this paper is the design of a truncated mooring system to replace the prototype mooring system, which cannot be installed due to basin constraints. The truncated mooring system is designed as a simple mooring line composed of two materials without any other external systems as springs. This new mooring system allows the study of several wave approaching directions to the whole structure, float and moorings. Tests results and the comparison with numerical simulations are also presented.
First, the real model and the scale model due to the basin constrains are presented. Then, the calculation of the static mooring forces and the optimization problem are described. Finally, the optimization and the experimental results, with the comparison with numerical simulations, are discussed.
2. Real Model
The monolithic concrete spar, the so-called Windcrete [
13], is a prototype floating platform for wind turbines developed in AFOSP (Alternative Floating Platform Designs for Offshore Wind Turbines using Low Cost Materials) within a KIC-InnoEnergy innovation project [
14,
15,
16].
The spar prototype is designed as a monolithic concrete structure from the top of the tower to the bottom of the buoy, thus joints are avoided to ensure water-tightness and a good fatigue behavior. The structure, for a 5 MW wind turbine, is composed of three parts: first, the buoy, composed of a cylinder with a diameter of 13 m and a height of 120 m; second, the transition segment, which is a cone of 10 m high, these two parts are the submerged ones, therefore the total draft of the structure is 130 m. The third part is the emerged tower that reaches 87.6 m above the SWL. A sketch of the concept and its hydrodynamic characteristics are shown in
Figure 1 and
Table 1. The moorings system is connected to the platform at the fairleads located 60 m above the bottom with a draft of 70 m, near the Centre of Gravity (COG) to reduce the coupling motions between the surge and pitch.
In this study, the Windcrete is considered to be placed in a 265 m depth sea location. The mooring system is configured to provide enough restoring force to maintain the platform motion in a relative offset and to prevail over the wave and wind loads. In order to achieve simplicity in the model, the prototype mooring system is composed of three equispaced chain mooring lines with the same cross section. The main characteristics of the line are defined in the
Table 2.
3. Scale Model
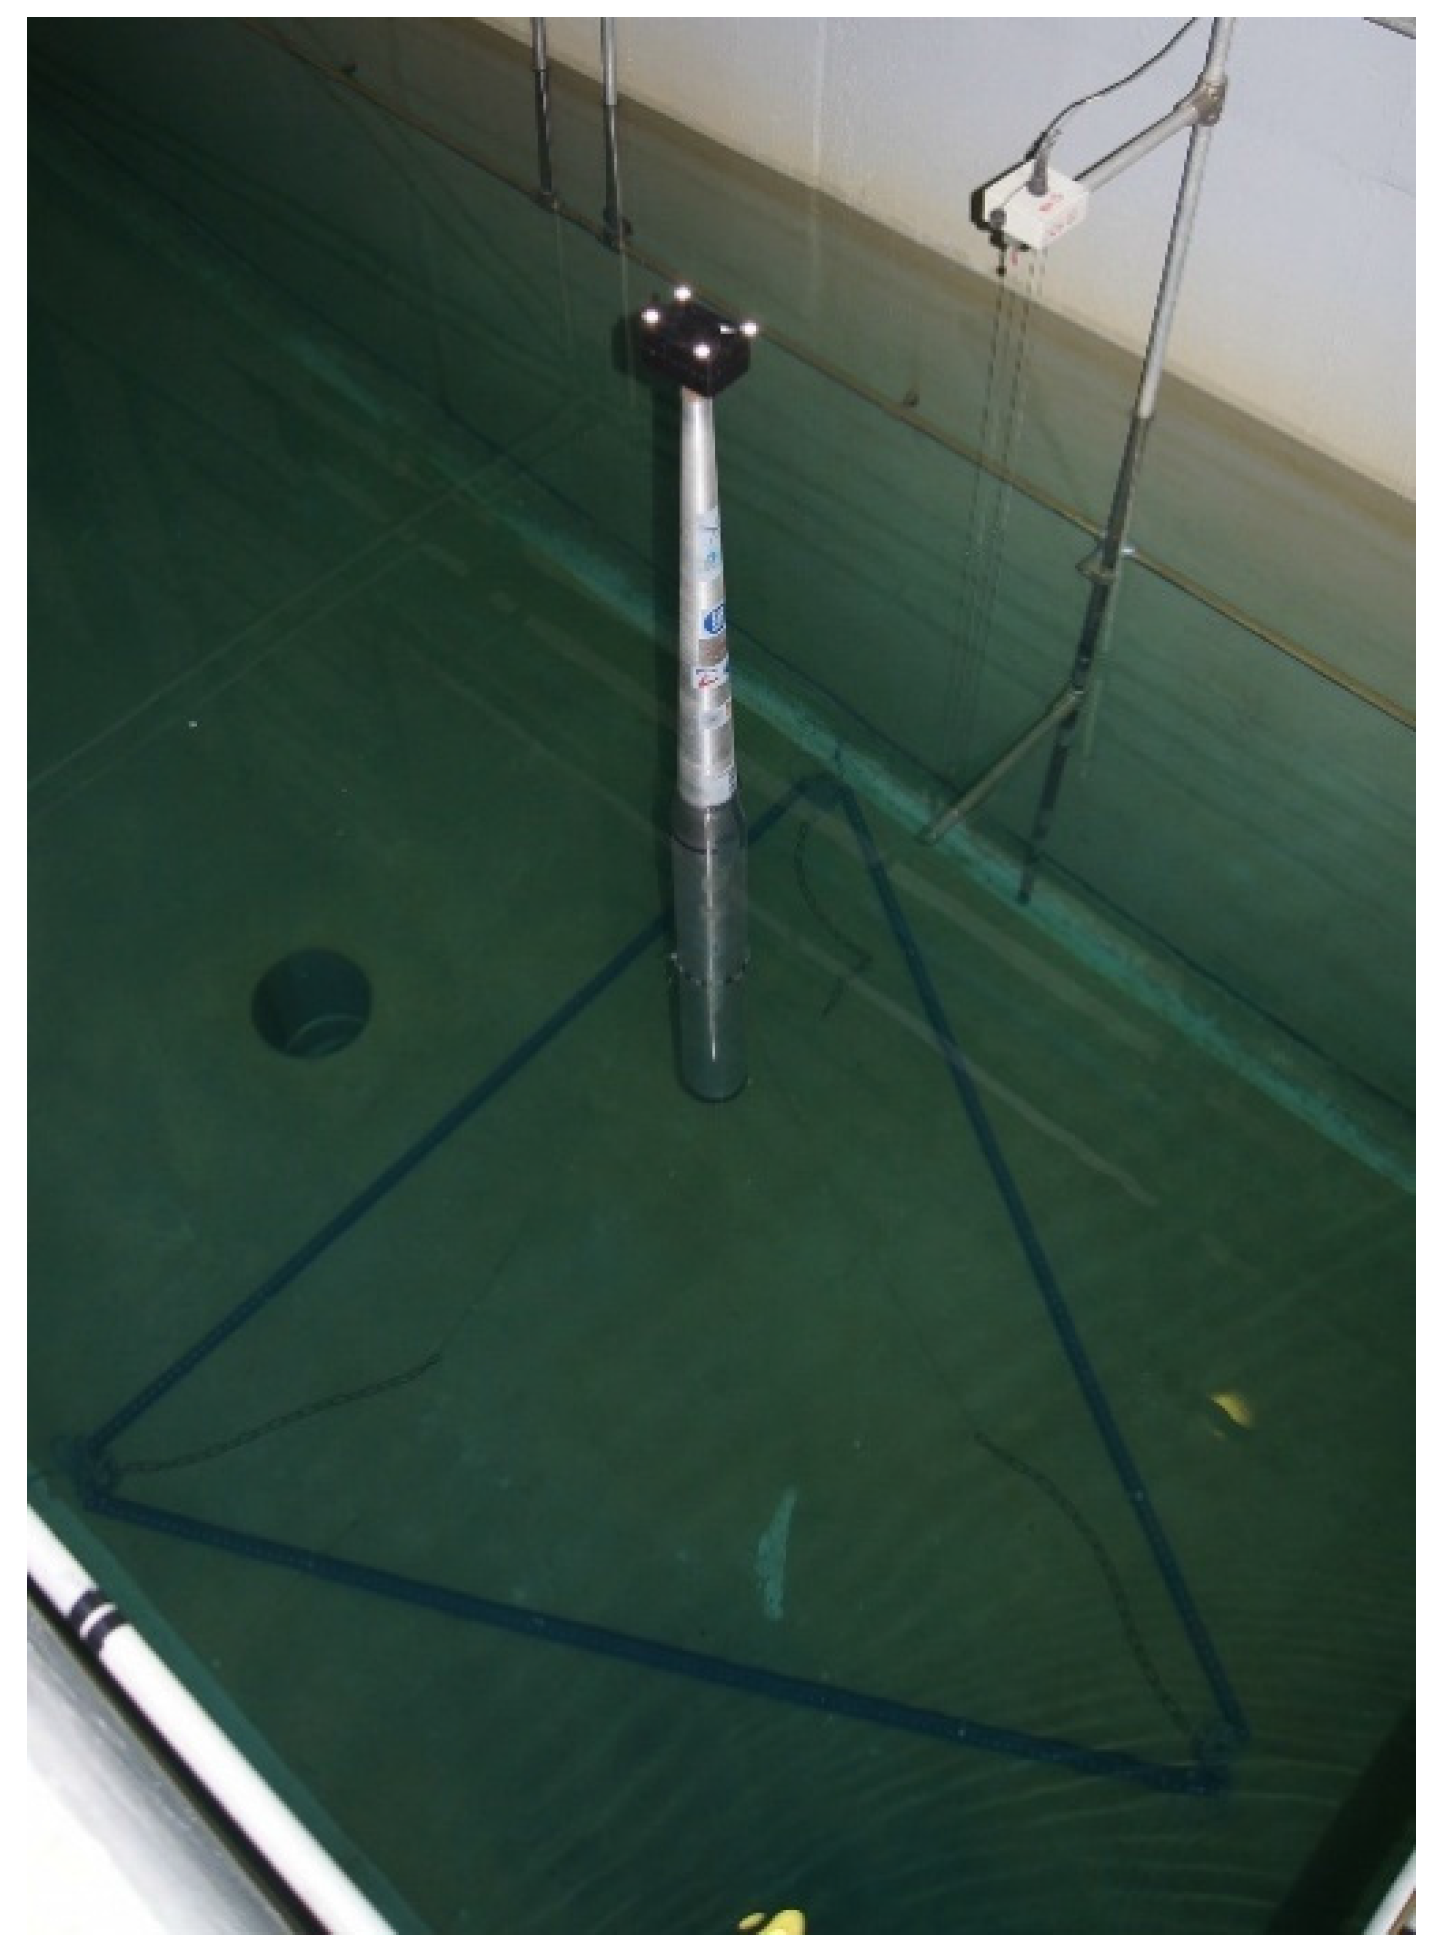
Model tests were performed in the ICTS-CIEM (Investigation flume and offshore experimentation) inside LIM (Maritime Engineering Laboratory) at the UPC (Universitat Politècnica de Catalunya—BarcelonaTech). The flume is equipped with a wave generator that can generate waves from 10 cm up to 160 cm height. The flume is 100 meters long with a cross section 3.5 m wide and 5 m high. The flume and the wave paddle are shown in
Figure 2 and
Figure 3, respectively.
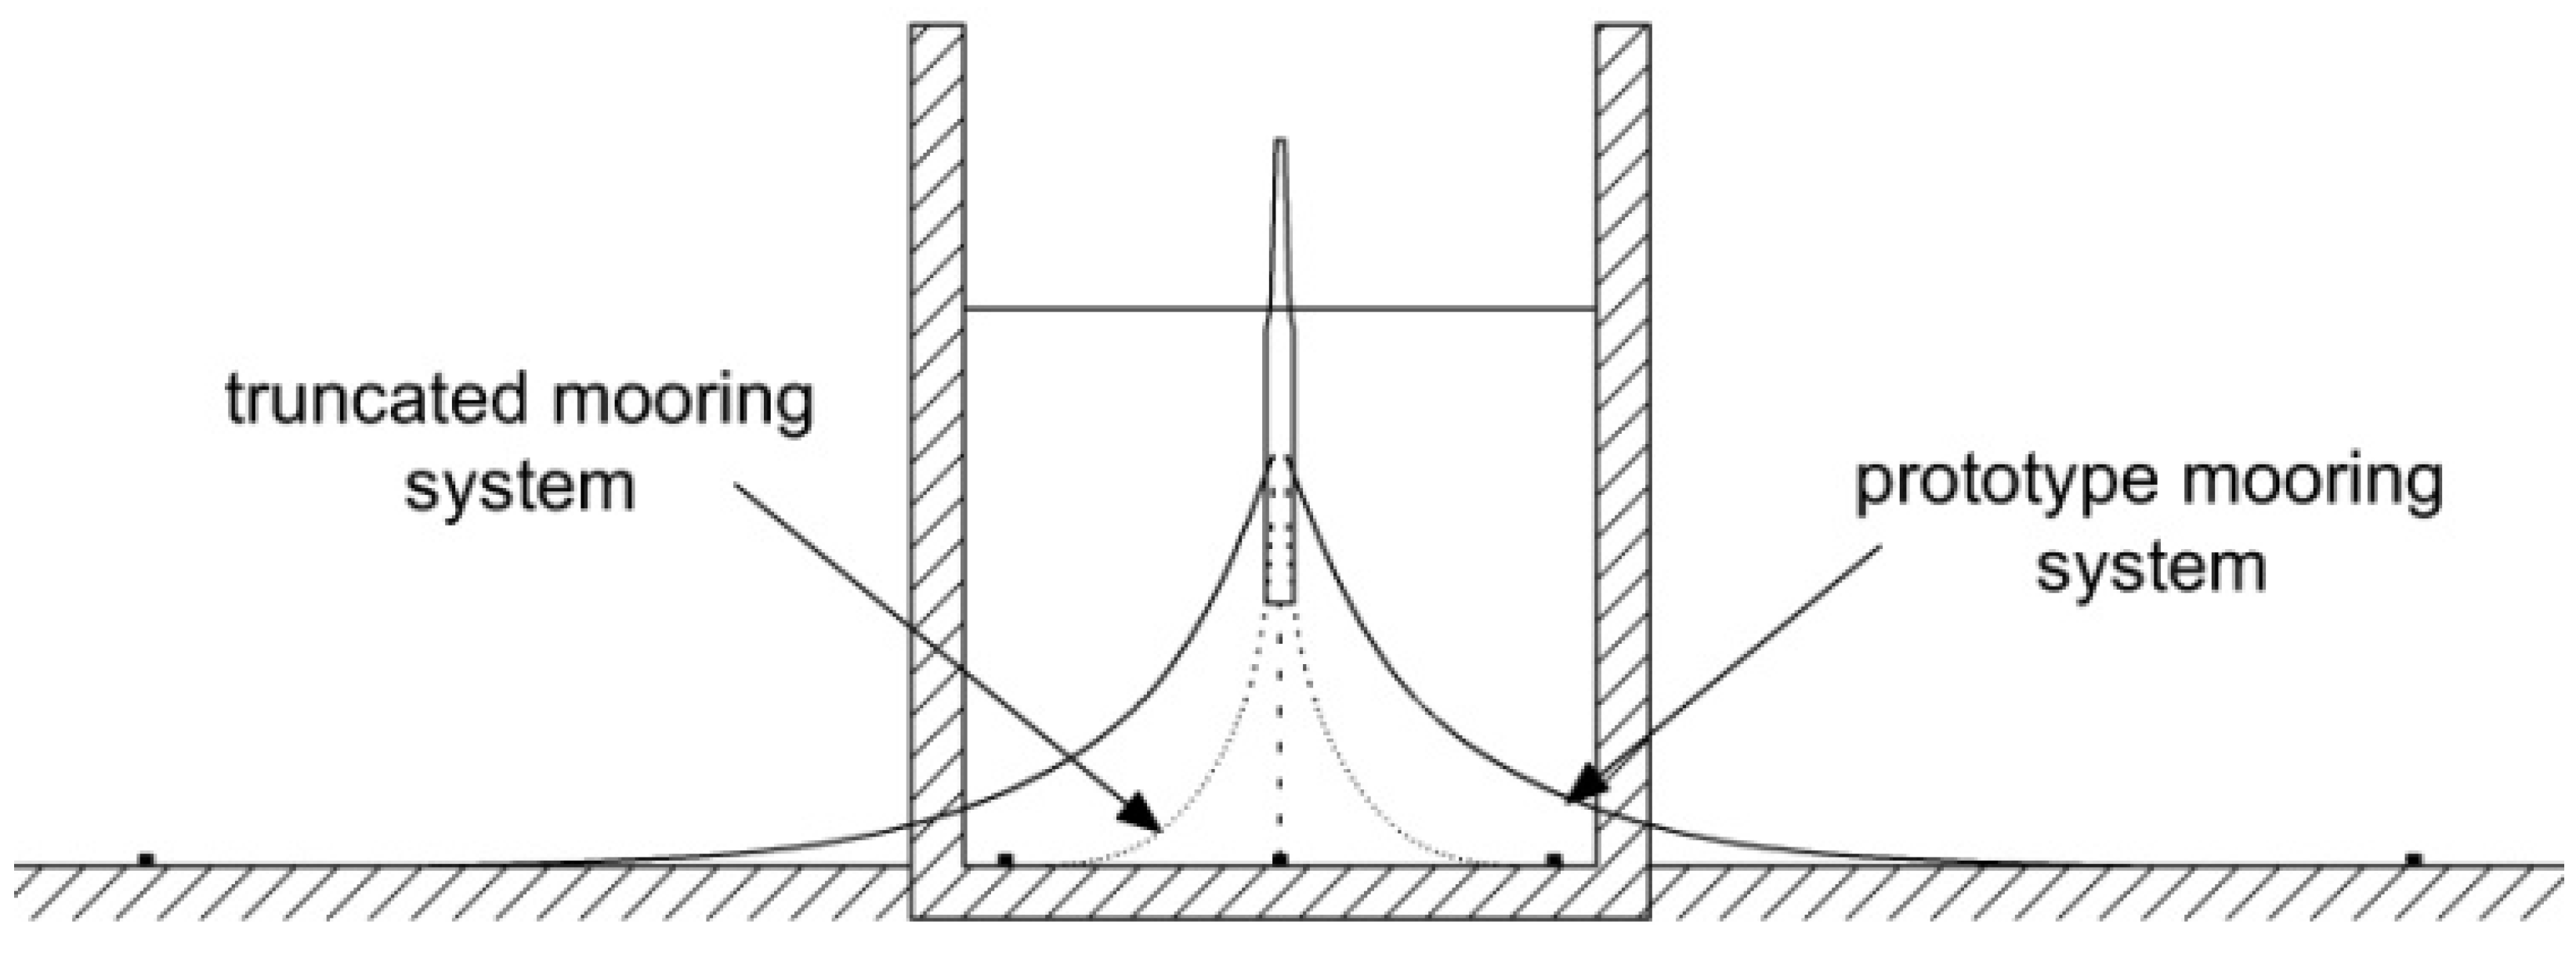
According to the prototype’s sizes and the flume height, the selected scale is 1:100. Then, the scaled depth would be 2.65 m. The flume width does not allow the direct scaling of the catenary lines because the common anchor radius should be between two and four times the total depth, requiring a 10 m wide channel. Furthermore, if several wave directions are studied, the mooring system should be able to rotate in
z direction allowing the wave to impact on the platform from different relative direction with the mooring system. Then, the mooring system should not be connected through the flume wall. For these reasons, a truncated mooring system is used in the model scale test, reducing the radius to anchor distance, and therefore the total length of the lines.
Figure 4 shows the cross section of the wave flume with both the scale prototype mooring system and the truncated one.
Figure 1.
Sketch of Windcrete concept.
Figure 1.
Sketch of Windcrete concept.
Table 1.
Hydrostatic characteristics of Windcrete.
Table 1.
Hydrostatic characteristics of Windcrete.
| Property | Value |
|---|
| Displaced Volume [m3] | 1.69 × 10⁴ |
| Draft [m] | 130.0 |
| Concrete mass [kg] | 8.71 × 10⁶ |
| Ballast mass [kg] | 8.34 × 10⁶ |
| Wind turbine mass [kg] | 3.50 × 10⁵ |
| CM [m] | 53.34 |
| CB [m] | 63.97 |
| Metacentric height [m] | 10.57 |
Table 2.
Prototype mooring line characteristics.
Table 2.
Prototype mooring line characteristics.
| Depth [m] | 265 |
|---|
| Draft to fairlead [m] | 70 |
| Mooring depth | 195 |
| Radius to anchor [m] | 660 |
| Line length [m] | 732.93 |
| Line mass per unit length [kg/m] | 150.3 |
The truncated mooring system is defined by the radius to anchor, the line length and the materials that compose the different segments of the mooring line. The radius to anchor is previously defined as the maximum radius allowed by the channel width taking account the margins for a proper installation operation of the mooring system. Furthermore, if the truncated mooring line were composed of a unique cross section, the necessary weight to achieve the restoring forces of the prototype system would cause huge vertical forces on the floating platform. For this reason, two different chain sections are chosen to design the mooring line. The heaviest line section is positioned at the bottom, connected to the anchor, providing the restoring horizontal force. The upper section, a light segment connected to the platform, reduces the total line payload due to its light weight. The exact properties of the lines are obtained through an optimization problem to fit the responses between the prototype mooring system and the truncated one, which is presented in next sections.
Figure 3.
CIEM wave paddle.
Figure 3.
CIEM wave paddle.
Figure 4.
Prototype vs. truncated mooring system.
Figure 4.
Prototype vs. truncated mooring system.
4. Static Mooring Lines Forces
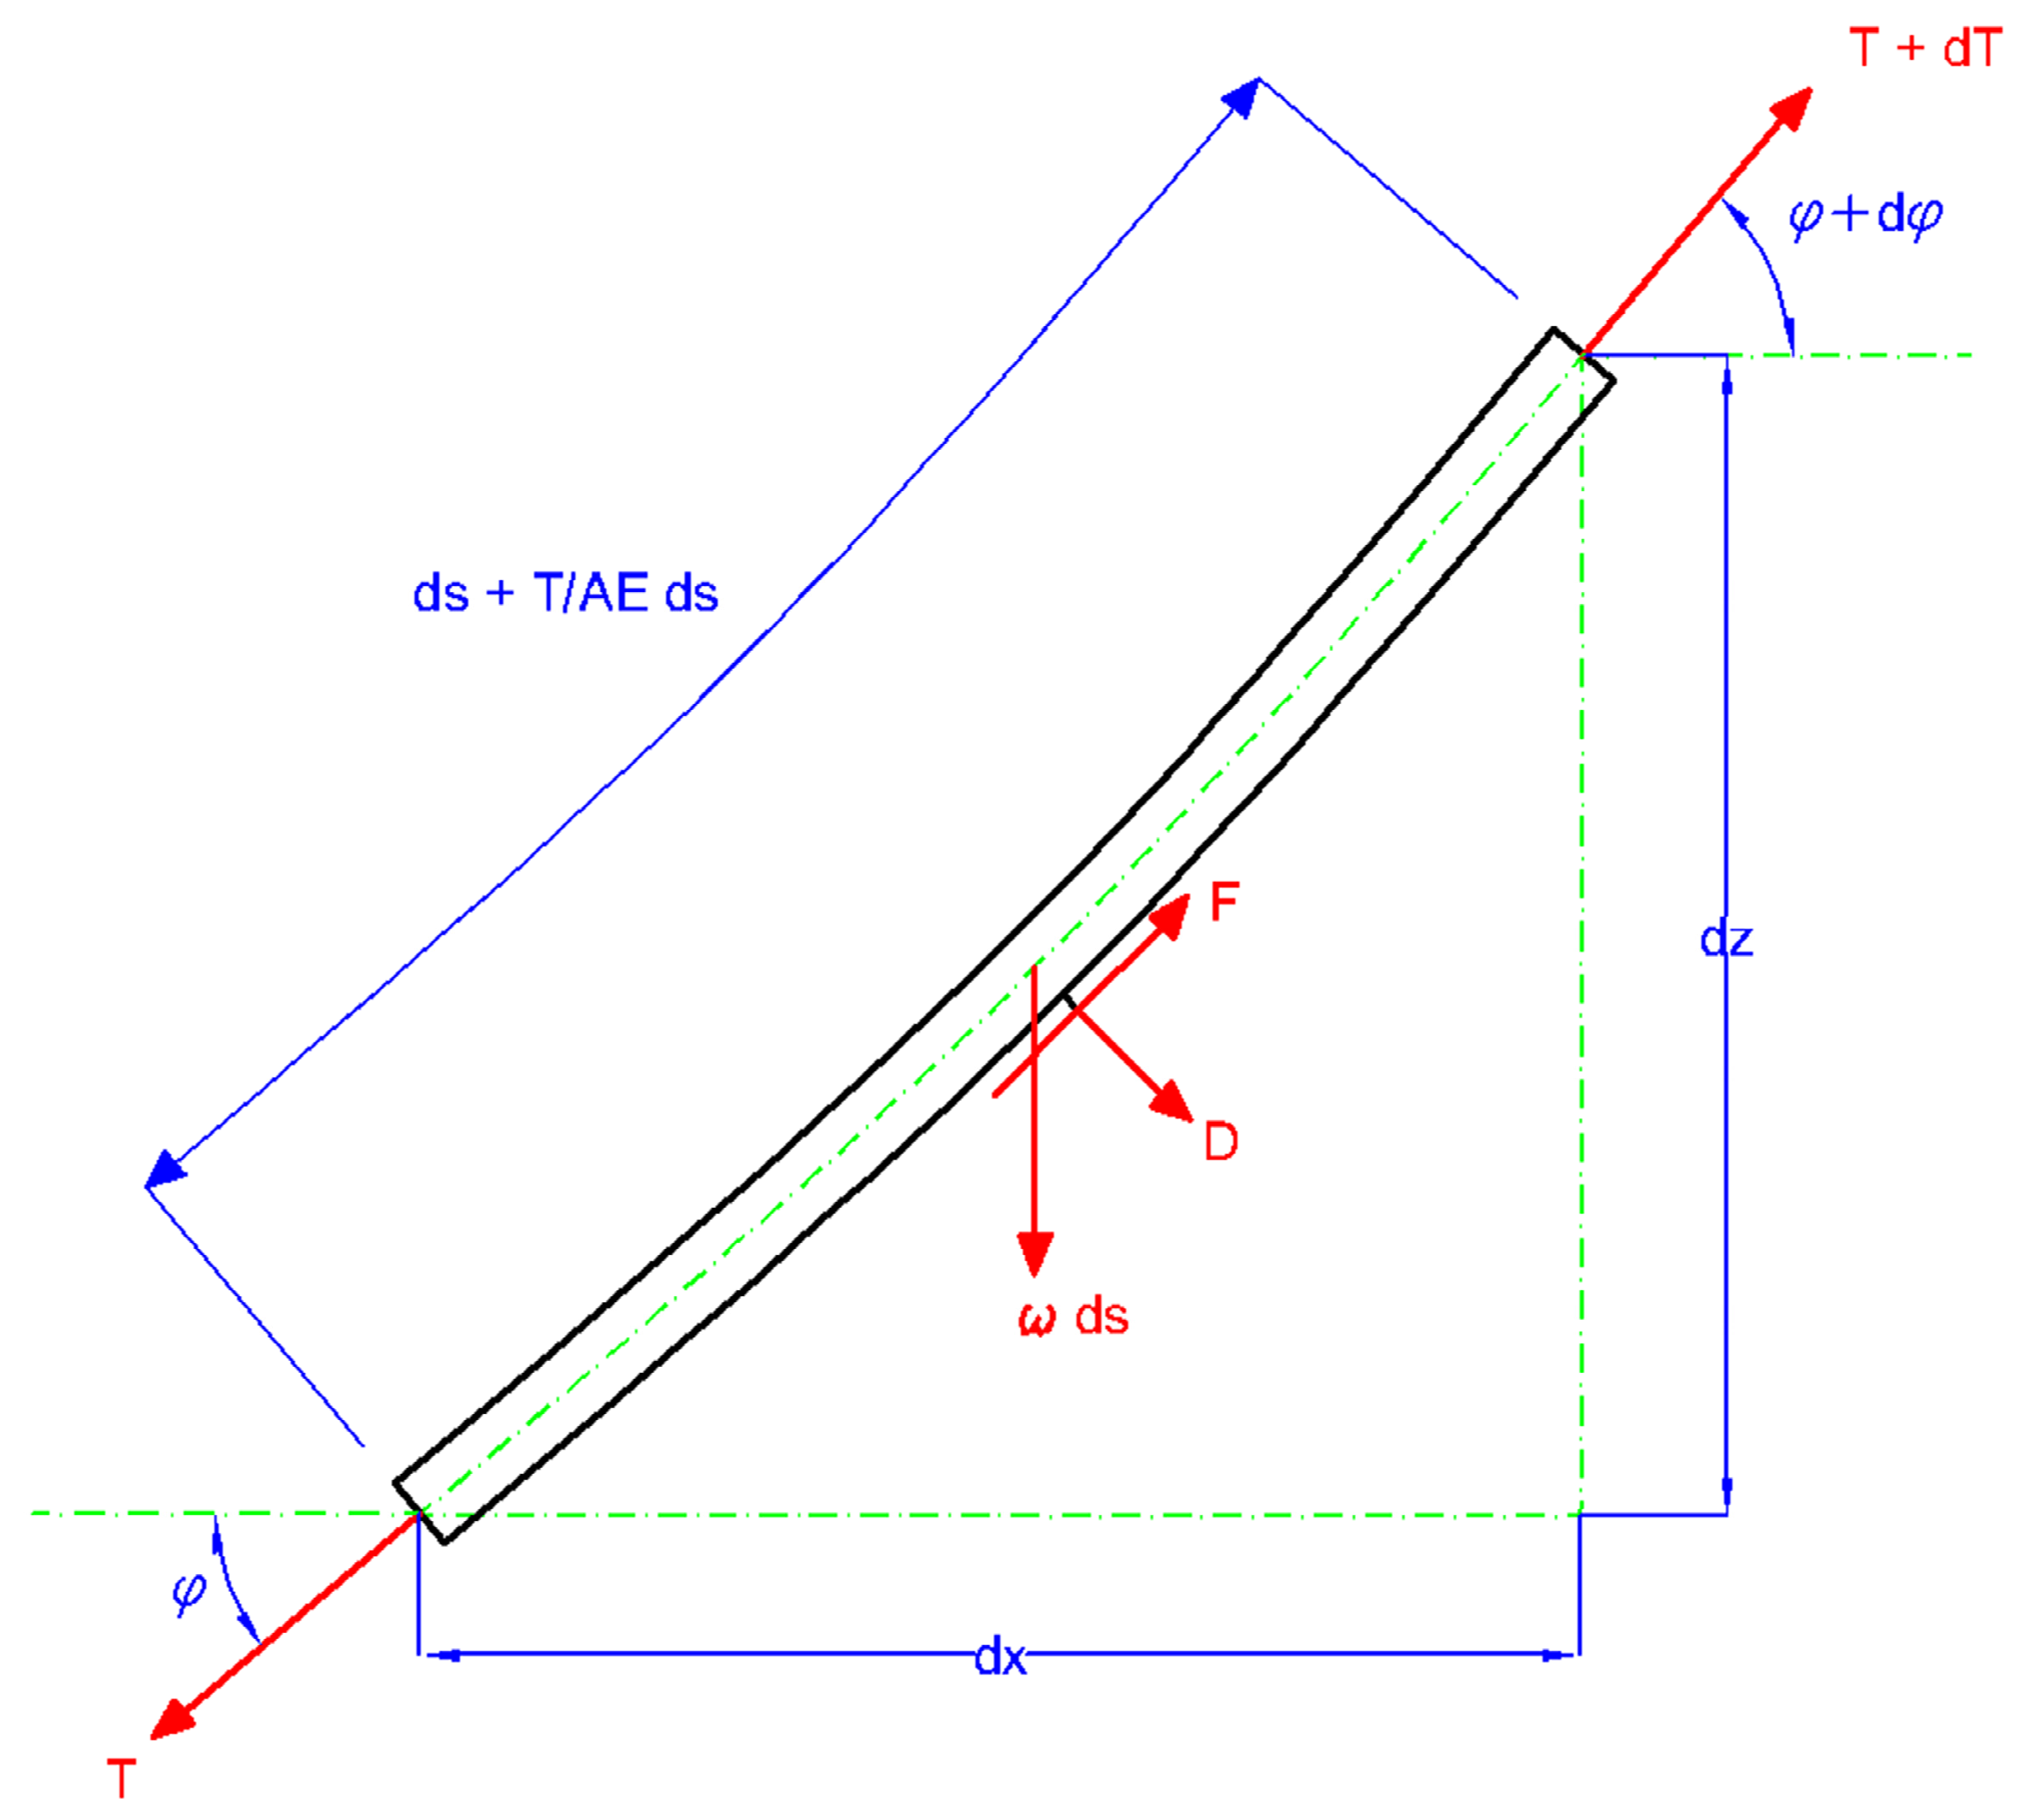
The static catenary line can be described by the equations deduced from applying equilibrium on the whole forces acting on a line segment. As is shown in
Figure 5, a catenary segment is subjected to the inner line tensions
, the gravity forces accounted by the weight per unit length of the line
and the hydrodynamic forces, which are the transversal drag forces per unit length
and the normal drag forces per unit length
.
The static equilibrium of the line segment leads to the following equations:
Figure 5.
Segment line forces scheme.
Figure 5.
Segment line forces scheme.
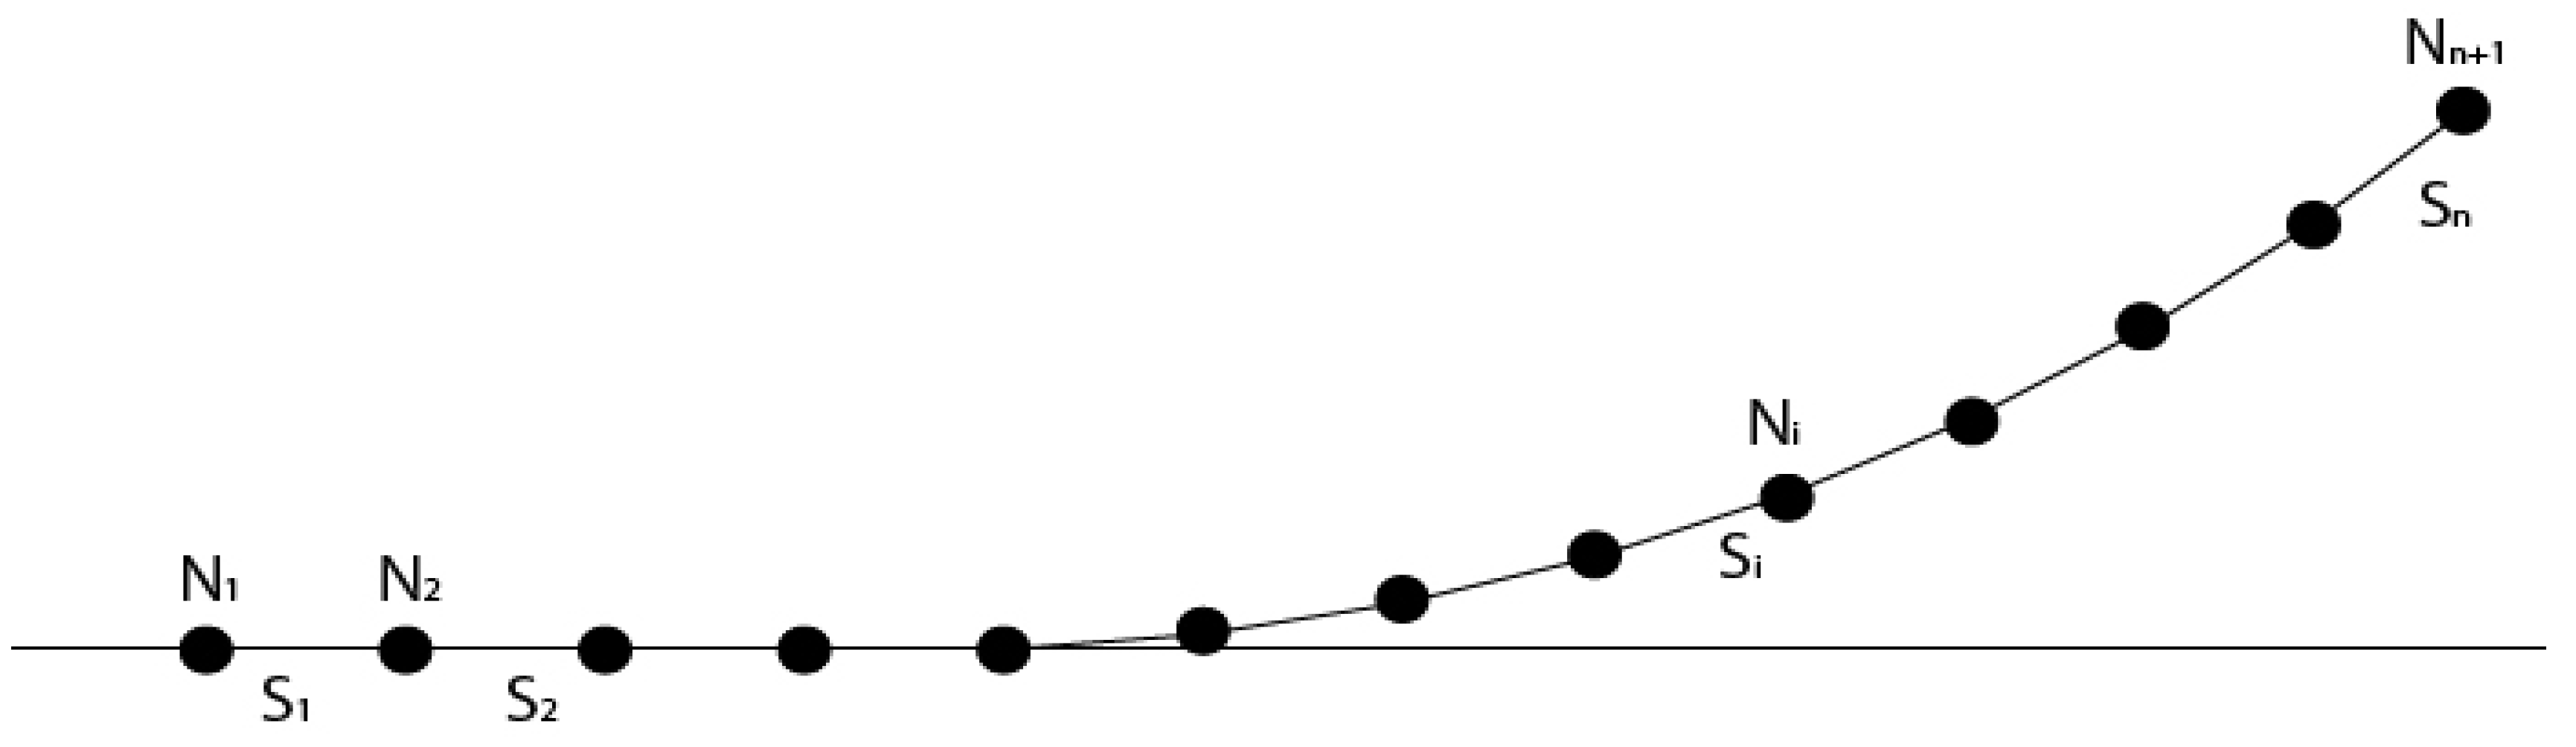
To solve Equations (1) and (2), the mooring line is discretized in n + 1 nodes forming n line elements. The nodes are described as
and the segments as
. The properties that define each element are the weight per unit length
, its length
and the longitudinal stiffness
.
Figure 6 shows a sketch of the mooring line composed by n segments.
Figure 6.
Mooring line piecewise scheme.
Figure 6.
Mooring line piecewise scheme.
Without taking into account the hydrodynamic forces, the tensions in each node are evaluated from the tensions of the previous node applying the external forces placed on the centre of each element. Equations (3)–(5) express the tensions of the (
i+1)
th node
as a function of the tensions of
ith node
in the 3DOF (Degrees of freedom) (
Figure 7).
Figure 7.
Force scheme of two consecutive nodes.
Figure 7.
Force scheme of two consecutive nodes.
The position of the (
i+1)
th node
, as shown in
Figure 7, can be expressed from the position of the
ith node
(Equation (7)). Where
(Equation (6)) is the directional vector, and
(Equation (8)) is the strain of the element.
The computing procedure follows the scheme proposed by [
7]. The position of the nodes are evaluated from the initial approach of the tension force in the node n + 1
and the position of the anchor
. If the assessed/estimated position of the fairlead
is not close enough to the known value, a new approximation of
is applied using a non-linear solving method.
By using this method, the mooring line response is evaluated at any fairlead position and the forces on the top of the line are determined. This method can be modified to take into account the hydrodynamic forces in the static analysis. In addition, more complex geometries, such as delta connections, and external elements, such as clumps weights or buoys, can be included.
The mooring system response is obtained by combining the forces on the fairleads of all mooring lines.
5. Optimization Problem
The objective of the optimization problem is to determine a new catenary system presenting a similar static behavior of the prototype when the radius to anchor is reduced. This kind of problem can be expressed as a minimization problem, where the static response of the truncated mooring system has to fit with the prototype ones in a non-scale scenario. Then the properties of the truncated mooring system will be well scaled for the tests.
The optimization problem can be expressed mathematically as:
Subjected to the constraints:
where:
is the objective function to be minimized over the variables
; are the inequality constraints
; j = 1,…,p are the equality constraints
The design variables are the parameters that define the mooring line. In order to reduce the complexity of the optimization problem and the final design, the mooring truncated line would have two different segments. Each segment is defined by its lengths and chain diameter. Then, the design variables are the components of the vector
defined as
, where
d is the diameter,
l the segment length and the subscript defines the segment. The weight per unit length
and the longitudinal stiffness (
EA) of the segment line can be calculated from the chain diameter
(d[mm]), using Equations (11) and (12).
The objective function—to be minimized—is formulated from the prototype mooring line force responses
that have to be emulated. The objective function is evaluated in several points of the surge work rang
since it is the main movement direction. The responses emulated are the horizontal and vertical restoring forces of the mooring system and the line tension. As shown in
Figure 8, the objective function is expressed as the difference between the response of the prototype mooring system and the truncated one. This distance has to be minimized as a function of the mooring variable
.
Figure 8.
Prototype vs. truncated mooring system response.
Figure 8.
Prototype vs. truncated mooring system response.
The objective function can be expressed as the sum of the single objective function of each property multiplied by a weight factor Equation (13). The sum of all weight factors is 1:
.
Each single objective function (Equation (14)) is expressed as the root mean square value (rms) of the dimensionless difference between the prototype response and the truncated one, which are evaluated in the
n selected surge points:
The optimization problem is solved using the GlobalSearch Algorithm in
Matlab [
17], which uses a scatter-search mechanism for generating start points. From the starting points, GlobalSearch examines the trial points and choose the ones that can generate a better solution. Then, the chosen points are evaluated by a local minimization solver. The process ends when all the trial-points have been evaluated [
18].
6. Truncated Mooring System Design for Windcrete
The truncated mooring system was designed for a radius to anchor of 140 m. The objective function was evaluated for a surge excursion ranging from −40 to 25 m. Surge excursion is the main platform motion that depends on the mooring system response. The surge interval ensures a horizontal response for a 600 kN mean wind force. The asymmetry of the mooring system (
Figure 9) produces an asymmetry response in surge.
Figure 9.
Mooring system sketch.
Figure 9.
Mooring system sketch.
The chosen characteristics of the prototype to be minimized in the multi-objective function are: the tension of one line, the horizontal mooring system response and the vertical mooring system response. Therefore the multi-objective function can be described as Equation (15).
where
is the function to optimize the tension of a line; and
and
are the functions which describe the difference between the response prototype and truncated mooring system in
and
direction, respectively. Since the surge response is mainly depends on the mooring system, the largest weight factor
is given to it. Selected weights are consistent with the references [
7,
10]. The weighting factors used for the multi-objective problem are 0.2, 0.6 and 0.2 for
and
respectively. A sensitivity analysis of the variation of the weight factors was performed. It confirmed that low variations of the weight factors lead to a similar solution of the optimization problem.
The constraints applied to the problem are the length of the line, which is defined between its taut (Equation (16)) and completely slack (Equation (17)) shape. These constraints are expressed as a function of the radius to anchor and the mooring depth. Other constraints are the minimum and maximum diameter of the lines, defined by Equations (18) and (19), respectively, which are fixed to get a feasible scalable chain for the tests.
The solution of the optimization problem yields to a truncated catenary system composed by lines of two different segments with different weight per unit length. The segment
a is the lower one and is linked to the anchor, while the segment
b is the upper one and is connected to the platform. The segment
a is heavier and shorter than segment
b. With this configuration, the stiffness of the restoring force of the catenary system is mainly provided by the segment a, while the segment b contributes to reduce the suspended weight of the mooring line. The properties of each segment of the mooring line as a result of the optimization problem are shown in the
Table 3.
Table 3.
Truncated mooring line characteristics.
Table 3.
Truncated mooring line characteristics.
| Segment a | Diameter [mm] | 200.1 |
| Length [m] | 80 |
| Line mass per unit length [kg/m] | 878.6 |
| Segment b | Diameter [mm] | 58.4 |
| Length [m] | 177 |
| Line mass per unit length [kg/m] | 74.7 |
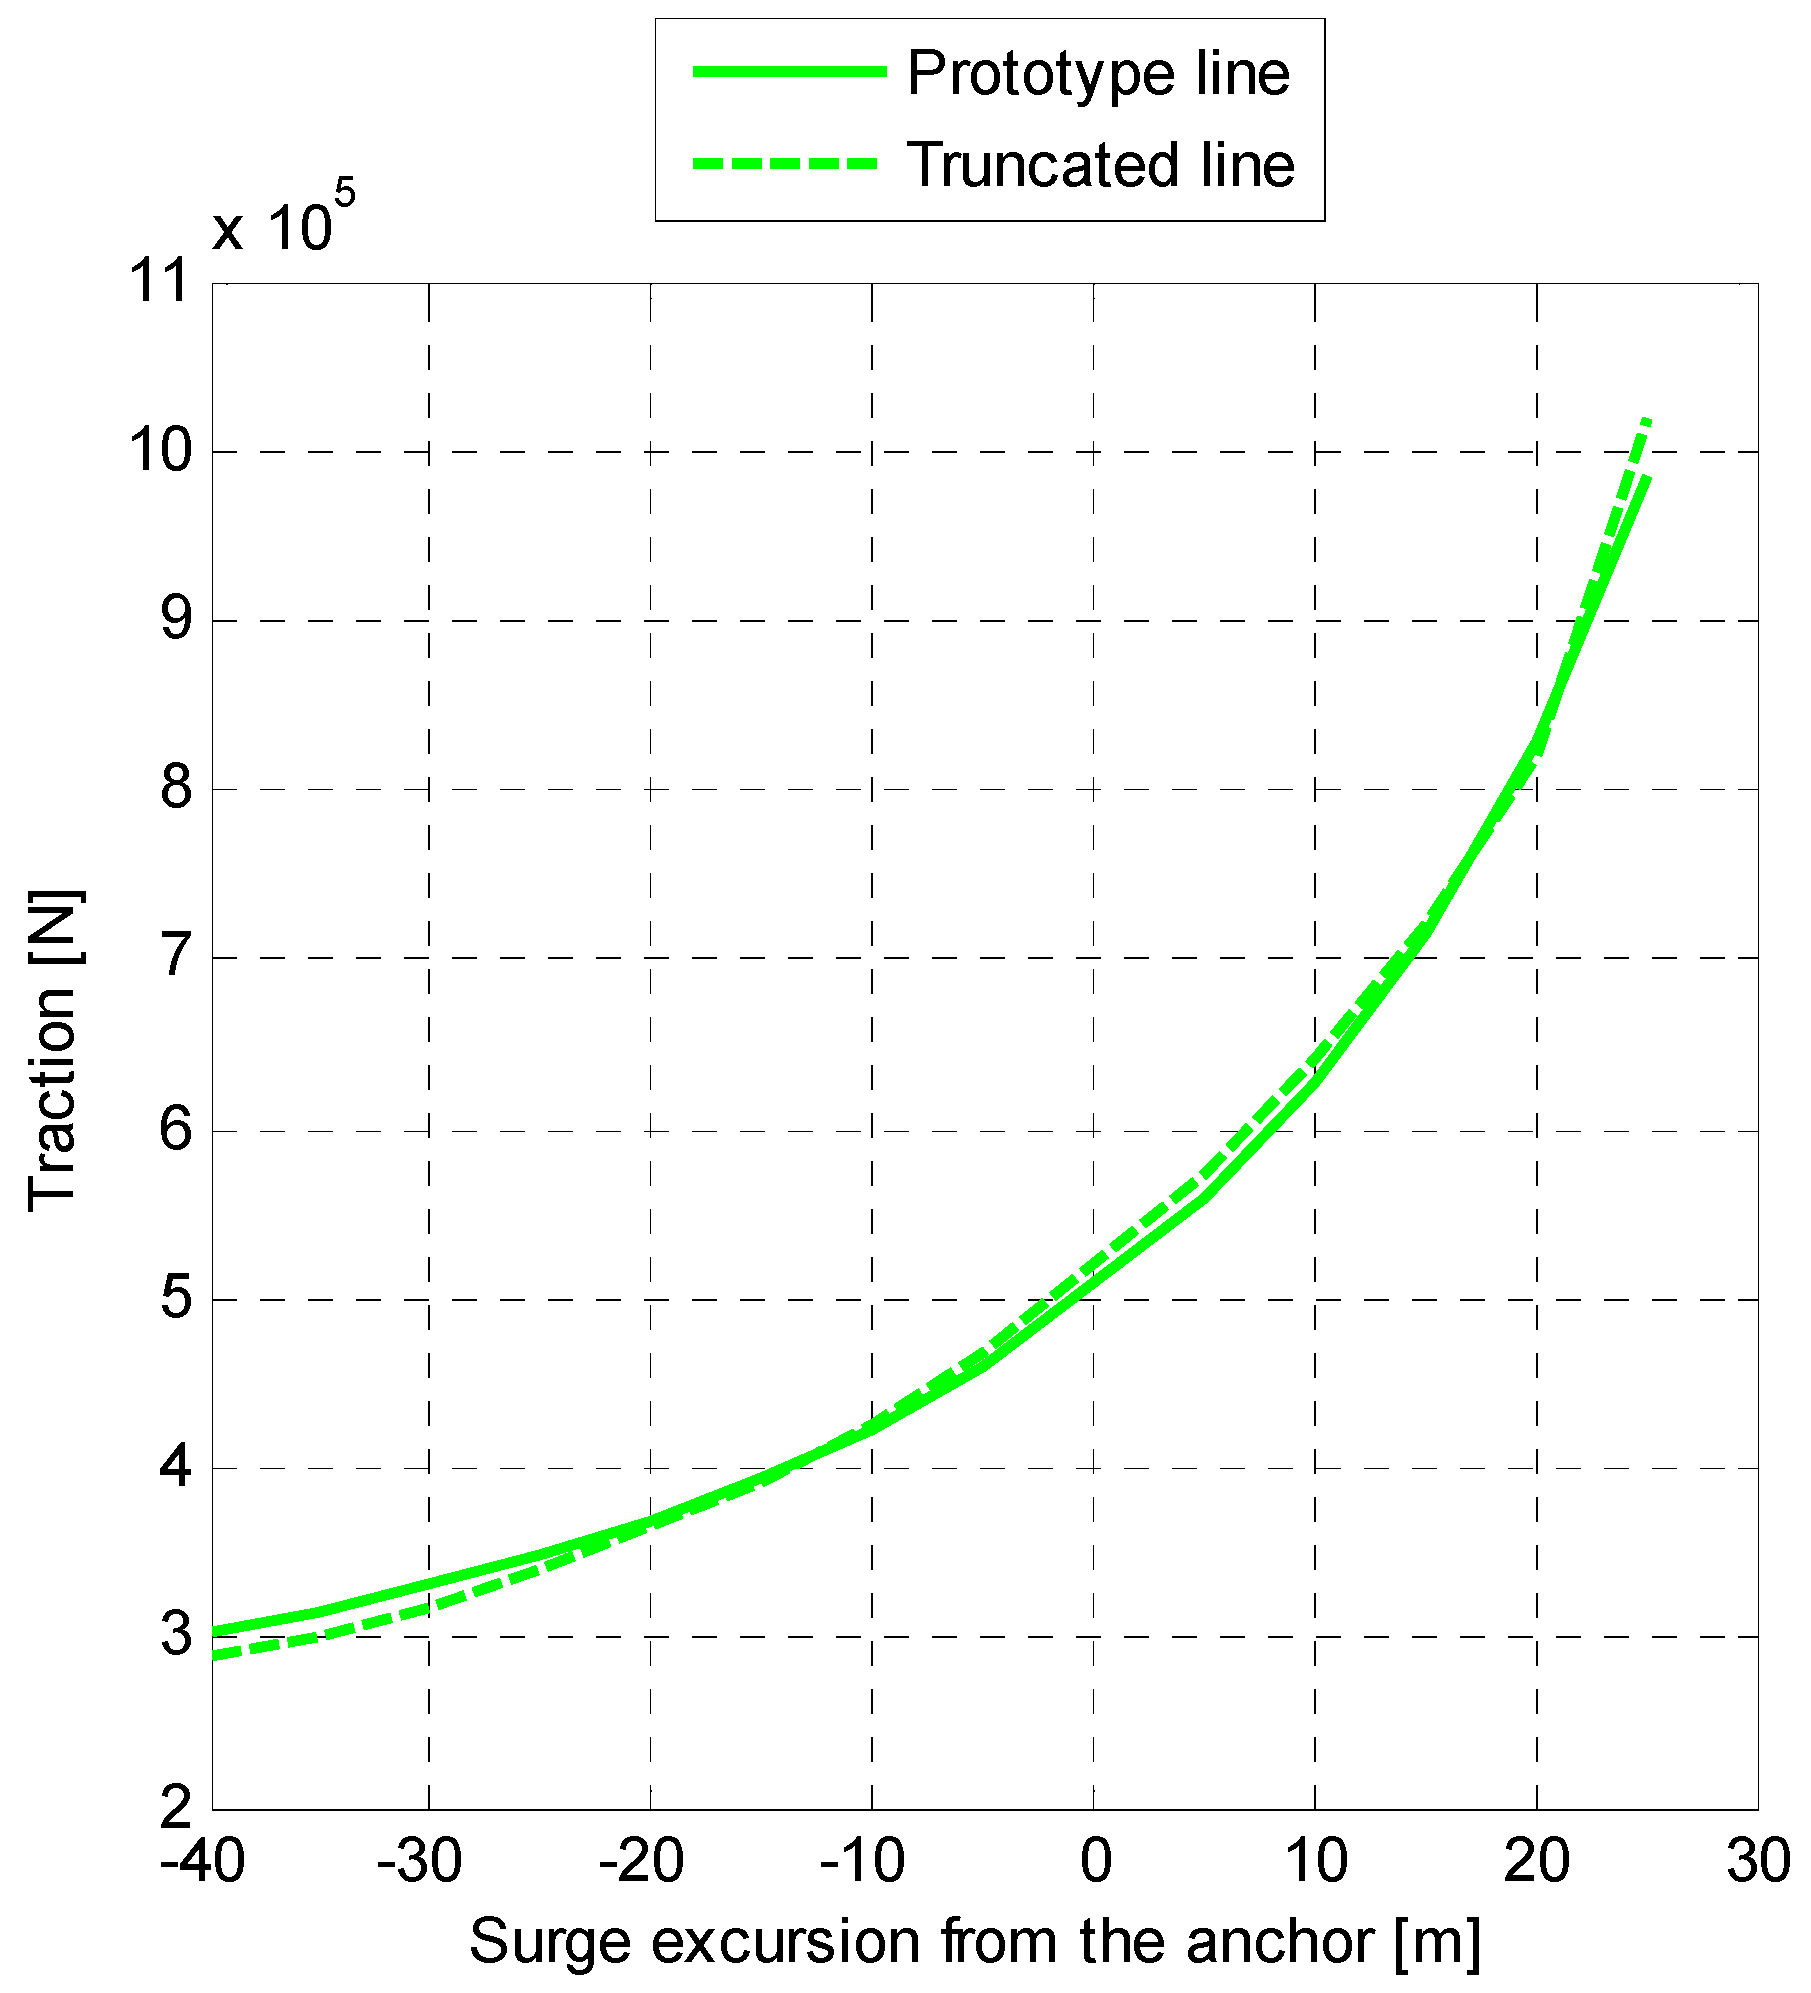
The response of the optimized catenary system is presented in
Figure 10 and
Figure 11.
Figure 10 shows the comparison between the horizontal and the vertical response on both mooring systems. The horizontal response of the truncated system fits well with the prototype response. However, for large offsets, the responses start to diverge. The mooring system vertical force component is larger for the truncated one. The reduction of the radius to anchor implies an increment of the suspended weight on the platform for a similar horizontal force. Then, a deeper draft would be expected in the platform during the tests: of about 0.5 m. The line tension is well fitted along the whole surge excursion studied in the optimization problem (
Figure 11).
Figure 10.
Mooring system response curves.
Figure 10.
Mooring system response curves.
Figure 11.
Traction mooring line response.
Figure 11.
Traction mooring line response.
7. Experimental Results
The model is scaled at 1:100 factor using the Froude similitude. The platform model is made of aluminum to adjust the density of the material to be close to concrete, simplifying the fit of the rest of the platform parameters. The mooring lines are composed of two chain segments that adjusted to fit the weight per meter length computed in the optimization problem. The scale model placed inside the flume attached to the mooring system is shown in
Figure 12.
Figure 12.
Scale model inside the flume.
Figure 12.
Scale model inside the flume.
The scaled prototype mooring line response were validated by checking the horizontal line response for a depth of 1.95 m and an excursion between 90 and 180 cm from the anchor. The results obtained in the static verification and the numerical results are plotted in
Figure 13. The figure shows good agreement between both responses.
Figure 13.
Comparative horizontal force response.
Figure 13.
Comparative horizontal force response.
Dynamic tests were carried out in several sea states with regular and irregular waves, and an almost constant wind force on the top of the nacelle. The experimental results were measured from the nacelle motion by an optical system which can track the 6 DOF [
19].
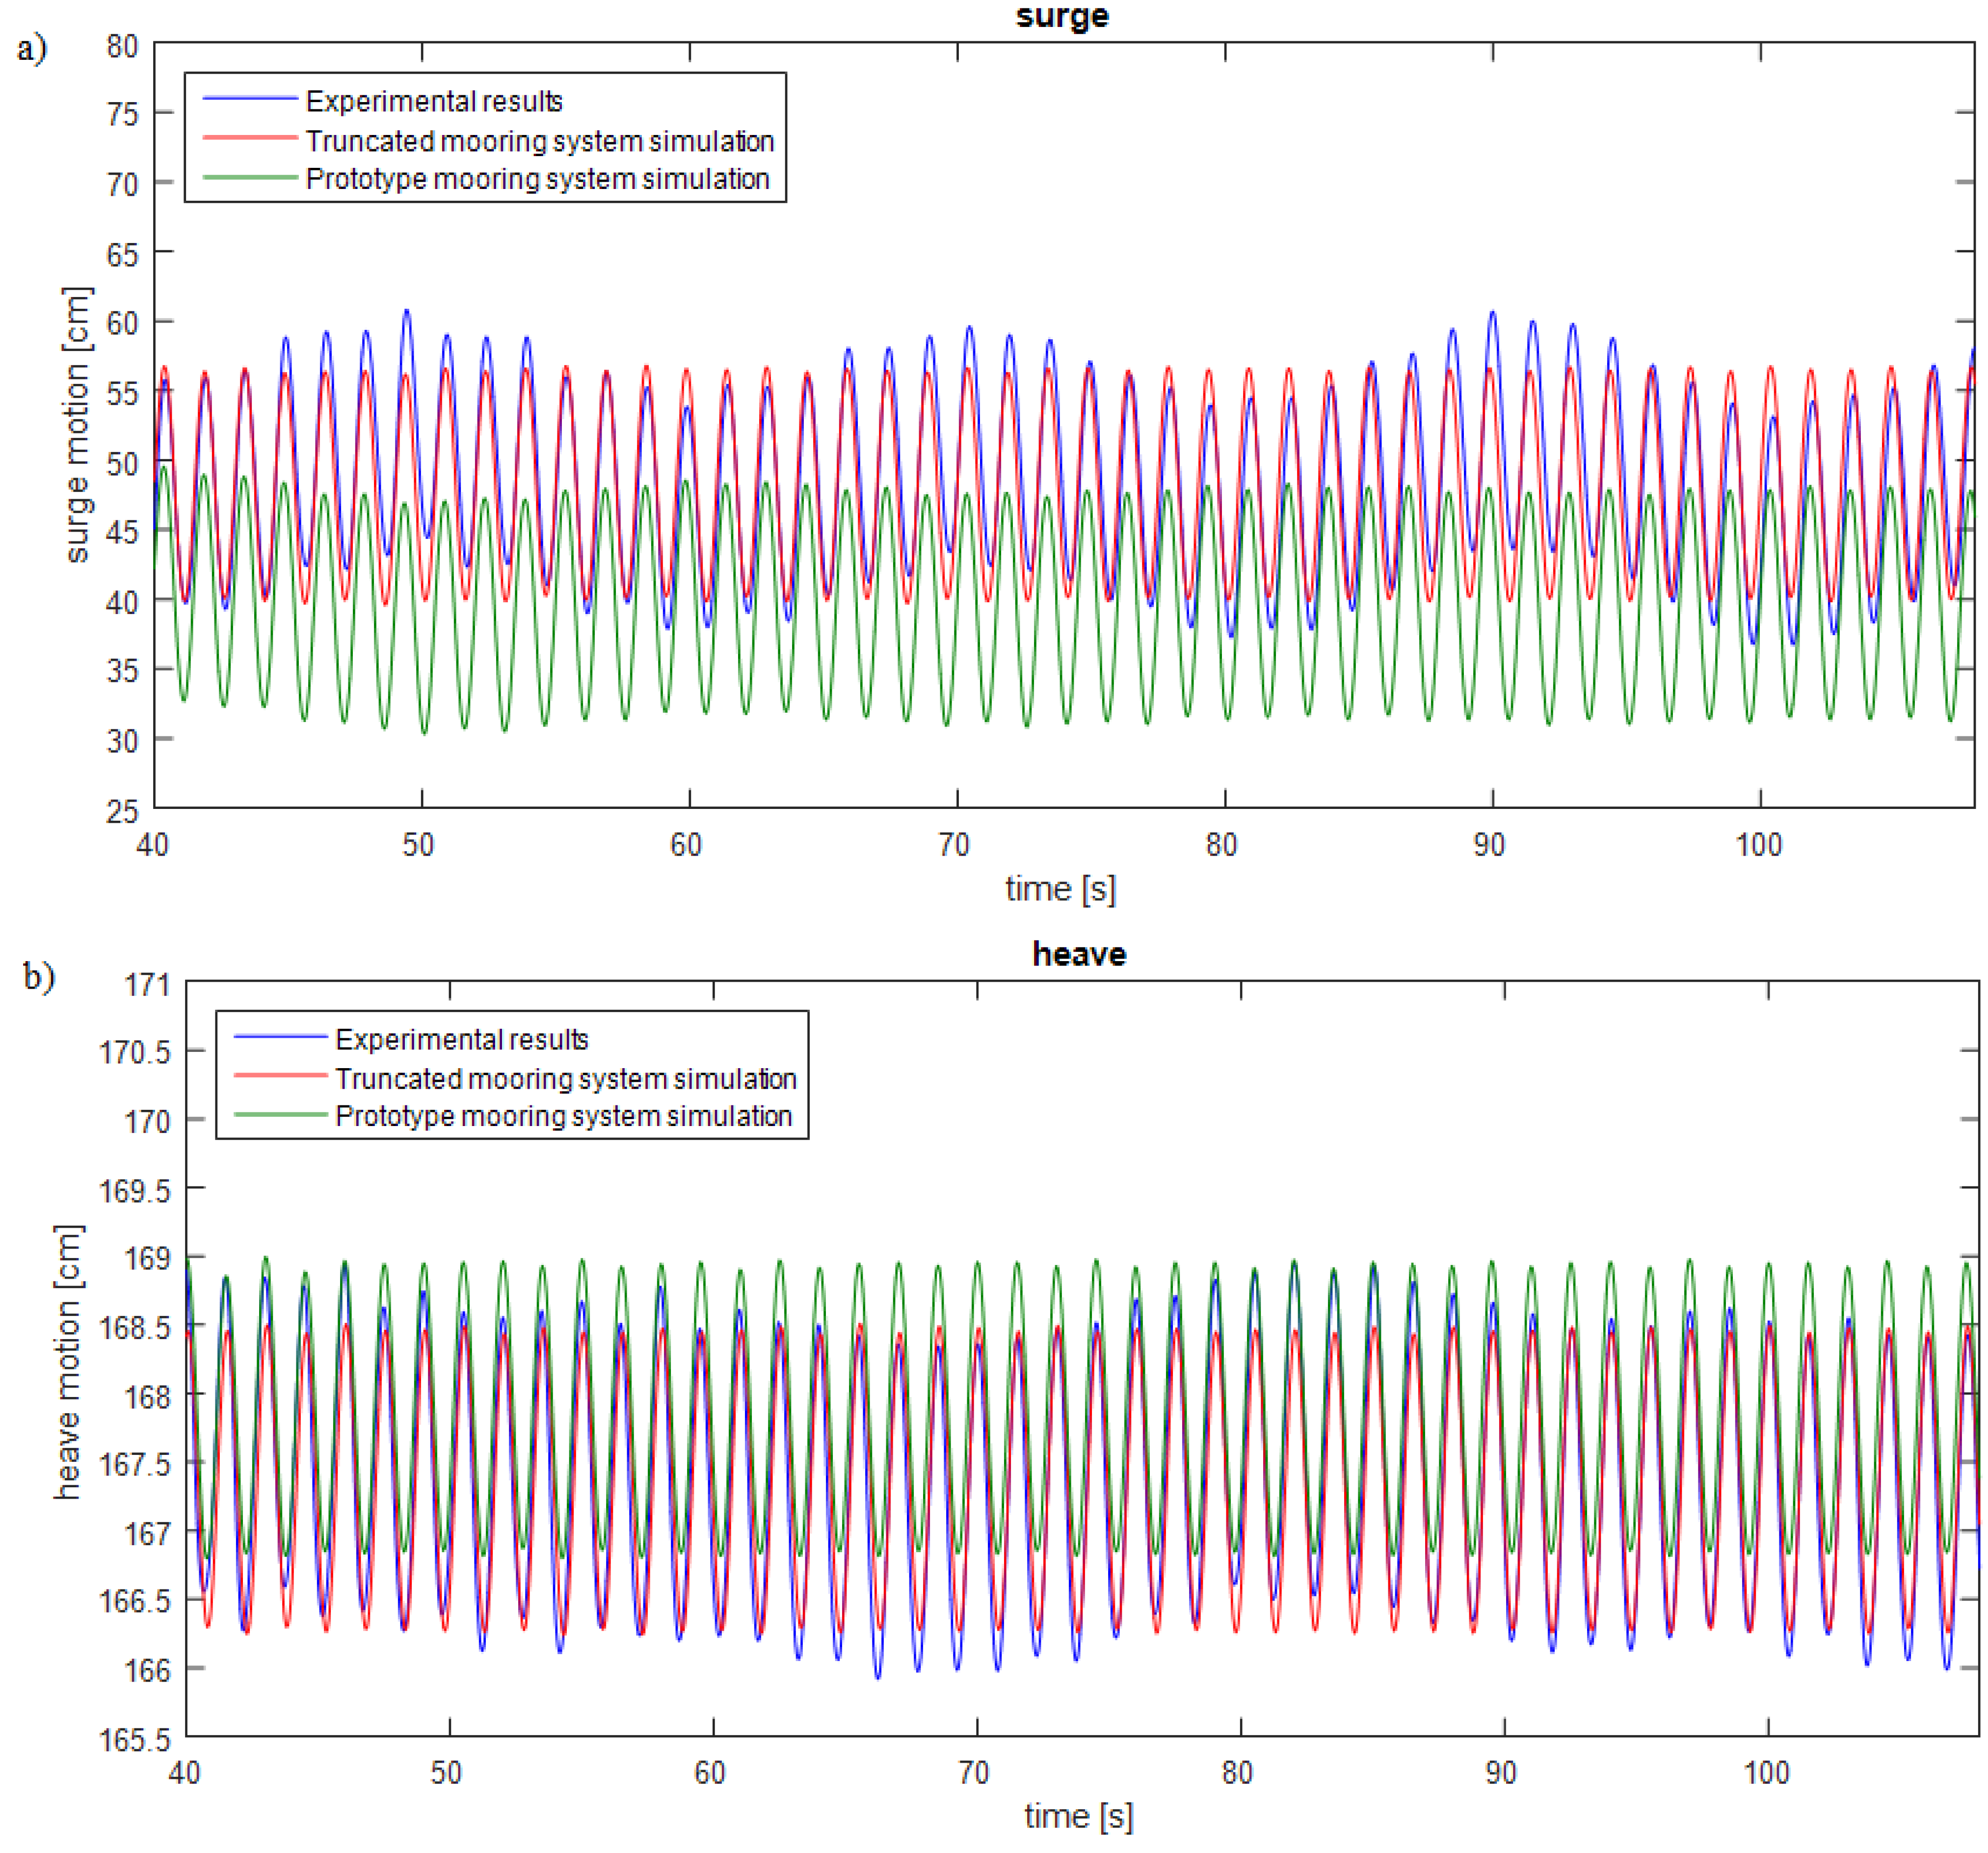
Figure 14 shows the surge and heave response comparison between the experiment, the simulation with the truncated lines and the simulation of the platform equipped with the prototype mooring system. These responses correspond to a regular wave of 14 cm height and a period of 1.5 s, and a constant force on the top of the platform of 0.6 N to simulate the wind. The experimental results show good agreement between the test and the numeric simulation with the truncated lines in terms of mean offset, mean draft and also with the wave amplitude movement. However, some differences can be seen due to a low frequency movement that occurred during the test. This disturbance was produced by a long wave reflection in the longitudinal direction of the flume. In the transverse direction, no reflections were noticed. The simulation of the prototype mooring system shows a shorter total surge excursion than the truncated one. This difference is explained by two effects. First, the stiffness of the prototype mooring system for positive excursions is higher than the truncated ones, as is shown in
Figure 10. Second, there is a loss of stiffness due to a draft increase of about 0.5 cm. In this situation, the lower depth of the fairlead position requires an increased excursion to achieve the same horizontal force. The draft increase can be noticed in the heave response (
Figure 14b) as a decrease of the mean heave position of the truncated mooring compared to the prototype one.
Figure 14.
Comparison surge (a) and heave (b) nacelle motion response.
Figure 14.
Comparison surge (a) and heave (b) nacelle motion response.
The results of a Fast Fourier Transform (FFT) of the surge and heave platform responses are shown in
Figure 15. Both diagrams show clearly the peak motion due to the wave excitation at a frequency of 0.66 Hz (period of 1.5 s) and the amplitudes match very well.
The main differences between the simulations and the experimental results are the excitation of the low frequency surge motion of the platform during the experiments, as already discussed. This affects the heave response, which FFT (
Figure 15b) presents as two small peaks: at 0.05 Hz, the natural surge frequency, and at 0.337 Hz, the heave natural frequency.
Figure 15.
Surge (a) and heave (b) motion Fast Fourier Transform functions.
Figure 15.
Surge (a) and heave (b) motion Fast Fourier Transform functions.
8. Conclusions
This paper describes and assesses the use of a truncated mooring system to emulate the real one in scaled experiments when there is a limitation of the available width in the flume. In this case, where the radius to anchor has to be reduced, an optimization problem based on the static mooring system response helped to fit the horizontal and vertical mooring responses and the traction line. The optimization problem is evaluated in the surge work range because is the main platform motion that depends on the mooring system response.
The truncated mooring line stiffness is obtained by using two different line sections: the bottom one is the heaviest and provides the horizontal mooring line stiffness. The upper section is lighter than the prototype mooring and reduces the vertical force over the platform.
The truncated catenary presents almost the same traction response as the completed prototype mooring system (differences less than 5%). On the other hand, the horizontal stiffness of the truncated system differs from the prototype, particularly for large excursions. In addition, the truncated mooring system presents a higher vertical force on the platform that lead to an increment of the draft.
Experiments are compared to numerical simulations with the real and prototype mooring system. The experimental results show good agreement with the numerical simulations. Some differences are noticed in the mean surge excursion of the truncated mooring system, which is larger. This is a consequence of the lower surge stiffness and an extra loss of stiffness due to the increase of the draft. Despite this, surge and heave responses due to wave loads are well predicted.


