1. Introduction
Harbor modifications and redevelopment plans (see current plans for the Port of San Diego in [
1]) are quite common to enhance or increase space in ports and, thus, to improve operations. In fact, harbor modifications at San Diego Bay decreased the water area by filling shoals around the main channels to add more land, including the area where Lindbergh Field—now known as San Diego Airport—was built. Space was developed for mooring boats, including private yachts and Navy vessels, but the reduction of the water surface area increased tsunami amplitudes and currents by constricting channels between Bay margins. Deepening of channels by dredging to improve navigability also enables greater penetration of tsunami energy into the harbor. Similar problems occurred along major rivers, e.g., the Mississippi River, when construction of levees restricted the channel width, negating the purpose of natural flood plains to distribute and absorb the excess water volume during major floods (e.g., severe flooding in the Midwest and South in 1973 [
2]).
Ports are designed to be protected against vertical water fluctuations, but the subject of tsunami currents—a newly recognized problem—is not typically considered in the design of harbor modifications. Tsunami currents form a common threat to ports, as seen in previous tsunamis (22 May 1960, Chile; 27 March 1964, Alaska; 27 February 2010, Chile; 11 March 2011, Japan; e.g., [
3,
4]); usually, they are not accompanied by significant (>1 m) tsunami amplitudes. Tsunami amplitudes are related to the tsunamigenic potential of a source, but tsunami duration and tsunami currents—even if they relate to relatively small amplitude waves—are also important. The long duration of major trans-Pacific tsunamis (from Mw8+ subduction events) creates a persistent hazard that may produce the greatest damage many hours after the initial tsunami arrival.
In order to understand how anthropogenic changes to ports affect tsunamis, we studied the time evolution of man-made modifications in San Diego Bay since the late nineteenth century and its influence on tsunami amplitudes and currents. San Diego Bay is one of the largest harbors on the U.S. West Coast, and it has been significantly transformed in the twentieth century.
Most of the changes in San Diego Bay have included dredging, enlargement of the North Island/Coronado land area, and creation of new marinas by enhancing already existing sand bars and shoals with fill and creating breakwaters. As done along major rivers, dredging increases the channel depth, but addition of levees, breakwaters, and other shore protection structures combined with narrowing of the channel results in the increase of flow depths and current speeds during inundation (flooding or surge). Tsunami currents can cause damage to structures (e.g., by erosion or scouring; [
5]).
We examined the effects of harbor modifications on tsunami hazard by simulating major tsunami events from both local and distant sources. The changes primarily occurred during the first half of the twentieth century. Four specific years were selected as representative of major changes in San Diego Bay: 1892, 1938, 1945 and present day. Post-1945, the bay continued to undergo changes but maintained a similar appearance and, therefore, the bathymetry/topography in and around the bay is represented by a Digital Elevation Model (DEM) showing the harbor shape as we know it today (dated 2014). To reflect these changes, historical nautical charts were used to show the state of the bay during that period.
2. San Diego Bay
San Diego Harbor is located on the southwestern corner of the United States. It has a long crescent-like shape of approximately 24 km in length and 1–3 km width. The harbor is the fourth largest in California and is home to a U.S. Navy base offering shelter to several aircraft carriers and other naval vessels
1. Naval Air Station North Island (NASNI; [
6]) is located at the north end of the Coronado peninsula in San Diego Bay. It is the home port of several aircraft carriers of the U.S. Navy, and is part of the largest aerospace-industrial complex in the U.S. Navy, Naval Base Coronado, California ([
6]). A cruise ship terminal is located near downtown San Diego, a regular ferry service runs from Coronado to San Diego, and several marinas, for both private and commercial boats, exist throughout the harbor. Although it is naturally well protected from large wave amplitudes, the same does not apply for tsunami currents.
3. Time Evolution of San Diego Bay
San Diego Bay is one of the best natural harbors in the world, protected by the Point Loma Peninsula at the western harbor entrance, and by North Island, Coronado, and the Silver Strand enclosing the inner harbor. Coronado is an affluent resort town located in San Diego County, California, just over 8 km (5.2 mi) SSW of downtown San Diego, with a population of 24,697 ([
7]). Coronado Island lies on a peninsula connected to the mainland by a 16-km (10 mi) isthmus called the Silver Strand (locally, The Strand; [
8]). North Island was an uninhabited sand flat in the nineteenth century (
Figure 1A). It was also referred to as North Coronado Island, because it was separated from South Coronado (now the city of Coronado) by a shallow bay, known as the Spanish Bight, which was later filled in during World War II (1945; see
Figure 1 and
Figure 2). South Coronado, which is not an island but the terminus of a peninsula known as the Silver Strand, became the town of Coronado.
We present nautical charts that portray the changes that have occurred in San Diego Bay since the nineteenth century. Because modifications to the bay happened quite frequently, especially during the first half of the twentieth century, we summarized major changes over selected years. A small set of original nautical charts are presented next. The major changes primarily included modifications to Coronado Island (also referred to as The Island, The North Island, and Coronado, or North Beach Island and Coronado separated by Spanish Bight
2 in older charts) and the area around the Dutch Flat (see
Figure 1). We use Coronado Island to refer to the entire island of Coronado and North Island after the Spanish Bight was filled in at the post-1945 configuration, and North Island to the pre-1945 configuration to distinguish the northern part of Coronado island separated by Spanish Bight in older charts (see
Figure 1).
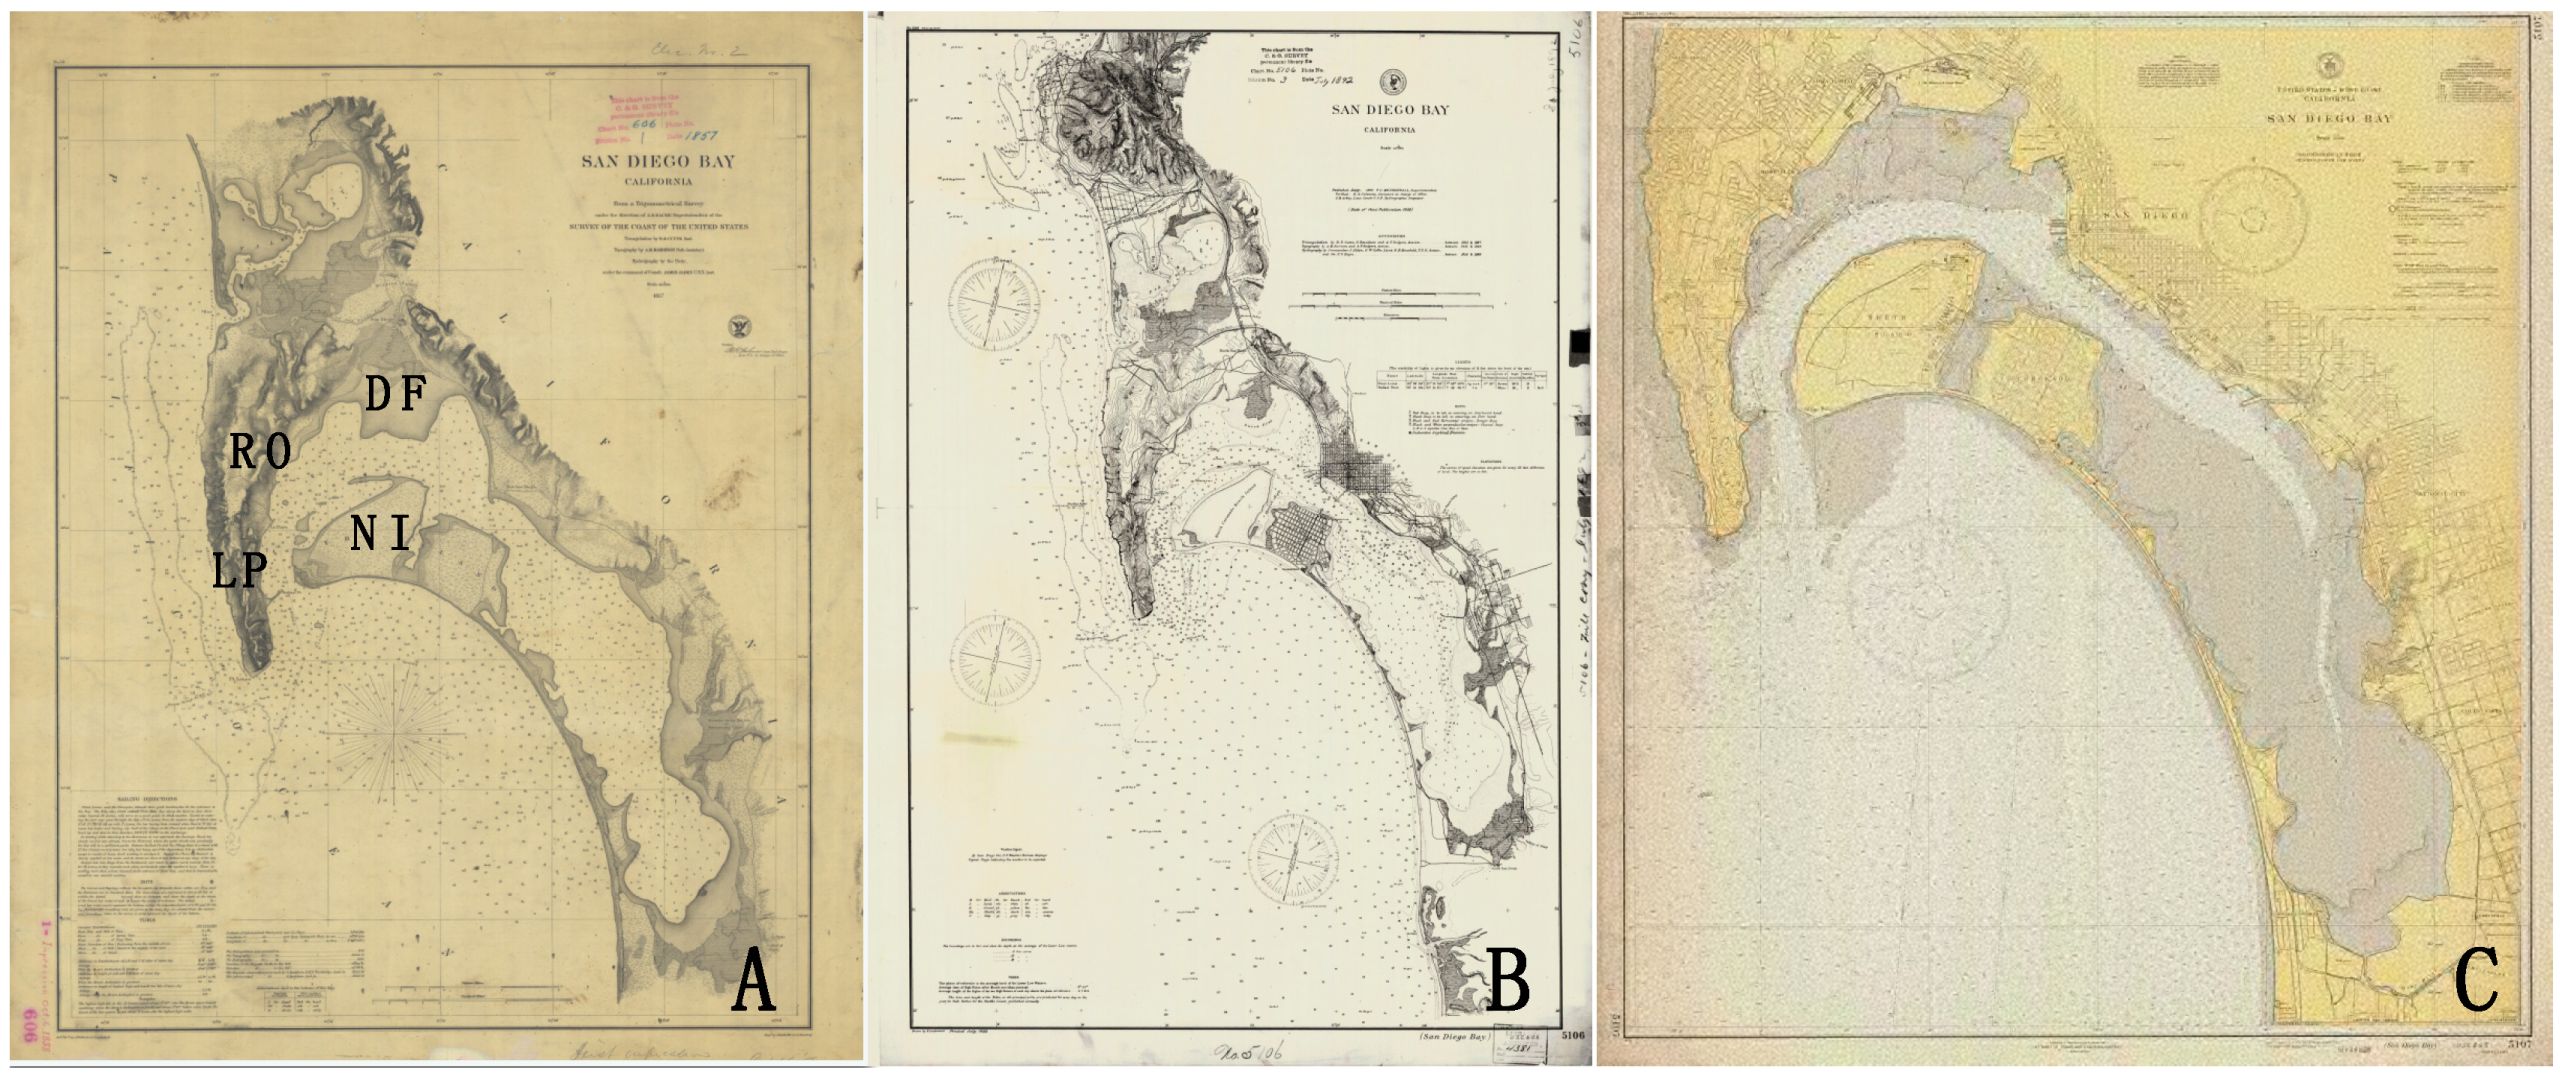
Figure 1.
Maps of San Diego Bay. Depths are in feet. (
A) Nautical chart of 1857. Approximate locations of Dutch Flat (DF), North Island (NI), Roseville (RO), and La Playa (LP) are shown in bold capitals; (
B) Nautical chart of 1892. The major difference in this chart compared to (A) is the increase of depth at the entrance of the bay, east and northeast of Point Loma (between Roseville and LaPlaya) and between Ballast Point and North Island as a result of dredging. The change appears at least five-fold when compared to the earlier map of 1857; (
C) Nautical chart of 1938. The major modifications include filling west and north of the North Island (compared to maps A and B) to unify with existing sand dunes and sand spits into North Island and Coronado, with a more regular shape and increased land space. The maps were downloaded from the historical map and chart collection of the Office of Coast Survey, NOAA [
9].
3.1. Pre-Nineteenth Century to 1895
During this period, as shown in
Figure 1B, the bay remained largely unmodified, with some dredging performed in the late nineteenth century. The depths inside the bay were fairly shallow at the time (characteristic depths 15–54 ft or 4.5–16.5 m near the entrance;
Figure 1; [
9]). The major characteristics of the bay were the irregularly shaped North Island
3 and the width of the bay around the Dutch Flat (North East of the Bay entrance; see
Figure 1) to the northeast. The first tide gauge for San Diego was installed in 1854 at La Playa (near Roseville). It was removed in 1872 and in 1906, it was relocated to the south side of Navy Pier in downtown San Diego. The Dutch Flat area was part of the fan delta complex (depositional area) of the San Diego River, which was diverted to the west through Mission Bay (originally called False Bay) via levee and jetty construction after major floods in the mid-nineteenth century (
ca. 1862; [
12,
13]).
Figure 2.
(
Left) Nautical chart of San Diego Bay of 1945; (
Right) Nautical chart of San Diego Bay of 1966. The maps were downloaded from the historical map and chart collection of the Office of Coast Survey, National Oceanic and Atmospheric Administration (NOAA; [
9]).
Figure 2.
(
Left) Nautical chart of San Diego Bay of 1945; (
Right) Nautical chart of San Diego Bay of 1966. The maps were downloaded from the historical map and chart collection of the Office of Coast Survey, National Oceanic and Atmospheric Administration (NOAA; [
9]).
3.2. Post-1895 and Early Twentieth Century
Most of the modifications for the enhancement of space in the bay happened during this period and prior to the 1950s. The modifications included dredging at and around the entrance to the bay and expansion around the Dutch Flat, probably to enable better use of the Naval Training Station and the U.S. Marine Corps base near the last location
4. In addition to the previously noted modifications, sand spits and sand dunes close to North Island were connected through filling, for the creation of the more regularly shaped North Island
5 in the 1930s (
Figure 1C).
3.3 Circa 1945 (1945 to 1960s)
By 1945, San Diego Bay had changed considerably, looking very close to how we know it today. The major changes to the harbor configuration resulted in narrow channels between islands and mainland shorelines, specifically from the harbor entrance to New San Diego (downtown San Diego). The area between San Diego and Coronado has always been narrow and the bathymetry fairly shallow, although it has increased over the years from 2.5 m (8 ft) in 1857 to about 13 m (40 ft) today; North Island and Coronado Island may also be uplifts flanking the Spanish Bight and Coronado fault segments of the Rose Canyon fault zone [
10]. In fact, uplift exists along the west side of the north-trending Coronado Fault, which passes from the east side of Coronado Island to the mainland shore along the Pacific Highway (note how straight this section of coast was in the nineteenth century maps;
Figure 1; west of New San Diego).
The Spanish Bight was a narrow channel that separated Coronado from North Island up to the early 1940s (
Figure 1). The development of North Island by the U.S. Navy prior to and during World War II led to the filling of the Bight in 1943, combining the land areas into a single body. The Navy still operates NASNI on Coronado. On the southern side of the town is Naval Amphibious Base Coronado, a training center for Navy SEALs. Both facilities are part of the larger Naval Base Coronado complex [
14].
Sand bars (shoals) to the north of the bay were further enhanced to create new marina locations (between Quarantine Station, now known as La Playa
6, and Roseville) in North San Diego Bay (
Figure 1 and
Figure 2). By 1966, Shelter Island and Harbor Island were created by dredging and filling the area east of Roseville and Dutch Flat, providing more space for marinas (
Figure 3). These islands are actually connected to the mainland by causeways on landfill. The depths in the bay are more uniform and larger than before. The area around Dutch Flat, Fisherman’s Point and the municipal airport were filled, with the exception of a channel east of Roseville (
Figure 2A). This channel provided boat access to the Marine Corps base. Small, elongated boat basins now exist between Shelter Island, Harbor Island and the mainland.
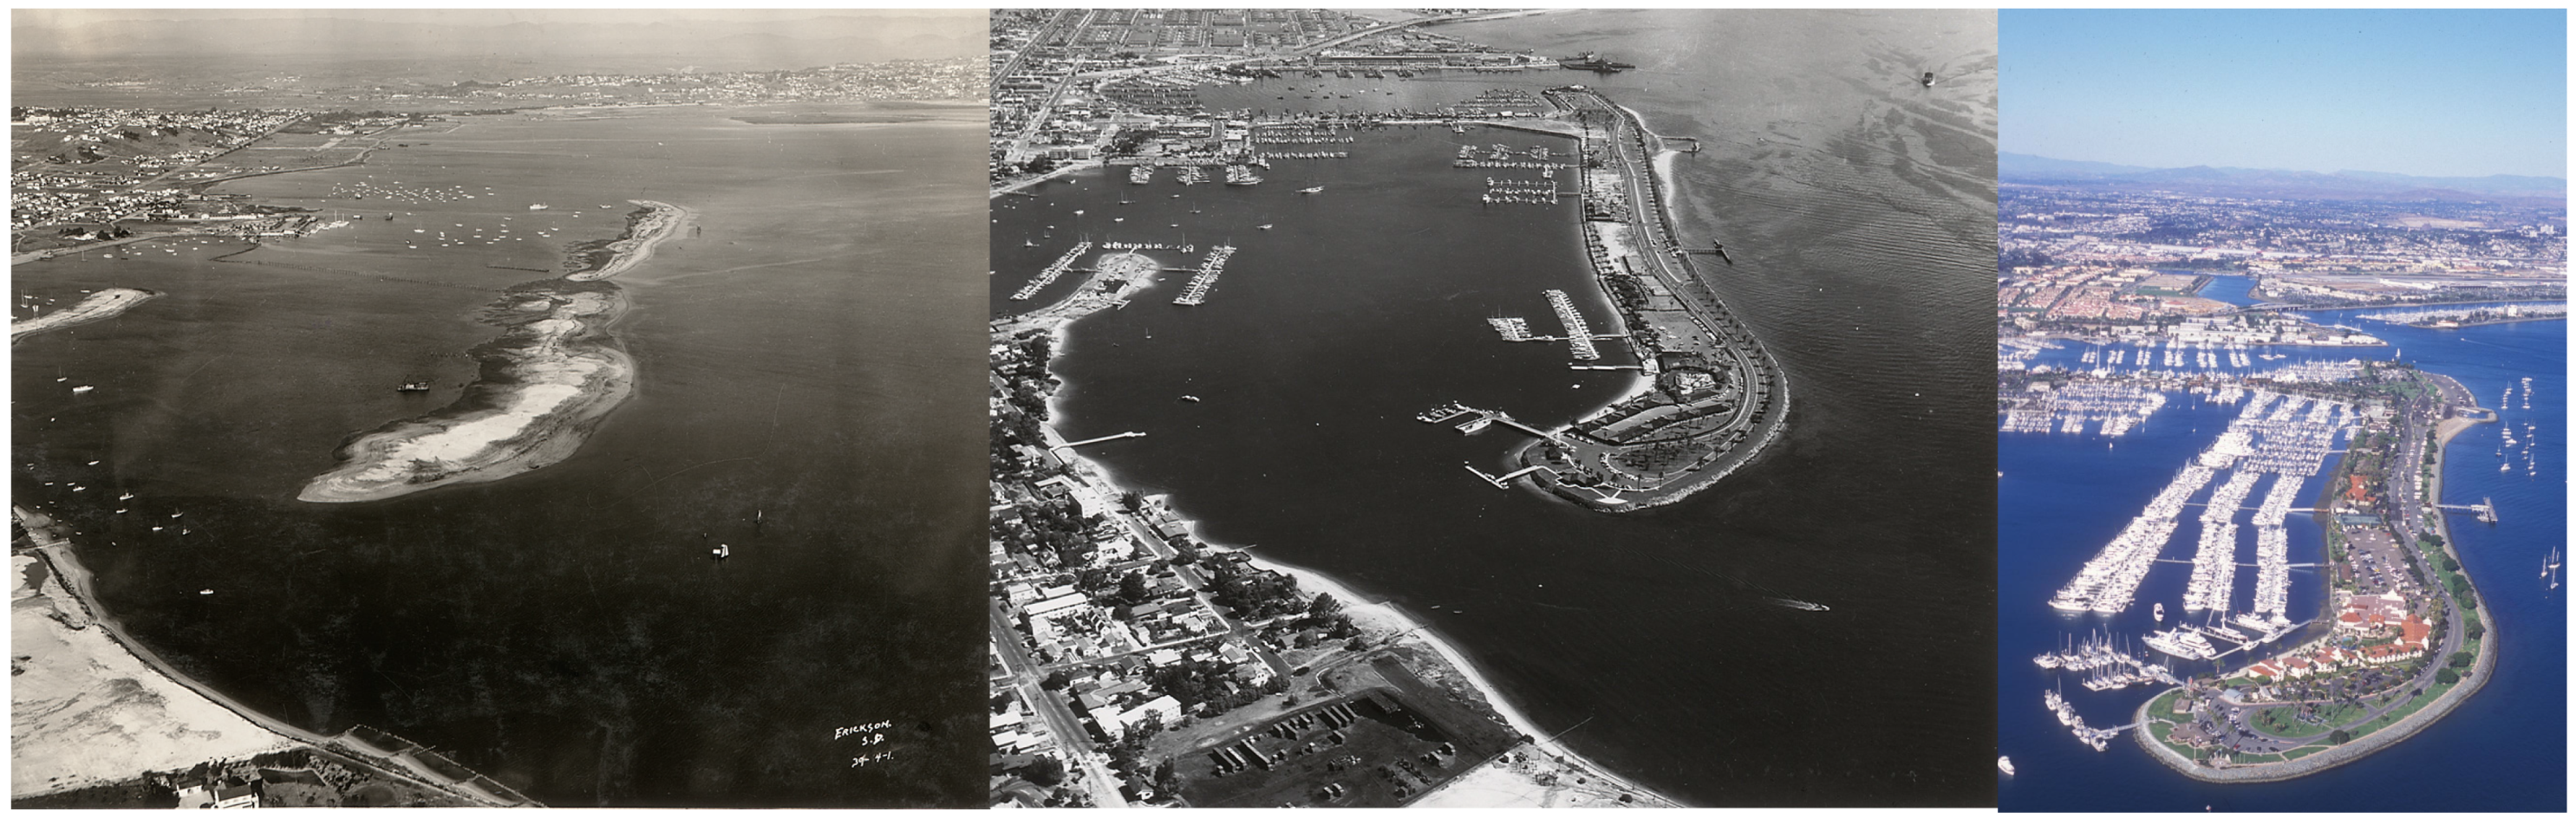
Figure 3.
View of Shelter Island in 1937, the 1950s and the 1990s, left to right. Photos courtesy of Unified Port of San Diego [
1]. An example of extreme transformation showing how the sand spit, or “mud island” as it was referred to, now offers home to numerous vessels. View is southwest to northeast. The entrance to Shelter Island has also been subject to high currents in past tsunamis (e.g., 22 May 1960, Chile and 11 March 2011, Japan; [
4]).
Figure 4.
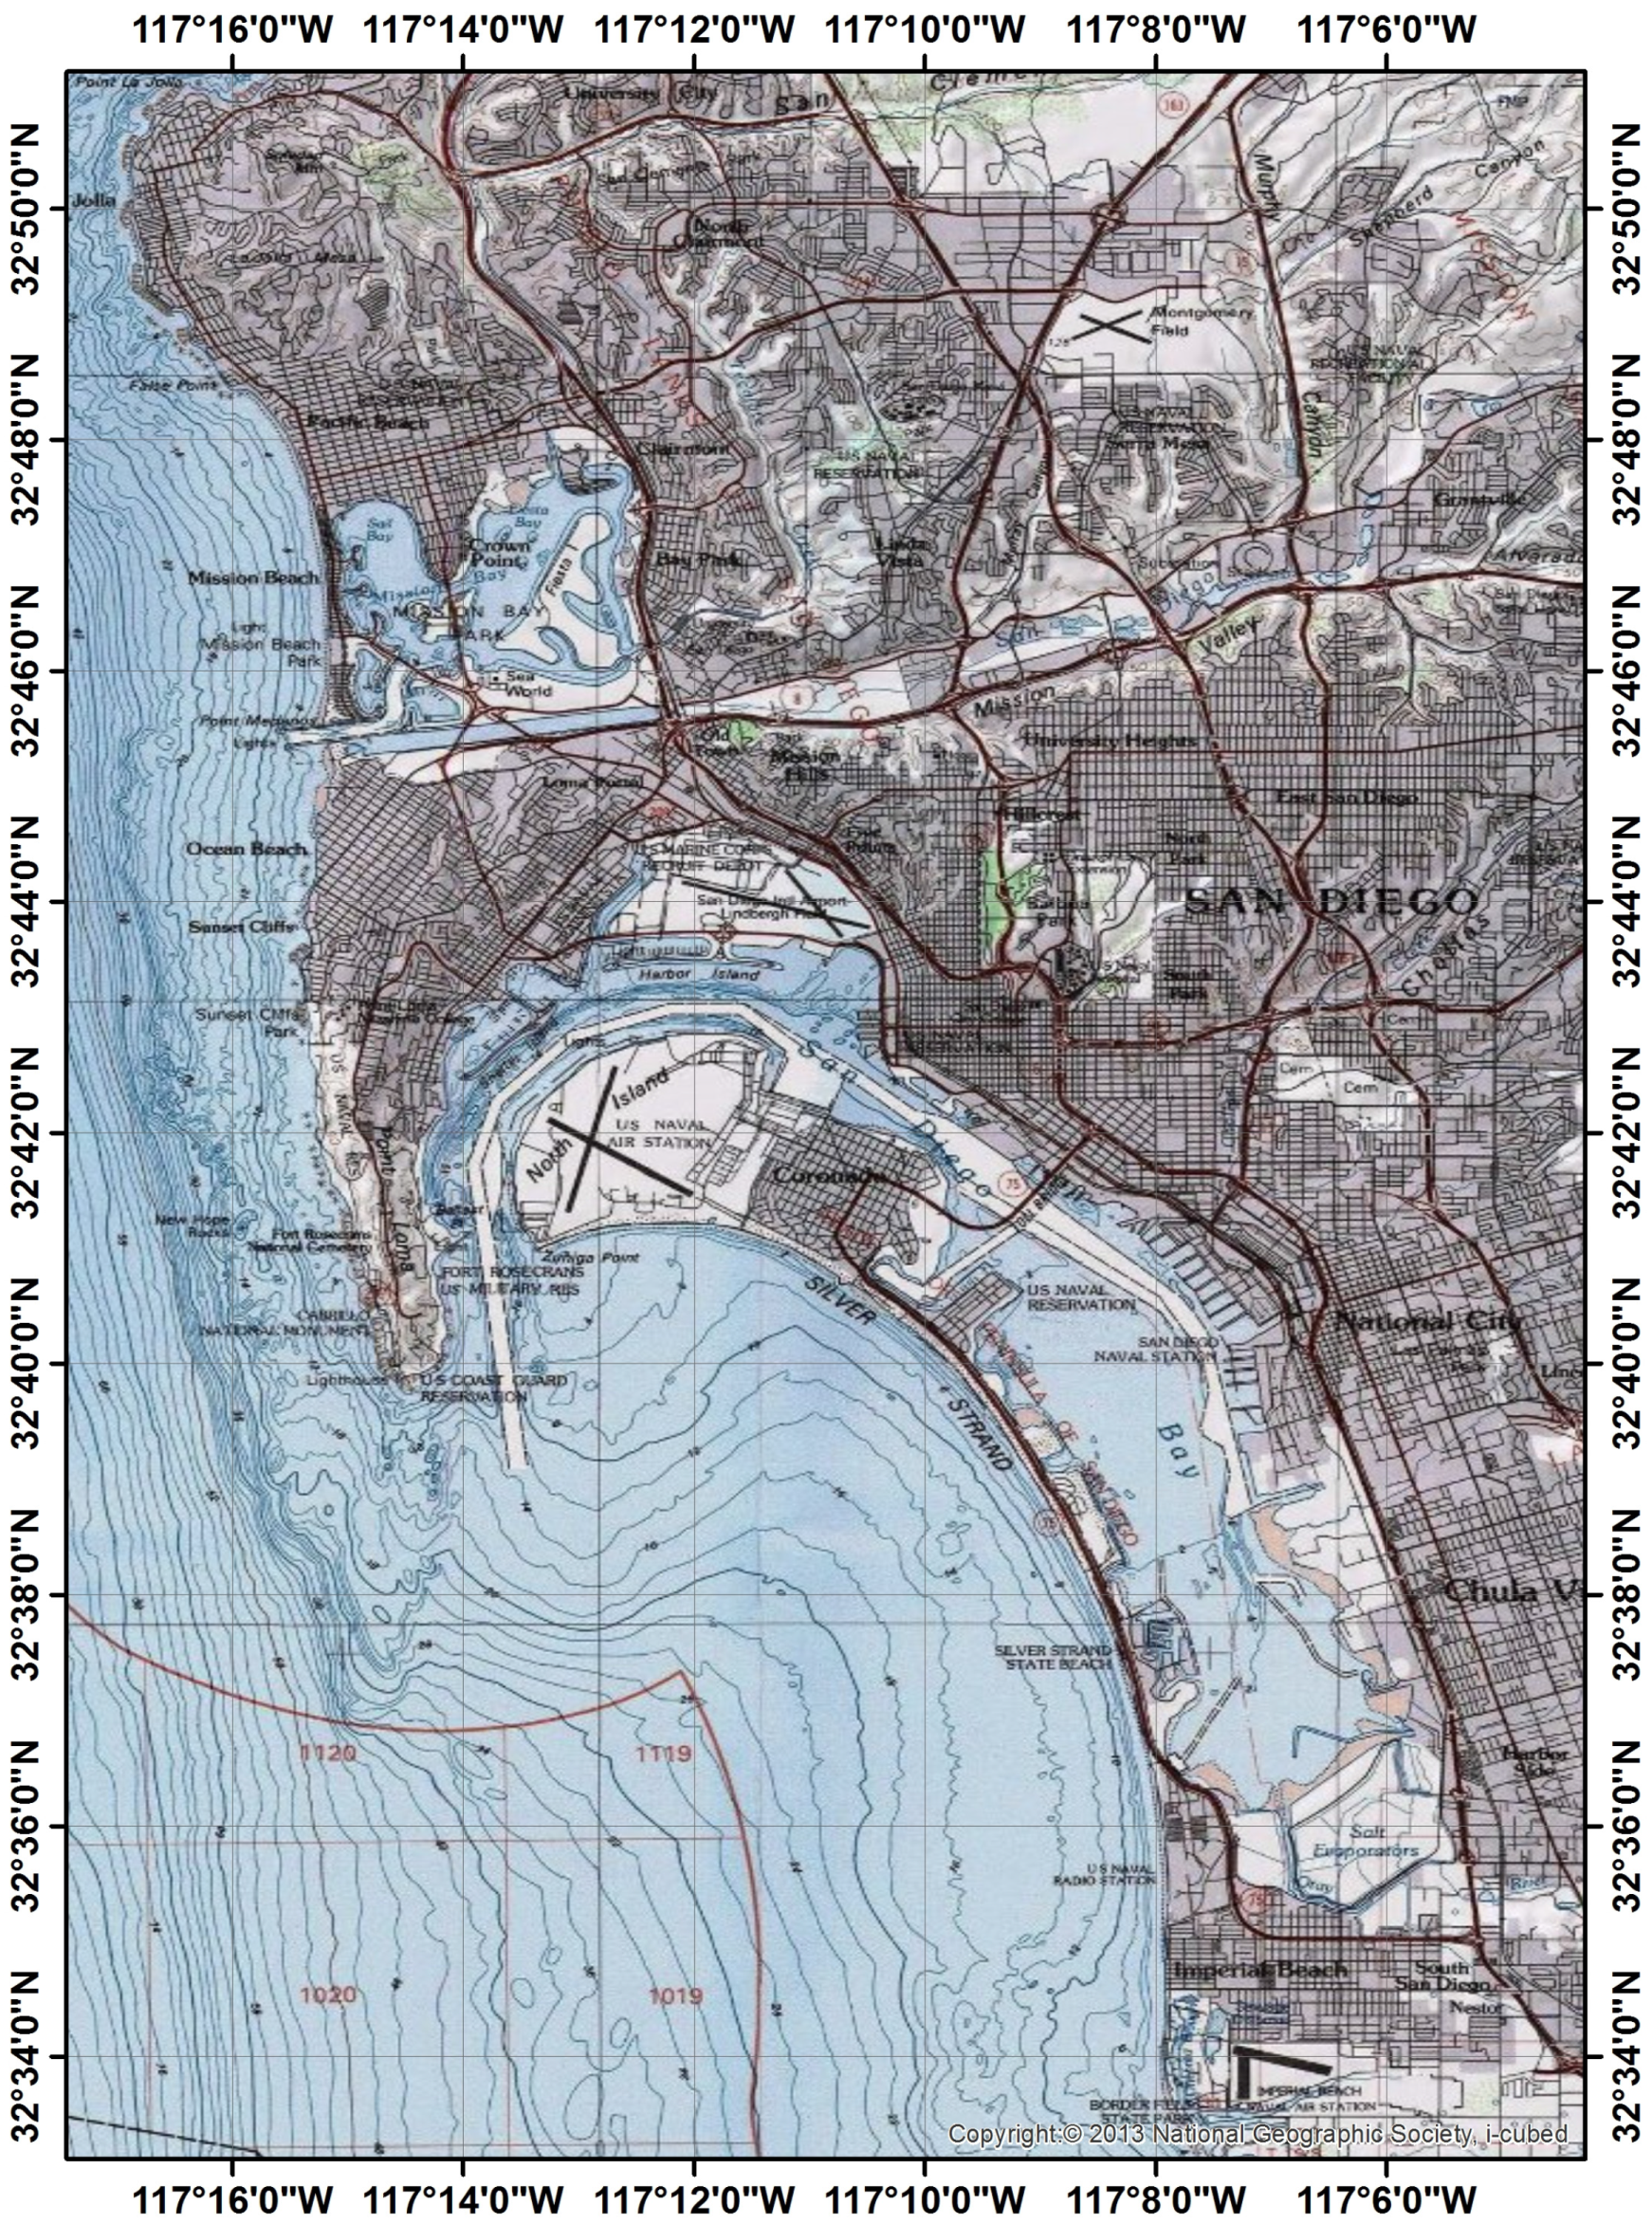
Map of San Diego Bay, showing the state of the harbor today with locations that are referenced frequently throughout the text.
Figure 4.
Map of San Diego Bay, showing the state of the harbor today with locations that are referenced frequently throughout the text.
4. Numerical Grids of San Diego
Four different DEMs for San Diego were used to depict the evolution of the port due to man-made modifications. Three were digitized from historical charts of the historical map and chart collection of the Office of Coast Survey, NOAA [
9] for the purpose of our numerical simulations. The present day (2014) DEM originated from the National Geophysical Data Center (now National Centers for Environmental Information, or NCEI) [
15]. The quality of the paper chart (
i.e., detail) and the years representing the major changes in the port were the primary factors that affected our choice of charts. The years representing the major changes to the port are: 1892, 1938, 1945, and present day for the current harbor configuration (
Figure 4).
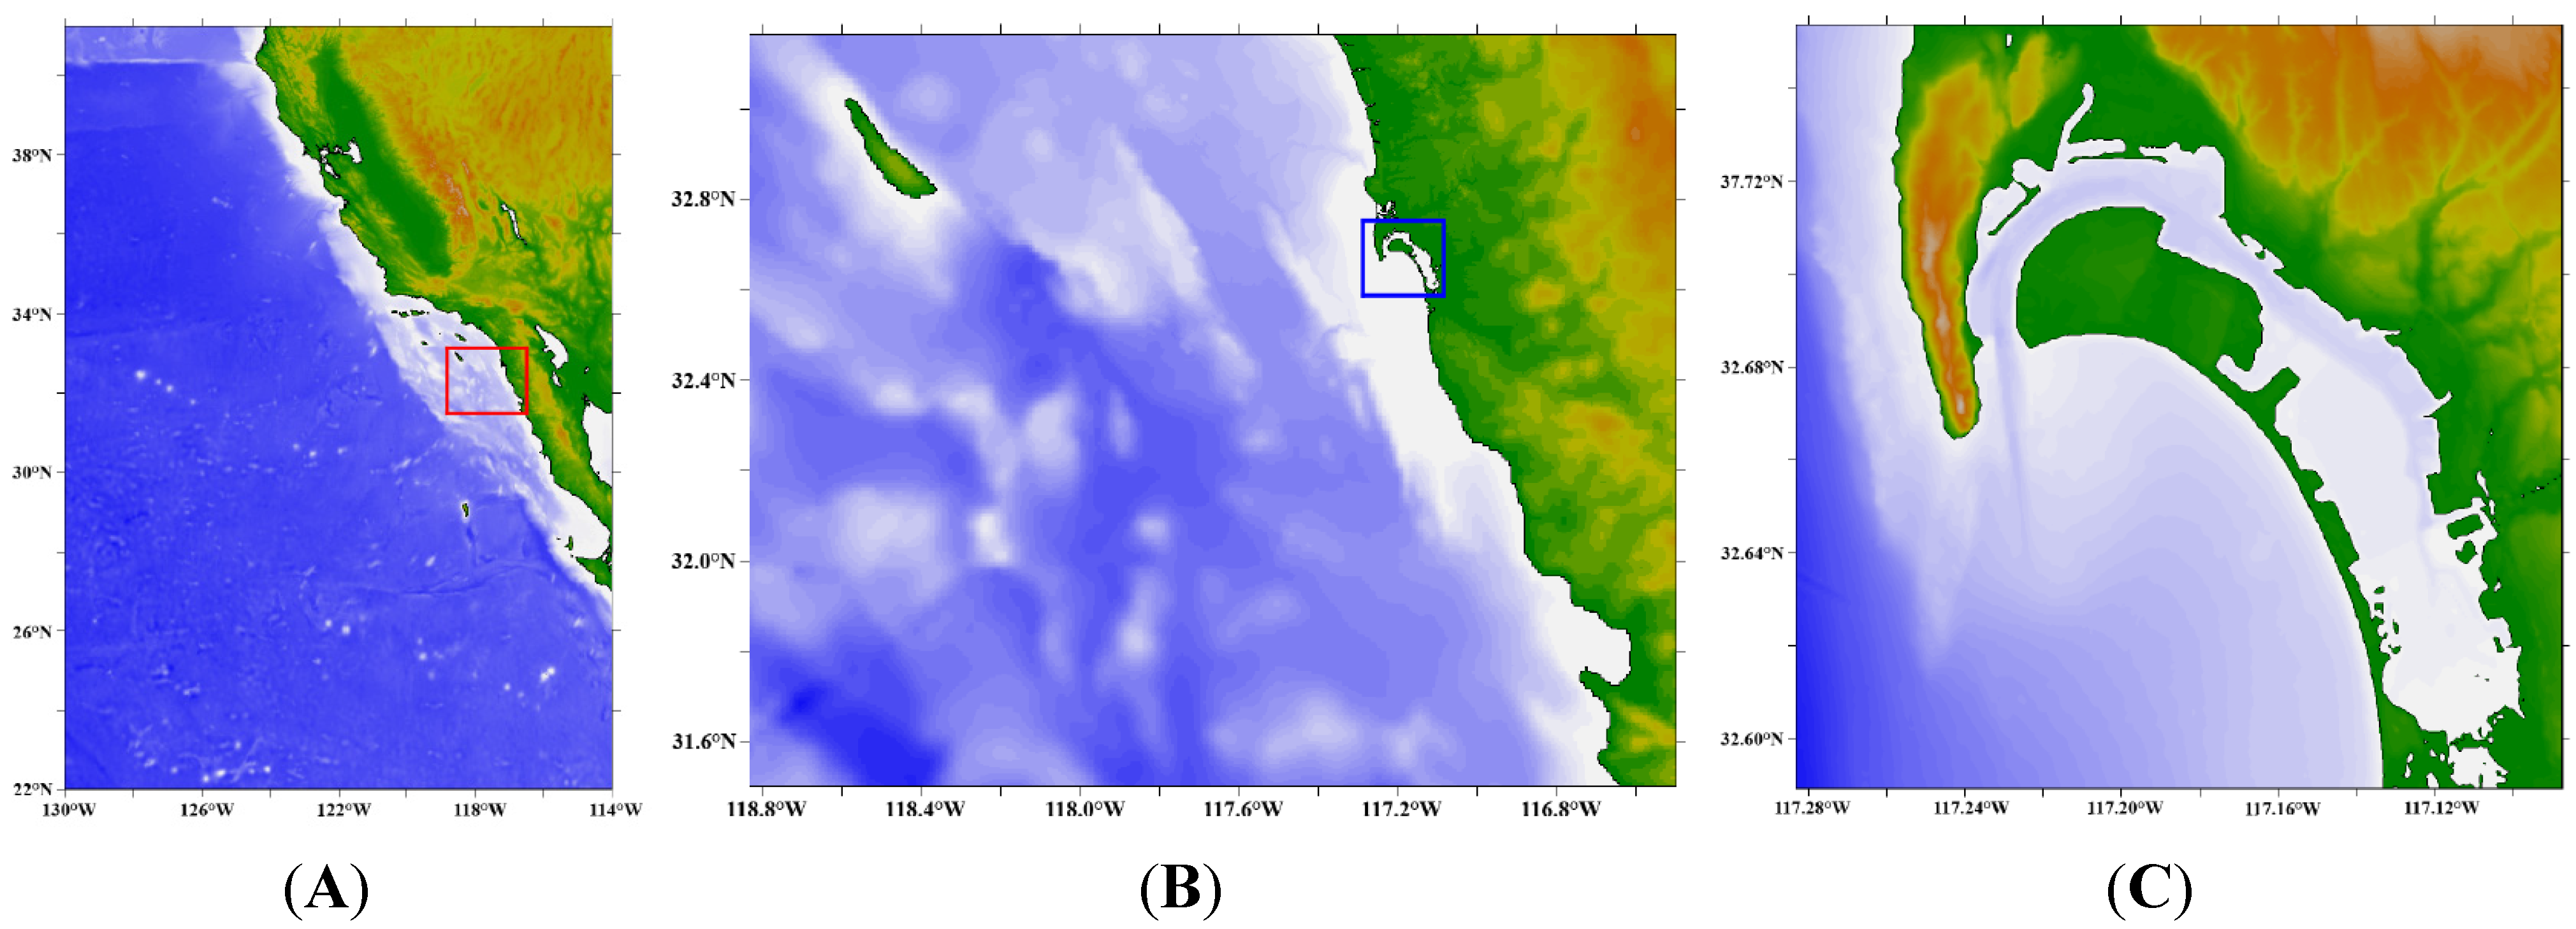
All numerical grids (1892, 1938, 1945, and present day) share two outer grids (usually referred to as A and B grids) that form a nested system. The A grid, or outermost grid, was created from interpolated ETOPO1 data to 30 arc-sec (
Figure 5; ~ 900 m [
16]). The B grid was also created from interpolated ETOPO1 data to 12 arc-sec [
16], while the C grid uses a 3 arc-sec resolution, subsampled from a 1/3 arc-sec resolution dataset (~ 90 m;
Figure 5; [
17]).
Figure 5.
Extent of numerical grids A (left), B (middle; shown as red rectangle within the A grid) and C (right; shown in blue colour within the B grid). C grid here only shows the current configuration but the extent of all four C grids (1892, 1938, 1945 and 2014) is the same.
Figure 5.
Extent of numerical grids A (left), B (middle; shown as red rectangle within the A grid) and C (right; shown in blue colour within the B grid). C grid here only shows the current configuration but the extent of all four C grids (1892, 1938, 1945 and 2014) is the same.
Digitization of old nautical charts is challenging, especially in cases where not only the coastline and bathymetry around a port have changed, but also the topography has changed due to urbanization. Nautical charts are meant for navigation, and therefore, elevation information provided in them is limited. Elevation data for past years are also generally difficult to find so a number of assumptions were made for the creation of the DEMs. Elevation data of San Diego for the high elevation areas to the north of San Diego toward Mission Bay were assumed to have changed little in the last 100 years. This may be a reasonable assumption since construction of the restraining wall (levee) to redirect the San Diego River helped to maintain topography in the low area between Mission Bay and San Diego Bay. This allowed us to use topography from the United States Geological Survey (USGS) with datum NAD83
7 (North American Vertical Datum 1988, or NAVD88; [
18]). Flat areas close to shores usually have large uncertainties and were manually digitized to match available contour data (
Figure 6). The coastline was digitized from the charts in addition to bathymetric points (
Figure 6). All these data were combined to create the final DEMs at 90 m resolution and mean high water (MHW) depth.
Topographic maps (e.g., from USGS) generally have elevations referenced to orthometric datums, either the NAVD 88 or the older National Geodetic Vertical Datum 1929 (NGVD 29). All GPS positioning data are referenced to one of many 3-D/ellipsoid datums. NOAA’s nautical charts have depths referenced to mean lower low water (MLLW), and bridge clearances are referenced to MHW. The legal shoreline in the U.S., which is the shoreline represented on NOAA’s nautical charts, is the MHW shoreline; that is, the land-water interface when the water level is at an elevation equal to the MHW datum. For the construction of DEMs a tidal datum—representing a reference plane—is necessary. A tidal datum refers to an average height of the water level at different phases of the tidal cycle ([
19]). The MLLW line is also depicted on NOAA’s charts
8 [
19]. Mean Sea Level (MSL) is usually the average between MLLW and MHHW
9 as provided on the charts. MHW is more challenging, but we assumed the value of 1.52 m (4.98 ft) above MLLW as estimated by NOAA for San Diego for the years between 1993 and 2003 [
20].
We also assumed that the highest elevations on Coronado Island have not changed considerably over time (a 6 m (20 ft) contour is the highest elevation contour that appears in early charts;
Figure 1, [
9]). The plane of reference used in the charts is the average of MLLW (
Figure 1 and
Figure 2).
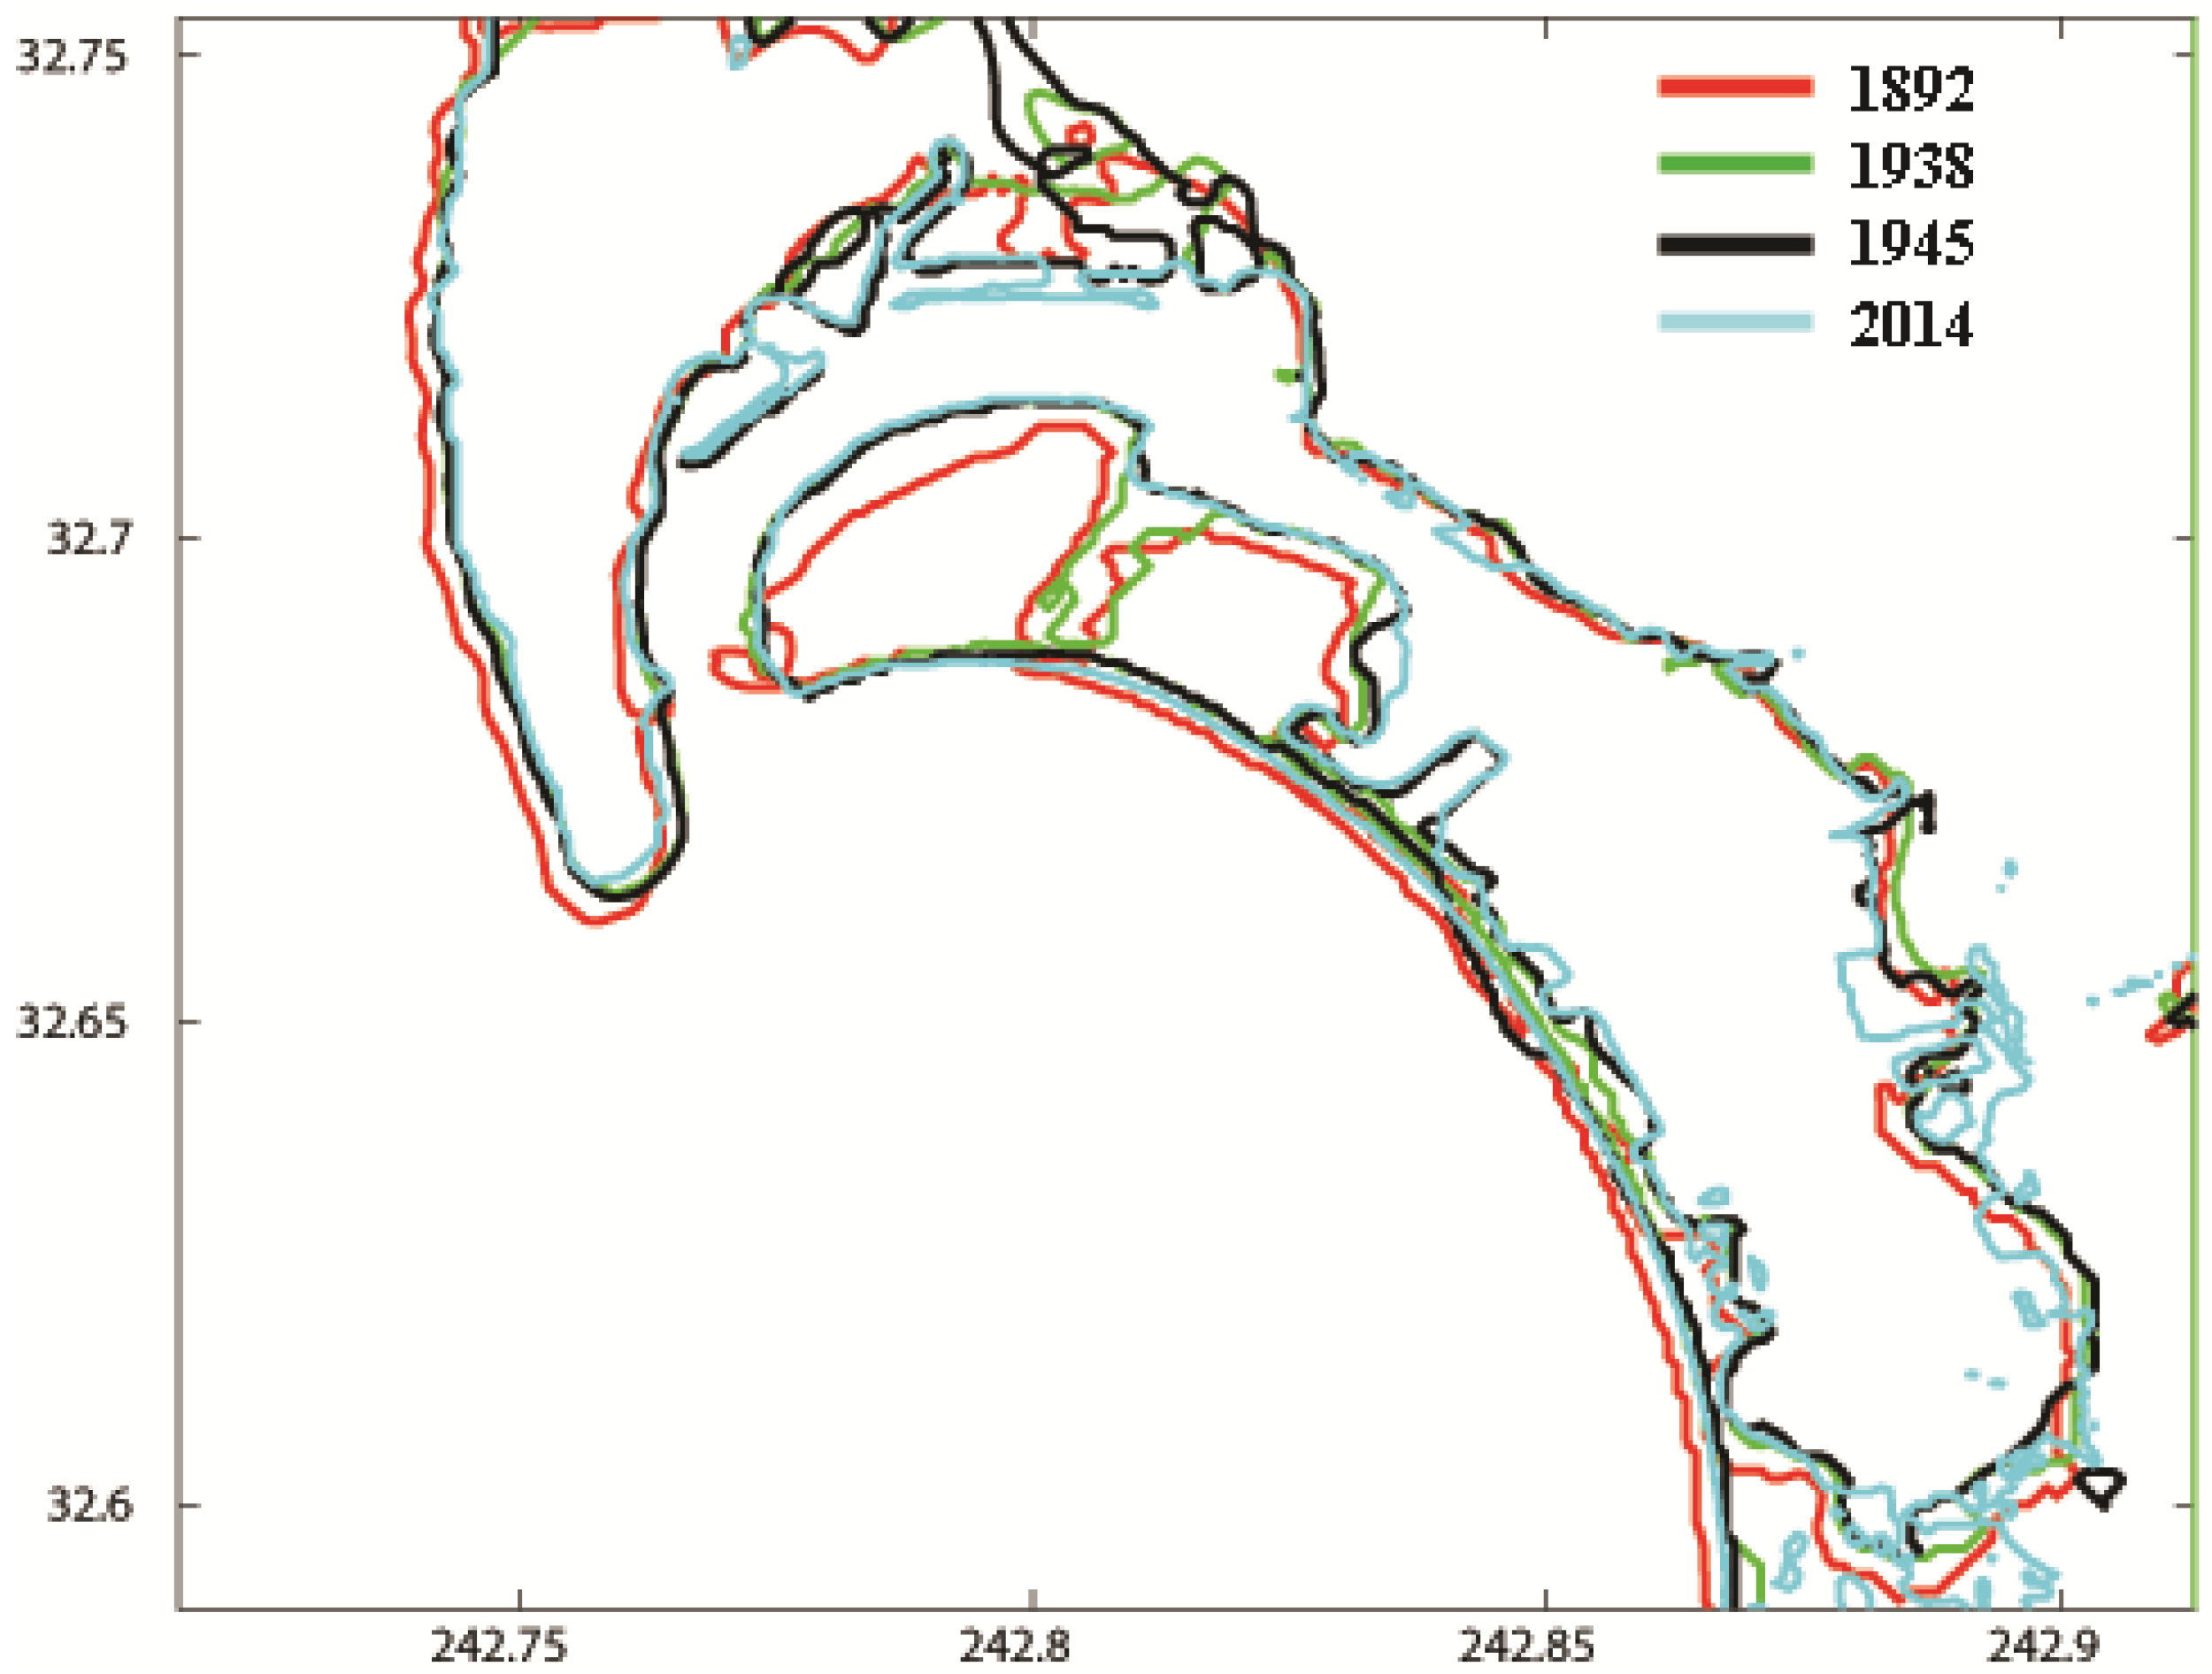
Figure 6.
Coastlines of the four digital elevation models (DEMs) used in the numerical simulations.
Figure 6.
Coastlines of the four digital elevation models (DEMs) used in the numerical simulations.
5. Numerical Modeling
For the numerical modeling of tsunamis, we use the well-known and tested MOST (Method of Splitting Tsunami) code [
21], which solves the depth-averaged, nonlinear shallow-water wave equations that allow wave evolution over variable bathymetry and topography [
21,
22]. This is a suite of numerical codes that model all phases of the tsunami simulation (generation, propagation, and runup). The initial displacement on the surface of the water is obtained directly from the terminal coseismic deformation of the ocean floor using Okada’s formulation for the surface expression of shear and tensile faults in a homogeneous, elastic half space [
23]. The equations of motion are then solved numerically to propagate the water surface disturbance across the computational domain [
21,
22,
24]. A 0.0009 Manning’s roughness coefficient was used in all simulations.
MOST has been tested extensively, complies with the standards and procedures outlined in [
25], and has shown reliability in forecasting inundation. The Tohoku 2011 source used in this article was also selected due to a really good fit to DART
® buoy data from the Pacific Ocean [
26]. More recently it was also shown to compare fairly well against tsunami currents measured by recently installed acoustic Doppler current profilers (ADCP; [
27]).
A set of four scenarios were considered on all numerical grids. A common A and B grid was used for all four DEMs; those are the outermost and intermediate grids used in the simulations for computational efficiency, respectively. We applied two distant scenarios and two local/regional scenarios to investigate the role of modified bathymetry and nearshore topography on our results. Distant scenarios were run for approximately 24 h while local scenarios for 12 h each.
6. Tsunami Sources
San Diego is exposed to tsunamis from both local and distant sources. A small but balanced set of sources was selected (two distant, two local) to allow for the arrival of waves from different directions in order to investigate, among other factors, the contribution of source location to tsunami impact in San Diego. Specifically, two distant tsunamis generated in the south and in the northwest Pacific were considered. With respect to near-field sources, one local tectonic source and one landslide source were included for locations to the southwest, where the waves’ approach is directly into the bay.
The distant sources are major historical subduction zone earthquakes (in opposite hemispheres): the 22 May 1960 Chile earthquake (M
w 9.5) and the 11 March 2011 Tohoku, Japan (M
w 9.0) earthquake. The local sources are theoretical and include a large transpressional earthquake (M
w 7.4) on the San Clemente fault (SCF), located about 70 km southwest of San Diego Bay, and a large submarine landslide located in Coronado Canyon about 25 km southwest of San Diego. For a comprehensive tsunami hazard assessment for San Diego harbor, considering all types of local, regional, and distant sources capable of generating tsunamis that may be damaging, see [
28]. A more detailed discussion of the sources with impact to San Diego, as well as the most significant tsunami records in San Diego, can also be found in the same article.
6.1. Chile 1960
A simple rectangular source (800 km × 200 km) was used to represent the fault surface that produced the 22 May 1960 M
w 9.5 earthquake and transpacific tsunami [
29]. The collision zone of Nazca and South American plates (NazSA
10) is an important source of tsunamis and hazard studies for the U.S. West Coast, and California in particular. The 22 May 1960 Chile earthquake is known as the largest recorded earthquake and was preceded and followed by large earthquakes within a few minutes (~Mw 8.0 or greater; see [
30,
31]). Rupture of the NazSA zone is likely more complex and possibly longer, but far-field studies are not affected greatly by such variation. We consider a Chile 1960 type of source to represent a source similar to the 22 May 1960 event, represented by a single fault plane [
29] with a slip of 24 m. More details are provided in
Table 1.
Table 1.
Table of sources.
Table 1.
Table of sources.
| Source Name (Far-field) | Fault Length (km) | Fault Width (km) | Slip (m) | Dip (degrees) | Rake (degrees) | Strike (degrees) | Depth11 (km) |
| Chile 196012 | 800 | 200 | 24 | 10 | 90 | 10 | 87.73 |
| Tohoku 201113 |
| Segment 1 | 100 | 50 | 4.66 | 19 | 90 | 185 | 5 |
| Segment 2 | 100 | 50 | 12.23 | 19 | 90 | 185 | 5 |
| Segment 3 | 100 | 50 | 26.31 | 21 | 90 | 188 | 21.28 |
| Segment 4 | 100 | 50 | 21.27 | 19 | 90 | 188 | 5 |
| Segment 5 | 100 | 50 | 22.75 | 21 | 90 | 198 | 21.28 |
| Segment 6 | 100 | 50 | 4.98 | 19 | 90 | 198 | 5 |
| Source Name (Near-field) | Fault Length (km) | Fault Width (km) | Slip (m) | Dip (degrees) | Rake (degrees) | Strike (degrees) | Depth (km) |
| San Clemente Fault Bend Region | | | | | | | |
| Segment 1 | 18.52 | 10 | 1.6 | 89 | −161.6 | 330.4 | 0.5 |
| Segment 2 | 8.86 | 10 | 2.7 | 89 | 158.2 | 310.2 | 0.5 |
| Segment 3 | 6.96 | 10 | 7.0 | 80 | 135.0 | 307.8 | 0.5 |
| Segment 4 | 23.65 | 10 | 4.2 | 89 | 166.0 | 304.9 | 0.5 |
| Segment 5 | 12.92 | 10 | 5.8 | 85 | 149.0 | 314.5 | 0.5 |
| Segment 6 | 6.9 | 10 | 3.2 | 89 | 161.6 | 312.4 | 0.5 |
| Segment 7 | 19.5 | 10 | 1.6 | 70 | −161.6 | 311.8 | 0.5 |
| Landslide Case | Lat | Lon | Depth (m) | Uplift (m) | Subsidence (m) | Direction (deg) |
| Coronado Canyon | 32.519 | −117.338 | 370 | 5 | 5 | 260 |
6.2. Tohoku 2011
The 11 March 2011 M
w 9.0 Tohoku Japan tsunami caused wide devastation on the Japanese coast, damaged facilities and vessels on the U.S. West Coast [
4] and was recorded by multiple sea level stations across the Pacific. As a result of the tsunami, at least 20,000 perished [
24] and the nearshore topography was completely redefined [
32,
33]. The tsunami source used in this study is based on real-time forecasting done by NOAA Center for Tsunami Research. Tsunami wave data from two DART
® stations near Japan (21418 and 21401; [
34]) were used by an inversion algorithm [
26] that selected six unit sources from a pre-computed propagation database and its corresponding coefficients [
35]. Parameters of each unit source and their corresponding coefficients are listed in
Table 1.
6.3. San Clemente Fault (SCF)—Bend Region
We modeled a major left bend in the SCF offshore northern Baja California, Mexico (
Table 1). This is a zone of oblique shortening, where the fault impedes the general northwest movement of the Pacific plate. Seafloor uplift resulting from this restraining bend covers a region of about 875 km
2 and represents as much as 720 m of tectonic uplift [
36,
37,
38]. Recent submersible investigations of the SCF revealed vertical seafloor scarps, representative of seafloor uplift during the most recent large earthquakes on the SCF [
39]. The largest scarps are 1–3 m high and would be associated with earthquakes of magnitude 6.5 or greater. Three moderate earthquakes (
M6) along the SCF have been recorded by modern seismographs in the past 83 years.
6.4. Coronado Canyon Landslide
Sediment and sedimentary rock slope failures may occur along the Coronado Escarpment within Coronado and La Jolla submarine canyons. A large failure in Coronado Canyon was modeled to represent a submarine landslide close to San Diego Bay. Our landslide case was represented as a dipole (uplift pattern; see
Table 1; [
40,
41]).
7. Results
7.1. Chile 1960
The inundation extent and corresponding inundation pattern varies greatly from year to year in this scenario for San Diego (
Figure 7). Inundation for the present-day (2014) configuration of San Diego is primarily constrained to the south. For earlier years we see large inundation on the inner side of the harbor and NNE in the area of what used to be large tidal lands. Large inundation is evident for the 1945 DEM, especially north of the San Diego region and close to Lindbergh Field (San Diego airport), but that was reversed with the expansion of the Dutch Flat. The early bay, mostly unmodified by human activity, suffered relatively minor wave amplitudes beyond the harbor entrance. This is probably a result of shallow water at the entrance, which reduces the surge into the harbor. Inundation was increased locally at narrow embayments north and west of San Diego where dredging created deeper channels for boats, and fill areas further restricted the channel width. In contrast, the low-lying Silver Strand was overtopped in earlier configurations, but widening and increased elevation reduced the area of potential inundation in more recent years.
Figure 7.
Maximum wave amplitude and maximum current distribution in San Diego harbor for four different configurations (1892, 1938, 1945, and 2014). A Chile 1960 type of scenario was used to investigate changes in wave dynamics as a result of anthropogenic changes. Years indicate time tagging of large changes in the harbor. Left column shows wave heights in cm; right column tsunami currents in cm/s.
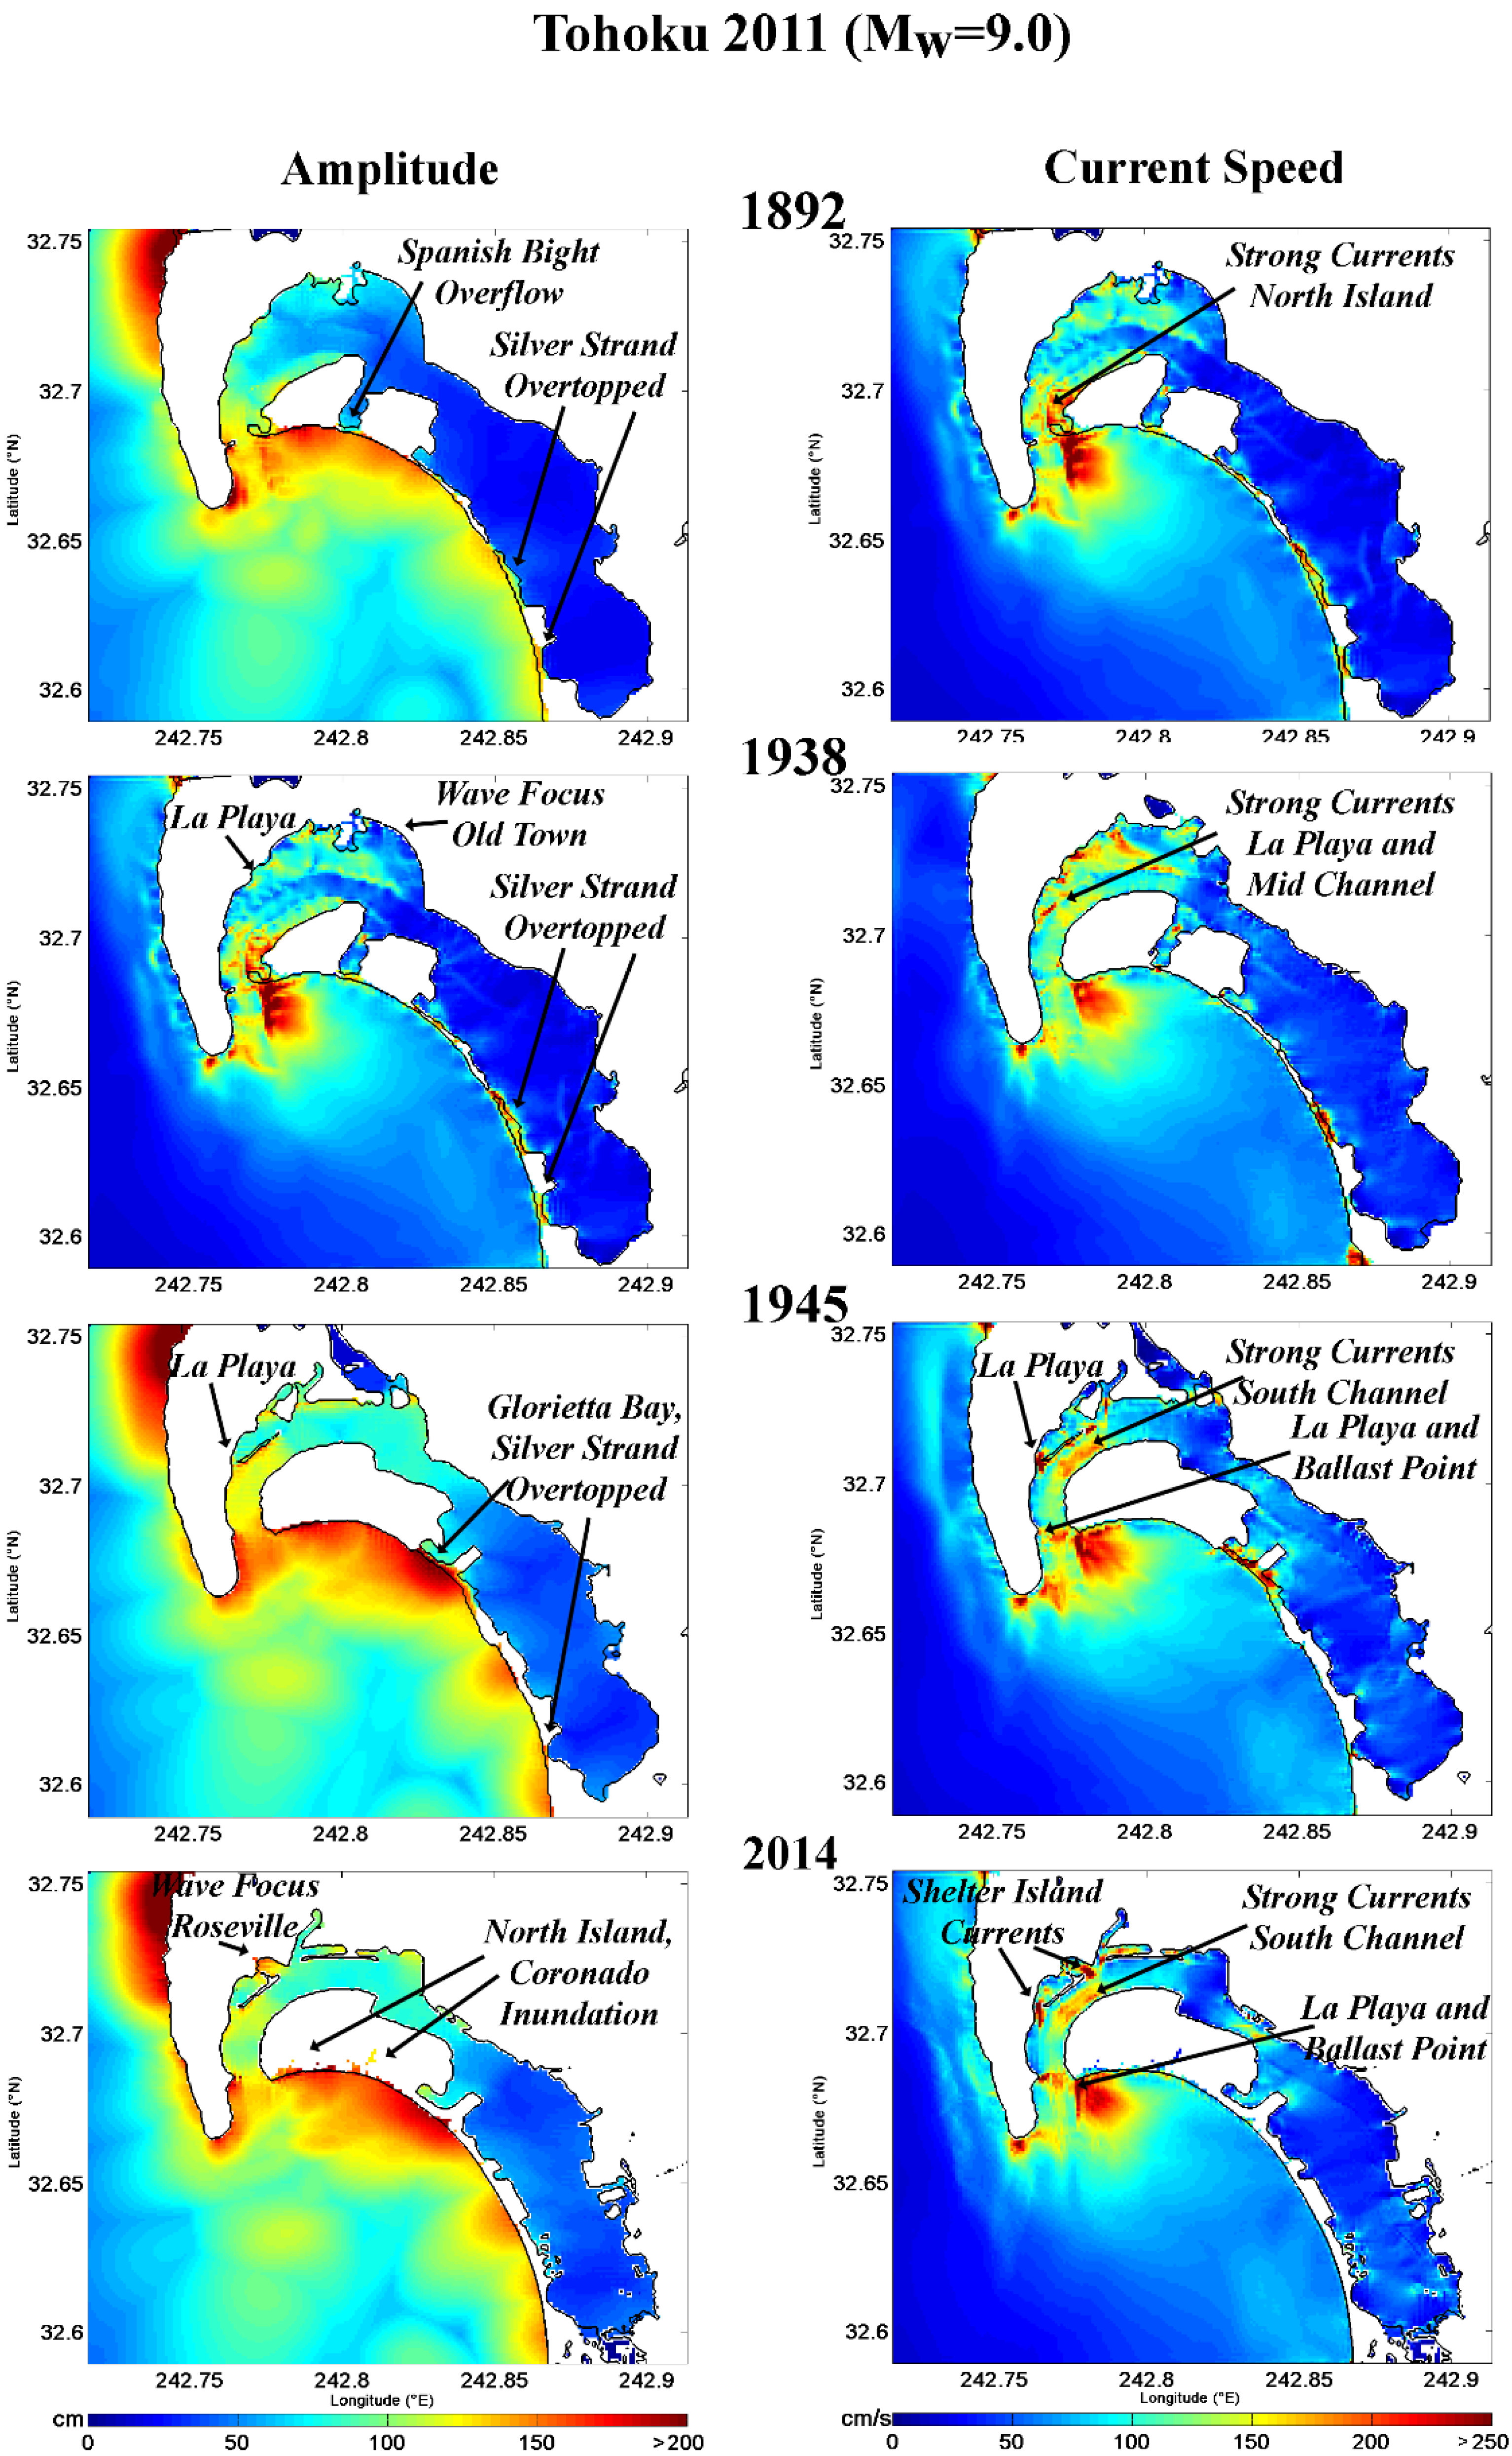
Figure 8.
Maximum wave amplitude and maximum current distribution in San Diego harbor for four different configurations (1892, 1938, 1945, and 2014). A tsunami scenario resembling the 11 March 2011 Tohoku tsunami was used to investigate changes in wave dynamics as a result of anthropogenic changes. Years indicate time tagging of large changes in the harbor. Left column shows wave heights in cm; right column tsunami currents in cm/s.
Generally, the pattern of wave amplitude distribution away from (or outside) the harbor has remained the same over the years but wave amplitudes inside the harbor show a gradual increase as a result of modifications. Currents also show a gradual increase as a function of further modifications for this event. A high current curve following the shape of the harbor is evident for all DEMs in this South American scenario. Additional spots of high current activity also appear in later years.
7.2. 11 March 2011 Japan Tsunami
Similar to the previous distant (Chile 1960) scenario, smaller wave amplitudes appear in older configurations. More specifically, at the earliest year (1892), numerical modeling shows energy spots constrained outside the harbor along the coastline and at the entrance of the harbor. Further development in the bay introduced larger waves inside the harbor around La Playa (
Figure 8, 1938). In later years, the creation of the jetty near La Playa changed this pattern and redistributed waves away from the original coastline and along the jetty. Currents also show an increase, but the overall trend is not so clear. Generally, in earlier years, currents were more widely distributed compared to more recent years, while spots of high currents were introduced. The high current spots within the harbor correspond to a new characteristic introduced in the second half of the twentieth century. This is common in both distant scenarios.
The tsunami current distribution from both distant scenarios is worth comparing. In the case of Chile 1960, high currents appear to be more widely distributed along the harbor, while for the Japan tsunami, high currents appear more concentrated near the entrance. This would likely be attributed to the location of the tsunami source and directivity of waves. The maximum amplitudes occur on the south side of Coronado/North Island for the Chile event, showing the effect of the southern source (directivity). In contrast, high amplitudes occur west of Point Loma for the Tohoku event, which arrives from the north and west. Multiple wave arrivals due to refraction along Pacific Ocean waveguides, e.g., Emperor–Hawaiian Seamounts produce strong energy many hours after the first wave arrivals ([
42]). Later wave arrivals may involve local resonant effects, so large amplitudes and strong currents were observed during both events. The long period character of these distant subduction megathrust events is very important for emergency planning. Major surges arriving several hours after the first waves caused serious and unexpected damage in 2011 (the surges also persisted for several hours in 1960).
We notice high currents in all plots, but it is clear that the creation of narrow islands and boat basins changes the distribution pattern in the harbor. Although there is an increasing trend with the modifications, enlargement of land space and dredging appear also to have contributed to reduction of currents in some cases while introducing high currents elsewhere (see 1892 and 1938 results;
Figure 5 and
Figure 6). Currents are high in narrow openings as one might expect, and more such spots of high currents appear in later years as San Diego land expansion led to a narrower opening in the port. The development of a narrow opening combined with channel deepening to the harbor appears also to be responsible for the intensification of the currents that follow a curved wider line along the harbor in 1938 as opposed to 1892. This implies increased danger to vessels not only at the entrances of narrow openings, but also along the “throat
14” of the San Diego harbor. Strong currents were indeed observed in Harbor Island and Shelter Island during the Tohoku tsunami and in other harbors in California where narrow channels exist (e.g., Catalina harbor, King Harbor in Redondo beach
etc.).
Figure 9.
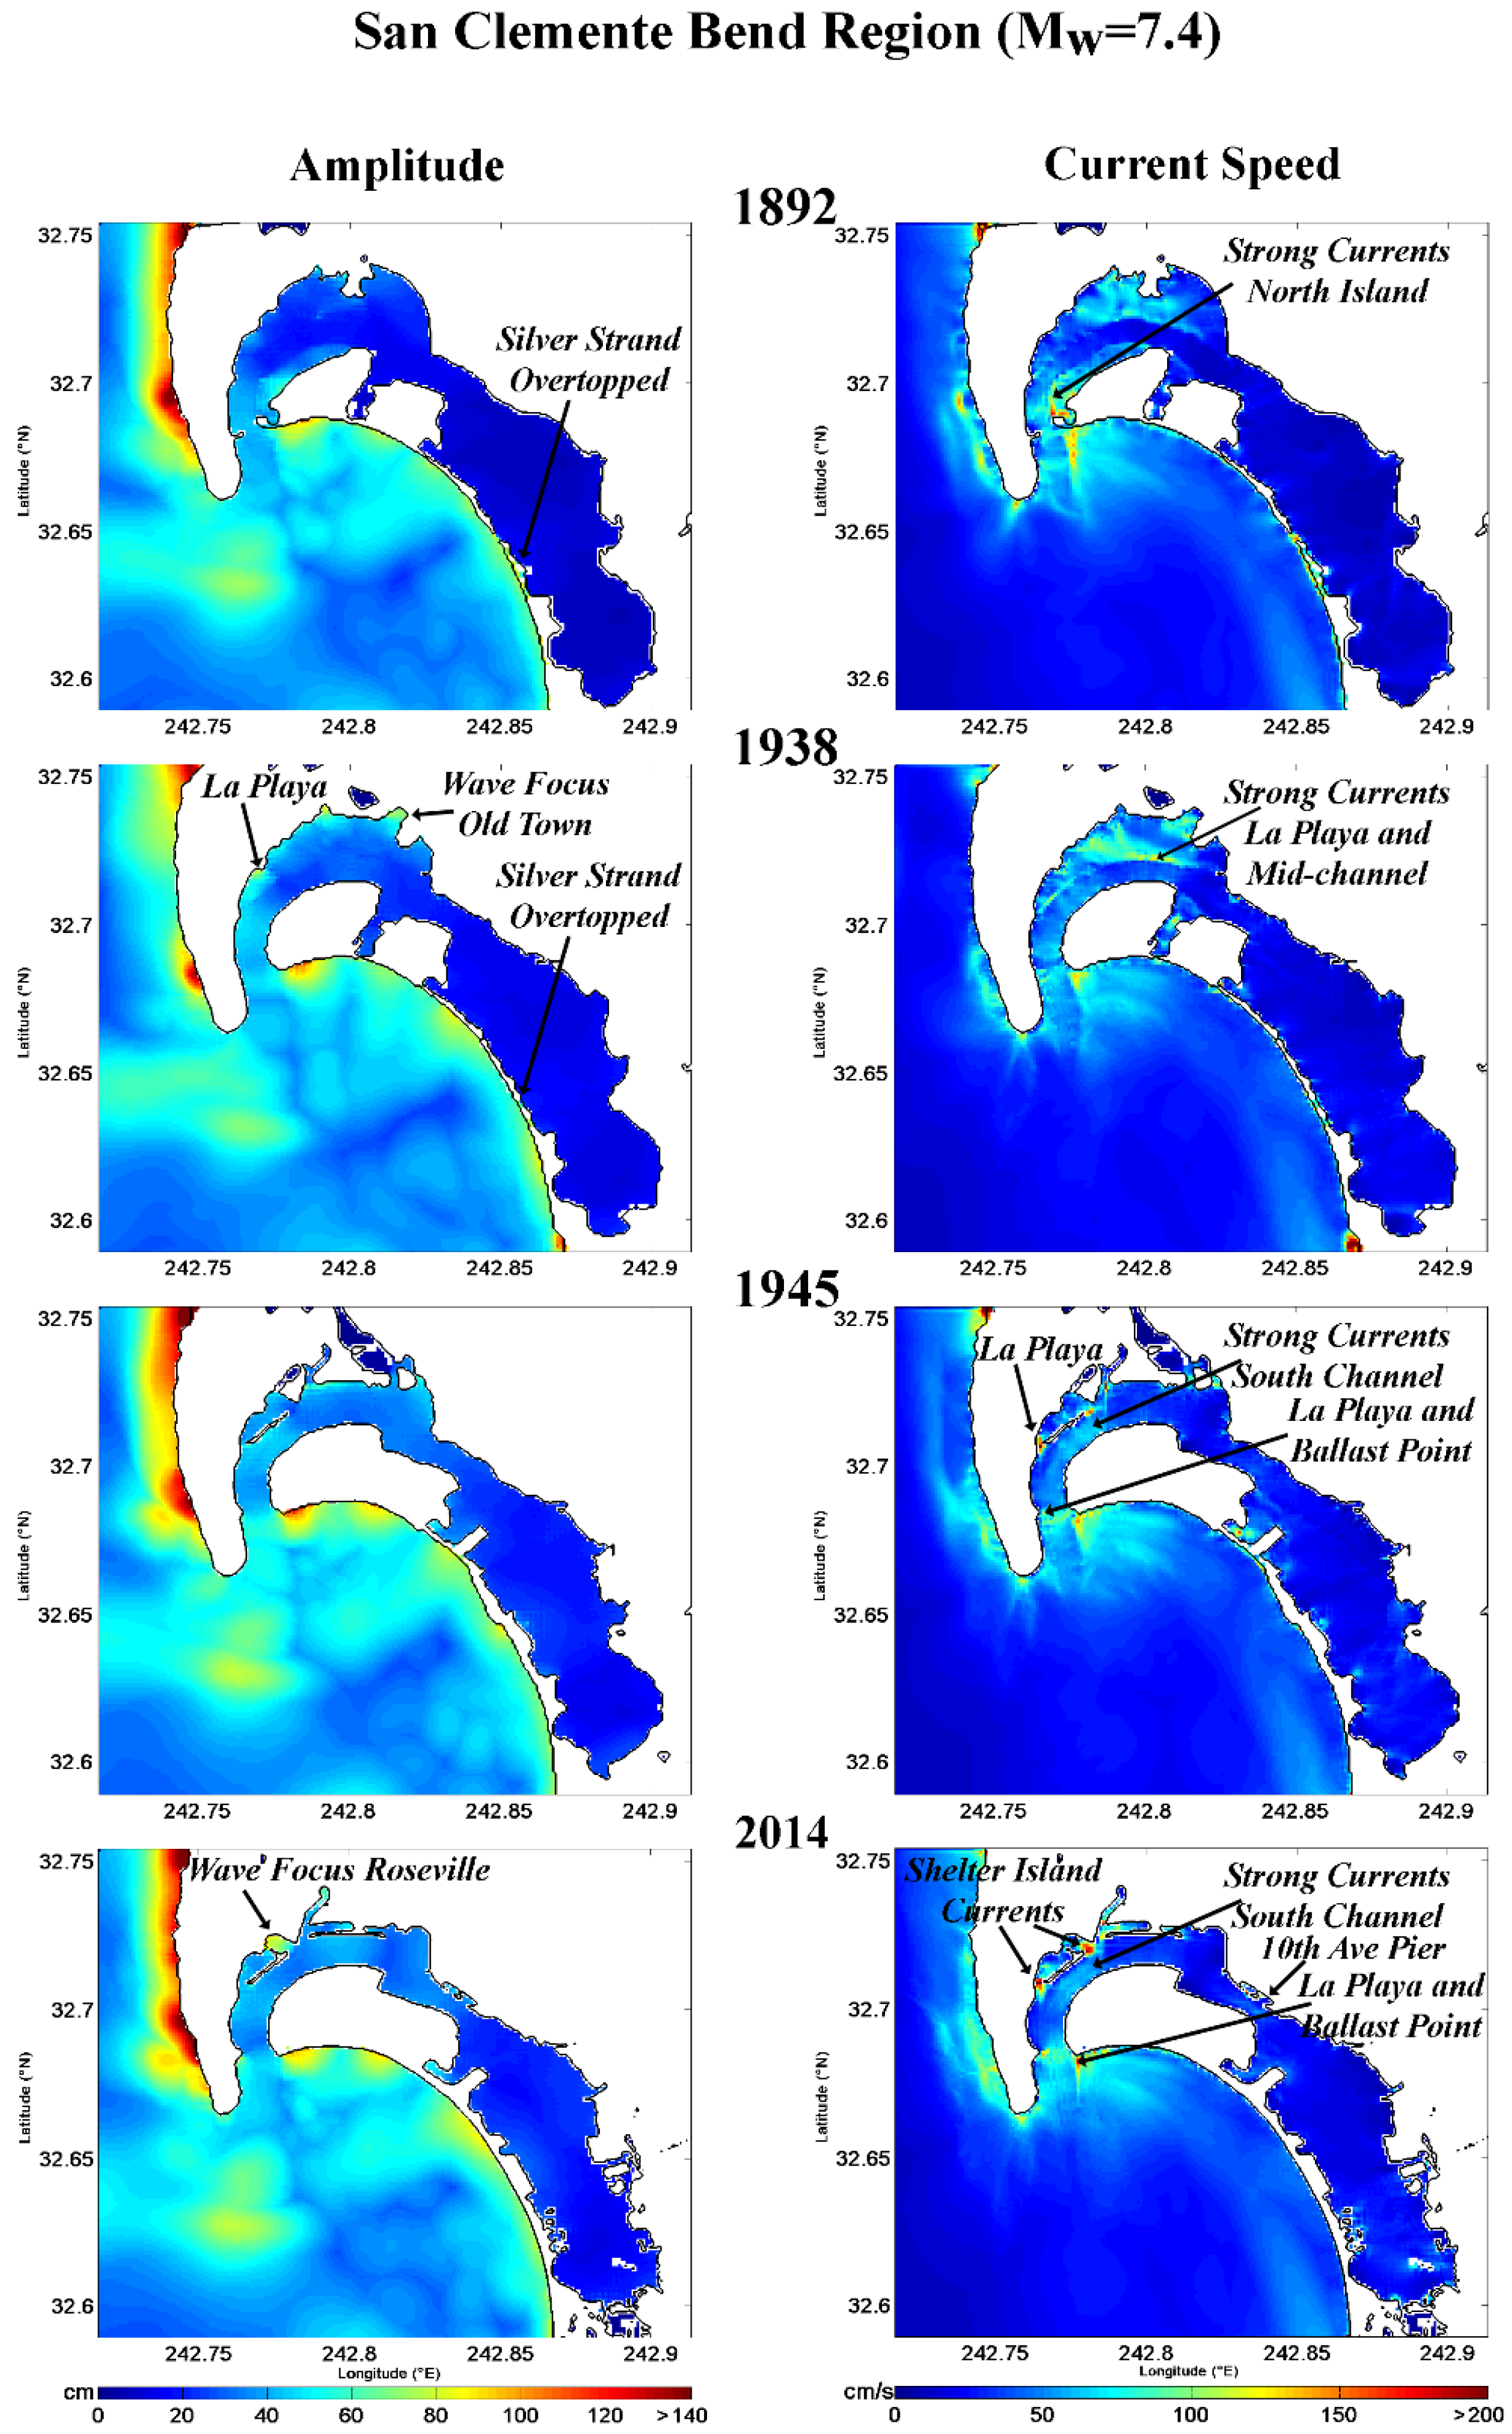
Maximum wave amplitude and maximum current distribution in San Diego harbor for four different configurations (1892, 1938, 1945, and 2014). A San Clemente fault rupture type of tsunami scenario was used to investigate changes in wave dynamics as a result of anthropogenic changes. Years indicate time tagging of large changes in the harbor. Left column shows wave heights in cm; right column tsunami currents in cm/s.
Figure 9.
Maximum wave amplitude and maximum current distribution in San Diego harbor for four different configurations (1892, 1938, 1945, and 2014). A San Clemente fault rupture type of tsunami scenario was used to investigate changes in wave dynamics as a result of anthropogenic changes. Years indicate time tagging of large changes in the harbor. Left column shows wave heights in cm; right column tsunami currents in cm/s.
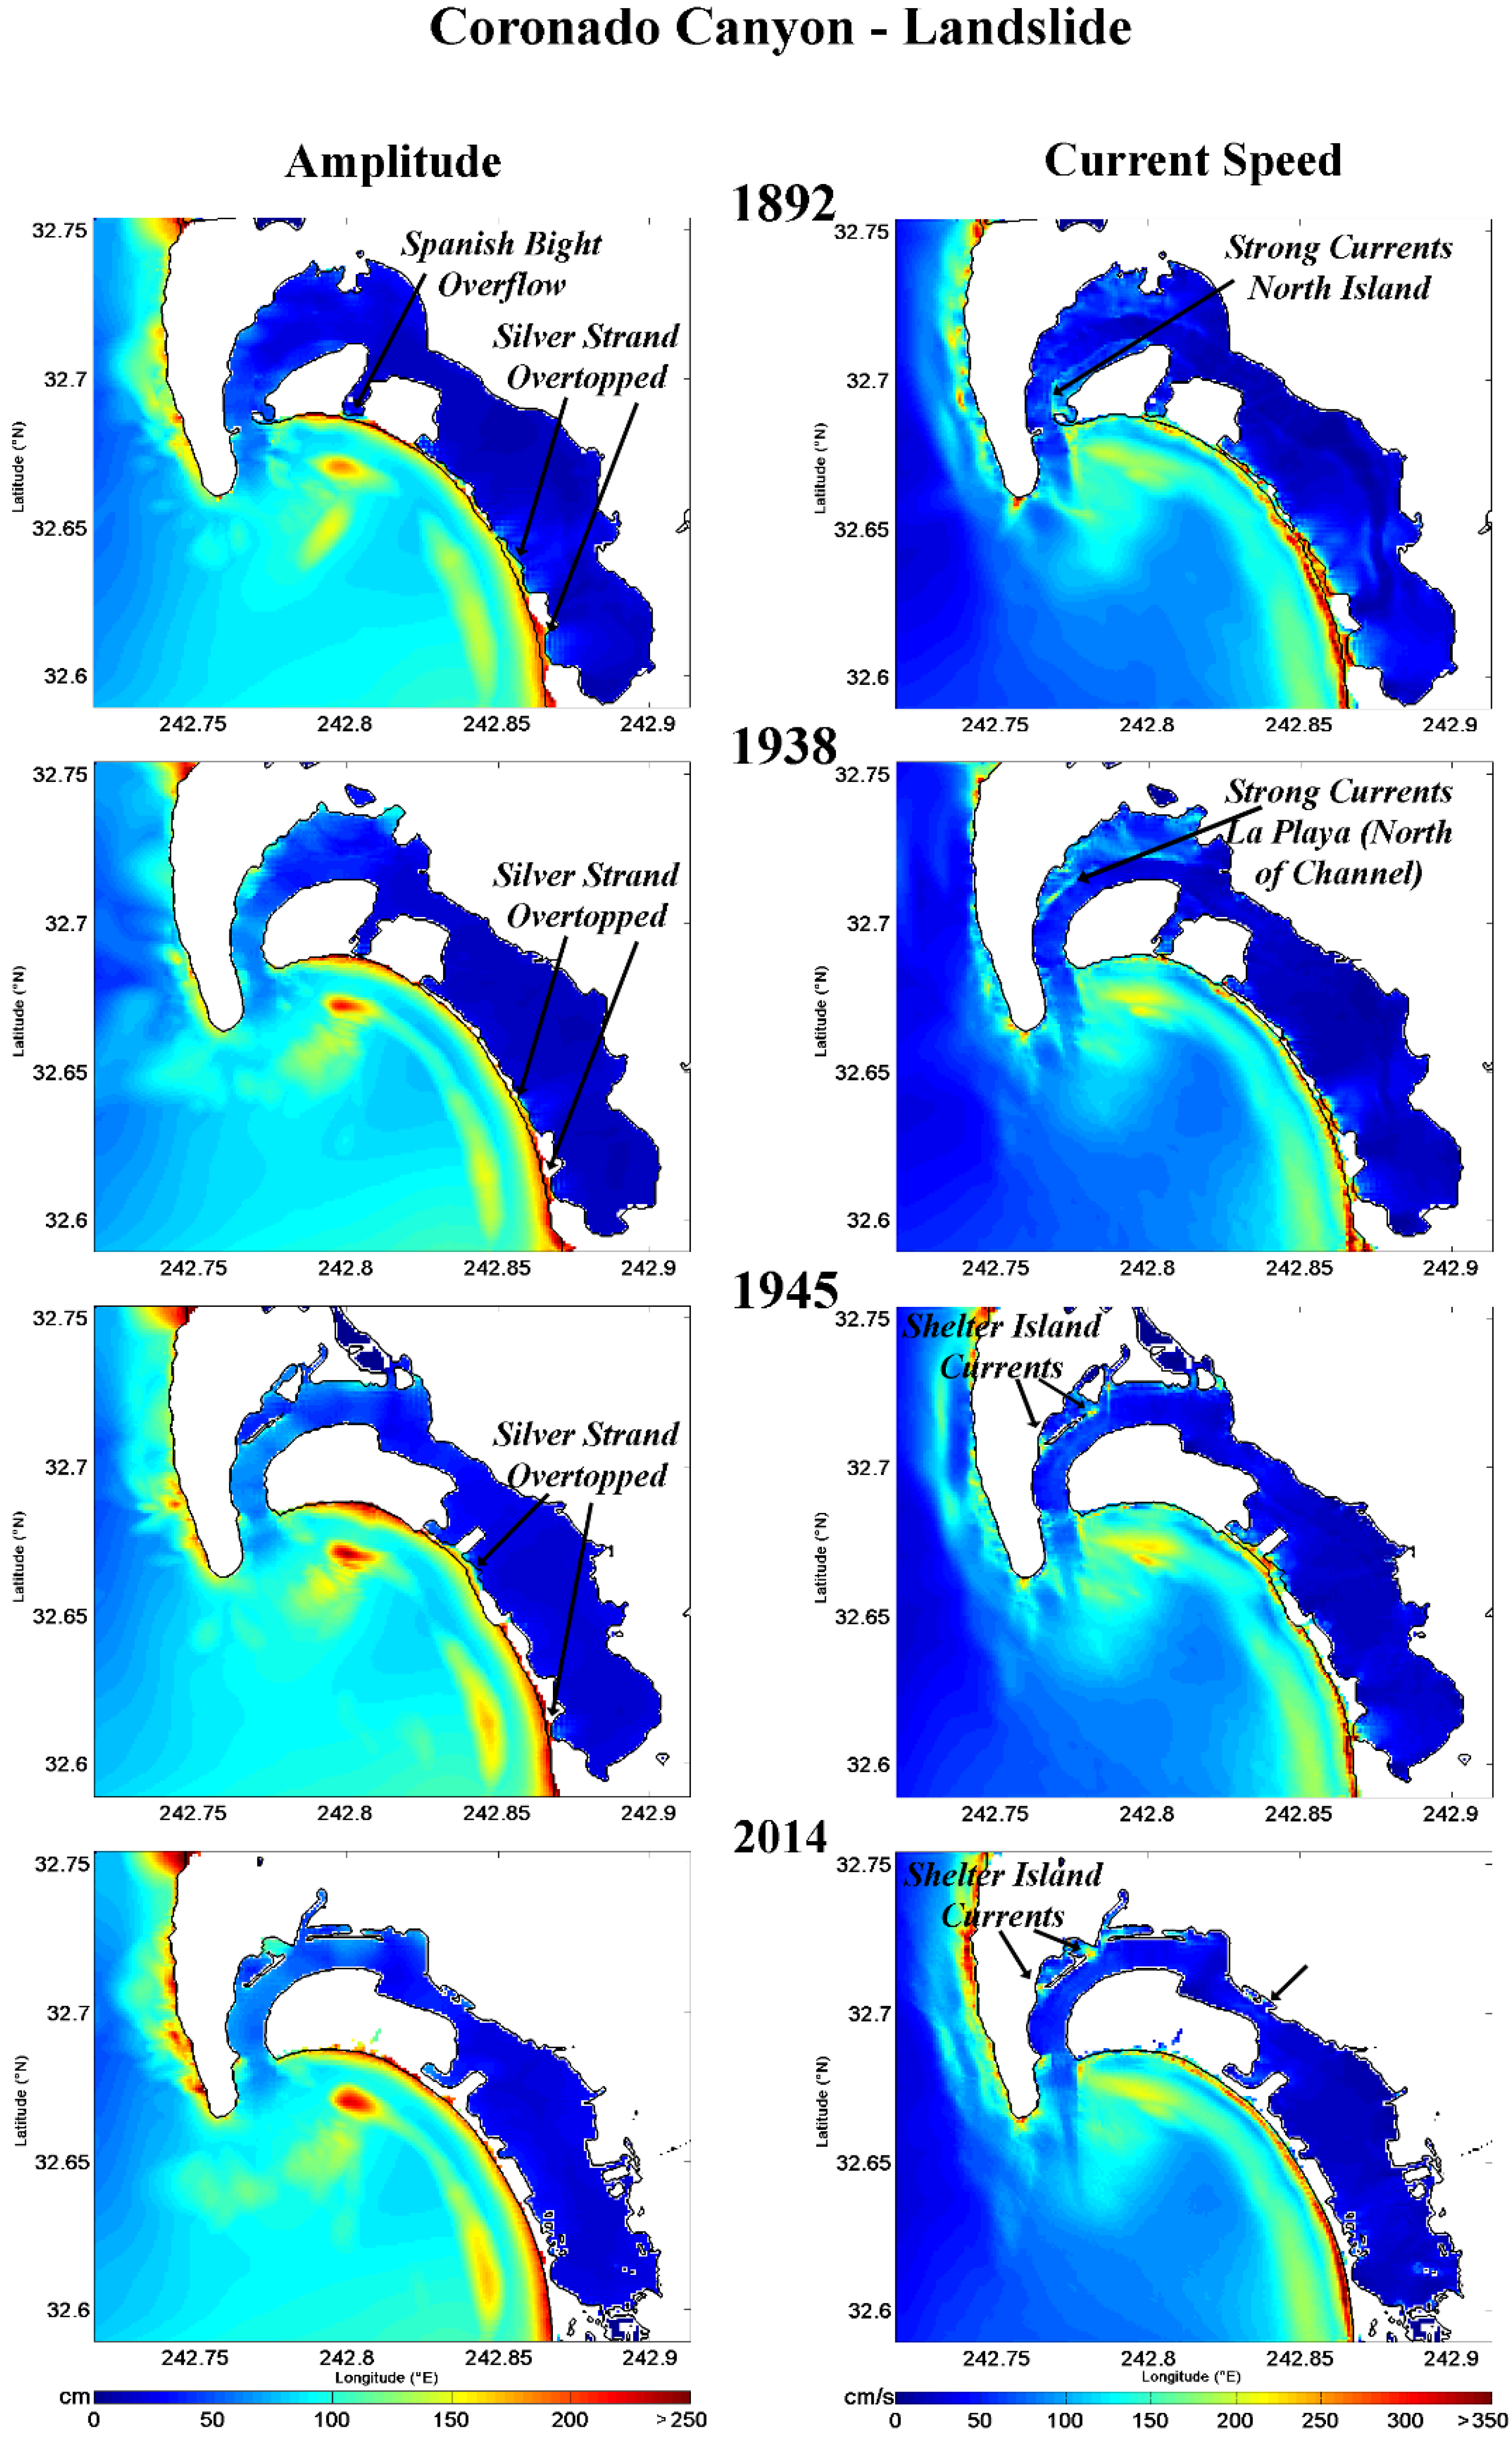
Figure 10.
Maximum wave amplitude and maximum current distribution in San Diego harbor for four different configurations (1892, 1938, 1945, and 2014). A hypothetical tsunami scenario generated by a landslide on Coronado Canyon was used to investigate changes in wave dynamics as a result of anthropogenic changes. Years indicate time tagging of large changes in the harbor. Left column shows wave heights in cm; right column tsunami currents in cm/s.
7.3. San Clemente Fault—Bend Region
Wave amplitudes for this scenario appear relatively low (predominantly 1–2 m). The pattern does not change with modifications. Tsunami currents also appear low for all years, but isolated spots of high energy are introduced after the extended modifications at the entrance of boat basins (e.g., La Playa; see
Figure 9). The small changes for this event likely are attributed to waves of shorter wavelength.
7.4. Coronado Canyon Landslide
Wave amplitude pattern does not appear vastly changed during the years for this scenario. Currents also generally maintain their distribution pattern while some spots of high activity get introduced. High currents appear constrained mainly along Coronado Island and Silver Strand outside the harbor (
Figure 10). Specifically, we notice similar patterns to the other scenarios with increased currents where channels narrow. Most importantly, for these scenarios, amplitudes are similar to distant events or greater (2 m or higher) due to proximity of the source and the landslide mechanism (larger displacement). The Coronado Canyon landslide source has a nearly direct path into San Diego Bay coming from the south.
8. Discussion/Conclusions
San Diego harbor has undergone extensive modifications and development. Four scenarios were run on four different DEMs to investigate the effects of the major harbor changes to tsunamis. The set of scenarios was selected to ensure a balanced set of scenarios that included both distant and local sources with varying geographical locations. The numerical code MOST was used to model all phases of the tsunami (generation to inundation).
Results show varying inundation patterns for the scenarios with some common characteristics for the distant events when compared to the local events. Inundation within the bay generally was reduced and constrained to locations outside the bay mainly due to expansion of land (channel narrowing) and further filling to elevate tidal flats. Introduction of jetties also caused redistribution of wave heights.
With respect to tsunami currents, it appears that spots of high energy increased in later years. This appears to be associated with the narrowing and deepening of the channel combined with the construction of jetties. In some occasions, changes had a positive effect (reduction of currents), but these positive effects appear to have been counteracted by creation of new high energy spots, due to the creation of narrow entrances to boat basins, in order to accommodate more vessels.
Altering the location of entrances to the boat basins or changing the shape of the boat basins might lead to alternative designs that attenuate currents. While the harbor modifications improve navigation, anchorage and mooring areas, the narrowed channels, especially where elongate islands were created near the harbor entrance, create intense currents during long period wave activity from major distant tsunamis. These currents have created havoc, damaging boats and docking facilities during large events in 1960 and 1988 (Chile), 1964 (Alaska), and 2011 (Japan) [
4]. The short period character and shorter duration of tsunamis from local sources reduce these effects. Some narrow low-lying areas along the Silver Strand may be susceptible to overtopping and inundation during large amplitude events, depending also on tidal conditions during the tsunami arrival. In addition, strong currents along beaches may cause severe erosion and scour, and pose serious threat to swimmers and small boats.
The effects of harbor modifications on tsunami impact is a subject that merits further investigation. However, the work presented here leads to the following more general conclusions:
Enhancement of port space increases exposure to assets within the harbor compared to previous years as more vessels are now accommodated within the port facilities.
Numerical results also show that the introduction of high currents could threaten navigation, vessels and facilities at narrow openings and also along the harbor “throat”.
Harbor modifications can have both positive and negative effects on tsunami impact. For example, currents can be constrained to areas of minimal impact (e.g., outside of the harbor), thereby exposing less assets to dangerous wave action.
The long duration of distant subduction megathrust tsunamis (Mw >8 source magnitude) spans several tidal cycles so that serious currents occur for several hours, or even days, after the first wave arrivals.
Acknowledgments
We would like to thank Finn Scheele for help with some of the maps in this manuscript. We would like to thank Cynthia Holder, Deputy District clerk/records manager of the Unified Port of San Diego for giving us access to the historical photographs of San Diego Bay.
This publication is partially funded by the Joint Institute for the Study of Atmosphere and Ocean (JISAO) at the University of Washington under NOAA Cooperative Agreement No. NA17RJ1232, Contribution No. 2445. This is Contribution No. 4364 from the NOAA/Pacific Marine Environmental Laboratory.
Author Contributions
A.B. wrote the majority of the paper, digitized the nautical charts for the simulations and made about half of the figures appearing in the manuscript. M.R.L. had the original idea for this paper, provided information on the local sources and wrote sections of the paper relative to the sources and San Diego Bay history. E.G. ran the simulations, helped with the decision-making of the distant sources and contributed to the editing of this paper.
Conflicts of Interest
The authors declare no conflict of interest.
References
- Unified Port of San Diego. Available online: http://www.portofsandiego.org (accessed on 7 July 2015).
- Kemp, K. The Mississippi Levee System and the Old River Control Structure. Available online: http://www.tulane.edu/~bfleury/envirobio/enviroweb/FloodControl.htm (accessed on 7 July 2015).
- Lander, J.F.; Lockridge, P.A. United States Tsunami 1890–1988; National Geophysical Data Center, National Environment Satellite, Data: Boulder, CO, USA, 1989. [Google Scholar]
- Wilson, R.I.; Admire, A.R.; Borrero, J.C.; Dengler, L.A.; Legg, M.R.; Lynett, P.; McCrink, T.P.; Miller, K.M.; Ritchie, A.; Sterling, K.; et al. Observations and impacts from the 2010 Chilean and 2011 Japanese tsunamis in California (USA). Pure Appl. Geophys. 2012, 170, 22. [Google Scholar] [CrossRef]
- Shuto, N. Damages to coastal structures by tsunami-induced currents in the past. J. Disaster Res. 2009, 4, 462–468. [Google Scholar]
- Military.com. Naval Air Station North Island. Available online: http://www.military.com/base-guide/naval-air-station-north-island (accessed on 13 July 2015).
- 2010 Census—Census.gov, 2010. Available online: http://www.census.gov/2010census/ (accessed on 14 September 2015).
- California Department of Parks and Recreation. About the Beach. Available online: http://www.parks.ca.gov/?page_id=984 (accessed on 13 July 2015).
- Office of Coast Survey, NOAA. Historical Charts. Available online: http://historicalcharts.noaa.gov/ (accessed on 8 July 2015).
- Fischer, P.J.; Mills, G.I. The Offshore Newport-Inglewood-Rose Canyon Fault Zone, California: Structure, Segmentation and Tectonics; Environmental Perils of the San Diego Region: San Diego, CA, USA, 1991; pp. 17–36. [Google Scholar]
- Harper & Row. Shepard, Submarine Geology, 3rd ed.; Harper & Row: New York, NY, USA, 1973. [Google Scholar]
- Gohres, S.D.H.C.-D. Tidal Marigrams. Available online: https://www.sandiegohistory.org/journal/64october/marigrams.htm#Gohres (accessed on 10 July 2015).
- Gohres, H. Tidal Marigrams. J. San Diego Hist. 1964, 10, 4. [Google Scholar]
- Military.com. CNIC|Naval Base Coronado Complex. Available online: http://www.cnic.navy.mil/regions/cnrsw/installations/navbase_coronado.html (accessed on 13 July 2015).
- NOAA, National Centers for Environmental Information. NOAA Tsunami Inundation Digital Elevation Models (DEMs). Available online: http://www.ngdc.noaa.gov/mgg/inundation/ (accessed on 8 July 2015).
- NOAA, National Centers for Environmental Information. ETOPO1 Global Relief Model. Available online: https://www.ngdc.noaa.gov/mgg/global/global.html (accessed on 8 July 2015).
- Carignan, K.S.; Taylor, L.A.; Eakins, B.W.; Friday, D.Z.; Grothe, P.R.; Love, M. Digital Elevation Models of San Diego, California: Procedures, Data Sources and Analysis; National Geophysical Data Center, National Oceanic Atmospheric Administration: Silver Spring, MD, USA, 2012. [Google Scholar]
- National Geodetic Survey, NOAA. Vertical Datums. Available online: http://www.ngs.noaa.gov/datums/vertical/ (accessed on 8 July 2015).
- NOAA, Center for Operational Oceanographic Products and Services. Tidal Datums and Their Applications; US Department of Commerce: Silver Spring, MD, USA, 2000.
- NOAA, Tides and Currents-Superseded Bench Mark Sheet for 9410170, San Diego CA. Available online: http://beta.tidesandcurrents.noaa.gov/benchmarks.html?id=9410170&type=superseded (accessed on 10 July 2015).
- Titov, V.V.; Synolakis, C.E. Numerical Modeling of tidal waver runup. J. Waterw. Port Coast. Ocean Eng. 1998, 124, 15. [Google Scholar] [CrossRef]
- Titov, V.V.; Gonzalez, F.I. Implementation and Testing of the Method of Splitting Tsunami (MOST) Model; NOAA Technical Memorandum ERL PMEL-112; NOAA: Seattle, WA, USA, 1997. [Google Scholar]
- Okada, Y. Surface deformation due to shear and tensile faults in a half-space. Bull. Seismol. Soc. Am. 1985, 75, 20. [Google Scholar]
- International Tsunami Information Center (ITIC). [email protected] (accessed on 9 October 2012).
- Synolakis, C.E.; Bernard, E.N.; Titov, V.V.; Kanoglu, U.; Gonzalez, F.I. Validation and Verification of Tsunami Numerical Models. Pure Appl. Geophys. 2008, 165, 38. [Google Scholar] [CrossRef]
- Percival, D.B.; Denbo, D.W.; Eble, M.C.; Gica, E.; Mofjeld, H.O.; Spillane, M.C.; Tang, L.; Titov, V.V. Extraction of tsunami source coefficients via inversion of DART® buoy data. J. Int. Soc. Prev. Mitig. Nat. Hazards 2011, 58, 567–590. [Google Scholar] [CrossRef]
- Admire, A.R.; Dengler, L.A.; Crawford, G.B.; Uslu, B.U.; Borrero, J.C.; Greer, S.D.; Wilson, R.I. Observed and modeled currents from the Tohoku-oki Japan and other recent tsunamis in Northern California. Pure Appl. Geophys. 2014, 171, 18. [Google Scholar] [CrossRef]
- Barberopoulou, A.; Legg, M.R.; Uslu, B.; Synolakis, C.E. Reassessing the tsunami risk in major ports and harbors of California I: San Diego. Nat. Hazards 2011, 58, 18. [Google Scholar] [CrossRef]
- Kanamori, H.; Cipar, J.J. Focal Process of the great Chilean earthquake 22 May 1960. Phys. Earth Planet. Inter. 1974, 9, 9. [Google Scholar] [CrossRef]
- Kanamori, H. The energy release in great earthquakes. J. Geophys. Res. 1977, 82, 7. [Google Scholar] [CrossRef]
- Barrientos, S.E.; Ward, S.N. The 1960 Chile earthquake: Inversion for slip distribution from surface deformation. Geophys. J. Int. 1990, 103, 9. [Google Scholar] [CrossRef]
- Tanaka, H.; Tinh, N.X.; Umeda, M.; Hirao, R.; Pradjoko, E.; Mano, A.; Udo, K. Coastal and estuarine morphology changes induced by the 2011 Great East Japan Earthquake Tsunami. Coast. Eng. J. 2012, 54, 25. [Google Scholar] [CrossRef]
- Taylor, A. Japan Earthquake, 2 Years Later: Before and After. Available online: http://www.theatlantic.com/photo/2013/03/japan-earthquake-2-years-later-before-and-after/100469/#img18 (accessed on 13 July 2015).
- NOAA, National Data Buoy Center. Available online: http://www.ndbc.noaa.gov/dart.shtml (accessed on 10 July 2015).
- Gica, E.; Spillane, M.C.; Titov, V.V.; Chamberlin, C.D.; Newman, J.C. Development of the forecast propagation database for NOAA’s Short-Term Inundation Forecast for Tsunamis (SIFT); NOAA Technical Memorandum, OAR PMEL-139; NOAA: Seattle, WA, USA, 2008. [Google Scholar]
- Legg, M.R. Geologic Structure and Tectonics of the Inner Continental Borderland Offshore Northern Baja California, Mexico, Santa Barbara, CA. Ph.D. Dissertation, University of California, Santa Barbara, CA, USA, 1985. [Google Scholar]
- Legg, M.R.; Borrero, J.C. Tsunami potential of major restraining bends along submarine strike-slip faults. In Proceedings of the International Tsunami Symposium 2001, NOAA/PMEL, Seattle, WA, USA, 7–10 August 2001.
- Legg, M.R.; Goldfinger, C.; Kamerling, M.J.; Chaytor, J.D.; Einstein, D.E. Morphology, structure and evolution of California Continental Borderland restraining bends. Tecton. Strike-Slip Restraining Releas. Bends Cont. Oceanic Settings 2007, 290, 143–168. [Google Scholar] [CrossRef]
- Goldfinger, C.; Legg, M.R.; Torres, M.E. New Mapping and Submersible Observations of Recent Activity on the San Clemente Fault; EOS, Transactions of the American Geophysical Union: Washington, DC, USA, 2000. [Google Scholar]
- Synolakis, C.E.; Borrero, J.C.; Eisner, R. Developing inundation maps for Southern California. In Proceedings of the 2002 Coastal Disasters Conference, San Diego, CA, USA, 24–27 February 2002.
- Synolakis, C.E.; Bardet, J.P.; Borrero, J.; Davies, H.; Okal, E.; Silver, E.; Sweet, J.; Tappin, D. Slump origin of the 1998 Papua New Guinea tsunami. Proc. R. Soc. Lond. A 2002, 458, 763–789. [Google Scholar] [CrossRef]
- Barberopoulou, A.; Legg, M.R.; Gica, E. Multiple Wave Arrivals Contribute to Damage and Tsunami Duration on the US West Coast; Springer: Berlin, Germany; Heidelberg, Germany, 2014. [Google Scholar]
1There are also some submarines, an explosives loading area, and mooring facilities and docks for many other naval vessels throughout the bay ([6]). 2Spanish Bight is a graben associated with the Rose Canyon fault zone, e.g., [10]. San Diego Bay lies within the releasing stepover of the Rose Canyon fault zone, which created the bay and uplift of Point Loma. The Silver Strand is a narrow sand spit that connects North Island/Coronado to the mainland at Imperial Beach to the south. San Diego Bay was a natural lagoon formed behind this barrier beach ([11]). 3North Island was the source of fresh water for the lighthouse keeper on Point Loma during the nineteenth century.
4Originally, this area was the fan delta for the San Diego River, which was flooded in the 1861/62 “Noachian Deluge”—a severe flood event. Levees (restraining wall on 1892, no 5106 chart) were built to redirect the river flow to False Bay (Mission Bay), which finally succeeded after a couple more floods broke through to San Diego Bay. Dutch Flat was expanded, and adjoining basins were subsequently filled as Lindbergh Field (the municipal airport) grew and adjacent land was developed. Finally, Shelter Island and Harbor Island were constructed to provide additional protection for marinas and land for hotels, restaurants, etc. (e.g., Figure 3). 5Spanish Bight was mostly filled to connect North Island to Coronado, and additional dredging created local bays, such as Glorietta Bay, for marinas and naval vessels. Piers were constructed at San Diego for commercial boats and naval shipyards to the south at National City where major shipyards were built. The southern end of the bay had salt evaporation ponds, although a marina was also built for the City of Chula Vista. The Silver Strand was enhanced to reduce flooding during storms, and marinas were constructed in some locations (other locations were restricted to military operations including an amphibious base and radio station).
6La Playa is the location of the original tide gauge for San Diego. It was first installed in 1854. A strong local earthquake, 27 May 1862 M~6, created a wave in the bay that was observed by the tide gauge engineer (Andrew Cassidy) who was repairing the pier for the tide gauge at the time of the earthquake. He observed a runup of about 1–1.2 m (3–4 ft) on the beach at La Playa but the water returned to its normal level. We do not know if this runup was a vertical or horizontal distance [12,13]. The Rose Canyon fault was likely the source of the earthquake but data are inadequate to determine the epicenter with certainty. 7Although contours were matching fairly well with old charts an additional small shift ensured a better fit to the contours in the nautical charts and the coastline.
8MLLW is the lower low water height average of each tidal day calculated over a tidal datum epoch (19 year period adopted by the National Ocean Service).
9MHHW is the higher high water height average of each tidal day calculated over a tidal datum epoch (19 year period adopted by the National Ocean Service).
10We abbreviated the source simply for easy reference in this article.
11Depth is measured from ground surface to top of the fault.
13Source from NOAA Center for Tsunami Research.
14Numerous piers and anchorages exist in the area between San Diego and Coronado. Strong currents in these areas were damaging to Navy ships and other boats, while the ferry service was disrupted during the 1960 event. Docks were damaged and some boats dragged from their moorings [3].
© 2015 by the authors; licensee MDPI, Basel, Switzerland. This article is an open access article distributed under the terms and conditions of the Creative Commons Attribution license ( http://creativecommons.org/licenses/by/4.0/).


