Article

Gene Transcript Profiling in Sea Otters Post-Exxon Valdez Oil Spill: A Tool for Marine Ecosystem Health Assessment

1
U.S. Geological Survey, Western Ecological Research Center, Davis Field Station, University of California, Davis, CA 95616, USA
2
U.S. Geological Survey, Alaska Science Center, Anchorage, AK 99508, USA
*
Author to whom correspondence should be addressed.
J. Mar. Sci. Eng. 2016, 4(2), 39; https://doi.org/10.3390/jmse4020039
Submission received: 8 January 2016 / Revised: 5 May 2016 / Accepted: 16 May 2016 / Published: 1 June 2016
(This article belongs to the Special Issue Marine Oil Spills)

Abstract

:
Using a panel of genes stimulated by oil exposure in a laboratory study, we evaluated gene transcription in blood leukocytes sampled from sea otters captured from 2006–2012 in western Prince William Sound (WPWS), Alaska, 17–23 years after the 1989 Exxon Valdez oil spill (EVOS). We compared WPWS sea otters to reference populations (not affected by the EVOS) from the Alaska Peninsula (2009), Katmai National Park and Preserve (2009), Clam Lagoon at Adak Island (2012), Kodiak Island (2005) and captive sea otters in aquaria. Statistically, sea otter gene transcript profiles separated into three distinct clusters: Cluster 1, Kodiak and WPWS 2006–2008 (higher relative transcription); Cluster 2, Clam Lagoon and WPWS 2010–2012 (lower relative transcription); and Cluster 3, Alaska Peninsula, Katmai and captive sea otters (intermediate relative transcription). The lower transcription of the aryl hydrocarbon receptor (AHR), an established biomarker for hydrocarbon exposure, in WPWS 2010–2012 compared to earlier samples from WPWS is consistent with declining hydrocarbon exposure, but the pattern of overall low levels of transcription seen in WPWS 2010–2012 could be related to other factors, such as food limitation, pathogens or injury, and may indicate an inability to mount effective responses to stressors. Decreased transcriptional response across the entire gene panel precludes the evaluation of whether or not individual sea otters show signs of exposure to lingering oil. However, related studies on sea otter demographics indicate that by 2012, the sea otter population in WPWS had recovered, which indicates diminishing oil exposure.

1. Introduction

The effects of the 1989 Exxon Valdez oil spill (EVOS) on nearshore marine vertebrates in Prince William Sound, Alaska, including the sea otter (Enhydra lutris), have continued for more than two decades [1,2,3,4,5,6,7,8,9]. A series of long-term studies demonstrated a lack of recovery of sea otters through at least 2009 [1,4,6,7,8,9], based on reduced rates of survival and exposure to residual oil in western Prince William Sound (WPWS), although the importance of continuing exposure as a factor constraining sea otter recovery has been debated [10,11,12]. To evaluate population health and recovery of sea otters and other species potentially affected by the spill, the Exxon Valdez Oil Spill Trustee Council established physiologic (based on biomarkers indicating exposure to aromatic hydrocarbons) and demographic (based on a return to expected abundance or reproduction/survival rates) criteria.
We used molecular gene transcription to examine the physiological status of sea otters in oiled areas of WPWS, the geographic region most severely affected by the oil spill. Exposure to petroleum hydrocarbons has the potential to cause not only catastrophic short-term effects, but importantly, often overlooked, long-term damage to individuals, populations or even ecosystems [1,13]. The extent and duration of long-term effects are difficult to assess, as pathophysiological changes within an individual may be significant yet subtle and, consequently, undetectable using classical wildlife diagnostic methods. Alterations in the levels of gene transcription can provide the earliest observable signs of health impairment, discernable prior to clinical manifestation [14,15,16]. The utility of the methodology used in our study relies on the assumption that oil-induced pathology in sea otters is accompanied by predictable and specific changes in gene transcription.
In 2008, we sampled sea otters in previously oiled and unoiled areas of WPWS and compared these to samples from reference (i.e., deemed clinically normal) sea otters from the Alaska Peninsula and captive, healthy sea otters from aquaria [6]. We concluded that sea otters in oiled areas had gene transcription patterns consistent with chronic, low-grade exposure to organic compounds. In 2010 and 2012, we resampled sea otters in the same areas of WPWS to evaluate whether gene transcription patterns observed in 2008 persisted. To provide a broader geographic and temporal interpretation for the analysis of WPWS samples collected in 2010 and 2012, we included comparable gene transcription data on sea otters from WPWS in 2006, 2007 and 2008 and from the Shumagin Islands on the Alaska Peninsula, Katmai National Park and Preserve, Clam Lagoon on Adak Island in the Aleutian Archipelago, Kodiak Island and captive animals from aquaria (Figure 1).
Herein, we provide the results of gene transcription analyses on sea otters sampled at WPWS between 2006 and 2012 and compare these data to those from sea otter populations sampled across southwest Alaska and from aquaria.

2. Materials and Methods

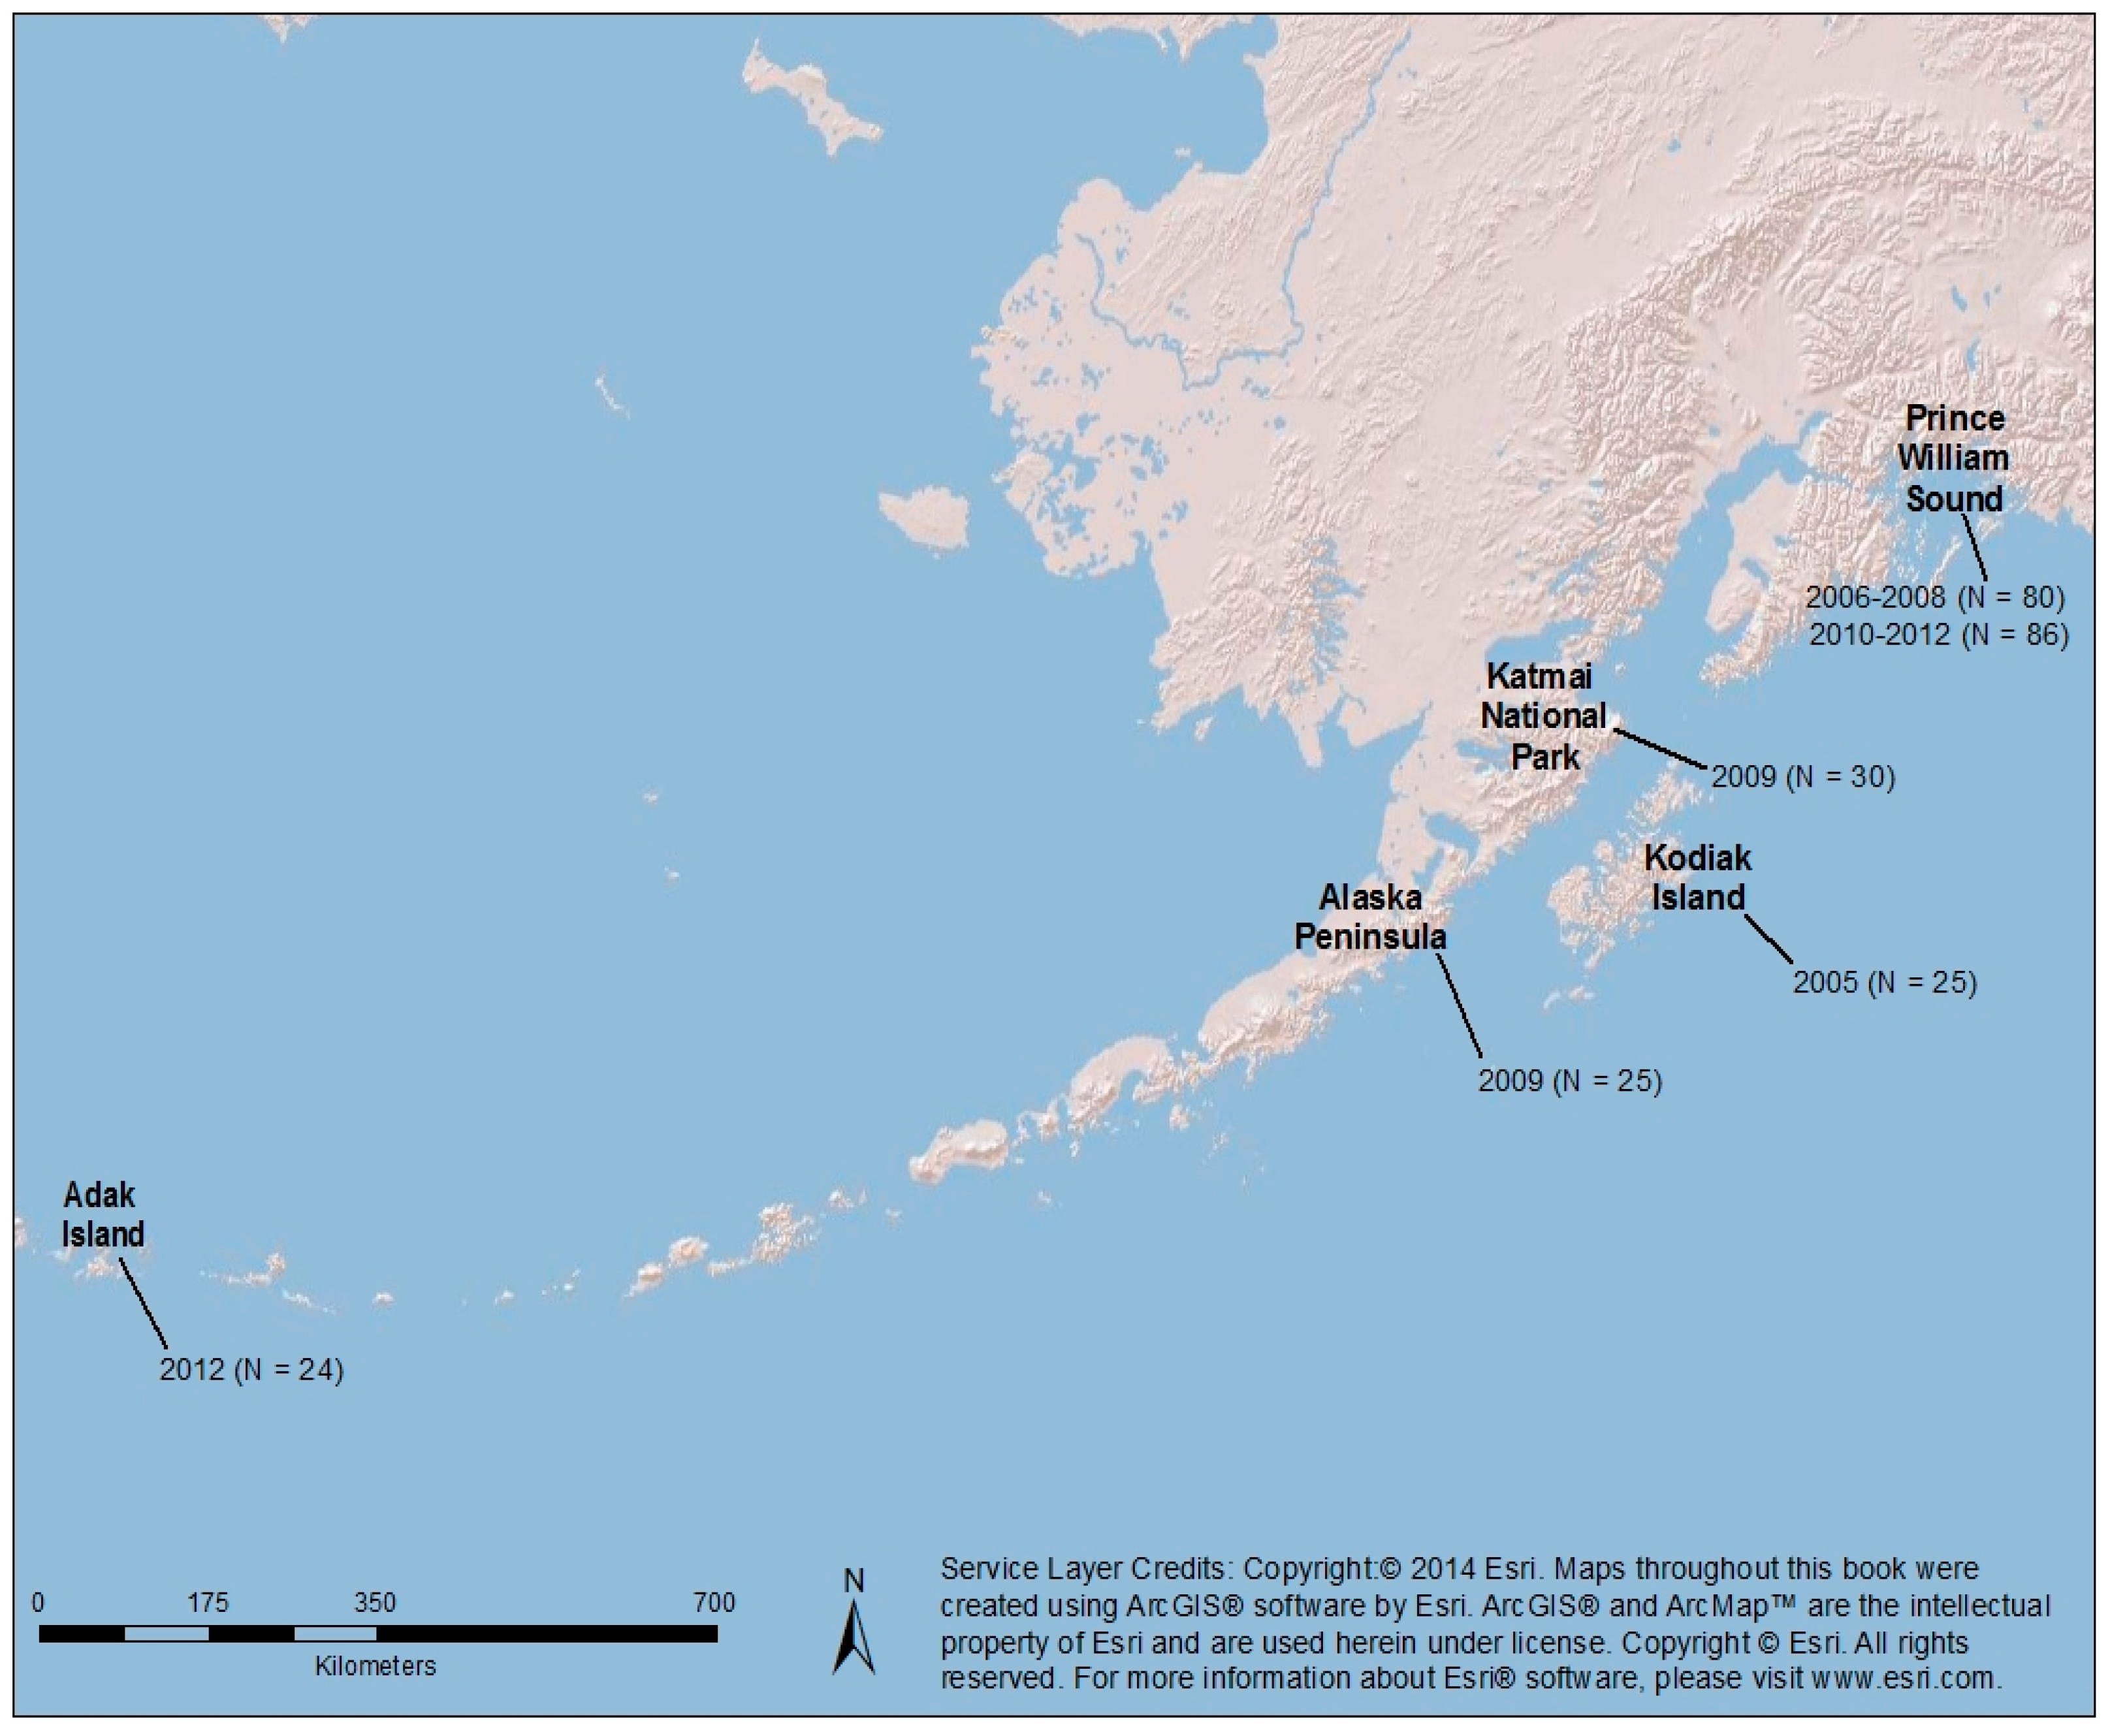
2.1. Sea Otter Samples

Free-ranging sea otters were sampled from five locations: (1) WPWS in 2006, 2007 and 2008 (n = 80) and in 2010 and 2012 (n = 88); (2) the Alaska Peninsula (AP) in 2009 (n = 25); (3) Katmai (KAT) in 2009 (n = 30); (4) Kodiak (KOD) in 2005 (n = 25); and (5) Clam Lagoon (CL) at Adak Island in 2012 (n = 24). Wild sea otters were captured, anesthetized with fentanyl citrate and midazolam hydrochloride [17] and blood drawn by jugular venipuncture within 1–2 hours of the initial capture. Capture methods are presented in detail in Miles et al. (2012) [6] and Bodkin et al. (2012) [7].
Blood samples from 17 captive reference sea otters were obtained from the Monterey Bay Aquarium (n = 9) (Monterey, CA), Shedd Aquarium (n = 4) (Chicago, IL), Oregon Coast Aquarium (n = 2) (Newport, OR) and the Vancouver Aquarium (n = 2) (Vancouver, BC) in 2008, 2009 and 2010 [5]. These animals were identified as clinically normal by staff veterinarians at these aquaria at the time of blood collection.

2.2. Blood and RNA Processing

A 2.5-mL sample from each sea otter was drawn directly into a PAXgene™ blood RNA collection tube (PreAnalytiX©, Hombrechtikon, Switzerland) from either the jugular or popliteal vein and then frozen at −20 °C until extraction of RNA [5]. The PAXgene tube contains RNA-stabilizing reagents that protect RNA molecules from degradation by RNases and prevent further induction of gene transcription. Without stabilization, copy numbers of individual mRNA species in whole blood can change many-fold during storage and transport. The RNA from blood in PAXgene tubes was isolated according to the manufacturer’s standard protocols [18]. All RNA was checked for quality by running on both an agarose gel and on a NanoDrop 2000 (Thermo Fisher Scientific Inc., Wilmington, DE, USA), achieving A260/A280 ratios of approximately 2.0 and A260/A230 ratios of less than 1.0. A standard cDNA synthesis was performed on 1 μg of RNA template from each animal (QuantiTect® Reverse Transcription Kit, Qiagen, Valencia, CA, USA) [18]. Quantitative real-time polymerase chain reaction (qPCR) systems for the individual, sea otter-specific reference or housekeeping gene (S9) and genes of interest (Table 1) were run in separate wells [18]. Amplifications were conducted on a 7300 Real-time Thermal Cycler (Applied Biosystems™, Foster City, CA, USA) with reaction conditions identical to those in Bowen et al. (2007, 2012) [5,18] and Miles et al. (2012) [6].

2.3. Targeted Genes

The 10 genes targeted in our study represent multiple physiological systems that play a role in immuno-modulation, inflammation, cell protection, tumor suppression, cellular stress-response, xenobiotic metabolizing enzymes and antioxidant enzymes. These genes can be modified by biological, physical or anthropogenic impacts and consequently provide information on the general type of stressors present in a given environment (Table 1). Note the inverse relationship in interpretation; i.e., that lower values in Table 2 correspond to higher transcription rates.

2.4. Statistical Analyses

We used nonparametric statistical analyses because the cycle threshold (CT) measure of gene transcription provided by qPCR may have a lognormal distribution [15]. We used conventional nonparametric mean comparison tests (Kruskal–Wallis with Dunns’ multiple comparison; NCSS© Statistical Software, 2007, Kaysville, UT, USA) to evaluate transcript values of each gene by classification groups (7 groups, based on location, including captives as a reference “location” group, and including 2 temporal groups from WPWS). We conducted multivariate, nonparametric, multi-dimensional scaling analysis (NMDS) in conjunction with cluster analysis for statistical and graphical representation of individual sea otters clustered by similarity in transcription and not by pre-defined groups, such as location [42]. Statistical comparisons of individuals grouped by clusters were made using SIMPROF, which is a similarity profile permutation test for significance among a priori, unstructured clusters of samples. We used ANOSIM, a nonparametric analogue to a 2-way ANOVA, to test for differences in gene transcription among years, between sexes and among three age groups, i.e., juvenile, adult and aged adult [43]. Statistical significance was based on p-values ≤0.05.

3. Results

Gene transcription (CT) values differed among sea otters sampled in WPWS in 2006, 2007, 2008, 2010 and 2012 (ANOSIM, p < 0.001, global R = 0.594). When analyzed without a priori structure (i.e., year), sea otters separated into two well-defined groups as depicted by NMDS (3D R = 0.08; Figure 2) and confirmed by cluster analysis (SIMPROF, p < 0.001). These well-defined groups were designated PWS1 (2006, 2007, 2008) and PWS2 (2010, 2012). Transcript patterns were not influenced by sex (p = 0.08) or age (p = 0.16).
For the analysis of all groups, patterns depicted by the NMDS analyses were similar to those reported in Miles et al. (2012), with differences attributable to the inclusion of the additional groups (Figure 3). Groups generally separated into three distinctive clusters: (1) KOD and PWS1; (2) CL and PWS2; and (3) KAT, AP and captive sea otters (2D R = 0.15; SIMPROF, p < 0.001; Figure 3).
Overall, gene transcription (CT) values differed among groups (Figure 3). The transcript profiles from the AP, KAT and clinically normal captive groups were similar and differed from the other three groups. Profiles of the PWS2 and CL groups were similar. In general, gene transcription patterns in the PWS1 group of sea otters (captured 2006–2008) were indicative of molecular reactions to organic exposure, tumor formation, inflammation and viral infection that may be consistent with chronic, low-grade exposure to an organic substance (Table 1 and Table 2). Although the KOD group overlapped with PWS1 in the NMDS analysis (Figure 3), the transcription of seven genes was highly upregulated (at least >2 CT values rounded) at KOD compared to PWS1 (Table 2). The PWS2 group (captured 2010 and 2012), in contrast, had a general pattern of lower transcription, with eight of the 10 genes showing significant downregulation compared to PWS1. The PWS2 sea otters grouped statistically with the CL sea otters (Figure 3).
Using Kruskal–Wallis, nine of the ten genes evaluated had significant differences between at least two classification groups; only CYT did not differ among groups (Table 2). Geometric mean transcript values were highest (i.e., lowest CT values) at KOD for seven of the nine genes showing significant differences (HDC, COX2, AHR, THRβ, HSP70, IL10, MX1). Geometric mean transcript values for IL18 were highest in the PWS1, AP and CAP groups. The lowest geometric mean transcript values among groups generally were found in CL and PWS2 sea otters for seven of the nine genes (HDC, COX2, AHR, IL10, MX1 at CL and THRβ, HSP70 at PWS2). The lowest geometric mean transcript value for IL18 was in the KOD group. The largest ranges of geometric means among groups (most variable expression) were identified for HDC and IL10, while the smallest ranges occurred for DRB, IL18 and CYT (with CYT showing no significant variation among any groups). Genes with larger ranges may be subject to greater environmental variation in a particular system than genes with smaller ranges.

4. Discussion

The genes analyzed in our study can be grouped into functional categories that include immuno-modulation, pathogen response, inflammation, cell signaling, xenobiotic metabolizing enzymes and cellular stress response (see Table 1). Although transcription studies generally focus on genes that are differentially transcribed among groups, genes that show no difference among groups are also of importance. Of particular note in this study was the lack of statistical difference in gene transcription between the AP and clinically normal captive sea otters (see Table 2 and Figure 3).
The interpretation of the high similarity of wild-captured sea otters to documented clinically normal, healthy sea otters is that individuals in the AP subpopulation are healthy and are not subject to substantial hydrocarbon exposure, disease or food limitation. Transcript patterns from the KAT subpopulation of sea otters also were similar to those of the AP and captive populations (Figure 3). These interpretations are further supported by population status and trajectory data, indicating that both the KAT and AP populations of sea otters are below carrying capacity [44,45].
Two other groups with remarkably similar transcript patterns were CL and PWS2, both exhibiting relatively low levels of transcription in most genes examined. Relatively low levels of select gene transcripts have been described in mice experiencing a nutritional deficit [46]. Alternatively, low transcription may be the result of unbalanced physiological resource allocation. For example, immune defenses exist to impede infections, but other ecological demands (e.g., stressors related to nutrition, weather and predation) can supersede this, causing immune defenses to be compromised [47]. This interpretation is consistent with data on rates of energy recovery of various sea otter populations, indicating that food resources for sea otters at CL and in WPWS (2010, 2012) were limited, compared to other reference groups sampled in this study ([46,48]). The population status of stable or near carrying capacity for both CL and PWS2 [46,49] further supports the potential of limited nutritional resources in these groups.
Distinct transcript patterns also existed among groups and reflect the influence of environmental factors, potentially including food availability, contaminants, disease and predation. Within a group, there will also be behavioral differences (e.g., foraging patterns, home range) among sea otters that may contribute to variation in gene transcripts. For example, Bodkin et al. (2012) demonstrated marked differences among sea otters in the extent of intertidal foraging and, thus, potential exposure to lingering oil. Consequently, we expect that some sea otters in WPWS may have minimal exposure to lingering oil and transcript patterns that appear clinically normal. This is supported by some amount of overlap in transcript profiles, as noted in Figure 3.
Interestingly, transcriptional differences of sea otters from KOD and PWS1 compared to the other groups were evident, and transcription levels in sea otters from KOD, in particular, were high in relation to those of other groups. The PWS1 and KOD groups appeared to have immunological or physiological responses that indicated greater organic compound exposure relative to the other populations examined, but their profile motifs differed, suggesting unique environmental stressors at each site. Genomic profiling has successfully linked specific signatures to unique combinations of chemical contaminants in other species [50,51,52,53]. In fact, the transcription profile of the KOD otters is more consistent with that of a dioxin-induced profile, while the transcription profile of PWS1 otters (in particular, those from the area that received the heaviest shoreline oiling in 1989) is more consistent with a polycyclic aromatic hydrocarbon (PAH)-induced profile [27]. It is noteworthy that AHR transcription was highest at KOD, followed by PWS1, although the latter did not differ significantly from the other groups. Upregulation of AHR is indicative of current exposure to classes of environmental toxicants, including PAHs, polyhalogenated hydrocarbons, dibenzofurans and dioxin [28]. Chronic exposure to specific toxicants may not necessarily cause a sustained increase in AHR transcription [6,15], but can be associated with potential downstream consequences (e.g., modulation of T-regulatory (TREG) (immune-suppressive) or T-helper type 17 (TH17) (pro-inflammatory) immunologic activity [29,39]); however, T-regulatory cell activity was not specifically analyzed in this study. The transcript profile in PWS1 sea otters appears consistent with findings from Bodkin et al. (2012) [7] indicating that foraging sea otters in WPWS during that time period were subject to ongoing, potentially intermittent, exposure to lingering oil in the environment. Further, sea otters from the spill area in WPWS in 2008 demonstrated elevated transcription of several genes, including HDC and THRβ, and downregulation of the DRB gene; a similar pattern for these three genes was seen at KOD. Dong et al. (1997) [54] reported downregulation of DRB by a dioxin compound, and both polycyclic aromatic hydrocarbons (constituents of crude oil) and dioxin-like compounds have been implicated in physiologic detoxification responses.
In summary, gene transcript profiles suggest that in 2008, sea otters in WPWS were still subject to lingering oil exposure. This finding was consistent with studies that quantified oil encounter rates by foraging sea otters in WPWS ranging from 2–24 times per year and documented the presence of PAHs in sea otter forage pits prior to 2009 [7]. Interpretation of the 2012 gene transcription profiles of WPWS sea otters is complicated by general low levels of transcription. The low transcript levels seen in WPWS (2010, 2012) and in CL sea otters could be consistent with an inability to mount effective responses to pathogens, contaminants, injury or other stressors when compared to earlier time intervals or other groups. In effect, the overall dampening of the molecular response precludes determination of whether or not WPWS sea otters showed a continued response to lingering oil in 2010–2012.
However, several studies on sea otter demographics indicated that by 2012, the WPWS sea otter population had returned to pre-spill conditions. While sea otter abundance at the scale of WPWS had demonstrated modest increases since 1993, areas most severely impacted by oil-related mortality did not return to pre-spill numbers until 2011 [8]. The numerical recovery of sea otters was supported by improved survival of sea otters after 2009, with a return to rates observed prior to the spill [4,8,55]. The findings for sea otters related to diminished oil exposure and population recovery were consistent with related findings for sea ducks. Prior to 2009, data indicated continued exposure to two species of nearshore sea ducks, with diminished exposure to oil evident in Barrows goldeneye by 2010 [3] and Harlequin ducks by 2013 [56]. An expanded study of the broader sea otter transcriptome would further the identification of environmental stressors responsible for the overall low levels of gene transcripts observed in WPWS in 2010 and 2012.

Acknowledgments

This research was funded in part by the Exxon Valdez Oil Spill Trustee Council; however, the findings and conclusions do not necessarily reflect the views or position of the Trustee Council. Funding was also provided by the U.S. Geological Survey (USGS) Western Ecological Research Center and the USGS Alaska Science Center. We gratefully acknowledge the assistance of Heather Coletti, George Esslinger, KimKloecker, Daniel Monson, Ben Weitzman and Joe Tomoleoni, USGS, and Michael Murray and Marissa Viens, Monterey Bay Aquarium, for sample collections. We thank Robin Keister for laboratory assistance. Samples were collected under permits authorized by the U.S. Fish and Wildlife Service and the approval of the Animal Care and Use Committee of the USGS Alaska Science Center. Any use of trade, firm or product names is for descriptive purposes only and does not imply endorsement by the U.S. Government.

Author Contributions

All authors contributed equally to the project.

Conflicts of Interest

The authors declare no conflict of interest.

References

  1. Bodkin, J.L.; Esler, D.; Rice, S.D.; Matkin, C.O.; Ballachey, B.E. The effects of spilled oil on coastal ecosystems: Lessons from the Exxon Valdez spill. In Coastal Conservation; Maslo, B., Lockwood, J.L., Eds.; Cambridge University Press: New York, NY, USA, 2014; pp. 311–346. [Google Scholar]
  2. Esler, D.; Trust, K.A.; Ballachey, B.E.; Iverson, S.A.; Lewis, T.L.; Rizzolo, D.J.; Mulcahy, D.M.; Miles, A.K.; Woodin, B.R.; Stegeman, J.J.; et al. Cytochrome P4501 A biomarker indication of oil exposure in harlequin ducks up to 20 years after the Exxon Valdez oil spill. Environ. Toxicol. Chem. 2010, 29, 1138–1145. [Google Scholar] [PubMed]
  3. Esler, D.; Ballachey, B.E.; Trust, K.A.; Iverson, S.A.; Reed, J.A.; Miles, A.K.; Henderson, J.D.; Woodin, B.R.; Statesman, J.J.; McAdie, M.; et al. Cytochrome P4501 A biomarker indication of the timeline of chronic exposure of Barrow’s goldeneyes to residual Exxon Valdez oil. Mar. Pollut. Bull. 2011, 62, 609–614. [Google Scholar] [CrossRef] [PubMed]
  4. Monson, D.H.; Doak, D.F.; Ballachey, B.E.; Bodkin, J.L. Could residual oil from the Exxon Valdez spill create a long-term population ‘sink’ for sea otters in Alaska? Ecol. Appl. 2011, 21, 2917–2932. [Google Scholar] [CrossRef]
  5. Bowen, L.; Miles, A.K.; Murray, M.; Haulena, M.; Tuttle, J.; Van Bonn, W.; Adams, L.; Bodkin, J.L.; Ballachey, B.E.; Estes, J.A.; et al. Gene transcription in sea otters (Enhydra. lutris); emerging diagnostics in marine mammal and ecosystem health. Mol. Ecol. Resour. 2012, 12, 67–74. [Google Scholar] [CrossRef] [PubMed]
  6. Miles, A.K.; Bowen, L.; Ballachey, B.E.; Bodkin, J.L.; Murray, M.; Estes, J.L.; Keister, R.A.; Stott, J.L. Variation in transcript profiles in sea otters (Enhydra lutris) from Prince William Sound, Alaska and clinically normal reference otters. Mar. Ecol. Prog. Ser. 2012, 451, 201–212. [Google Scholar] [CrossRef]
  7. Bodkin, J.L.; Ballachey, B.E.; Coletti, H.A.; Esslinger, G.G.; Kloecker, K.A.; Rice, S.D.; Reed, J.A.; Monson, D.H. Long-term effects of the Exxon Valdez oil spill—Sea otter foraging in the intertidal as a pathway of exposure to lingering oil. Mar. Ecol. Prog. Ser. 2012, 447, 273–287. [Google Scholar] [CrossRef]
  8. Ballachey, B.E.; Monson, D.H.; Esslinger, G.G.; Kloecker, K.; Bodkin, J.; Bowen, L.; Miles, A.K. 2013 Update on Sea Otter Studies to Assess Recovery from the 1989 Exxon Valdez Oil Spill, Prince William Sound, Alaska: U.S. Geological Survey Open-File Report 2014–1030, 40p. Available online: http://dx.doi.org/10.3133/ofr20141030 (accessed on 20 May 2016).
  9. Ballachey, B.E.; Bodkin, J.L.; Esler, D.; Rice, S.D. Lessons from the 1989 Exxon Valdez oil spill: A biological perspective. In Impacts of Oil Spill Disasters on Marine Habitats and Fisheries in North America; Alford, J.B., Peterson, M.S., Green, C.C., Eds.; CRC Press: Boca Raton, FL, USA, 2014; pp. 181–198. [Google Scholar]
  10. Harwell, M.A.; Gentile, J.H.; Johnson, C.B.; Garshelis, D.L.; Parker, K.R. A Quantitative Ecological Risk Assessment of the Toxicological Risks from Exxon Valdez Subsurface Oil Residues to Sea Otters at Northern Knight Island, Prince William Sound, Alaska. Hum. Ecol. Risk Assess. 2010, 16, 727–761. [Google Scholar] [CrossRef] [PubMed]
  11. Ballachey, B.E.; Bodkin, J.L.; Monson, D.H. Quantifying long-term risks to sea otters from the 1989 ‘Exxon Valdez’ oil spill: Reply to Harwell and Gentile (2013). Mar. Ecol. Prog. Ser. 2013, 480, 297–301. [Google Scholar] [CrossRef]
  12. Harwell, M.A.; Gentile, J.H. Assessing risks to sea otters and the Exxon Valdez oil spill: New scenarios, attributable risk, and recovery. Hum. Ecol. Risk Assess. 2014, 20, 889–916. [Google Scholar] [CrossRef] [PubMed]
  13. Peterson, C.H.; Rice, S.D.; Short, J.W.; Esler, D.; Bodkin, J.L.; Ballachey, B.E.; Irons, D.B. Long-term ecosystem response to the Exxon Valdez oil spill. Science 2003, 302, 2082–2086. [Google Scholar] [CrossRef] [PubMed]
  14. Farr, S.; Dunn, R.T. Concise review: Gene expression applied to toxicology. Toxicol. Sci. 1999, 50, 1–9. [Google Scholar] [CrossRef] [PubMed]
  15. McLoughlin, K.; Turteltaub, K.; Bankaitis-Davis, D.; Gerren, R.; Siconolfi, L.; Storm, K.; Cheronis, J.; Trollinger, D.; Macejak, D.; Tryon, V.; et al. Limited dynamic range of immune response gene expression observed in healthy blood donors using RT-PCR. J. Mol. Med. 2006, 12, 185–195. [Google Scholar]
  16. Poynton, H.C.; Vulpe, C.D. Ecotoxicogenomics: Emerging technologies for emerging contaminants. J. Am. Water Resour. Assoc. 2009, 45, 83–96. [Google Scholar] [CrossRef]
  17. Monson, D.H.; McCormick, C.; Ballachey, B.E. Chemical anesthesia of northern sea otters (Enhydra lutris)—Results of past field studies. J. Zoo Wildl. Med. 2001, 32, 181–189. [Google Scholar] [PubMed]
  18. Bowen, L.; Schwartz, J.; Aldridge, B.; Riva, F.; Miles, A.K.; Mohr, F.C.; Stott, J.L. Differential gene expression induced by exposure of captive mink to fuel oil—A model for the sea otter. EcoHealth 2007, 4, 298–309. [Google Scholar] [CrossRef]
  19. Bommer, U.A.; Thiele, B.J. The translationally controlled tumour protein (TCTP). Int. J. Biochem. Cell Biol. 2004, 36, 379–385. [Google Scholar] [CrossRef]
  20. Tuynder, M.; Fiucci, G.; Prieur, S.; Lespagnol, A.; Geant, A.; Beaucourt, S.; Duflaut, D.; Besse, S.; Susini, L.; Cavarelli, J.; et al. Translationally controlled tumor protein is a target of tumor reversion. Proc. Natl. Acad. Sci. USA 2004, 101, 15364–15369. [Google Scholar] [CrossRef] [PubMed]
  21. Ma, Q.; Geng, Y.; Xu, W.; Wu, Y.; He, F.; Shu, W.; Huang, M.; Du, H.; Li, M. The role of translationally controlled tumor protein in tumor growth and metastasis of colon adenocarcinoma cells. J. Proteome Res. 2010, 9, 40–49. [Google Scholar] [CrossRef] [PubMed]
  22. Raisuddin, S.; Kwok, K.W.H.; Leung, K.M.Y.; Schlenk, D.; Lee, J. The copepod Tigriopus—A promising marine model organism for ecotoxicology and environmental genomics. Aquat. Toxicol. 2007, 83, 161–173. [Google Scholar] [CrossRef] [PubMed]
  23. Zheng, S.; Song, Y.; Qiu, X.; Sun, T.; Ackland, M.L.; Zhang, W. Annetocin and TCTP expressions in the earthworm Eisenia fetida exposed to PAHs in artificial soil. Ecotoxicol. Environ. Saf. 2008, 71, 566–573. [Google Scholar] [CrossRef] [PubMed]
  24. Goldsby, R.A.; Kindt, T.J.; Osborne, B.A.; Kuby, J. Immunology, 5th ed.; W.H. Freeman and Company: New York, NY, USA, 2003. [Google Scholar]
  25. Harris, S.G.; Padilla, J.; Koumas, L.; Ray, D.; Phipps, R.P. Prostaglandins as modulators of immunity. Trends Immunol. 2002, 23, 144–150. [Google Scholar] [CrossRef]
  26. Jenne, D.E.; Tschopp, J. Molecular structure and functional characterization of a human complement cytolysis inhibitor found in blood and seminal plasma—Identity to sulfated glycoprotein 2, a constituent of rat testis fluid. Proc. Natl. Acad. Sci. USA 1989, 86, 7123–7127. [Google Scholar] [CrossRef] [PubMed]
  27. Zeytun, A.; McKallip, R.J.; Fisher, M.; Camacho, I.; Nagarkatti, M.; Nagarkatti, P.S. Analysis of 2,3,7,8-tetrachlorodibenzo-p-dioxin-induced gene expression profile in vivo using pathway-specific cDNA arrays. Toxicology 2002, 23, 241–260. [Google Scholar] [CrossRef]
  28. Oesch-Bartlomowicz, B.; Huelster, A.; Wiss, O.; Antoniou-Lipfert, P.; Dietrich, C.; Arand, M.; Weiss, C.; Bockamp, E.; Oesch, F. Aryl hydrocarbon receptor activation by cAMP vs. dioxin: Divergent signaling pathways. Proc. Natl. Acad. Sci. USA 2005, 102, 9218–9223. [Google Scholar] [CrossRef] [PubMed]
  29. Quintana, F.J.; Basso, A.S.; Iglesias, A.H.; Korn, T.; Farez, M.F.; Bettelli, E.; Caccamo, M.; Oukka, M.; Weiner, H.L. Control of T(reg) and T(H)17 cell differentiation by the aryl hydrocarbon receptor. Nature 2008, 453, 6–7. [Google Scholar] [CrossRef] [PubMed]
  30. Tabuchi, M.; Veldhoen, N.; Dangerfield, N.; Jeffries, S.; Helbing, C.C.; Ross, P.S. PCB-related alteration of thyroid hormones and thyroid hormone receptor gene expression in free-ranging harbor seals (Phoca vitulina). Environ. Health Perspect. 2006, 114, 1024–1031. [Google Scholar] [CrossRef] [PubMed]
  31. Tsai, M.J.; O’Malley, B.W. Molecular mechanisms of action of steroid/thyroid receptor superfamily members. Annu. Rev. Biochem. 1994, 63, 451–486. [Google Scholar] [CrossRef] [PubMed]
  32. Iwama, G.K.; Mathilakath, M.V.; Forsyth, R.B.; Ackerman, P.A. Heat shock proteins and physiological stress in fish. Am. Zool. 1999, 39, 901–909. [Google Scholar] [CrossRef]
  33. Tsan, M.; Gao, B. Cytokine function of heat shock proteins. Am. J. Physiol. Cell Physiol. 2004, 286, 739–744. [Google Scholar] [CrossRef] [PubMed]
  34. Krumm, B.; Meng, X.; Li, Y.; Xiang, Y.; Deng, J. Structural basis for antagonism of Human interleukin 18 by poxvirus interleukin 18-binding protein. Proc. Natl. Acad. Sci. USA 2008, 105, 20711–20715. [Google Scholar] [CrossRef] [PubMed]
  35. Beineke, A.; Siebert, U.; Muller, G.; Baumgartner, W. Increased blood interleukin-10 mRNA levels in diseased free-ranging harbor porpoises (Phocoena phocoena). Vet. Immunol. Immunopathol. 2007, 115, 100–106. [Google Scholar] [CrossRef] [PubMed]
  36. Rigopoulou, E.I.; Abbott, W.G.; Haigh, P.; Naoumov, N.V. Blocking of interleukin-10 receptor-a novel approach to stimulate T-helper cell type 1 responses to hepatitis C virus. Clin. Immunol. 2005, 117, 57–64. [Google Scholar] [CrossRef] [PubMed]
  37. Bowen, L.; Aldridge, B.; Miles, A.K.; Stott, J.L. Expressed MHC class II genes in sea otters (Enhydra lutris) from geographically disparate populations. Tissue Antigens 2006, 67, 402–408. [Google Scholar] [CrossRef] [PubMed]
  38. Wegner, K.M.; Kalbe, M.; Rauch, G.; Kurtz, J.; Schaschl, H.; Reusch, T.B.H. Genetic variation in MHC class II expression and interactions with MHC sequence polymorphism in three-spined sticklebacks. Mol. Ecol. 2006, 15, 1153–1164. [Google Scholar] [CrossRef] [PubMed]
  39. Veldhoen, M.; Hirota, K.; Westendorf, A.M.; Buer, J.; Dumoutier, L.; Renauld, J.C.; Stockinger, B. The aryl hydrocarbon receptor links TH17-cell-mediated autoimmunity to environmental toxins. Nature 2008, 453, 106–109. [Google Scholar] [CrossRef] [PubMed]
  40. Tumpey, T.M.; Szretter, K.J.; Van Hoeven, N.; Katz, J.M.; Kochs, G.; Haller, O.; Garcia-Sister, A.; Staeheli, P. The Mx1 gene protects mice against the pandemic 1918 and highly lethal human H5 N1 influenza viruses. J. Virol. 2007, 81, 10818–10821. [Google Scholar] [CrossRef] [PubMed]
  41. Kibenge, M.J.T.; Munir, K.; Kibenge, F.S.B. Constitutive expression of Atlantic salmon Mx1 protein in CHSE-214 cells confers resistance to infectious salmon Anaemia virus. J. Virol. 2005, 2, 75. [Google Scholar] [CrossRef] [PubMed] [Green Version]
  42. R Development Core Team. R: A Language and Environment for Statistical Computing; ISBN 3-900051-07-0. R Foundation for Statistical Computing: Vienna, Austria, 2012; Available online: http://www.R-project.org/ (accessed on 20 May 2016).
  43. Monson, D.H.; Doak, B.E.; Johnson, A.; Bodkin, J.L. Long-term impact of the Exxon Valdez oil spill on sea otters, assessed through age-dependent mortality patterns. Proc. Natl. Acad. Sci. USA 2000, 97, 6562–6567. [Google Scholar] [CrossRef] [PubMed]
  44. U.S. Fish and Wildlife Service. Northern Sea Otter (Enhydra lutris kenyoni) Southwest Alaska Stock Report; U.S. Fish and Wildlife Service: Anchorage, AK, USA, 2014. [Google Scholar]
  45. Coletti, H.A.; Bodkin, J.L.; Monson, D.H.; Dean, T.A.; Ballachey, B.E. Engaging form and function to detect and infer cause of change in an Alaska marine ecosystem. Ecosphere 2016. submitted. [Google Scholar]
  46. Saucillo, D.C.; Gerriets, V.A.; Sheng, J.; Rathmell, J.C.; MacIver, N.J. Leptin metabolically licenses T cells for activation to link nutrition and immunity. J. Immunol. 2014, 192, 136–144. [Google Scholar] [CrossRef] [PubMed]
  47. Martin, L.B.; Hopkins, W.A.; Mydlarz, L.D.; Rohr, J.R. The effects of anthropogenic global changes on immune functions and disease resistance. Ann. N. Y. Acad. Sci. 2010, 1195, 129–148. [Google Scholar] [CrossRef] [PubMed]
  48. Bodkin, J.L.; U.S. Geological Survey, Port Townsend, WA, USA. Unpublished work. 2016.
  49. Estes, J.A.; Tinker, M.T.; Williams, T.M.; Doak, D.F. Killer whale predation on sea otters linking oceanic and nearshore ecosystems. Science 1998, 282, 473–476. [Google Scholar] [CrossRef] [PubMed]
  50. Menzel, R.; Swain, S.C.; Hoess, S.; Claus, E.; Menzel, S.; Steinberg, C.E.W.; Reifferscheid, G.; Sturzenbaum, S.R. Gene expression profiling to characterize sediment toxicity—A pilot study using Caenorhabditis elegans whole genome microarrays. BMC Genomics 2009, 10, 160. [Google Scholar] [CrossRef] [PubMed] [Green Version]
  51. Steinberg, C.E.; Sturzenbaum, S.R.; Menzel, R. Genes and environment—Striking the fine balance between sophisticated biomonitoring and true functional environmental genomics. Sci. Total Environ. 2008, 400, 142–161. [Google Scholar] [CrossRef] [PubMed]
  52. Yang, L.; Kemadjou, J.R.; Zinsmeister, C.; Bauer, M.; Legradi, J.; Muller, F.; Pankratz, M.; Jakel, J.; Strahle, U. Transcriptional profiling reveals barcode-like toxicogenomic responses in the zebrafish embryo. Genome Biol. 2007, 8, R227. [Google Scholar] [CrossRef] [PubMed]
  53. Poynton, H.C.; Zuzow, R.; Loguinov, A.V.; Perkins, E.J.; Vulpe, C.D. Gene expression profiling in Daphnia magna, Part II: Validation of a copper specific gene expression signature with effluent from two copper mines in California. Environ. Sci. Technol. 2008, 42, 6257–6263. [Google Scholar] [CrossRef] [PubMed]
  54. Dong, L.; Ma, Q.; Whitlock, J.P., Jr. Down-regulation of major histocompatibility complex Q1 b gene expression by 2,3,7,8-tetrachlorodibenzo-p-dioxin. J. Biol. Chem. 1997, 272, 29614–29619. [Google Scholar] [CrossRef] [PubMed]
  55. Ballachey, B.E.; Bodkin, J.L. Challenges to Sea Otter Recovery and Conservation. In Sea Otter Conservation; Larson, S.E., Bodkin, J.L., VanBlaricom, G.R., Eds.; Elsevier: London, UK, 2015; pp. 63–88. [Google Scholar]
  56. Bowen, L.; Miles, A.K.; Ballachey, B.E.; Esler, D. Long-term Monitoring Program—Evaluating Chronic Exposure of Harlequin Ducks and Sea Otters to Lingering Exxon Valdez Oil in Western Prince William Sound. In Exxon Valdez Oil Spill Trustee Council Restoration Project Final Report (Project 14120114-Q); U.S. Geological Survey, Alaska Science Center: Anchorage, AK, USA, 2014. [Google Scholar]
Figure 1. Map of sampling locations in Alaska, including Adak Island (Clam Lagoon, CL), the Alaska Peninsula (AP), Katmai National Park (KAT), Kodiak Island (KOD) and Prince William Sound (PWS1 and PWS2). Captive sampling locations are not shown.
Jmse 04 00039 g001
Figure 2. Multivariate, nonparametric, multi-dimensional scaling (NMDS) of gene transcription profiles (see Table 2) of sea otters captured in five different years (2006, 2007, 2008, 2010, 2012) in western Prince William Sound, Alaska, showing distinct separation of 2006–2008 samples from the 2010 and 2012 samples.
Jmse 04 00039 g002
Figure 3. Multivariate, nonparametric, multi-dimensional scaling (NMDS) with cluster analysis of gene transcription profiles (see Table 2) of sea otters sampled at the Alaska Peninsula (AP), Katmai (KAT), Kodiak (KOD), Clam Lagoon (CL), western Prince William Sound 2006, 2007 and 2008 (PWS1), western Prince William Sound 2010 and 2012 (PWS2) and clinically normal captive otters (CAP).
Jmse 04 00039 g003
Table 1. Documented function of 10 genes identified in free-ranging sea otters sampled at the Alaska Peninsula, Katmai, Kodiak, Clam Lagoon, Prince William Sound 2006–2008, Prince William Sound 1010–2012 and in clinically normal captive sea otters. Amplification efficiencies of all primer pairs were between 90% and 105%.
GeneGene Function
HDCThe HDCMB21P gene codes for a translationally-controlled tumor protein (TCTP) implicated in cell growth, cell cycle progression, malignant transformation, tumor progression and in the protection of cells against various stress conditions and apoptosis [19,20,21]. Environmental triggers may be responsible for population-based up-regulation of HDC. HDC transcription is known to increase with exposure to carcinogenic compounds, such as polycyclic aromatic hydrocarbons [18,22,23].
COX2Cyclooxygenase-2 catalyzes the production of prostaglandins that are responsible for promoting inflammation [24]. Cox2 is responsible for the conversion of arachidonic acid to prostaglandin H2, a lipoprotein critical to the promotion of inflammation [25]. Upregulation of Cox2 is indicative of cellular or tissue damage and an associated inflammatory response.
CYTThe complement cytolysis inhibitor protects against cell death [26]. Upregulation of CYT is indicative of cell or tissue death.
AHRThe aryl hydrocarbon receptor responds to classes of environmental toxicants, including polycyclic aromatic hydrocarbons, polyhalogenated hydrocarbons, dibenzofurans and dioxin [27]. Depending on the ligand, AHR signaling can modulate T-regulatory (TREG) (immune-suppressive) or T-helper type 17 (TH17) (pro-inflammatory) immunologic activity [28,29].
THRβThe thyroid hormone receptor beta can be used as a mechanistically-based means of characterizing the thyroid-toxic potential of complex contaminant mixtures [30]. Thus, increases in THRβ transcription may indicate exposure to organic compounds, including PCBs, and associated potential health effects, such as developmental abnormalities and neurotoxicity [30,31].
HSP 70The heat shock protein 70 is produced in response to thermal or other stress, including hyperthermia, oxygen radicals, heavy metals and ethanol [32,33].
IL-18Interleukin-18 is a pro-inflammatory cytokine [24]. IL-18 plays an important role in inflammation and host defense against microbes [34].
IL-10Interleukin-10 is an anti-inflammatory cytokine [24]. Levels of IL-10 have been correlated with the relative health of free-ranging harbor porpoises, e.g., increased amounts of IL-10 correlated with chronic disease, whereas the cytokine was relatively reduced in apparently fit animals experiencing acute disease [35]. Association of IL-10 transcription with chronic disease has also been documented in humans [36].
DRBA component of the major histocompatibility complex, the DRB class II gene is responsible for the binding and presentation of processed antigen to TH lymphocytes, thereby facilitating the initiation of an immune response [24,37]. Upregulation of MHC genes has been positively correlated with parasite load [37], whereas downregulation of MHC has been associated with contaminant exposure [38,39].
Mx1The Mx1 gene responds to viral infection [40]. Vertebrates have an early strong innate immune response against viral infection, characterized by the induction and secretion of cytokines that mediate an antiviral state, leading to the upregulation of the MX-1 gene [41].
Table 2. Geometric mean (normalized to the S9 housekeeping gene in each animal) cycle threshold (CT) transcription values (and 95% confidence intervals) for targeted genes (see Table 1) in sea otters sampled at the Alaska Peninsula (AP), Katmai (KAT), Kodiak (KOD), Clam Lagoon (CL), Prince William Sound 2006–2008 (PWS1), Prince William Sound 2010–2012 (PWS2) and clinically normal captive otters (CAP). Letter (a,b,c,d) differences denote significant differences among populations (Kruskal–Wallis with Dunns’ multiple comparison); lack of a letter (a,b,c,d) denotes no significant difference from any other group. Note that the smaller the mean value, the higher thelevel of transcription.
GroupGene
HDCCOX2CYTAHRTHRβHSP70IL18IL10DRBMX1
CAP5.90 ad (5.02–6.94)6.78 abcd (6.02–7.64)2.41 (1.91–3.04)11.01 abe (10.56–11.48)13.30 a (12.49–14.56)9.62 ab (8.74–10.59)1.65 acde (1.05–2.60)13.70 a (13.01–14.44)−0.33 (−0.86–0.21)10.99 ab (9.95–12.15)
AP6.26 a (5.47–7.16)6.60 abcd (5.92–7.36)1.90 (1.45–2.52)10.67 ab (9.94–11.46)13.32 a (12.19–14.56)8.58 abd (7.97–9.23)1.68 acde (1.30–2.17)13.21 a (12.21–14.30)−0.91 a (−1.57–−0.26)12.61 a (11.42–13.93)
KAT4.54 ab (4.06–5.08)7.68 bd (7.10–8.30)1.96 (1.54–2.50)10.36 ab (9.79–10.96)12.53 a (11.86–13.23)8.26 abd (7.56–9.04)2.78 ce (2.15–3.59)13.45 a (12.62–14.33)−0.56 a (−1.09–−0.03)12.56 a (11.99–13.16)
KOD−1.84 e (−2.33–−1.35)5.44 c (4.79–6.16)2.59 (2.04–3.28)8.80 d (8.09–9.57)9.50 c (8.62–10.46)5.48 d (4.86–6.18)5.19 b (4.61–5.85)9.03 c (8.26–9.87)1.29 (0.78–2.13)8.26 b (7.64–8.92)
CL10.30 c (10.06–10.54)9.45 e (8.91–10.02)1.53 (1.28–1.83)12.78 c (12.38–13.18)16.85 b (15.83–17.93)14.07 c (13.17–15.02)2.49 acde (2.06–3.01)22.09 b (20.85–23.40)0.43 b (0.22–0.84)16.89 c (15.36–18.57)
PWS14.01 bde (2.89–5.57)7.98 ad (7.60–8.38)1.88 (1.60–2.21)10.17 abd (9.75–10.62)11.35 ac (10.74–11.99)9.76 ab (9.17–10.39)1.60 d (1.24–2.07)13.34 a (12.77–13.94)1.08 b (0.80–1.44)10.41 b (10.05–10.78)
PWS28.94 c (8.46–9.46)9.30 e (8.96–9.65)1.62 (1.45–1.80)12.07 c (11.79–12.36)16.09 b (15.54–16.66)13.62 c (13.10–14.01)2.38 e (2.21–2.56)20.28 b (19.44–21.16)−0.071 (−0.25–0.10)14.95 c (14.50–15.41)

