Hydraulic Stability of the Armor Layer of Overtopped Breakwaters


Laboratory of Ports and Coasts, Institute of Transport and Territory, Universitat Politècnica de València, 46022 Valencia, Spain
*
Author to whom correspondence should be addressed.
J. Mar. Sci. Eng. 2018, 6(4), 143; https://doi.org/10.3390/jmse6040143
Submission received: 18 October 2018
/
Revised: 23 November 2018
/
Accepted: 23 November 2018
/
Published: 27 November 2018
(This article belongs to the Special Issue Selected Papers from Coastlab18 Conference)
Abstract
:Mound breakwaters with significant overtopping rates in depth-limited conditions are common in practice due to social concern about the visual impact of coastal structures and sea level rise due to climatic change. For overtopped mound breakwaters, the highest waves pass over the crest producing armor damage, not only to the front slope, but also to the crest and the rear slope. To guarantee the breakwater stability, it is necessary to limit the armor damage in the three parts of the structure: Front slope, crest, and rear slope. This paper describes the hydraulic stability of the armor layer of medium and low-crested structures in wave breaking conditions. Small-scale physical model tests were carried out with different relative crest freeboards and three armor units: Rocks, cubes, and Cubipods. The armor damage progression in the front slope, crest, and rear slope was analyzed using the Virtual Net method to consider the heterogeneous packing and porosity evolution along the armor slope. A comparison is provided between the hydraulic stability of the different armors and their relationship with the measured overtopping volumes.
1. Introduction
The crest height of a mound breakwater relative to the water level is defined as the crest freeboard, Rc (see EurOtop [1]). This parameter is one of the keys in the structural design as it affects the economic cost, the energy footprint, the overtopping hazards, and the visual impact. Growing social concern regarding the environmental and visual impacts associated with coastal structures and sea level rise due to climatic change is leading to a reduction in crest freeboards and an increase in overtopping hazards. Moreover, structures with a reduced freeboard are usually built in shallow water where the highest waves are depth limited (see Kramer and Burcharth [2]).
Medium and low-crested breakwaters are defined in this paper as emergent structures within the range 0.5 < Rc/Hs < 1 where Hs is the significant wave height. These types of structures are frequently overtopped by waves (see Burcharth et al. [3]), so wave energy is allowed to pass through or over the structure; consequently, the design of these structures must be different than a conventional type [2]. These overtopping events have a direct impact on the hydraulic stability of the crest and rear slope armors producing several armor damage in these parts of the structure because of the wave energy dissipation (see CIRIA [4]). Therefore, the hydraulic stability of the armor layer of the medium and low-crested structures may be higher on the front slope than for non-overtopped structures because some wave energy passes over the breakwater crest.
The armor layer of an overtopped structure can be divided in three parts (see Figure 1): Front slope (I), crest (II), and rear slope (III). This study focused on the analysis of the hydraulic stability of the armor layer in the three parts of a conventional medium and low-crested mound breakwater protected with three different armors: (1) Double-layer rocks, (2) double-layer randomly-placed cubes, and (3) single-layer Cubipods. A wide range of dimensionless freeboards, with and without overtopping events, were tested (0.3 < Rc/Hs < 2.6) in wave breaking conditions (Hs > 0.4 hs), where hs is the water depth at the toe of the structure. A total of 144 small-scale tests were carried out in the wave flume at the Laboratory of Ports and Coasts at the Universitat Politècnica de València (LPC-UPV). A detailed quantitative analysis was conducted using photographs to determine the armor damage progression in each part of the structure (front slope, crest, and rear slope).
2. Literature Review
2.1. Hydraulic Stability of the Armor Layer
While most mound breakwaters are constructed in the depth-limited zone, they are usually designed with empirical formulas based on small-scale tests of non-overtopped models in non-breaking conditions such as Hudson’s formula [5] or Van der Meer’s formula [6]. Armor design in wave breaking conditions involves estimating the incident characteristic wave height at the breakwater toe, but the standard stability formulas found in the literature have rarely taken into account the wave height distribution changes due to wave breaking. Some empirical modifications have been proposed by Herrera et al. [7] to estimate rock armor damage in breaking wave conditions. However, the hydraulic stability formula developed by Herrera et al. [7] is only valid for frontal slope armor with zero or low overtopping rates.
In the case of non-overtopped structures, waves mainly affect hydraulic stability on the front slope, while in the case of overtopped structures, waves do not only affect the hydraulic stability on the front slope, but also the stability of the crest and rear slope. The aim of this paper was to characterize the hydraulic stability of medium and low-crested structures subjected to frequent overtopping events in breaking wave conditions.
The hydraulic stability and performance of low-crested structures (Rc/Hs < 1) have been studied in European project DELOS (Environmental Design of Low Crested Coastal Defence Structures) and other research projects reported in the literature. Van der Meer and Daemen [8] compared the hydraulic stability of the armor layer of overtopped and non-overtopped rubble mound breakwaters, concluding that the required stone size for an overtopped rubble mound breakwater can be estimated by applying a reduction factor to the size calculated for a non-overtopped structure using the hydraulic stability formulas given in the literature. Vidal et al. [9] performed model tests with low-crested structures to analyze the different sections of the trunk in order to determine the distribution of damage. For the front armor slope, the results showed a linear relationship between the crest freeboard and the stability number, with lower hydraulic stability corresponding to the case of a non-overtopped rubble mound breakwater. For the armor on the crest, the hydraulic stability increases with the crest freeboard, and the opposite is true for the armor on the rear slope. Burger [10] re-analyzed existing tests and described the hydraulic stability to the initiation of damage of the front, crest, and rear slope, concluding that the damage to the front slope almost always determined the stability of the structure.
Vidal et al. [11] proposed the following hydraulic stability formula for rock-armored low-crested structures:
where is the non-dimensional crest freeboard; is the stability number; is the nominal diameter of the armor unit; is the armor unit mass corresponding to the Dn50; is the relative submerged mass density; is the mass density of the armor unit; is the mass density of the sea water; and Hs is the significant wave height. Coefficients A, B, and C depend on the section of the breakwater and the damage level as specified in Vidal et al. [11]; these coefficients are valid for the experimental range 2.01 < < 2.41. Kramer and Burcharth [2] calibrated coefficients A, B, and C from Equation (1), based on the least stable section of the structure. Vidal et al. [12] added additional data corresponding to low-crested structures by re-calibrating the coefficients A, B, and C from Equation (1) and formulating a stability formula to design rubble-mound breakwaters in the range −4 < < 4.
There have been numerous hydraulic stability studies for the frontal armor slope of non-overtopped structures. Low-crested rubble mound breakwaters with the crest near the still water level have also been well studied. However, the transitional zone between a non-overtopped structure and a low-crested mound breakwater has not been as well studied. In this research, experiments of overtopped structures with medium and low-crest freeboards were carried out to analyze the hydraulic stability in the three categories of the armor layer (frontal, crest, and rear slope) with three different armors (double-layer rock, cube, and single-layer Cubipod®) under wave breaking conditions.
2.2. Armor Damage Measurement
Different methods to characterize armor damage have been described in the literature [13]. The traditional visual counting method [12] assumes a constant porosity along the armor layer, so the heterogeneous packing (HeP) failure mode is not considered. The HeP, defined by Gómez-Martín and Medina [13], is an armor-damaging process without armor unit extractions, but with a reduction of the porosity in the lower area of the armor and a higher porosity in the upper area. The Virtual Net method developed by Gómez-Martín and Medina [13] considered armor unit extractions and changes in the porosity due to HeP. In this paper, the Virtual Net method was used to calculate the damage to single-layer Cubipod® armor, the double-layer rock, and to cube armors on the front slope, the crest, and the rear slope. The Virtual Net method divides the armor into individual strips with a constant width (a) and length (b), allowing for the measurements of the dimensionless damage in each strip, Si. Integrating Si over the slope, the equivalent dimensionless armor damage parameter, Se, is obtained. This method allows for measuring the armor layer porosity in time and space.
where is the number of rows in each strip; is the porosity of the strip; is the number of armor units whose center of gravity is within the strip; is the nominal diameter of the armor unit; is the initial porosity of each strip; and is the number of strips.
The criteria given by Losada et al. [14] and Vidal et al. [15] was followed for double-layer armors: Initiation of Damage (IDa) occurs when the upper armor layer loses some units and gaps in the size of an armor unit are visible. In the case of single-layer armors, the criterion defined by Gómez-Martín [16] was followed: IDa occurs when the upper armor layer has lost one or more units and gaps the size of an armor unit are visible in the armor. For qualitative analysis, only the first level of armor-damage (IDa) was considered in the study.
3. Experimental Methodology
Two-dimensional physical model tests were conducted in the wind and wave test facility (30 m × 1.2 m × 1.2 m) of the Laboratory of Ports and Coasts at the Universitat Politècnica de València (LPC-UPV), with a bottom slope m = 1/50. Figure 2 shows the longitudinal cross-section of the LPC-UPV wave flume.
Figure 3 shows the cross-section of the physical model, a low-crested conventional mound breakwater with armor slope cotα = 1.5 in the front slope and in the rear slope, and a toe berm to support them. Using the same core and filter layer, three armors were tested: Rocks (2-L), cubes (2-L), and Cubipods (1-L). A single-layer Cubipod® armor was tested with an initial packing density of Φ = 1 − p = 60%, and double-layer randomly placed rock and cube armors were tested with the initial packing density coefficients of Φ = 1 − p = 63% and 59%, respectively, where p is the armor porosity. A summary of the characteristics of the materials used in the physical models of this paper is presented in Table 1.
Tests with runs of 1000 irregular waves were generated following the JONSWAP (γ = 3.3) spectrum in deep water. The AWACS Active Wave Absorption System of the wavemaker was activated to avoid multi-reflections in the wave flume. Tests were grouped in a series of constant value of water depth at the toe berm, hs[cm] = 20, 25, and 30, and constant Iribarren’s number, three and five, where tan α = 2/3, Tp is the peak period and Hm0 is the spectral significant wave height, Hm0 = 4(m0)1/2. For each series, tests were run by increasing the Hm0 progressively in steps of 1 cm in the range 8 ≤ Hm0[cm] ≤ 24 from zero damage until severe damage occurred or the limit of use of the wavemaker was reached. Table 2 summarizes the test characteristics considering waves in the generating zone, where is the wave stepness, Nt is the number of tests, and Ntw is the total number of waves in the series.
Two groups of capacitive wave gauges were placed along the flume to measure the water elevation at different points. One group of five gauges (G1 to G5) was placed near the wavemaker and the other four gauges (G6 to G9) were installed at a distance of 2 hs, 3 hs, 4 hs, and 5 hs seaward from the structure toe. One wave gauge (G10) was placed on the crest of the structure, and the last one (G13) was placed behind the model to control the water level behind the structure (see Figure 2).
Wave gauges near the wavemaker were distanced to select the combination of gauges needed following the criterion given by Mansard and Funke [17], depending on the wave-length of the test. Using these selected gauges, incident and reflected waves were separated using the LASA-V method proposed by Figueres and Medina [18] allows the separation of non-linear and non-stationary waves. However, neither the LASA-V method, nor other existing methods, are reliable to separate incident and reflected waves in the breaking zone. For this reason, the methodology, validated by Herrera et al. [7], to estimate incident waves in breaking conditions was used. Considering the same bottom profile of the flume and wave characteristics in deep waters as in the physical experiments, numerical simulations using SwanOne software were carried out to estimate the incident wave parameters near the breakwater model. SwanOne is a 1D numerical model that is appropriate to estimate wave propagation and simulate the depth-induced breaking phenomena (see Verhagen et al. [19]). Virtual wave measurements were obtained in the same location as the gauges used in the physical test. To validate the methodology, the numerical SwanOne estimations were compared with measurements in the wave flume without any structure, assuming no reflections. Figure 4 shows the comparison between the incident spectral significant wave height, Hm0,i, measured without structure in the model zone and estimations given by SwanOne at the same point.
In order to measure the goodness of fit, the relative mean squared error, rMSE, was calculated.
where MSE is the mean squared error; Var is the variance of the observed values; N is the number of observations; oi is the observed value; ei is the estimated value; is the average of the observed values; and is the average of the estimated values. 0 ≤ rMSE ≤ 1 estimates the proportion of variance not explained by the model; the lower the rMSE, the better the estimations.
Due to the good results obtained, Hm0 estimated with SwanOne at a distance of three times the water depth seaward from the structure toe was used in this research to characterize incident waves and analyze armor damage in wave breaking conditions [7].
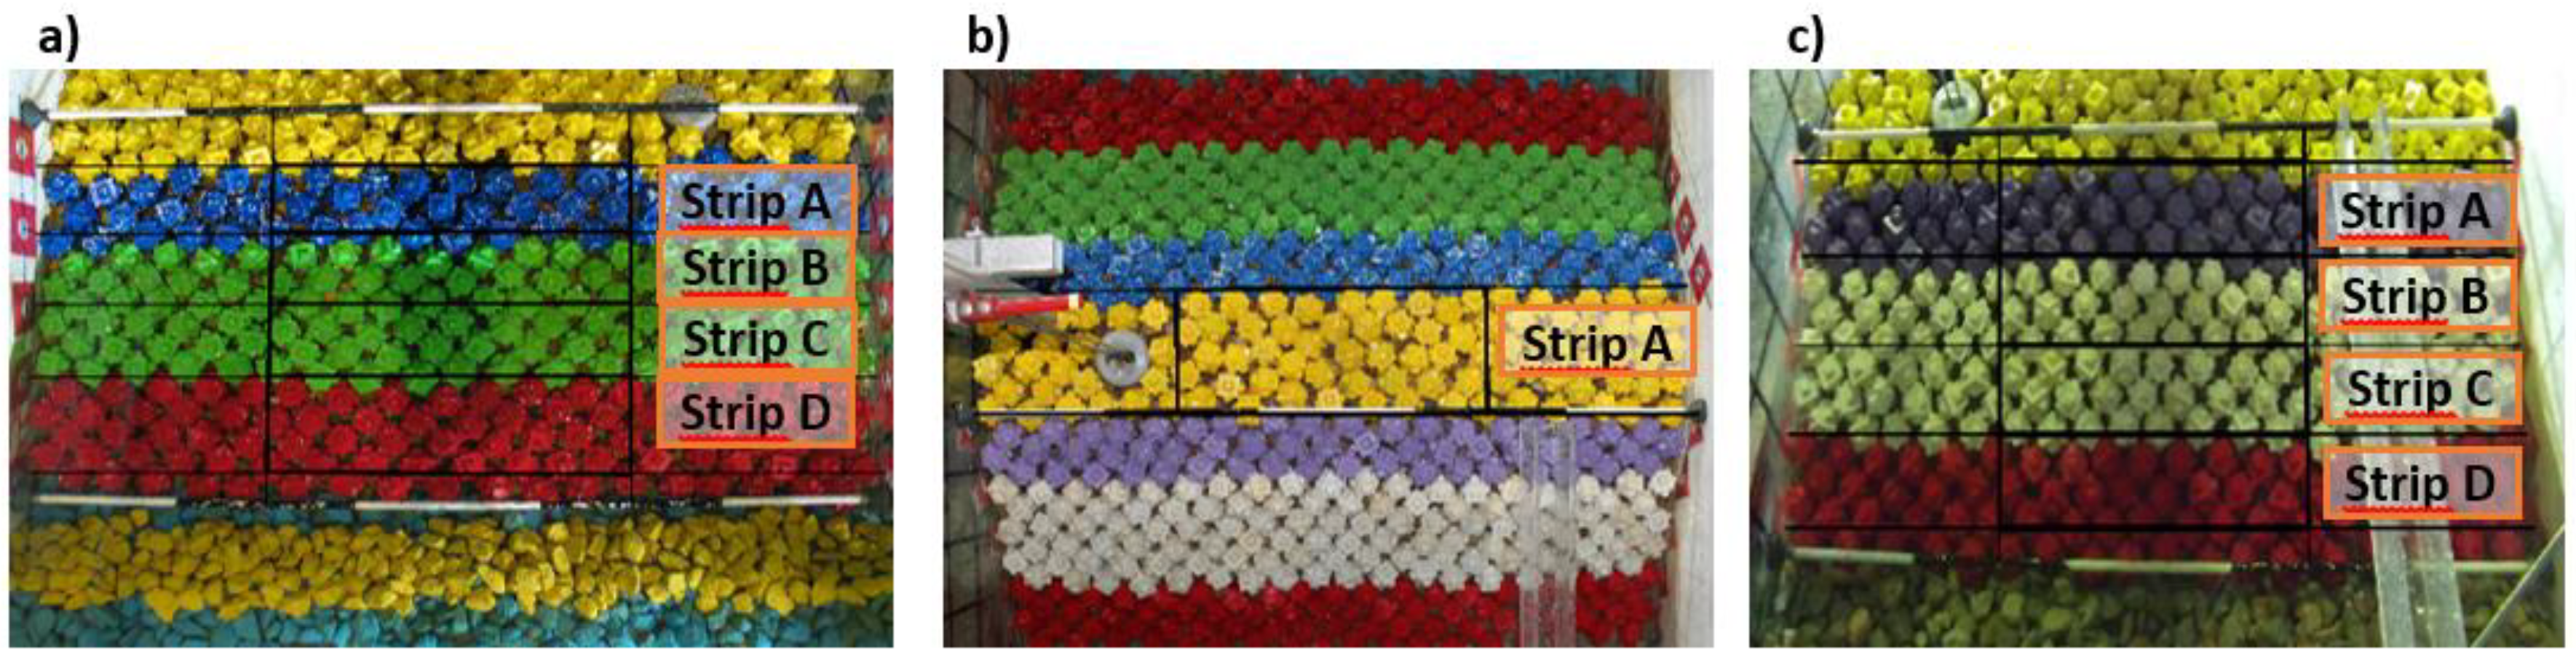
To measure armor damage, the Virtual Net method was used, taking photographs perpendicular to the front slope, crest, and rear slope armors before and after each test run. A virtual net was projected over each photograph, dividing the armor into individual strips. Three strips of 3Dn (strip A, B, and C) and one strip of 4Dn (strip D) were used on the front slope and four strips of 3Dn (strips A, B, C, and D) on the rear slope. For the crest armor, only one strip of 6Dn was considered. Dimensionless armor damage was calculated for each strip (Si); after integrating this dimensionless armor damage over the slope, the equivalent dimensionless armor damage (Se) was obtained. Figure 5 shows three photographs with the virtual net used for the single-layer Cubipod® armor during the experiments. Overtopping measurements were taken with a weighing instrument, which registered the overtopped volume in time. Mean overtopping rate, q[m3/s/m], was routinely calculated for each test.
4. Analysis of Hydraulic Stability Test Results
The stability number was used to characterize the hydraulic stability performance of the armor layers. For the wave height, Hm0, estimated by SwanOne at a distance of three times the water depth seaward from the structure toe, was used in this study to estimate the wave characteristics at the toe of the structure [7]. Three different armor layers were tested in this study: Double-layer rock and cube armors, and a single-layer Cubipod® armor.
4.1. Damage to Double-Layer Armors
Following Medina et al. [20], the failure function of double-layer rock armors follows a 5-power relationship with the stability number, so in this paper the failure function was represented with the linearized dimensionless armor damage (Se1/5).
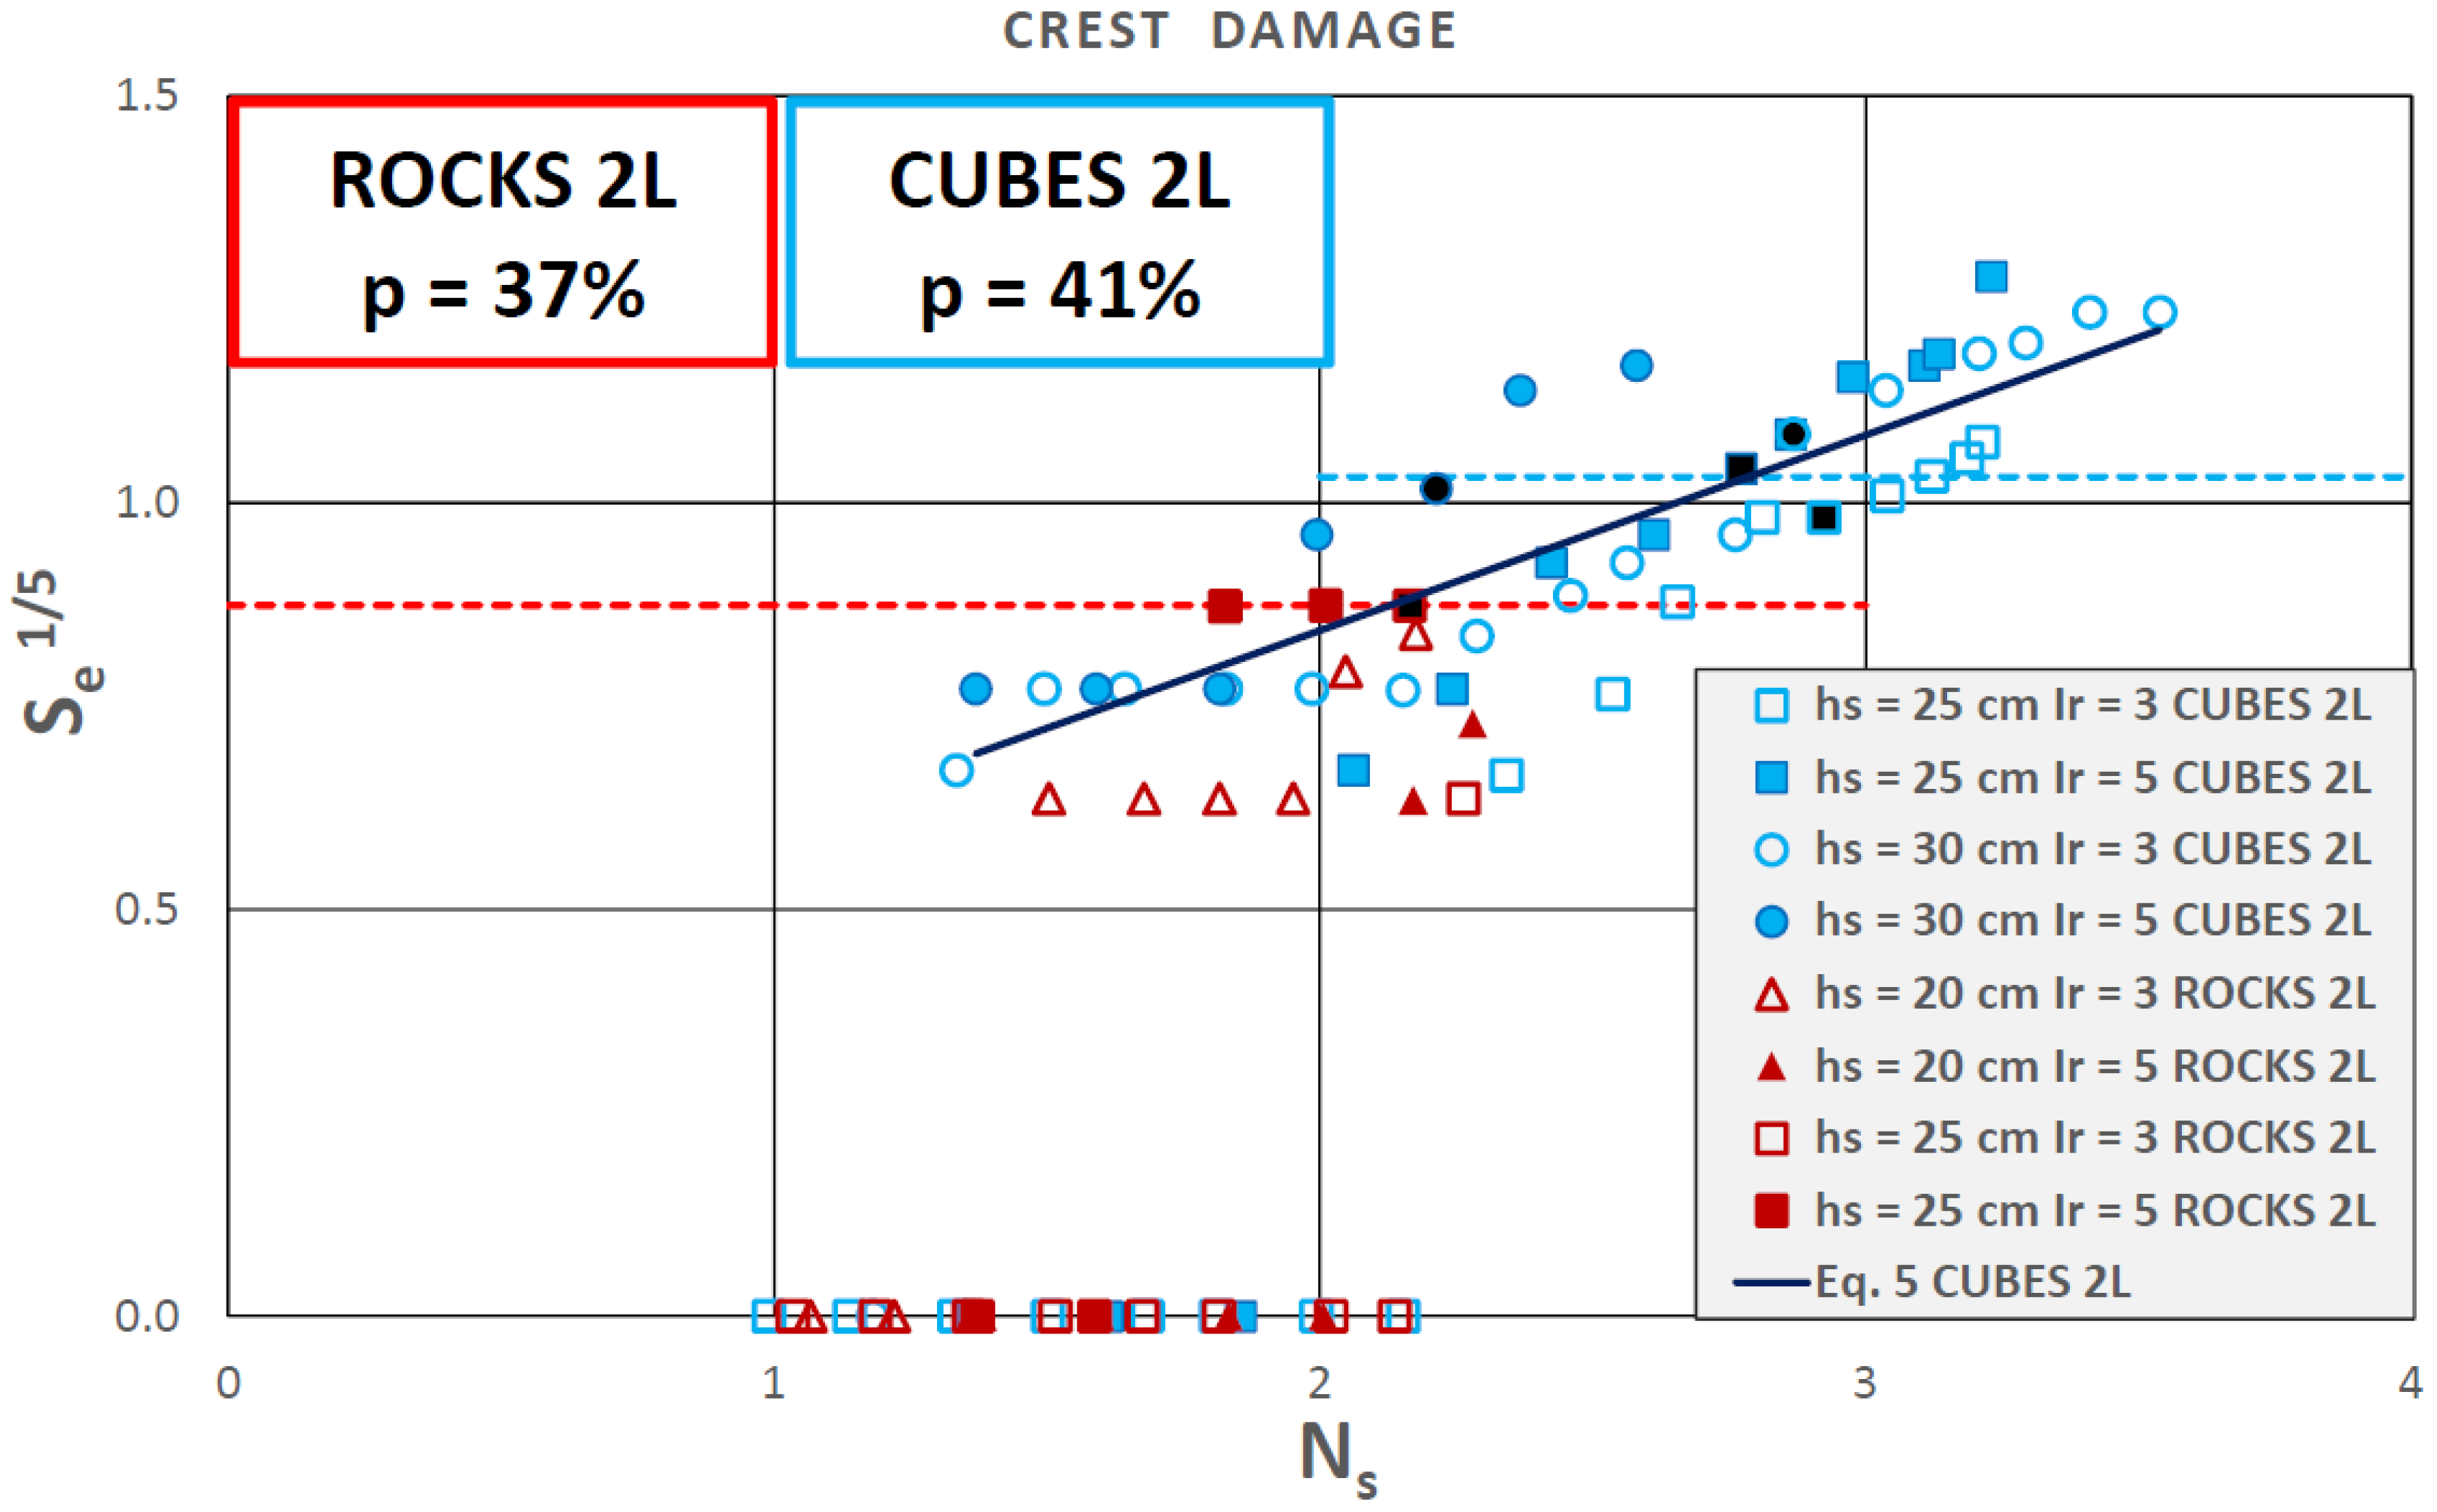
Figure 6, Figure 7 and Figure 8 show the linearized equivalent dimensionless armor damage observed during the experiments as a function of the stability number (Ns) for the front slope, crest, and rear slope of the double-layer rock and cube armors. Tests where the Initiation of Damage (IDa) was qualitatively observed are represented in black. Horizontal blue and red broken lines represent the average quantitative damage for IDa corresponding to rocks and cubes, respectively.
Figure 6 shows a higher hydraulic stability of cube armors compared to rock armors on the frontal slope. Using only tests with a minimum of equivalent dimensionless damage (Se > 0.25), a lineal model was developed to estimate armor damage following the expression:
where k1 and k2 are fitting parameters. Besides the rMSE, the correlation coefficient, r, was calculated to measure the goodness of fit.
Table 3 summarizes the results and shows the calibrated values k1 and k2 for Equation (5) and the rMSE and r values between the measured and estimated armor damage.
Figure 7 and Figure 8 also show a higher hydraulic stability of cubes than rocks for the crest and rear slope armors. Nevertheless, in these cases, the values of the rock armor damage obtained were lower due to the high damage that occurred in the front slope armor. For this reason, Equation (5) was only obtained for cube armors in the crest and rear slope.
Equation (5) estimates the equivalent dimensionless armor damage, Se, for the rocks and cubes armors in the corresponding breakwater sector, within the ranges summarized in Table 4.
4.2. Damage in Single-Layer Armors
The same methodology was used to represent the results of damage to single-layer Cubipod® armors. Figure 9, Figure 10 and Figure 11 show the linearized equivalent dimensionless armor damage measured on the front slope, crest, and rear slope of the breakwater. As observed, the hydraulic stability of single-layer Cubipod® armors was higher than for the double-layer cube or rock armors on the front slope, crest, and rear slope; IDa was not observed in any of the tests.
4.3. Armor Damage and Overtopping Events
In this paper, a wide range of dimensionless crest freeboards was tested (0.3 < Rc/Hs < 2.6), and the experiments indicated that the armor damage measured in each section of the structure was clearly related to the mean overtopping rate. Figure 12 shows the dimensionless overtopping rate, , as a function of the dimensionless crest freeboard. The test, where the IDa in the crest was qualitatively observed, is represented in black, while the orange test represents the IDa in the rear slope.
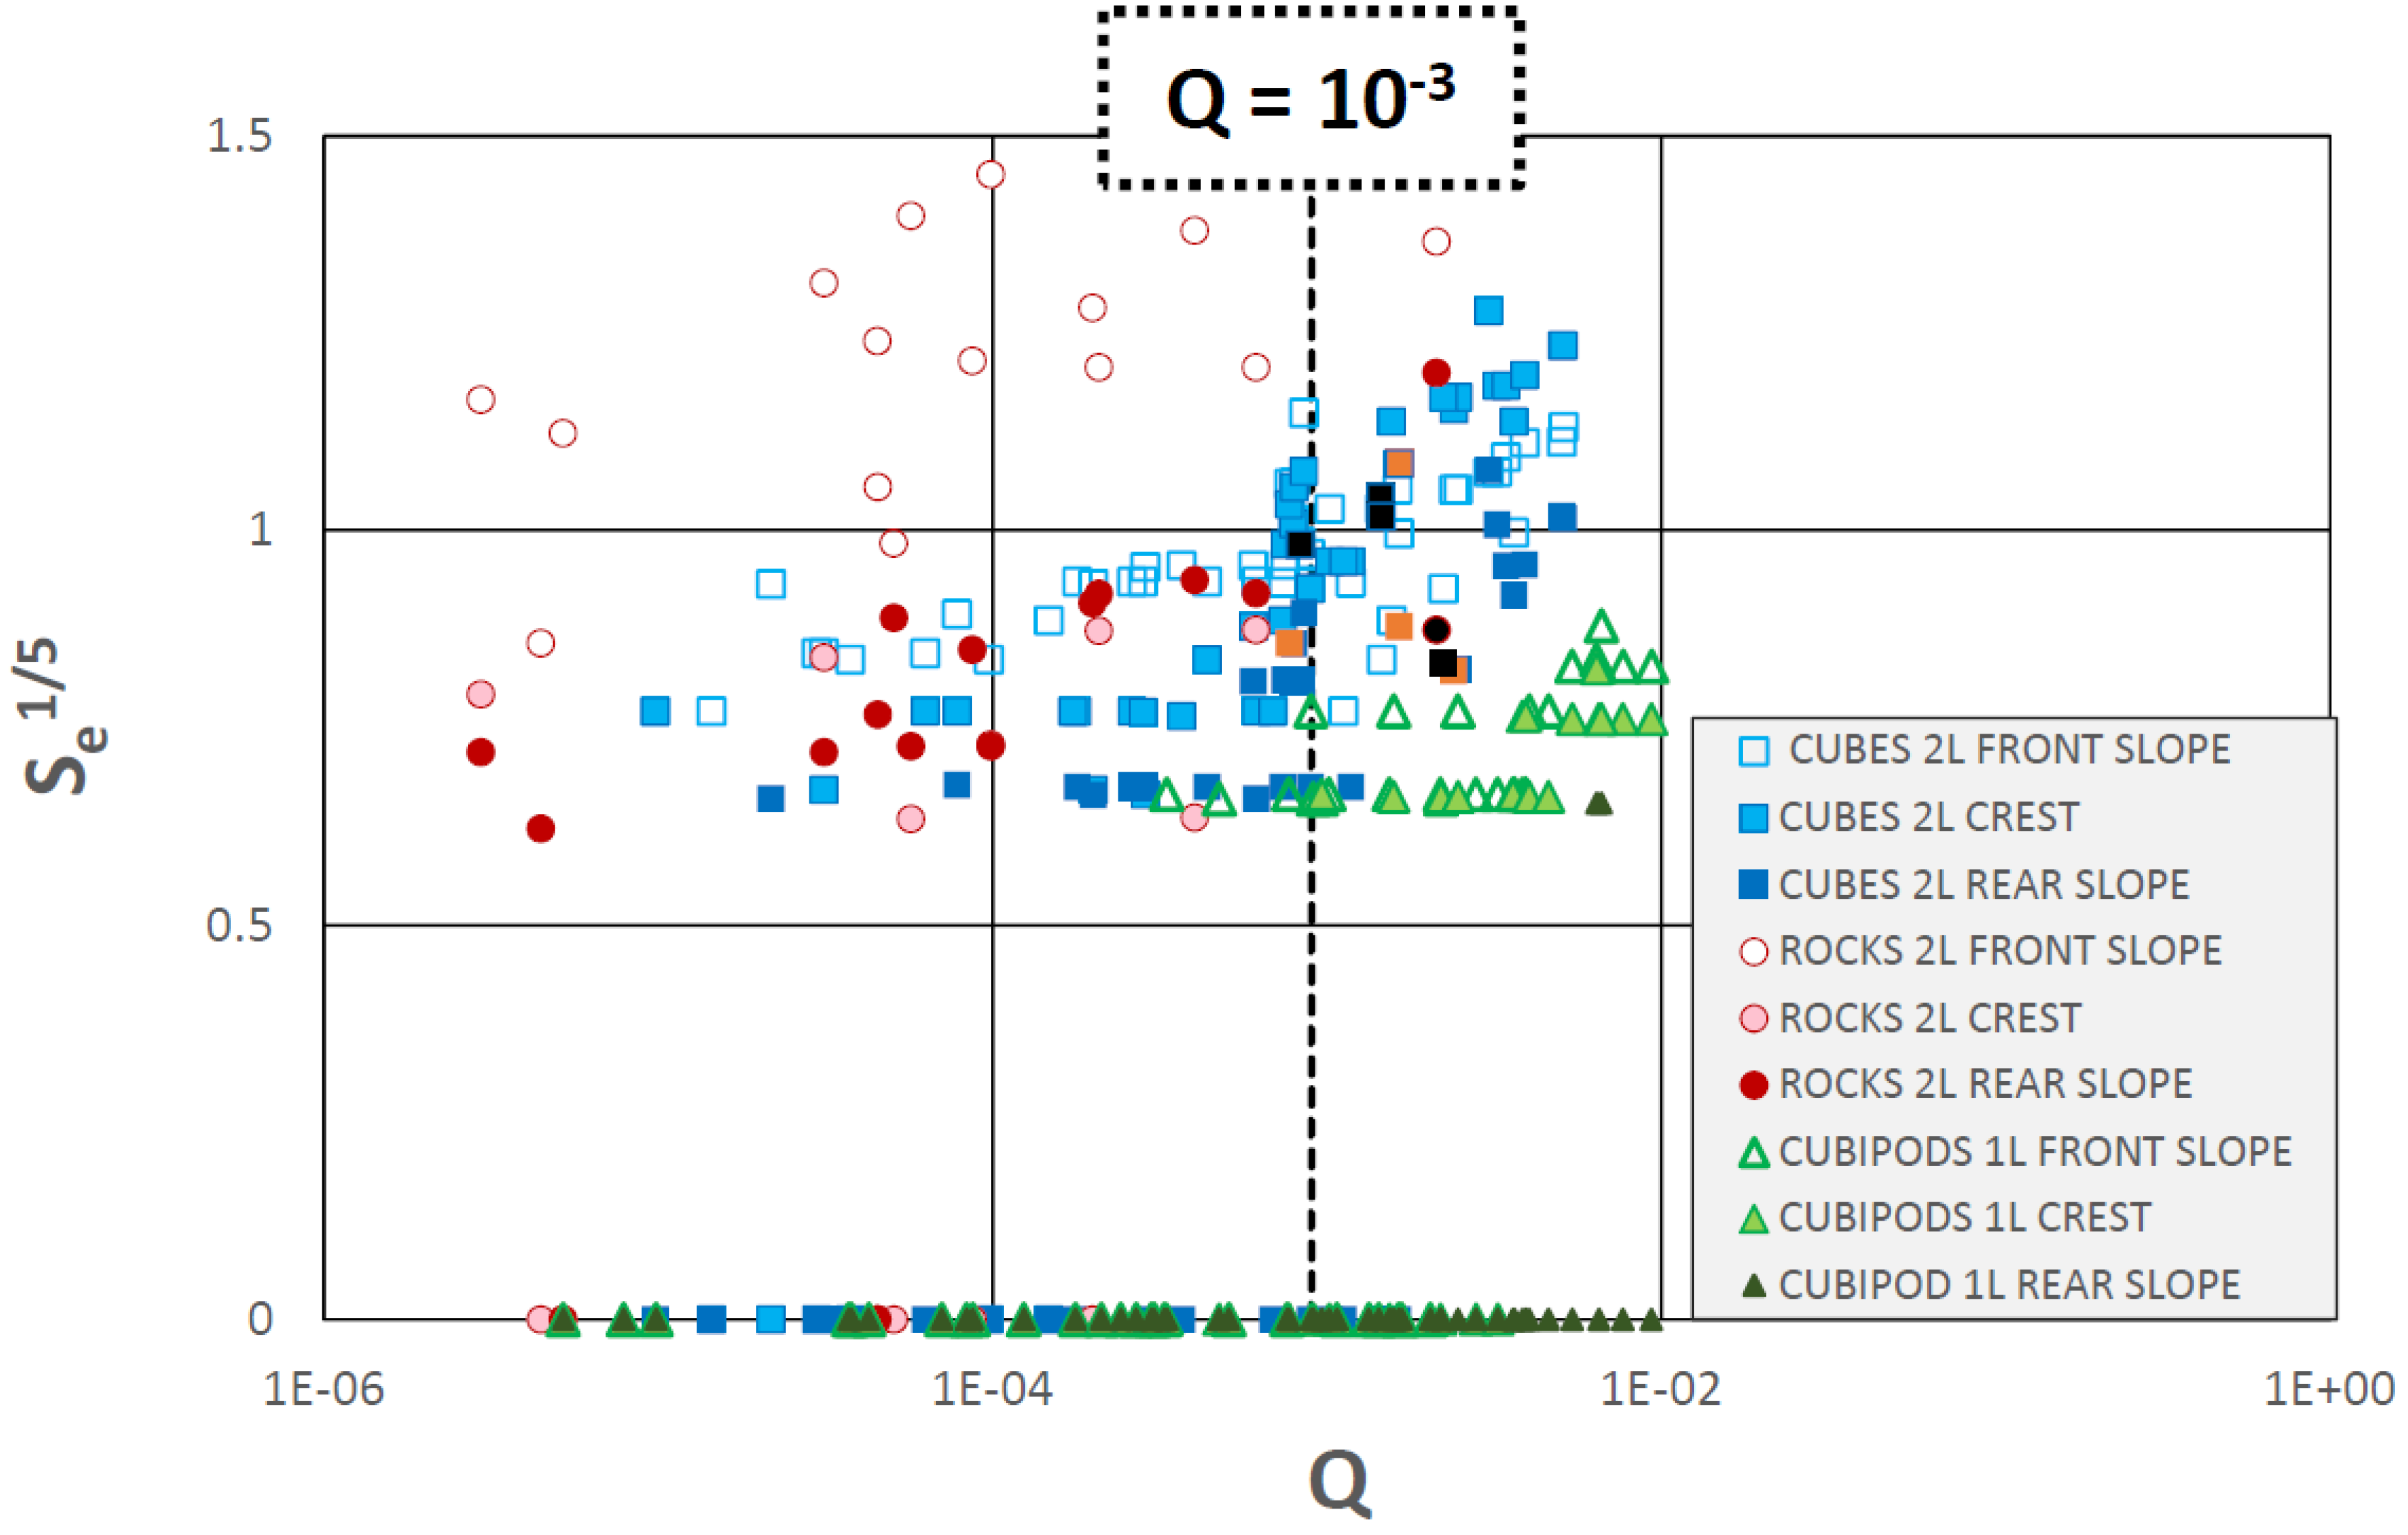
It was observed that the minimum value of Q from which the IDa was detected in the crest or rear slope for the double-layer armors was Q = 10−3. This means that tests with Q > 10−3 caused significant damage to the crest and rear slope, as was the case of the cube and rock armors with hs[cm] = 25 and Ir = 5. However, for Cubipod® armored breakwaters, although the threshold Q > 10−3 was exceeded, no significant damage (IDa) was observed in any part of the armor layer. Figure 13 shows the relation between the dimensionless armor damage and the dimensionless overtopping discharged. Test series with a low overtopping rate led to higher armor damage to the front slope, as almost all the energy must be dissipated by this part of the structure. In contrast, when the overtopping rate was high, the crest and the rear slope armors have to dissipate a significant part of the wave energy, so that the armor damage was higher in the crest and rear slope when Q > 10−3.
5. Conclusions
Medium and low-crested mound breakwaters are frequently overtopped by waves, which may cause damage not only to the front slope, but also to the crest and rear slope. To design mound breakwaters subjected to intense overtopping conditions, it is necessary to design front, crest, and rear armors that consider the overtopping rates to withstand throughout the structure’s lifetime. Medium and low-crested mound breakwaters with occasional large overtopping events under breaking wave conditions have not been well studied in the literature.
A wide range of dimensionless crest freeboards (0.3 < Rc/Hs < 2.6) were tested at the LPC-UPV with single-layer Cubipod® and double-layer rock and cube armors. The Virtual Net method, which takes into account the HeP failure mode, was used to measure the armor damage to the front slope, crest, and rear slope. Results showed a higher hydraulic stability for the double-layer cube armors when compared with the double-layer rock armors. The Equation (5) parameters were calibrated to estimate the equivalent dimensionless damage, Se, for double-layer rock and cube frontal slope armors and double-layer cube crest and rear slope armors within the ranges of the study. When the overtopping rate exceeded a threshold value (Q > 10−3) on the rock and cube armored breakwaters, the damage to the crest and rear slope was higher than that to the front slope, and Initiation of Damage (IDa) was observed in the crest and rear slope.
Single-layer Cubipod® armors showed a higher hydraulic stability for the front slope, crest, and rear slope; the damage was below the Initiation of Damage level (IDa) in all tests. Overtopping rates exceeded the threshold limit for the rock and cube armors (Q > 10−3), but did not cause significant damage to the Cubipod® armor. The hydraulic stability of the single-layer Cubipod® armor was higher than that of the double-layer randomly-placed cube armor. These conclusions are valid for overtopped (m = 1/50 and cotα = 1.5) structures in the front slope, crest, and rear slope.
Author Contributions
G.A. wrote the original draft and was responsible for the conceptualization, experimental methodology, and analysis. M.E.G.-M. and J.R.M. supervise the investigation, review and approved the manuscript.
Funding
This research was funded by Ministerio de Economía y Competitividad and the FondoEuropeo de Desarrollo Regional (FEDER) under grant BIA2015-70436-R.
Acknowledgments
The authors acknowledge the financial support from the Ministerio de Economía y Competitividad and the FondoEuropeo de Desarrollo Regional (FEDER) under grant BIA2015-70436-R. The authors thank Debra Westall for revising the manuscript. Moreover, the authors acknowledge financial support from the Conselleria d’Educació, Investigació, Cultura i Esport (Generalitat Valenciana) under grant GV/2017/031.
Conflicts of Interest
The authors declare no conflict of interest.
References
- Pullen, T.; Allsop, N.W.H.; Bruce, T.; Kortenhaus, A.; Schüttrumpf, H.; van der Meer, J.W. EurOtop. Wave Overtopping of Sea Defences and Related Structures: Assessment Manual. Available online: www.overtopping-manual.com (accessed on 20 October 2018).
- Kramer, M.; Burcharth, H.F. Stability of low-crested breakwaters in shallow water short crested waves. Proc. Coast. Struct. 2003, 137–149. [Google Scholar] [CrossRef]
- Burcharth, H.F.; Kramer, M.; Lamberti, A.; Zanuttigh, B. Structural stability of detached low crested breakwaters. Coast. Eng. 2006, 53, 381–394. [Google Scholar] [CrossRef] [Green Version]
- CIRIA/CUR/CETMEF. The Rock Manual. The Use of Rock in Hydraulic Engineering, 2nd ed.; CIRIA: London, UK, 2007; 1267p. [Google Scholar]
- Hudson, R.Y. Laboratory investigations on rubble mound breakwaters. J. Waterw. Harb. Div. ASCE 1959, 85, 93–121. [Google Scholar]
- Van der Meer, J.W. Rock Slopes and Gravel Beaches under Wave Attack. Ph.D Thesis, Delft Technical University, Delft, The Netherlands, 1988. [Google Scholar]
- Herrera, M.P.; Gómez-Martín, M.E.; Medina, J.R. Hydraulic stability of rock armors in breaking conditions. Coast. Eng. 2017, 127, 55–67. [Google Scholar] [CrossRef]
- Van der Meer, J.W.; Daemen, I.F.R. Stability and wave transmission at low-crested rubble mound structures. J. Waterw. Port Coast. Ocean Eng. 1994, 120, 1–19. [Google Scholar] [CrossRef]
- Vidal, C.; Losada, M.A.; Medina, R.; Mansard, E.P.D.; Gómez-Pina, G. A universal analysis for the stability of both low-crested and submerged breakwaters. In Proceedings of the 23rd Conference on Coastal Engineering, ASCE, Venice, Italy, 4–9 October 1992; pp. 1679–1692. [Google Scholar]
- Burger, G. Stability of low-crested breakwaters. Final Proceedings 1995. EU research project Rubble mound breakwater failure modes, MAST 2 contract MAS2-CT92-0042. Delft Hydraulic Report H1878/H2415. Coast. Eng. 2006, 53, 381–394. [Google Scholar]
- Vidal, C.; Medina, R.; Martín, F.L. A methodology to assess the armor stability of low-crested and submerged breakwaters. Coast. Struct. 1999, 2, 721–725. [Google Scholar]
- Vidal, C.; López, F.; Losada, I. Stability of low crested and submerged rubble mound breakwaters. Proc. Coast. Struct. 2007, 2, 939–950. [Google Scholar]
- Gómez-Martín, M.E.; Medina, J.R. Heterogeneous packing and hydraulic stability of cube and Cubipod armor units. J. Waterw. Port Coast. Ocean Eng. 2014, 140, 100–108. [Google Scholar] [CrossRef]
- Losada, M.A.; Desiré, J.M.; Alejo, L.M. Stability of blocks as breakwater armor units. J. Struct. Eng. 1986, 112, 2392–2401. [Google Scholar] [CrossRef]
- Vidal, C.; Losada, M.A.; Medina, R. Stability of mound breakwaters’ head and trunk. J. Waterw. Port Coast. Ocean Eng. 1991, 117, 570–587. [Google Scholar] [CrossRef]
- Gómez-Martín, M.E. Análisis de la Evolución de Averías en el Manto Principal de Diques en Talud Formado por Escolleras Cubos y Cubípodos. Ph.D. Thesis, Universitat Politècnica de València, Valencia, Spain, 2015. [Google Scholar]
- Mansard, E.P.D.; Funke, E.R. The measurement of incident and reflected spectra using a least squares method. In Proceedings of the 17th International Conference on Coastal Engineering, ASCE, Sydney, Australia, 23–28 March 1980; pp. 154–172. [Google Scholar]
- Figueres, M.; Medina, J.R. Estimation of incident and reflected waves using a fully non-linear wave model. In Proceedings of the 29th International Conference on Coastal Engineering, Lisbon, Portugal, 19–24 September 2004; pp. 594–603. [Google Scholar]
- Verhagen, H.J.; Van Vledder, G.; Eslami Arab, S. A practical method for design of coastal structures in shallow water. In Proceedings of the 31st International Conference on Coastal Engineering, Hamburg, Germany, 31 August–5 September 2008; Volume 4, pp. 2912–2922. [Google Scholar]
- Medina, J.R.; Hudspeth, R.T.; Fassardi, C. Breakwater Armor Damage due to wave groups. J. Waterw. Port Coast. Ocean Eng. 1994, 120, 179–198. [Google Scholar] [CrossRef]
Figure 1.
Division of armor layer in three parts.
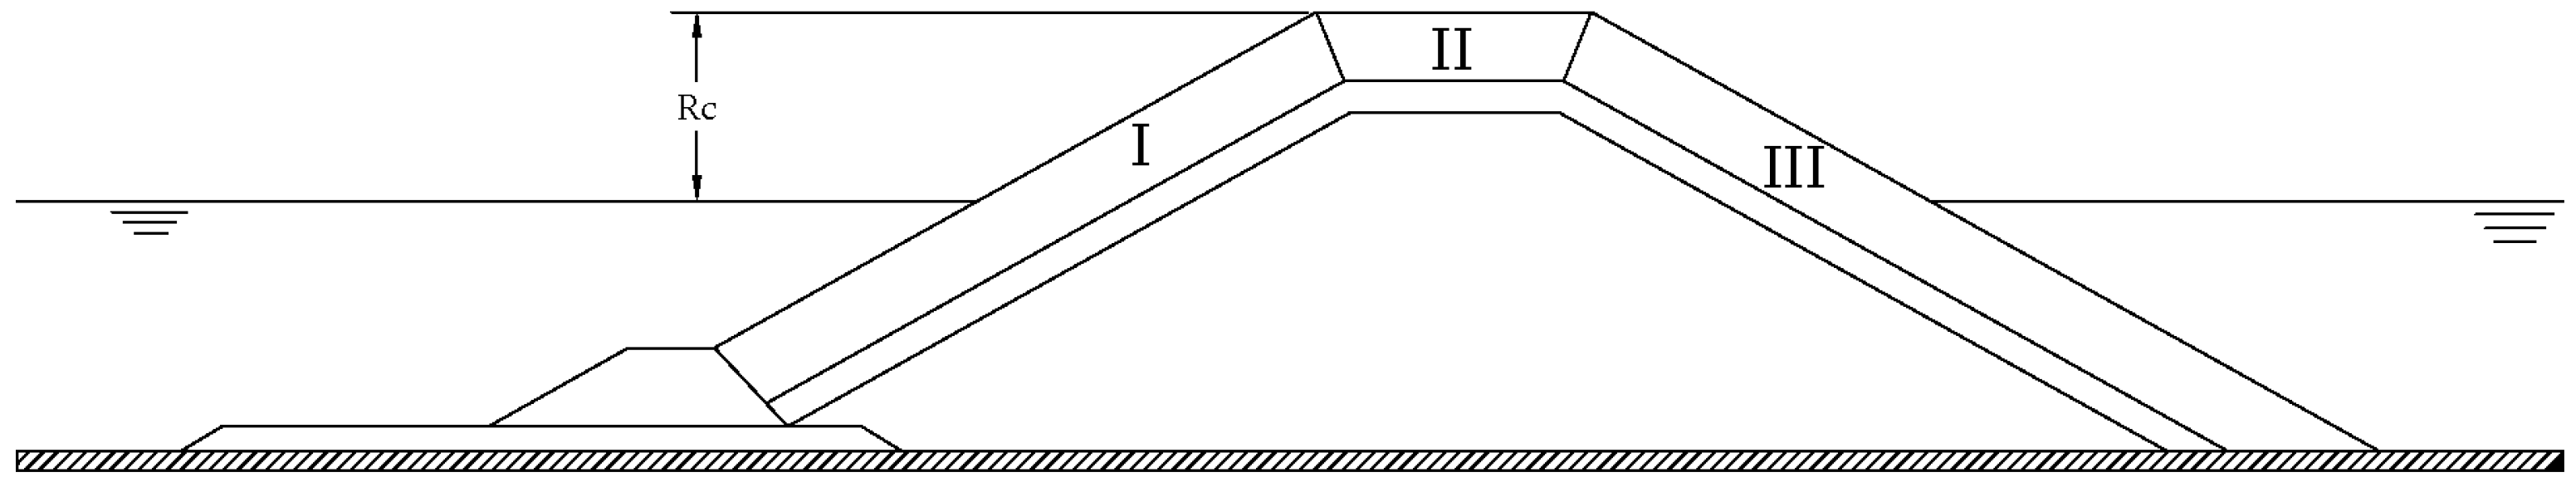
Figure 2.
Longitudinal cross-section of the LPC-UPV wave flume (dimensions in meters).

Figure 3.
Cross-section of the of the breakwater model (dimensions in centimeters).

Figure 4.
Comparison of Hm0,i measured without structure and estimations given by SwanOne in the model zone.
Figure 4.
Comparison of Hm0,i measured without structure and estimations given by SwanOne in the model zone.

Figure 5.
Application of the Virtual Net method to measure armor damage to the front slope (a), crest (b), and rear slope (c).
Figure 5.
Application of the Virtual Net method to measure armor damage to the front slope (a), crest (b), and rear slope (c).

Figure 6.
Measured armor damage, Se, to the front slope as a function of the stability number (rock and cube armors).
Figure 6.
Measured armor damage, Se, to the front slope as a function of the stability number (rock and cube armors).

Figure 7.
Measured armor damage, Se, to the crest as a function of the stability number (rock and cube armors).
Figure 7.
Measured armor damage, Se, to the crest as a function of the stability number (rock and cube armors).

Figure 8.
Measured armor damage, Se, in the rear slope as a function of the stability number (rock and cube armors).
Figure 8.
Measured armor damage, Se, in the rear slope as a function of the stability number (rock and cube armors).

Figure 9.
Measured armor damage, Se, to the front slope as a function of the stability number (Cubipod® armor).
Figure 9.
Measured armor damage, Se, to the front slope as a function of the stability number (Cubipod® armor).
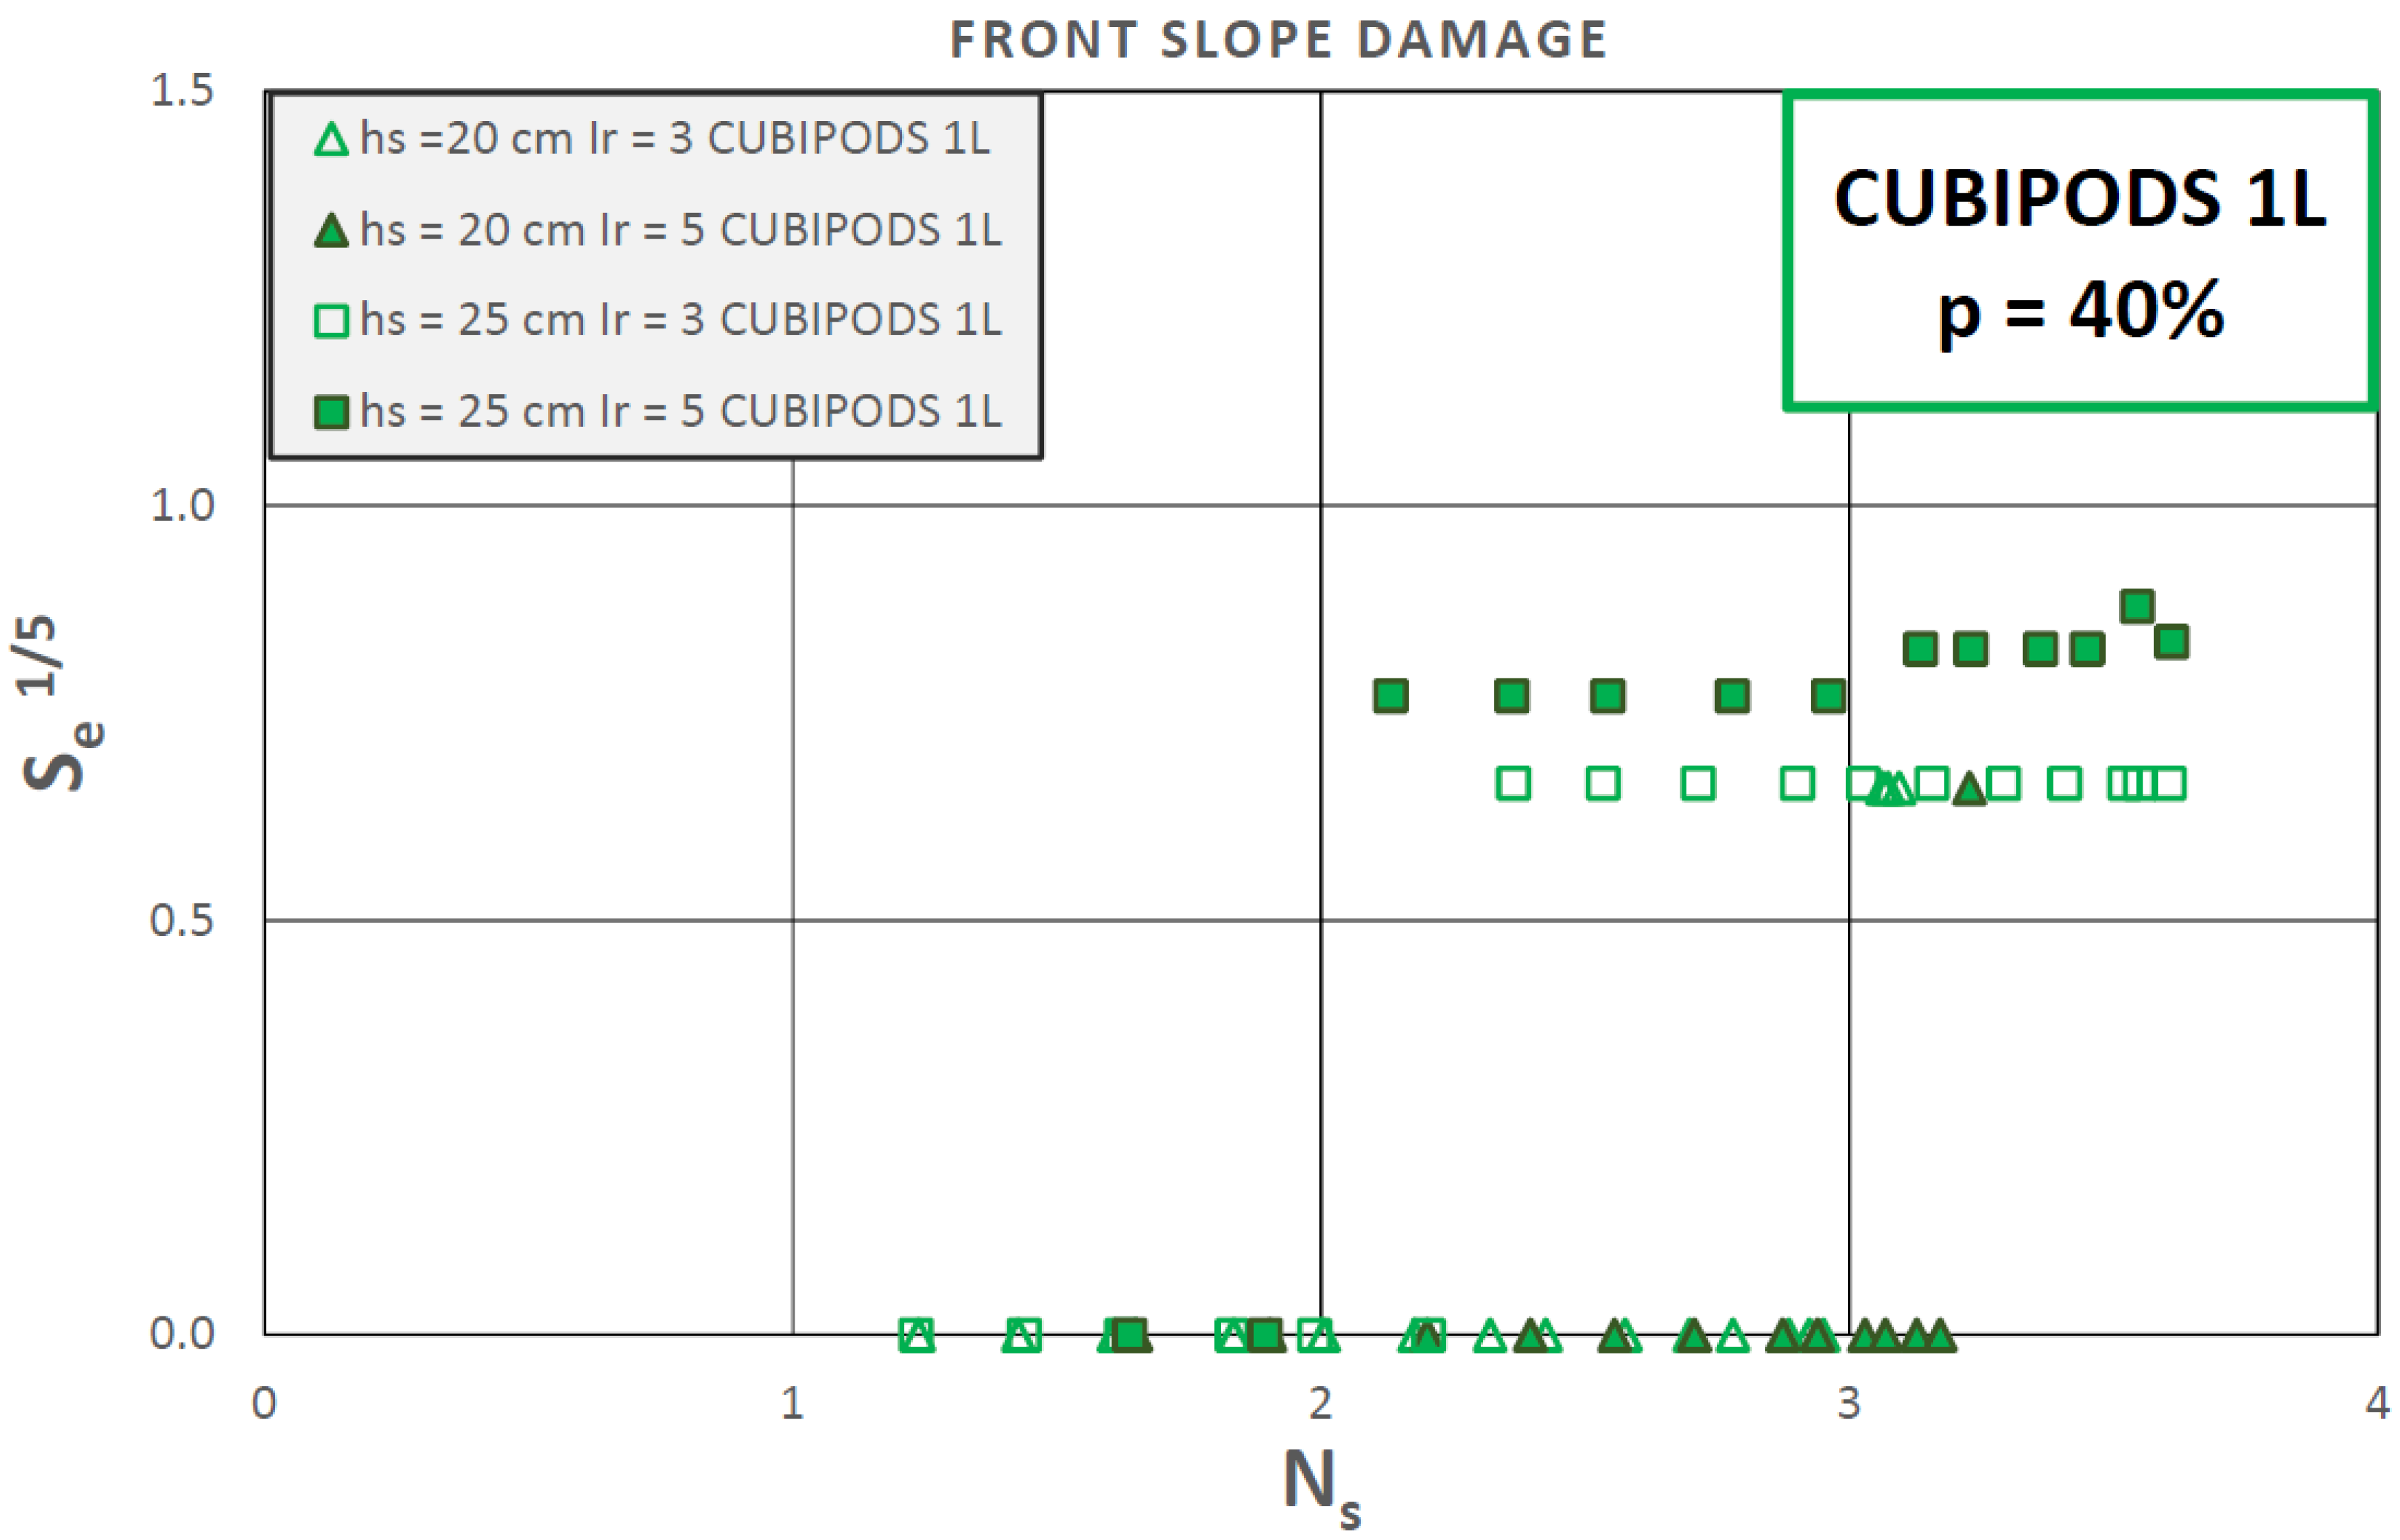
Figure 10.
Measured armor damage, Se, to the crest as a function of the stability number (Cubipod® armor).
Figure 10.
Measured armor damage, Se, to the crest as a function of the stability number (Cubipod® armor).

Figure 11.
Measured armor damage, Se, to the rear slope as a function of the stability number (Cubipod® armor).
Figure 11.
Measured armor damage, Se, to the rear slope as a function of the stability number (Cubipod® armor).

Figure 12.
Measured overtopping discharge in terms of normalized freeboard (cube, rock, and Cubipod® armors).
Figure 12.
Measured overtopping discharge in terms of normalized freeboard (cube, rock, and Cubipod® armors).

Figure 13.
Measured armor damage, Se, in the front slope, crest and rear slope as function of the Q (cube, rock, and Cubipod® armors).
Figure 13.
Measured armor damage, Se, in the front slope, crest and rear slope as function of the Q (cube, rock, and Cubipod® armors).

Table 1.
Characteristics of the materials used in the experiments.
| Layer | M50 (g) | ρr (g/cm3) | Dn50 (cm) |
|---|---|---|---|
| Core | 0.86 | 2.72 | 0.68 |
| Filter | 15.40 | 2.73 | 1.78 |
| Rocks | 86.77 | 2.68 | 3.18 |
| Cubes | 141.51 | 2.27 | 3.97 |
| Cubipods | 121.25 | 2.22 | 3.79 |
Table 2.
Test matrix.
| Series | Armor Layer | hs (cm) | Irp | S0p | Hm0 (cm) | Tp (s) | Rc (cm) | Nt | Ntw |
|---|---|---|---|---|---|---|---|---|---|
| 1 | Cubipods 1L | 20 | 3 | 0.049 | 8–24 | 1.02–1.76 | 12 | 17 | 17,000 |
| 2 | Cubipods 1L | 20 | 5 | 0.018 | 8–20 | 1.70–2.68 | 12 | 13 | 13,000 |
| 3 | Cubipods 1L | 25 | 3 | 0.049 | 8–24 | 1.02–1.76 | 7 | 17 | 17,000 |
| 4 | Cubipods 1L | 25 | 5 | 0.018 | 8–20 | 1.70–2.68 | 7 | 13 | 13,000 |
| 5 | Rocks 2L | 20 | 3 | 0.049 | 8–16 | 1.02–1.44 | 15 | 9 | 9000 |
| 6 | Rocks 2L | 20 | 5 | 0.018 | 8–13 | 1.70–2.08 | 15 | 6 | 6000 |
| 7 | Rocks 2L | 25 | 3 | 0.049 | 8–16 | 1.02–1.44 | 10 | 9 | 9000 |
| 8 | Rocks 2L | 25 | 5 | 0.018 | 8–13 | 1.70–2.08 | 10 | 6 | 6000 |
| 9 | Cubes 2L | 25 | 3 | 0.049 | 8–24 | 1.02–1.76 | 11 | 17 | 17,000 |
| 10 | Cubes 2L | 25 | 5 | 0.018 | 8–20 | 1.70–2.68 | 11 | 13 | 13,000 |
| 11 | Cubes 2L | 30 | 3 | 0.049 | 8–24 | 1.02–1.76 | 6 | 17 | 17,000 |
| 12 | Cubes 2L | 30 | 5 | 0.018 | 8–14 | 1.70–2.25 | 6 | 7 | 7000 |
Table 3.
Calibrated values of k1 and k2 for Equation (5) and rMSE and r values.
| Armor Layer | Sector | k1 (Equation (5)) | k2 (Equation (5)) | rMSE | r |
|---|---|---|---|---|---|
| Rocks 2L | Front slope | 0.633 | −0.056 | 0.095 | 0.949 |
| Cubes 2L | Front slope | 0.137 | 0.621 | 0.253 | 0.861 |
| Cubes 2L | Crest | 0.240 | 0.362 | 0.290 | 0.838 |
| Cubes 2L | Rear slope | 0.255 | 0.113 | 0.461 | 0.716 |
Table 4.
Ranges of validation for Equation (5).
| Armor Layer | Sector | sop | Ns | |
|---|---|---|---|---|
| Rocks 2L | Front slope | 0.018–0.049 | 1.36–2.28 | 3.73–4.66 |
| Cubes 2L | Front slope | 0.018–0.049 | 1.18–3.54 | 4.96–5.95 |
| Cubes 2L | Crest | 0.018–0.049 | 1.37–3.54 | 4.96–5.95 |
| Cubes 2L | Rear slope | 0.018–0.049 | 2.58–3.54 | 4.96–5.95 |
© 2018 by the authors. Licensee MDPI, Basel, Switzerland. This article is an open access article distributed under the terms and conditions of the Creative Commons Attribution (CC BY) license (http://creativecommons.org/licenses/by/4.0/).
Share and Cite
MDPI and ACS Style
Argente, G.; Gómez-Martín, M.E.; Medina, J.R. Hydraulic Stability of the Armor Layer of Overtopped Breakwaters. J. Mar. Sci. Eng. 2018, 6, 143. https://doi.org/10.3390/jmse6040143
AMA Style
Argente G, Gómez-Martín ME, Medina JR. Hydraulic Stability of the Armor Layer of Overtopped Breakwaters. Journal of Marine Science and Engineering. 2018; 6(4):143. https://doi.org/10.3390/jmse6040143
Chicago/Turabian StyleArgente, Gloria, M. Esther Gómez-Martín, and Josep R. Medina. 2018. "Hydraulic Stability of the Armor Layer of Overtopped Breakwaters" Journal of Marine Science and Engineering 6, no. 4: 143. https://doi.org/10.3390/jmse6040143
Note that from the first issue of 2016, this journal uses article numbers instead of page numbers. See further details here.