1. Introduction
Harmful algal blooms (HAB) and the subsequent accumulation of toxins in marine organisms can have severe impacts on human health if no appropriate monitoring program is in place. During HAB events, toxic phytoplankton cells may be concentrated by filter-feeder organisms, such as bivalve molluscs, which in turn may act as vectors of HAB toxins to humans. Direct and indirect losses attributed to HAB outbreaks are hard to quantify accurately, but they commonly raise concerns for public health safety, impairments to the ecosystem and economic losses to fisheries, aquaculture and the shellfish industry.
Monitoring programs are designed to protect public health through temporary closures of shellfish harvest, whenever marine toxins exceed regulatory limits. The concentrations of potentially toxic algae are monitored in seawater as a warning for bloom occurrence, and toxins are determined in shellfish tissues to examine whether their concentrations are within safety limits for human consumption. Both algae and toxins are typically quantified by complex and time-consuming off-line analysis based on microscopy and liquid chromatography (LC), respectively.
The early detection and forecasting of the sudden occurrence of HABs is the key to minimizing their effects. Ideally, HAB events should be monitored in real-time with in situ analysis. Previous attempts have been made, namely through imaging flow cytometry, to monitor in-situ planktonic species [
1] and predict blooms of
Dinophysis ovum and
Mesodinium spp. [
2]. Another promising tool to serve this purpose is Fourier transform infrared (FTIR) spectroscopy. This is a rapid and sensitive analysis technique that can be applied in an automatable mode with high-throughput instruments. State-of-the-art IR spectrometers currently enable the automatic (e.g., every two minutes) and real-time mode acquisition of spectra in a wide variety of industrial processes, from agricultural and food applications to petrochemicals, pharmaceuticals and biomedicine. Particularly, near infrared (NIR) spectroscopy (700 nm to 2500 nm of the electromagnetic spectrum) covers a diversity of functional groups of biomolecules by detecting overtones and combination bands of the fundamental vibrations of groups containing the hydrogen atom (CH, NH, OH, and SH). An NIR spectrum can therefore be regarded as a molecular fingerprint of a given sample, providing qualitative and quantitative information on its biochemical composition. Compared to its neighbour, mid infrared (MIR) spectroscopy, it is less prone to water interference, which explains the use of NIR spectroscopy in water-based bioprocesses across several areas of application.
Fourier transform near infrared (FT-NIR) spectroscopy, using NIR fiber optics probes, has been shown to be a very powerful analytical technique for the in-situ monitoring of cell cultures, namely bacteria, mammalian, algae and yeast cells [
3,
4,
5,
6]. The accurate real-time monitoring of biomass and the formation and consumption of products and by-products is therefore possible without any sample pre-processing in a fast, sensitive and inexpensive way.
In late 1987, after a massive bloom of the diatom
Pseudo-nitzschia multiseries in Canada, FTIR played a crucial role in the discovery of domoic acid as the toxin responsible for the shellfish poisoning event [
7,
8]. Nevertheless, the use of this technique has been little explored for monitoring marine toxins produced by phytoplankton species.
The amount of toxins in seawater has not been a key parameter for monitoring classified shellfish-producing areas. Methods based on LC analysis are usually not sensitive enough to detect toxins in seawater, and there are issues related with the injection of a salt water matrix into the LC system. Therefore, measurement of the amount of toxins in seawater is not routinely performed. Most countries rely on phytoplankton counts only. Although it is highly important to identify the toxin producers and their abundance, data on cell density do not always correlate well with the bioaccumulation process in shellfish. Several reasons for this are indicated: (i) toxin production can be highly variable even at species level, depending on several factors, such as the genotype, growth phase, or nutrient conditions. For example, strains of the toxigenic dinoflagellate
Gymnodinium catenatum, collected from different locations along the Portuguese coast, may vary in their profile of paralytic shellfish poisoning (PSP) toxins [
9,
10]; (ii) species from the same genus may produce toxins while others do not. For example, in the genus
Pseudo-nitzschia, only some species produce domoic acid, the toxin responsible for the food-borne illness amnesic shellfish poisoning, but discrimination between toxic and non-toxic species is often impossible by traditional light microscopy methods [
11].
The aim of this study was to investigate the application of FT-NIR spectroscopy for the analysis of marine toxins in seawater and develop an on-line monitoring system based on FT-NIR spectroscopy. This was achieved using a NIR fibre-optic transflectance probe for monitoring in situ cell abundances and PSP toxin levels in seawater. A culture of the toxin-producing species G. catenatum was used in a gradient of concentrations. The selected transflectance probe, combining transmittance and reflectance operation modes, was adapted to simultaneously detect the highly diluted and concentrated analytes. To understand the potential contribution of FT-NIR to the effectiveness of marine toxin monitoring programs, the results were validated against the conventional technique, namely liquid chromatography with fluorescence detection (HPLC-FLD).
2. Materials and Methods
2.1. Gymnodinium catenatum Cell Culture and Preparation of Seawater Samples
G. catenatum (strain IO-13-23) was obtained from the algal culture collection of the University of Lisbon (ALISU). Two cultures, designated as culture experiment A and B, were simultaneously grown in L1 medium at salinity 28, 18 °C and 250 µE m−2 s−1 with a 12:12 light:dark cycle. Cells from two-liter cultures at a late exponential growth phase were concentrated in a 20 µm sieve and resuspended in 600 mL of filtered seawater. For each culture experiment, triplicates of serial dilutions of toxic G. catenatum cells were prepared in filtered seawater to achieve 20 concentrations, ranging from 1.4 to 0.07 × 10⁶ cells L−1. A blank sample without G. catenatum cells was used as control. Samples were placed in 50 mL vessels, with agitation by a magnetic stirrer to induce water aeration/agitation and simulate seawater hydrodynamic conditions. Other parameters such as turbidity, pollution, light and the presence of other organisms, were not accounted in the simulated system. The two experiments, A and B, were used for spectral modeling as described below. For the determination of the original cell concentration, the culture was gently mixed and 5 mL aliquots were fixed with Lugol’s iodine solution. Cells were counted under a light microscope (Zeiss Axioskop, Carl Zeiss Jena GmbH, Jena, Germany), in triplicate, using a Sedgwick–Rafter chamber. The detection limit of the method is 103 cells L−1.
2.2. FT-NIR Analysis
NIR spectra for each cell concentration of G. catenatum were obtained using a NIR transflection fiber optic probe IN-271P (Bruker Optics, Ettlingen, Germany), with a pathlength of 2 mm, coupled to a Vertex-70 spectrometer (Bruker Optics, Ettlingen, Germany) equipped with a TE-InGaAs detector. A reference atmospheric air spectrum was acquired before inserting the NIR probe into the vessels. The fiber optic probe was then submerged in the culture vessels and, for each cell concentration, NIR spectra were collected in triplicates, in the 12,500–5400 cm−1 (800–1851 nm) range, consisting of 32 co-added scans with 8 cm−1 resolution (2 nm steps). The scanner velocity was set to A 20 kHz and a 6 mm aperture setting was defined.
2.3. Spectral Modeling
NIR spectroscopy produces broad, overlapping absorbance bands as a result of the overtones and combination bands of the fundamental vibrations (
Figure 1). Being less interpretable compared to the sharp absorbance bands produced by the fundamental vibrations in the MIR region, NIR spectral bands require multivariate data analysis for the extraction of relevant quantitative information from the samples. In applications where the number of
p variables is much larger than the number of
N samples, reaching thousands of highly correlated and noisy variables (as is the case for IR spectroscopic applications), projecting the data onto a subspace preserving the most relevant information stands as a very powerful modeling direction. Partial least squares (PLS) regression constructs an orthogonal basis of a few latent (not directly observed) variables (LV) from the observed predictor matrix
X, in such a way that they are maximally correlated with the response variable
Y [
12,
13,
14]. PLS modeling stands as the gold standard in IR spectroscopic applications, being successfully applied across many areas of research closely related to the topics of this study, particularly food control and public health [
15,
16,
17].
Cell concentration and the toxin contents of the G. catenatum cultures were estimated by PLS regression, based on the samples’ NIR spectra and the corresponding cell concentrations and PSP toxins reference values obtained by offline analyses (light microscopy and HPLC-FLD, respectively), as described in the subsection below. Samples from both culture A and B were assigned to either a calibration or a validation set (the latter not seen during model building), ensuring the concentration of the calibration set was within the concentration range of the validation. PLS models were built based on the calibration set and validated on the test set. Several spectral pre-processing techniques to improve model accuracy were explored. These included, constant offset elimination, min-max normalization, straight line subtraction, multiplicative scatter correction (MSC), standard normal variate (SNV) and spectral derivatives. The predictive performance of each PLS model was assessed by the coefficient of determination (R2) and the root mean squared error of prediction (RMSEP) on the validation set. Data pre-processing and PLS modeling were performed using the OPUS software version 7.2 (Bruker Optics, Ettlingen, Germany).
2.4. High Performance Liquid Chromatography with Fluorescence Detection (HPLC-FLD)
Immediately after FT-NIR analysis,
G. catenatum cells, from each of the 20 dilutions of culture A and B, were harvested by centrifugation (2000×
g, for 5 min at 15 °C). The PSP toxins were extracted in 3 mL of 0.05 M acetic acid and sonicated for 4 min at 25 W, 50% pulse duty cycle (Vibra-cell, Sonic & Materials, Newtown, CT, USA) in an ice bath. Cell lysis was confirmed by light microscopy. The extract was then centrifuged (4000×
g) for 10 min and an aliquot of the supernatant used for toxin analysis. The supernatant was cleaned by solid-phase extraction (SPE) with an octadecyl bonded phase silica column (Sep-Pak C18, 3 cc, Vac RC, 500 mg, Waters, Lisbon, Portugal). Before LC-FLD analysis, the non-
N-hydroxylated toxins (C1 + 2, dcSTX and GTX5), which dominate the
G. catenatum toxins profile [
8], were quantified following peroxide oxidation of the C18 cleaned-up extracts.
The toxins converted into the correspondent fluorescent derivatives were determined using HPLC-FLD based on the precolumn oxidation method developed by [
18]. The HPLC-FLD equipment consisted of a Hewlett-Packard/Agilent Model 1050 quaternary pump, Model 1100 in-line degasser, autosampler, column oven, and Model 1200 fluorescence detector. The PST oxidation products were separated using a reversed-phase Supelcosil LC-18, 15 × 4.6, 5 µm column (Supelco, Bellefonte, PA, USA). The mobile phase gradient consisted of 0–5% B (0.1 M ammonium formate in 5% acetonitrile, pH 6) in the first 5 min, 5–70% B for the next 4 min and back to 0% B in the next 2 min. Then 100% mobile phase A (0.1 M ammonium formate, pH 6) was used for 3 min before the next injection. Flow rate was 1 mL min
−1 and the detection wavelength set to 340 nm for excitation and 395 nm for emission. Instrument limits of detection (S/N = 3) were as follow: 0.002 µM dcSTX and 0.004 µM for C1 + 2 and GTX5. Low potency PSP toxin analogues for which analytical standards were not available, namely C3 + 4 and GTX6, were not considered for this study.
3. Results and Discussion
The possibility of using a FT-NIR fiber optic probe for the non-destructive monitoring of
G. catenatum cultures was evaluated. NIR spectra were rapidly acquired (
Figure 1), requiring neither time-consuming sample preparation nor the use of expensive reagents. Spectral modeling by PLS regression based on the NIR spectra recorded enabled the building of highly accurate PLS models for cell concentration, total PSP toxins, and the concentration of each toxin analogue (C1 + 2, GTX5 and dcSTX), yielding a R
2 ≥ 0.85 and a RMSEP of 0.045 for total PSP toxins and 2.96 × 10
3 for biomass (
Table 1). The models were built based on a total number of 4–7 extracted LVs for biomass, total toxin content, C1 + 2, GTX5 and dcSTX data (
Table 1).
A highly accurate PLS regression model was obtained for biomass, with a coefficient of determination R
2 = 0.92 (
Figure 2). This prediction accuracy is similar or higher to previous studies [
6,
19,
20]. However, in previous studies (R
2 ≥ 0.77 to 0.95), biomass prediction was calculated for filtered and dried cells, while the present study estimates their concentration live in seawater. This promising result is the necessary first step to further investigating the use of FT-NIR for the determination of toxic algae in seawater. It is also expected to stimulate the development of portable instruments for toxic phytoplankton analysis in the field, a highly-required tool for shellfish farmers and environmental management. Indeed, recent critical reviews indicate the high potential of combining chemometrics and NIR modes for microalgae monitoring and in vivo analysis [
21].
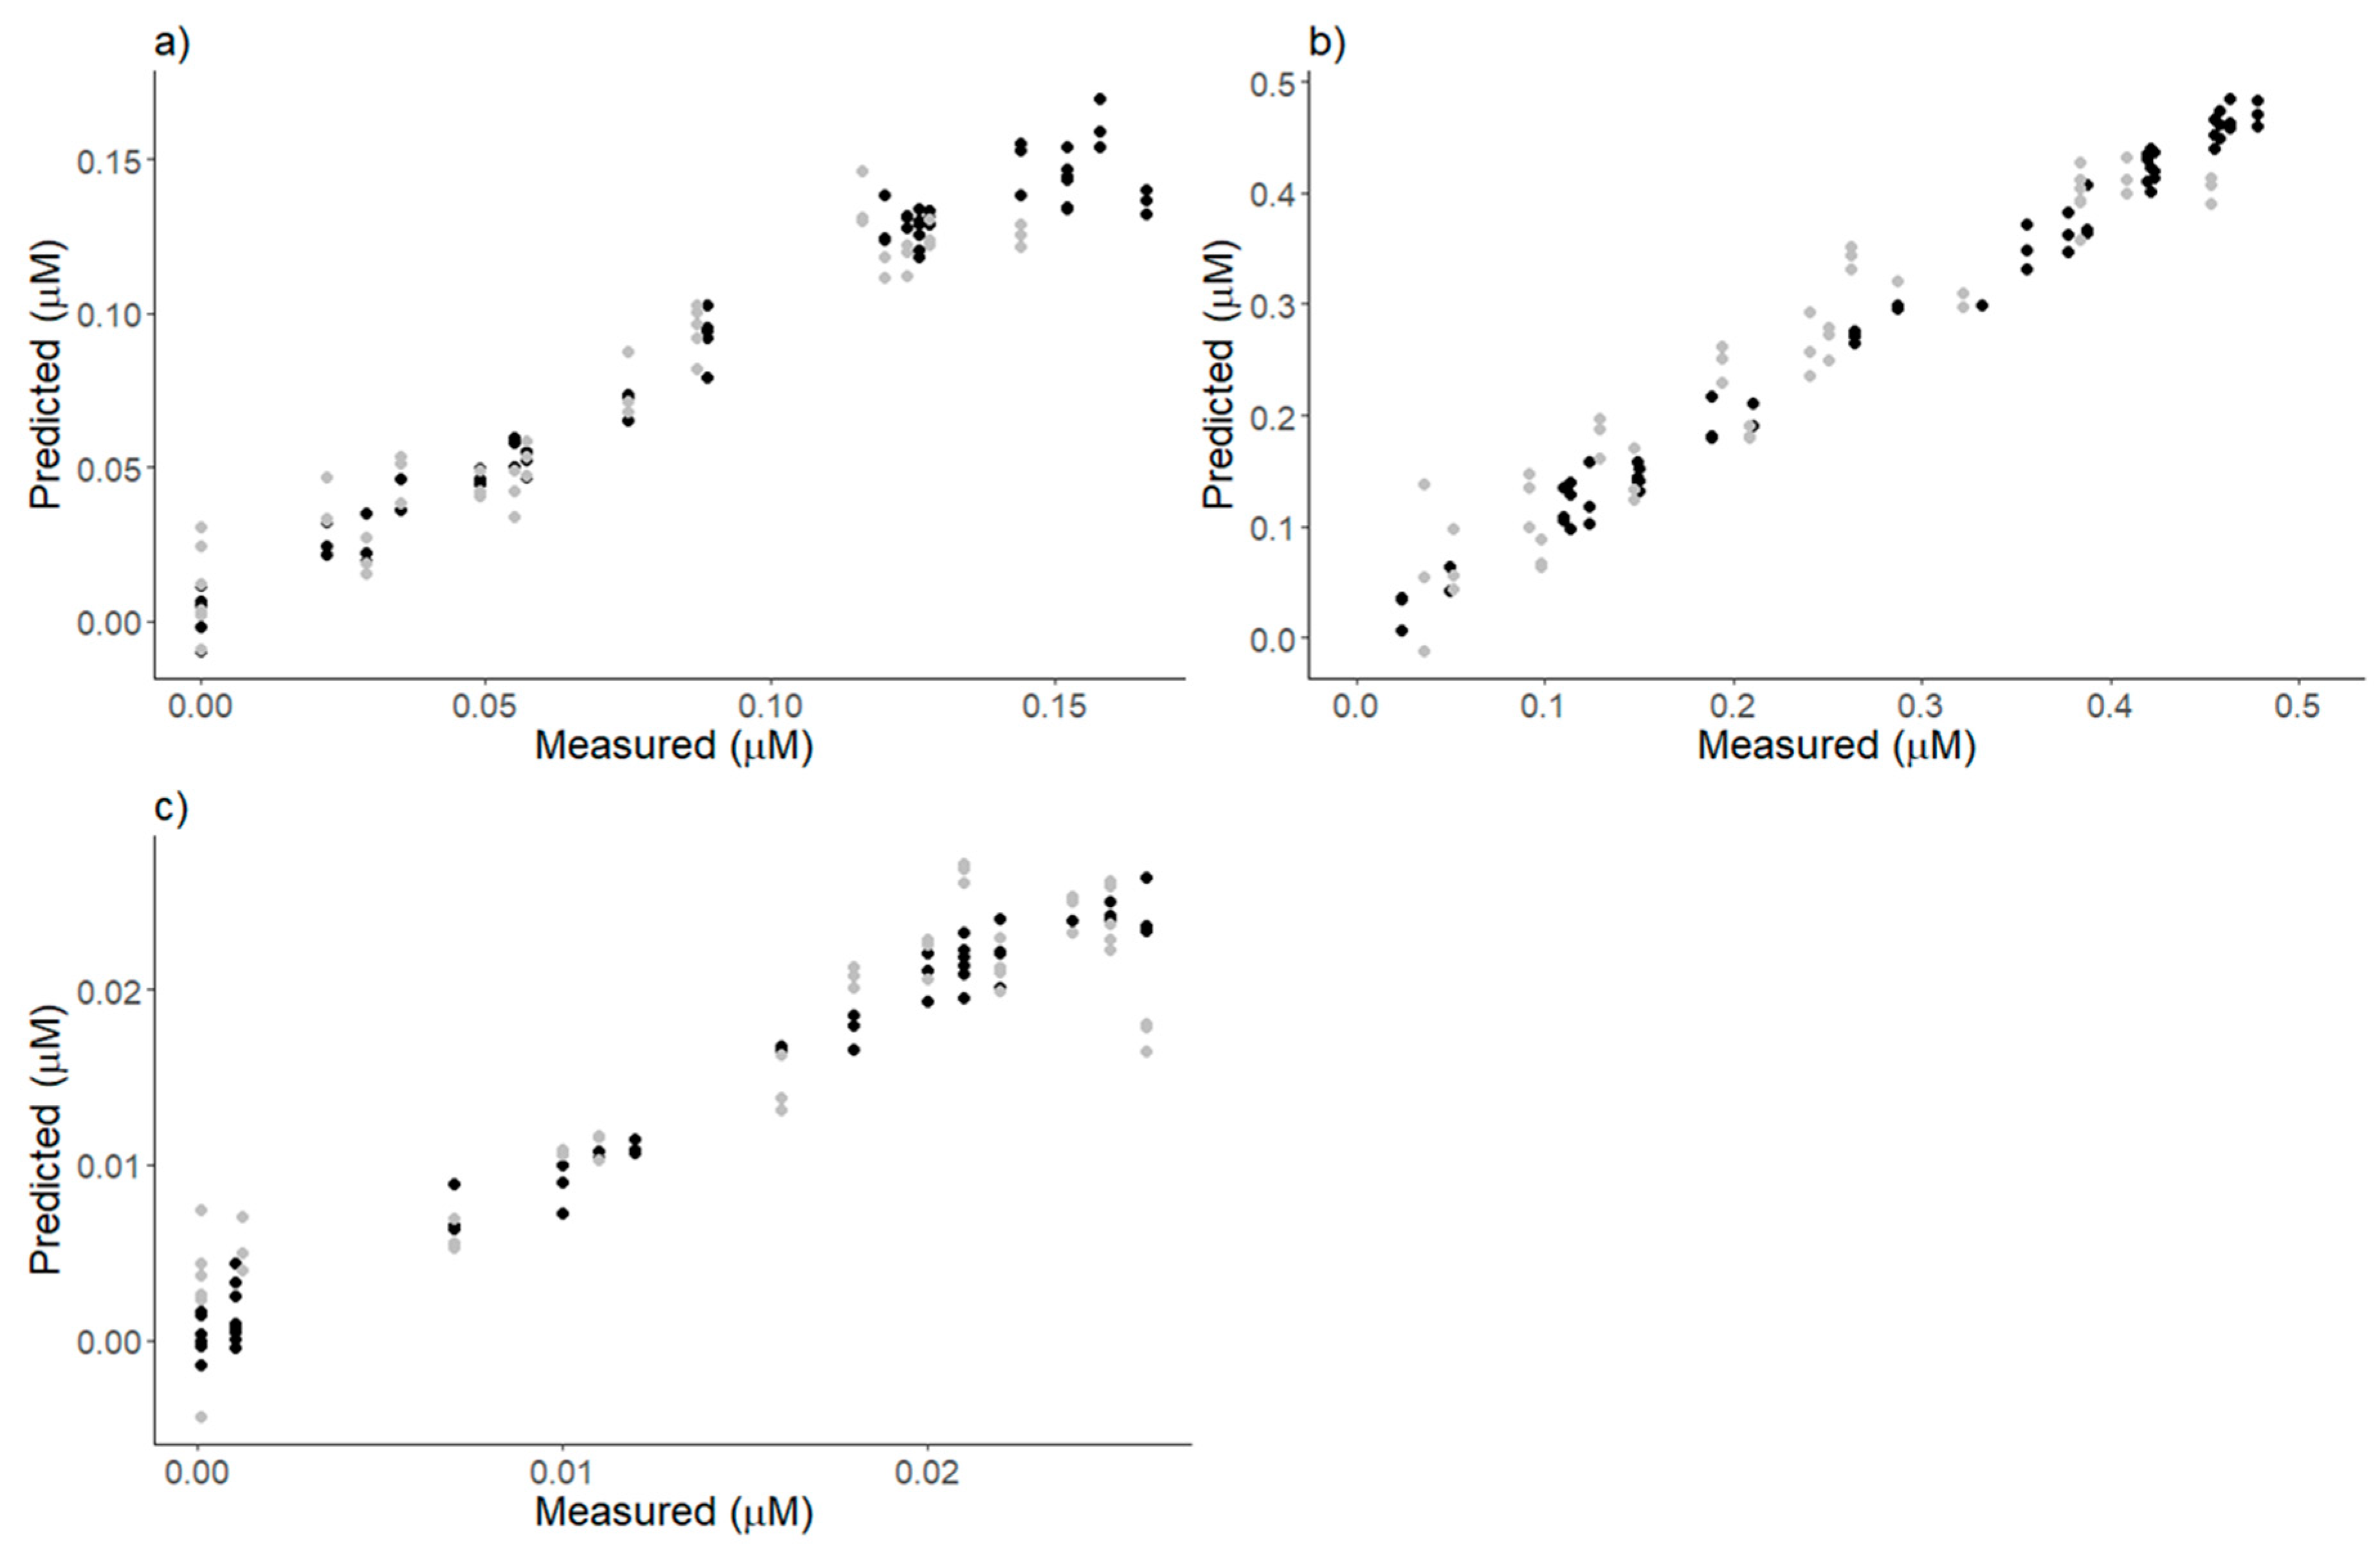
Gymnodinium catenatum was the selected species for this study since it is a known producer of neurotoxins of the PSP group. Therefore, this study also attempted to develop PLS models and NIR analysis for the prediction of PSP toxins. Predictions of PSP toxins by PLS regression showed a strong correlation between the PSP toxins measured by NIR spectroscopy and the conventional technique (HPLC-FLD). The best predictive performance was obtained for total PSP toxins (R
2 = 0.92 and RMSEP = 0.045) (
Table 1,
Figure 3). Good predictive performances were also achieved by the model for each toxin individually (
Table 1,
Figure 4). The best correlation coefficients were obtained for the most complex toxins C1 + 2, which contain two sulfate groups, followed by the mono-sulfated GTX5 and finally the non-sulfated and decarbamoylated dcSTX, which is the simplest compound of the PSP toxin group (for details of PSP toxins’ structure, see Wiese et al., 2010).
Although applications of NIR have been developed for several fermentation processes and pharmaceutical or biopharmaceutical aims, to the best of our knowledge, this is the first time that NIR spectroscopy is used for the quantification of marine phytoplankton cells and their toxins. While the present study was based on a monospecific sample, these results encourage further studies to investigate the use of NIR spectroscopy in more complex situations, such as multi-specific high diversity samples or multi-strain samples with distinct toxin signatures (e.g., G. catenatum).
HAB events are natural phenomena that are difficult to forecast [
22]. In the last century, changes to global climate conditions, an increase in nutrient availability and changes in nutrients ratios, mostly due to anthropogenic activities, have been responsible for the increase in HAB frequency, intensity, persistence and geographic distribution [
23,
24,
25]. It is thus expected that the effective monitoring of HABs will become an increasingly important task.
FT-NIR spectroscopy has shown its suitability to estimate cell abundances and PSP contents in G. catenatum cultures, in a rapid, sensitive and non-destructive way. It therefore holds the promise of playing an important role in the development of systems for the in-situ monitoring of HAB events.


