Deciphering the Tsunami Wave Impact and Associated Connection Forces in Open-Girder Coastal Bridges


1
Department of Civil and Environmental Engineering, University of Nevada, Reno, 1664 N. Virginia Street, Reno, NV 89557-0258, USA
2
O.H. Hinsdale Wave Research Laboratory, Oregon State University, School of Civil and Construction Engineering, 3550 SW Jefferson Way, Corvallis, OR 97331, USA
3
School of Civil and Construction Engineering, Oregon State University, 350 Owen Hall, Corvallis, OR 97331, USA
*
Author to whom correspondence should be addressed.
J. Mar. Sci. Eng. 2018, 6(4), 148; https://doi.org/10.3390/jmse6040148
Submission received: 9 October 2018
/
Revised: 24 November 2018
/
Accepted: 29 November 2018
/
Published: 5 December 2018
(This article belongs to the Special Issue Tsunami Science and Engineering II)
Abstract
:In view of the widespread damage to coastal bridges during recent tsunamis (2004 Indian Ocean and 2011 in Japan) large-scale hydrodynamic experiments of tsunami wave impact on a bridge with open girders were conducted in the Large Wave Flume at Oregon State University. The main objective was to decipher the tsunami overtopping process and associated demand on the bridge and its structural components. As described in this paper, a comprehensive analysis of the experimental data revealed that: (a) tsunami bores introduce significant slamming forces, both horizontal (Fh) and uplift (Fv), during impact on the offshore girder and overhang; these can govern the uplift demand in connections; (b) maxFh and maxFv do not always occur at the same time and contrary to recommended practice the simultaneous application of maxFh and maxFv at the center of gravity of the deck does not yield conservative estimates of the uplift demand in individual connections; (c) the offshore connections have to withstand the largest percentage of the total induced deck uplift among all connections; this can reach 91% and 124% of maxFv for bearings and columns respectively, a finding that could explain the damage sustained by these connections and one that has not been recognized to date; (e) the generation of a significant overturning moment (OTM) at the initial impact when the slamming forces are maximized, which is the main reason for the increased uplift in the offshore connections; and (f) neither maxFv nor maxOTM coincide always with the maximum demand in each connection, suggesting the need to consider multiple combinations of forces with corresponding moments or with corresponding locations of application in order to identify the governing scenario for each structural component. In addition the paper presents “tsunami demand diagrams”, which are 2D envelopes of (Fh, Fv) and (OTM, Fv) and 3D envelopes of (Fh, Fv, OTM), as visual representations of the complex variation of the tsunami loading. Furthermore, the paper reveals the existence of a complex bridge inundation mechanism that consists of three uplift phases and one downward phase, with each phase maximizing the demand in different structural components. It then develops a new physics-based methodology consisting of three load cases, which can be used by practicing engineers for the tsunami design of bridge connections, steel bearings and columns. The findings in this paper suggest the need for a paradigm shift in the assessment of tsunami risk to coastal bridges to include not just the estimation of total tsunami load on a bridge but also the distribution of this load to individual structural components that are necessary for the survival of the bridge.
Keywords:
tsunami; experiments; wave impact; bore; solitary wave; slamming force; bridge; deck; connections; bearings
1. Introduction
In the last two decades, large magnitude earthquakes with epicenters in the ocean (Indian Ocean 2004, Chile 2010 and Japan 2011) have generated tsunami waves of significant heights that caused unprecedented damage to coastal communities. Ports, buildings and infrastructure were severely damaged and bridges were washed away, cutting lifelines and hindering the efforts of rescue teams to provide help to the people in need. In the 2004 Indian Ocean Tsunami, 81 bridges located on the coast of Sumatra were washed away [1]. In the 2011 Great East Japan Earthquake in Japan, many bridges were able to withstand the strong shaking; however, 252 bridges were washed away or moved by the tsunami [2]. The most severe and common type of failure in these bridges was the breaking of the connections between the superstructure and the substructure, which resulted in the unseating and wash out of the bridge deck by the tsunami waves (Figure 1).
These unforeseen events demonstrated the vulnerability of bridges to tsunami waves and highlighted the need to understand the tsunami-induced loading. In response to this need several studies have been published in recent years, including on-site surveys and damage analysis [3,4,5], small-scale experiments in wave flumes [6,7,8,9] and numerical simulations [10,11,12,13,14,15,16,17]. On-site investigations conducted by various research teams analyzed the failed bridges and revealed that the overflow can occur either in the form of transverse drag due to large horizontal wave forces or in the form of uplift and overturning due to the combination of large vertical and horizontal tsunami forces [5,18,19].
Some of the experimental studies investigated tsunami loads on flat slabs [8], decks with girders [6,9,20,21] and box-shaped decks [7,22,23]. Several studies simulated the tsunami waves via unbroken but transformed solitary waves, while others via turbulent bores. In most of these experiments, the researchers constructed their bridge models from acrylic, wood or steel, supported the deck rigidly and measured both pressures and total forces. Furthermore, they were all small-scale experiments with scale factors ranging between 1:100 and 1:35. Hoshikuma et al. [24] conducted experiments to study the tsunami effects on bridges at a larger scale, equal to 1:20. They examined several different cross-sections with deck specimens made of acrylic or wood and connected rigidly to a pier at the center of the superstructure. To the authors’ best knowledge these experiments were the first ones to measure the tsunami demand on the connections between the superstructure and substructure and demonstrated that the offshore bearings were uplifted while the onshore were compressed implying the existence of overturning moment. Despite the fact that all these small and medium-scale experiments gave an insight into the tsunami forces on bridges, they might have significant scale effects because: (a) it is not possible to scale the atmospheric pressure, a fact that will affect the interaction of the wave with the trapped air between the girders and possibly modify the applied pressures and forces; and (b) at such scales it is not easy to accurately simulate the structural properties [25].
Apart from the experimental studies, several numerical analyses have been conducted to study the tsunami impact on bridges. Among others, Lau et al. [6] and Bricker and Nakayama [14] conducted computational fluid dynamics (CFD) analyses and obtained the total applied tsunami loading. In the first case, the researchers used the CFD results for the development of predictive loading equations, while in the latter case, the calculated tsunami loading was directly compared with the capacity of the Utatsu Bridge in Japan revealing that the bridge failed due to the deck superelevation, nearby structures and trapped air. Another study conducted numerical analyses of a rigid bridge model (Azadbakht and Yim [15]) with a finite element method (FEM)-based multi-physics commercial software program called LS-DYNA and developed by the Livermore Software Technology Corporation (LSTC), Livermore, California, for the development of a tsunami load estimation method. Murakami et al. [26] calculated the pressures on a rigid bridge model via CFD analyses and then used them as external loads on a slab-type bridge model with flexible springs in order to get an estimate of the uplift demand in the individual bearings. Istrati and Buckle [16] conducted advanced fluid-structure interaction (FSI) analyses in LS-DYNA (V971 R6.1.2) using an equivalent 2D bridge model with flexible deck and connections, which showed that the dynamic characteristics of the bridge affected both the tsunami load applied on the bridge, as well as the forces in the connections. In addition, the study showed the existence of a rotational mode during the impact of tsunami waves, which put the offshore bearings in tension and the onshore ones in compression, increasing consequently the demand on the offshore connections.
More recently Motley et al. [27] developed 2D and 3D CFD numerical models of a 1:20 scale bridge model in OpenFOAM to examine the effect of the bridge skewness. Several skew angles between 0 and 40 degrees were examined and it was revealed that the skew bridge is subjected to pitching and spinning moments and that there exists a force normal to the abutments that could lead to unseating. Another, recent study conducted by Wei and Darlymple [28], simulated the same 1:20 scale straight bridge as the previous researchers, using the weakly compressible smoothed particle hydrodynamics (SPH) method in GPUSPH and demonstrated the possibility of mitigating the tsunami effects on bridges via the use of an offshore breakwater or the existence of another bridge on the seaward side of the main bridge. Recently, Zhu et al. [29] implemented the particle finite element method (PFEM) in OpenSees to simulate tsunami impact on bridge decks and validated the methodology again using the small-scale experiments conducted in [24]. Although most of the aforementioned studies focused on the total applied wave loading, more recent studies ([30,31,32]) examined the tsunami-induced loading on individual girders and/or deck chambers, and revealed that the upstream girder and the upstream part of the deck have to withstand a large percentage of the total loading, which suggests the need to investigate the tsunami-induced local effects on individual bridge components (e.g., rails, girders, deck chambers). It must be noted that several of the studies conducted in the past have focused on understanding the hurricane induced forces on bridges [33,34,35] and some of their findings could possibly contribute to the understanding of the tsunami wave impact on bridges as well; however, due to limited space these studies are not reviewed herein. The readers could find a comprehensive review of the hurricane induced bridge forces in [36].
As described previously most of the studies to date investigated the total induced tsunami wave loading, a few recent ones focused on the tsunami demand on individual girders and deck chambers and only very few studies considered the demand on the bearings and connections. Given the fact that (a) the latter studies revealed significant demand on the offshore bearings and connections and (b) the breaking of the bearing connections was the main type of bridge damage witnessed in recent tsunamis, it becomes critical to quantify the tsunami demand on these components and decipher the underlying physics. Moreover, given the fact that most experimental studies were conducted at a small-scale with possibly significant scale-effects, while most of the numerical studies were 2D CFD analyses that did not consider the structural properties, it is important to conduct large-scale experiments of tsunami wave impact on bridge specimens with realistic dynamic properties (flexibility and inertia), which will not be subjected to the aforementioned limitations. Therefore, this paper will present a comprehensive analysis of 1:5 scale hydrodynamic experiments of tsunami impact on a representative coastal bridge with open girders conducted at Oregon State University, with particular focus on the spatial and temporal variation of both the total applied loading and the uplift demand in the bearings, connections and columns. The study will also present experimental evidence that decipher the tsunami inundation mechanism and a physics-based simple methodology that can be used by practicing engineers for estimating the tsunami-induced uplift loading in individual connections.
2. Description of Hydrodynamic Experiments
2.1. Experimental Setup
To gain a realistic insight into the tsunami effects on coastal bridge decks, large-scale hydrodynamic experiments were conducted in the Large Wave Flume (LWF) at the O.H. Hinsdale Wave Research Laboratory (HWRL) at Oregon State University. The flume is 104.24 m long, 3.66 m wide, and 4.57 m deep. The maximum depth for tsunami-type wave generation is 2 m, and the maximum wave height for this depth is 1.40 m. The LWF is equipped with a piston-type dry-back wavemaker with a 4.2 m maximum stroke hydraulic actuator assembly and has a movable/adjustable bathymetry made of 20 square configurable concrete slabs. The flume includes a series of bolt-holes vertical patterns every 3.66 m along the flume for supporting test specimens and for creating different bathymetries. In order to identify the bathymetry that would permit the testing of both unbroken solitary waves and bores, and determine the optimum location of the bridge in the flume, parametric CFD analyses of the whole flume were conducted prior to the experiments. These analyses revealed that a slope of 1:12 at the beginning, followed by a horizontal bathymetry 40.2 m long and another 1:12 slope at the end of the flume was the most appropriate (Figure 2). In addition, the optimum location for the bridge was between bays 14 and 15, at a distance of 58.8 m from the wavemaker, in order to allow for the bore to form and overtop the bridge.
For the hydraulic experiments a composite bridge model with four I-girders was designed and constructed at a 1:5 scale. The in-plane dimensions of the bridge deck were 3.45 m length and 1.94 m width. As shown in Figure 3 the steel girders were connected with cross-frames at the end supports. Additional cross-frames had been installed at third points along the length of the girders. Shear connectors had been welded on the flange of each girder in order to achieve the composite behavior with the reinforced concrete deck. The thickness of the slab was 5.1 cm, the haunch was 1.0 cm and height of the steel girders was 21.3 cm. The bridge and the rest of the structural components were designed according to the AASHTO LRFD Bridge Design Specifications [37] assuming that the bridge was located in a Seismic Zone 3. The bridge and all the connecting elements were designed and constructed at the University of Nevada, Reno and then shipped to Oregon State University.
As shown in Figure 4, the bridge was installed on steel bent caps using steel bearings, which constrained all the degrees of freedom. The bent caps were supported by a testing frame consisting of two beams and two brackets, both of which were bolted to the flume walls. The experimental setup also consisted of rails with small friction bolted on top of the black beams, carriages connected to the rails, load cells below the bent caps (shown with yellow in Figure 4) and load cells on top of the bent caps that were connected to the steel bearings below the girders (shown with green in Figure 4). This setup allowed the transfer of the loading directly to the walls of the flume while meeting the main objectives of the research project, which included the investigation of the tsunami loading applied on complex bridge decks and the distribution of the loading to the structural components (deck, cross-frames, bearings, columns) and connections. The experimental setup with the bent caps, support beams and bracket plates was initially designed by [35] to study hurricane wave loading on prestressed concrete bridges but had to be modified in this study in order to (a) be able to withstand the tsunami waves, (b) accommodate the several bridge types tested in this study, (c) replicate a bridge supported on a three column bent, and (d) allow the measurement of not only the total loads but also the individual loads in the bearings of each girder.
2.2. Testing Program and Instrumentation
In the current experimental study 15 different configurations of a straight bridge (with different types of bearings and types of decks) and four configurations of a skew bridge were tested, reaching a total of 420 wave runs. This paper will discuss the experimental results obtained from the bridge with cross-frames and steel bearings with particular focus on the tsunami-induced connection forces. Several experimental studies have been conducted to date to evaluate the tsunami forces on bridges, however many of them modeled the tsunami waves as solitary waves, while other studies used broken waves or bores. The solitary waves are easier to study due to their closed-form mathematical description and repeatable wave-shape, while the broken waves/bores are more complex but at the same time can be more realistic. Therefore, in this study both types of waves were tested in order to examine the sensitivity of the bridge response to the different wave types. In both types of waves, shoaling occurs when the solitary wave propagates pass the 1:12 slope between stations 2 and 3, hence has undergone wave transformation when it reaches the location of the bridge deck. In the former the wave remains unbroken, and in the latter the wave has broken a few bays before reaching the bridge location due to the slope and the decrease in water depth. In both cases the height of the transformed wave that actually impacts the bridge is different than the nominal (or targeted) height generated at the wave-maker location. For this reason in this paper, two different wave heights will be presented, namely the nominal wave height (“H” or “Hinput”) and the wave height at wave gage 12 (“Hwg12”), the closest one to the bridge, which is located at a distance of 4.44 m from the offshore face of the deck. Figure 5 shows Hwg12 for six selected heights. It should be clarified that the nominal wave height is the targeted height, however the measured heights at wg 1 relative to the targeted ones, had a difference of about 1% for the unbroken solitary waves and 1–5% for the broken ones. Table 1 shows the wave matrix, which included two water depths and a range of wave heights from 0.36 m to 1.40 m. Note that in subsequent discussions regarding solitary waves, transformation due to slope and subsequent shallower water depth is implied. The word “transformed” will be inserted when the effect of the physics of wave transformed needs to be emphasized.
Since the main objectives of the experimental study was the development of a high-quality database that could be used for validation and benchmarking of sophisticated numerical codes and simplified analytical methodologies, the use of extensive instrumentation was of major significance. For this reason, the wave hydrodynamics (including wave propagation, shoaling, and breaking) were measured and characterized using 13 resistive-type wave gages, 5 acoustic probes, 12 pressure gages and 16 Acoustic Doppler Velocimeters (ADVs). The wave gages were installed along the length of the flume to measure the free-surface elevation and capture the propagation of the waves (Figure 2), while the ultrasonic gages were installed at the location of the bridge to track the overtopping process. The ADVs were installed at four different locations in order to measure the flow velocities and determine the velocity profile.
The bridge was also extensively instrumented with the aim of measuring both the impact tsunami pressures and the bridge response. In particular, 12 pressure gages were installed on the steel girders and also on the concrete deck to capture the impact pressures at selected locations, while 3 biaxial accelerometers were installed at three locations on the top surface of the bridge deck. Furthermore, eight submersible load cells were installed below the girders and six submersible load cells were installed below the bent cap in order to measure the vertical forces in the girder and column-bent cap connections respectively. Furthermore, two submersible load cells were installed horizontally at the level of the bent caps to measure the total horizontal force transferred from the deck to the bent caps and the supports. Apart from the above instruments, 24 strain gages were installed on the steel cross-frames in an attempt to get an estimation of the forces carried by each member. Detailed information about the exact location of the instrumentation can be found in [23].
3. Experimental Findings
3.1. Total Horizontal and Vertical Forces
In some studies it was suggested to assume that the maximum values of horizontal and uplift forces occurred at the same time, since this was believed to be a conservative assumption for the design of the bridge [15]. Given the fact that the tsunami inundation of a bridge is a transient process, it was deemed critical in this study to investigate the transient tsunami overtopping mechanism and understand how the tsunami-induced forces change as the inundation of the bridge progresses.
For this reason, the time histories of the total horizontal forces were calculated using the measured forces in the two horizontal links and the total vertical forces were calculated by adding the vertical forces recorded in each connection. These time-histories are plotted in Figure 6 for three unbroken solitary waves and three bores of different heights. It must be noted that the origin (t = 0) of all the time series presented in the manuscript is the moment that the wave-maker starts moving, which explains why waves of different heights (and celerity) arrive and impact the bridge at a different instant. Examination of this figure reveals that for most waves the horizontal force exhibits four major peaks, which is equal to the number of the girders under the bridge deck. This indicates that the number of girders has an effect on the horizontal force histories. Regarding the vertical force histories, all tested waves introduced significant uplift forces (positive values in the graphs) as the wave hits the deck, followed by a significant and longer duration downward force (negative values). For most of the tested wave heights the deck witnessed a distinct short-duration impulsive uplift force (also called “slamming force” in other research studies) at the time of the initial impact of the wave on the deck, followed by a longer duration (slowly varying) uplift force as the chambers of the bridge started getting flooded.
With respect to the horizontal force, the patterns were totally different for bores and unbroken solitary waves, with the bores always introducing a significant short-duration impulsive force followed by a significantly reduced in magnitude long duration lateral force. This behavior was not observed for solitary waves, which introduced several longer duration peaks with significant magnitudes during the whole inundation process. Another main difference between the two types of waves is the fact that for bores the total horizontal force was always maximized at the time of the initial impact, while for solitary waves the largest lateral force occurred either when all chambers were flooded or at the initial impact, depending on the wave height. Last but not least, all bores introduced horizontal forces larger than the vertical ones, while for the solitary waves the opposite was true. All these differences indicate that the physics describing the impact and overtopping mechanism as well as the tsunami loading on the deck are different for the two wave types, suggesting the need for the development of methodologies that will predict the tsunami-induced effects as a function of the wave type. Subsequently, this means that it is highly important to be able to identify the wave type to which a bridge at a specific location will be subjected, in order to accurately estimate the effects on the structure.
Another interesting finding that emanates directly from Figure 6 is related to the assumption made in previous studies that the maximum of the horizontal (maxFh) and vertical (maxFv) force coincide in time. Clearly as shown in the figure, this was true for some wave heights but not all. In the cases that the maximum of the two forces did coincide, it happened either at the beginning of the inundation phase (e.g., H = 0.42 m and H = 1.10 m) or later on as the bridge inundation progressed (e.g., H = 0.70 m). For most bores, the two maxima occurred at different time instants with maxFh occurring at the beginning of the inundation and maxFv occurring later on as the chambers get flooded (e.g., H = 1.40 m)
The facts that (a) the horizontal and vertical forces do not always have maximum values at the same instant, and (b) even in the wave cases where the maxima do coincide, this does not take place at the same point of the inundation process (e.g., at the initial impact of the wave on the offshore girder or at a later stage of the inundation), demonstrate the transient nature of the tsunami overtopping mechanism and its complexity, which makes it challenging to estimate exactly the tsunami effects on bridge decks. Moreover, it is noteworthy that for several wave cases where the forces in the two directions did not reach their maximum value concurrently it was observed that at the instant of the maximization of the force in one direction the force in the other direction was significantly reduced relative to its maximum value. For example, for the largest bore with H = 1.40 m at the instant of maxFh the uplift force was 75% of the maximum uplift, while at the instant of maxFv the horizontal force was 60% of maxFh. This means that making the assumption of concurrent maximum forces in the two directions might not be very accurate for several wave cases, a fact that would suggest the need for developing sophisticated methodologies, which will be able to estimate the maximum force in one direction together with the corresponding force in the other direction ultimately leading to a more economical design of tsunami resilient bridges.
3.2. Vertical Forces in Bearings
In order to be able to design a tsunami-resilient bridge the engineer must know the actual demand on each structural component and connection of the bridge. Hence the vertical forces recorded in the load cells directly below the bearings of each girder are depicted in Figure 7, together with the total vertical force for a range of (transformed) solitary waves and bores. It must be noted that in order to calculate the vertical force in the bearings of each girder (e.g., Fv, brgs, G1) the measured forces in the respective load cells of the two bent caps are added together. The previous figure yields several interesting findings and particularly:
- For both solitary waves and bores all bearings are experiencing both uplift and downward forces during the tsunami impact and the flooding process.
- At the initial impact the forces in the offshore (upstream) and onshore (downstream) bearings are out-of-phase, with the offshore bearings witnessing uplift forces and the onshore ones downward forces. At that point in time the offshore steel bearings are taking most of the uplift tsunami force with the bearings of the second offshore girder sharing part of this force. However, as the inundation progresses and the chambers become flooded then all bearing witness uplift forces that are in phase, and are sharing the total uplift force.
- The offshore bearings have to withstand significantly larger uplift forces than the rest of the bearings for all the tested waves, indicating that the offshore bearings should be designed for larger tsunami demand than the rest of the bearings in order to avoid failure of the bridge.
- The uplift forces in the bearings of the four girders are maximized at different instants (as shown by the red stars in Figure 7), highlighting the transient nature of the inundation process and the influence of the bearing forces by local effects created during the passage of the wave.
- For many wave heights and both wave types the maximum uplift force in the offshore bearings (Fv, brgs, G1) and the maximum total tsunami uplift (maxFv) do not coincide. The former forces are always maximized at the instant of the initial impact, while the latter ones can reach maximum either at the initial impact or later on as the deck flooding progresses. This is a major finding because it implies that the maximum total uplift on the deck might not result in the “worst case” scenario (largest demand) for every bearing.
The above time-histories gave an insight into the tsunami uplift demand on bearings for a group of selected wave heights. To get a better view of the recorded behavior Figure 8 presents the maximum uplift recorded in the offshore bearings versus the uplift in the same bearings at the instant where the total uplift force is maximized, for all the tested wave heights. Interestingly, this graph verifies that for many wave heights the maximum uplift force in the offshore bearings does not indeed occur when the total uplift is maximized. In particular, for 5 out of the 7 different (transformed) solitary wave heights and 5 out of 8 different bore heights tested, the uplift force in the offshore bearings at the instant of max total uplift load is smaller than the maximum uplift in the same bearings, and in fact for solitary waves this force can be down to 56% of its maximum value, while for bores the respective percentage is 51%. This suggests that the current widespread approach of using solely the total induced tsunami force as a parameter for evaluating the tsunami effects on bridges is not sufficient, since the worst case scenario (= maximum uplift force in the offshore bearings) cannot be correlated with the maximum total uplift for more than half of the tested waves.
To improve the understanding of the tsunami demand on bearings furthermore Figure 8 (bottom) shows the maximum uplift forces measured in the offshore bearings (Fup, G1) versus the maximum total uplift (Fup) for all the wave heights (Hinput) tested in this study, while Table 2 shows the ratios of these forces for all the bearings of the bridge. This graph clearly supports the previous figures that showed the offshore bearings getting larger uplift forces than the rest of the bearings. In fact, the graph reveals that the offshore bearings get a large percentage of the total uplift, which can reach 91% of the total uplift force for unbroken (transformed) solitary waves and 96% for bores, with the average values being 78% and 70% for the two wave types respectively. The forces in the rest of the bearings reach up to 41% and 37% (Fup, G2), 28% and 30% (Fup, G3), 34% and 36% (Fup, G4) of the total maximum uplift (Fup) for solitary waves and bores respectively. It is worth noting that if the tsunami uplift load was assumed to be a pure hydrostatic load and the deck was rigid then the uplift load would be equally distributed to all bearings and the bearings of each girder would have to withstand 25% of the total uplift. However, the experimental results are demonstrating that this is undoubtedly not the case here, with the offshore bearings witnessing uplift forces that can be equal to 96% of the total bridge uplift. An important issue emerging from these findings, is that since the offshore bearings are witnessing the smallest gravity load among all bearings (due to the smallest tributary areas) and at the same time the largest uplift forces, they have by far the largest probability of failure in the case of a tsunami event. To avoid such a failure, a practical recommendation for engineers designing bridges with cross-frames and steel bearings is to design the offshore bearings and connections to withstand the total tsunami uplift force.
3.3. Vertical Forces in Column-Bent Cap Connections
If the bearings are designed to withstand the individual tsunami demand, then the failure will not occur at the interface of the superstructure and substructure of bridges as happened in past tsunamis and the tsunami loading will be transferred to the structural components below the bearings until it reaches the ground. Therefore, it is of great importance to examine and understand the demand on columns and column-to-bent cap connections. To this end, this section will present and analyze experimental data recorded in the load cells below the bent-cap (shown with green color in Figure 4), which represent the uplift forces that will have to be transferred by the column-bent cap connections. It must be clarified that the axial stiffness of the column-bent cap connections in the experimental setup is generated by the stiffness of the load cells, connecting steel plates, carriages, rails and support beam, and might not be equal to the actual axial stiffness of the columns of a bridge bent cap. This means that the actual distribution of the tsunami uplift load in the columns and column-bent cap connections might slightly differ, nonetheless it is expected that the experiments are going to provide at least a preliminary insight into the tsunami demand on the connections of a three-column bent.
Figure 9 presents the histories of the uplift forces recorded in the three connections of the bent cap together with the total tsunami uplift force. This figure presents some similarities with trends and patterns observed in the uplift forces of the bearings. In particular, the graph illustrates that:
- The offshore column-bent cap connections experience significantly larger uplift than the rest of the connections, while the onshore connections experience larger uplift than the center ones.
- The maximum uplift in the different connections/columns does not occur at the same time, and does not necessarily coincide with the maximum deck uplift. The maximum uplift demand in the offshore connections takes place at the initial impact when the onshore connections witness downward tsunami loading, while the uplift in the rest of the connections is maximized at a later instant of the inundation process.
- The offshore connections/columns have to withstand a large percentage of the total uplift force and for some waves this connection forces is larger than the total applied uplift.
The last observation is also further reinforced by Figure 10, which shows the maximum recorded uplift in the offshore column-bent cap connections relative to the maximum of the total applied uplift for all the tested wave heights. From the graph it is verified that the uplift force in the offshore column is very large relative to the total uplift for all wave heights and both wave types, and in fact for the examined solitary waves the max uplift in the offshore column was 82% on average, while for bores the respective value was 94%. More interestingly, for 4 out of the 8 bore heights the uplift force in the offshore column-bent cap connection exceeded the total uplift tsunami force applied on the deck, by up to 24%. This behavior was observed only for bores and not for solitary waves. A possible reason behind the observed behavior is the fact that as seen in Section 3 of this paper, bores are characterized by significant lateral forces (that exceed the vertical ones), which could potentially create a large OTM as the moment arm increases. Another unexpected observation was the fact that the onshore columns experienced larger uplift than the center one, however further investigation is required in order to decipher the observed phenomenon.
These findings suggest that contrary to most of the research studies conducted to date, which focused on the total uplift force, future studies should focus directly on the tsunami demand on connections and other structural components and consider the role of the overturning moment created by the horizontal load. Moreover, in contrast to the bearings, in which case it was suggested to design the offshore ones for the total tsunami uplift load, this cannot be done for the column-bent cap connections and columns where the overturning moment—generated by the lateral load—has a major effect. It must be clarified that the suggestion of designing the bearings for the total uplift tsunami load is expected to be applicable only to bridges with cross-frames, particularly those ones that have dimensions (e.g., girder height) and dimension ratios (height of bridge/width of bridge and width of overhang/width of bridge) similar to the bridge model tested in this experiment. For example, for a bridge with girders twice as high as the ones tested, the moment arm and consequently the overturning moment generated by the lateral load might become significant and increase the uplift forces even in the bearings to values larger than the total deck uplift.
The analysis of the experimental data highlights the importance of identifying the exact lateral load that corresponds to the maximum uplift on the deck in order to accurately estimate the overturning moment at the level of different structural components below the bent cap (e.g., column-bent cap connections, top and bottom of columns, column-foundation connection, etc.) and consequently the tsunami uplift demand on specific bridge members. The fact that the offshore columns and column-bent cap connections experience significant uplift force with simultaneously large horizontal force and possibly large concentrated moments, coupled with the fact that reinforced concrete sections have reduced moment and shear capacity for large tensile forces, imply that the offshore column-bent cap connections or actual columns might fail in a tsunami event if the bearing connections are strong enough to transfer the applied load from the deck to the bent cap.
4. Estimation of Bearing and Column Uplift Forces Based on Simplified Approach
4.1. Application of Maximum Horizontal and Vertical Forces
Azadbakht and Yim [15] investigated the tsunami impact on bridge decks via 2D numerical analyses and utilized the results for the development of simplified equations that estimated the maximum total lateral, uplift and downward forces. Their research study argued that although the maximum horizontal load and maximum uplift load applied on the bridge deck might not occur at the same time, it would be conservative to apply them simultaneously at the center of gravity (CG) of the deck. Other research studies [21] assumed that the hydrodynamic component of the tsunami loading is uniformly applied on the face of the bridge, meaning that in this case the resultant horizontal load would be applied at the mid-height of the bridge. This approach seems to be consistent with FEMA P-646 [38], which suggests that the hydrodynamic loading applied on the face of a building is uniform with height and the resultant force is applied at the mid-height. Other assumptions could be made regarding the location of application of the lateral load such as the mid-height of the girder or the CG of the concrete slab. Calculating the CG of the concrete slab is generally simpler than the CG of the whole deck, so applying the force in the former location might be preferable, however the final location of application should be based on the physics involved rather than simplicity.
Once the applied load is known and the location of application is selected then a free body diagram (Figure 11) can be drawn to assist with the estimation of the reaction forces. Figure 11 assumes a generic load case, where the bridge is subjected to horizontal and vertical forces as well as an overturning moment. Given the number of unknowns, the system is indeterminate and calculation of the reaction forces would require a 3D numerical model of the bridge deck that would simulate the actual stiffness of every structural component and capture the force distribution accurately. Alternatively, for the sake of simplicity and with the aim to get a first order estimation of the reaction forces the bridge can be assumed rigid and the reaction moments equal to zero. In such case it is possible to solve the static equilibrium and estimate the uplift forces in the bearings using the following equations:
Fv1 = (Fv/4) + (3/10) × (Lz/Lx) × Fh+(3/10) × (M/Lx),
Fv2 = (Fv/4) + (1/10) × (Lz/Lx) × Fh+(1/10) × (M/Lx),
Fv3 = (Fv/4) − (1/10) × (Lz/Lx) × Fh − (1/10) × (M/Lx),
Fv4 = (Fv/4) − (3/10) × (Lz/Lx) × Fh − (3/10) × (M/Lx),
In these equations Fh is the total tsunami horizontal load, Fv is the total applied uplift load, M is the applied moment (assumed zero), Lx is the distance between the bearings of two consecutive girders and Lz is the distance from the location of application of Fh and the center of the load cells below the bearings. Given the fact that past research studies applied the horizontal load at different locations vertically, in this study three different scenarios were examined with Fh being applied at (a) mid-height of the bridge (Lz = 0.241 m), (b) CG of bridge deck (Lz = 0.313 m), and (c) CG of concrete slab (Lz = 0.347 m). Notably, the larger the Lz, the larger the calculated uplift forces in the offshore bearings and bearings G2. Similar equations with Equations (1)–(4), can be developed for calculating the reaction forces in the three columns and connections of the bent cap; however, due to space limitations these equations are not shown herein. For the purpose of possible reproducibility it is noted that for the calculation of the uplift forces in the column-bent cap connections, Lx = 0.914 m and Lz = 0.552 m, 0.625 m, 0.659 m for the three aforementioned scenarios.
Using the simplified methodology together with the experimentally measured total lateral and uplift load, the uplift forces in the bearings and column-bent cap connections have been calculated. These calculated component uplift forces, are then compared to the experimentally measured forces in the same components, in order to assess the accuracy of the simplified methodology. Table 3 presents the ratios of the calculated (using the simplified method) to the experimentally measured uplift forces in all bearings and column connections for all the tested wave heights assuming that the lateral load is applied at the CG of the deck. A positive ratio smaller than 1 implies that the method under-predicts the uplift force, a ratio larger than 1 implies over-prediction and a negative ratio indicates that the simplified method fails to predict the right direction of the loading (downward load instead of uplift). It becomes apparent from the table that the simplified method under-predicts the uplift forces in the offshore bearings (G1) for all wave heights, by up to 59% and 30% on average. For bearings G2, the method gives better results when it over-predicts the uplift forces by 16% on average and 59% max, and under-predicts the force for only three wave heights. For bearings G3 and G4, the simplified approach again fails to predict the measured uplift forces and it actually under-predicts the demand by up to 67% and 98% for the two bearings respectively, while in some cases for the onshore bearings it fails to even predict the correct direction. This may be due to the assumptions made in this methodology such as the rigidity of the bridge deck or the application of maxFh and maxFv at the CG of the deck. It must be noted that the latter assumption, which was recommended in reference [15] was based on tsunami waves with horizontal prescribed velocity at the inlet and wave propagation over a flat bathymetry, without accounting for shoaling effects. Due to these effects the solitary wave transforms and increases in height before it reaches the bridge, a transformation that could generate a vertical velocity component. This in turn could influence the induced forces and their location.
Similar trends are observed for the uplift forces in the column-bent cap connections, with the simplified method giving good estimates for the center column (col. 2), but under-predicting for most waves the demand on the offshore one (col. 1) by up to 41% (and 13% on average) and predicting a wrong direction for the vertical forces in the onshore column (col. 3) An important issue emerging from the above observations, is that although the simplified method of applying the total tsunami forces at the CG of the deck seems to be giving good results for the uplift forces in the structural components and connections close to the CG (particularly bearings G2 and center column), it fails to accurately estimate the demand on components far from the CG and especially offshore and onshore bearings and columns. In fact for these components the simplified method yields significant under-predictions of the uplift force demonstrating that it is not conservative as initially hypothesized. This finding was unexpected and suggests the need for further investigation and ideally development of an improved practical methodology that will be able to predict the tsunami uplift in all structural components conservatively.
4.2. Role of Overturning Moment
Since the application of the total horizontal and uplift tsunami load at the CG of the deck cannot estimate accurately the uplift demand on bearings and columns, it means that the physics of the tsunami impact and inundation of the bridge are not accurately represented in the simplified methodology. Going back to the time-histories of the uplift forces in the connections (Section 3), one can observe that at the beginning of the tsunami impact the vertical forces in the offshore and onshore bearings are out-of-phase, with the former experiencing uplift and the latter downward force. This implies the existence of a clockwise overturning moment, which could potentially increase the demand on offshore connections and decrease it on the onshore ones. To examine if this is actually the case, the moment histories have been calculated directly from the experimental measurements and will be presented in this section.
Figure 12 shows a free-body diagram of the deck alone as well as the deck together with the bent-cap, in order to assist the calculation of the overturning moment at the level of the bearings and the level of the column-bent cap connections. In reality the tsunami load applies transient pressures on different locations of the bridge and the applied horizontal and vertical tsunami loading changes both spatially and temporally during the inundation process. However, at each instant the applied tsunami moment shall be equal to the reaction moment in the connections plus the rotational inertia and damping force of the system in order to satisfy equilibrium. If the inertia and damping forces are assumed to be negligible, then the applied moment will be equal to the reaction one. The latter moment can be calculated using the reaction forces and moments in the bearings (or in the bent-cap connections) as shown in Equation (5).
Moment = −(Fh1 + Fh2 + Fh3 + Fh4) ×Lz + Fv1×L1 + Fv2×L2 − Fv3×L3 − Fv4×L4 + ΣMi
In this equation Fh1 + Fh2 + Fh3 + Fh4 is equal to the horizontal force recorded in the links, Fvi is the vertical force recorded in bearing i, Li = horizontal distance of bearing i from the point about which the moment is calculated, Lz = vertical distance of the center of the load cells from the point about which the moment is calculated and ΣΜi is equal to the sum of the reaction moments (M1, M2, M3, M4). Since the connection moments are expected to be small they could be neglected, in which case the applied moment is estimated directly from the experiment. It is noteworthy that the moment was also calculated using the measurements in the load cells below the bent cap and then compared with the moment calculated using the bearing measurements and good agreement was observed, as shown in [23] increasing the confidence in the calculated moment histories. These histories are plotted in Figure 13 together with the total horizontal and vertical forces, for selected solitary waves and bores. From the figure it becomes apparent that:
- Significant clockwise moment is generated at the instant of the first impact of the wave on the offshore face of the bridge. This moment is reduced as the wave propagates through the bridge and later on it becomes counter-clockwise.
- Although the forces can be maximized at different instants during the deck flooding, the moment is always maximized at the initial impact of the wave on the offshore girder and overhang for both wave types.
- The maximum overturning moment and maximum bridge uplift do not occur at the same time for many of the tested waves in the experiment. The existence of this significant overturning moment could possibly explain why for the solitary wave of H = 0.70 m although the maximum total uplift force occurs when the wave has flooded all the chambers, the maximum uplift in the offshore bearings occurs at the time of the initial impact.
The time-histories revealed the existence of a significant OTM, however in order to understand its significance for the bridge bearings and connections, further investigation is needed. To that end, the maximum recorded uplift forces in each bearings are plotted in Figure 14 relative to the maximum recorded total tsunami uplift and the maximum OTM, revealing that:
- The offshore bearings do not have a good correlation with the maximum recorded total uplift (R2 = 0.62), and in some cases a larger total uplift gives a smaller uplift in the bearings, which seems counter-intuitive. Instead, the uplift in these bearings is better correlated with the maximum clockwise moment (R2 = 0.83). This is a major finding and it seems to make sense if one considers the observations made in previous sections, according to which the uplift force in the offshore bearings was always maximized at the first impact of the wave on the bridge, while the maximum total uplift on the deck was maximized at different instants of the inundation process depending on the wave height.
- The bearings of the internal girders (G2 and G3) are showing good correlation with the maximum uplift on the deck, with G2 having the best agreement among all bearings (R2 = 0.926). For both of these bearings the correlation with the max clockwise moment is poor, indicating that the moment does not govern tsunami-induced uplift at these locations.
- Generally, as the horizontal distance of the bearings from the offshore face of the bridge increases, the agreement of the individual bearing uplift with the maximum clockwise moment weakens, and for the onshore bearings there is no apparent correlation (R2 = 0.33). The onshore bearings also seem to have a weaker correlation with the maximum total uplift than the bearings of the internal girders, demonstrating that predicting the maximum uplift in these bearings might be more complex than expected.
To investigate whether the overturning moment is the reason behind the large uplift in the offshore bearings, it was decided to modify the simplified method, which applied the total maxFh and maxFv at the CG of the deck, and include the maximum clockwise moment Mmax (assuming they all occur simultaneously) to see if a better prediction of the uplift forces in the bearings and connections could be achieved.
Using these equations, the maximum uplift in each bearing was calculated and then compared with the experimentally measured values. Table 4 presents the ratios of the estimated to the measured maximum uplift in all bearings and columns. As shown, the improved simplified method with the applied moment gives conservative uplift forces for bearings G2 and for the offshore and center columns. For the offshore columns the method gives an overestimation of 16% in average and 41% maximum. For the offshore bearings the method gives an overestimation of 4% on average, and a difference between −11% and +29% relative to the measured values. It is worth noting that the simplified approach of considering only maxFh and maxFv without the moment gave under-prediction of the uplift force in the offshore bearings by 30% on average and a difference between −59% and −1% relative to the measured values. This provides concrete evidence regarding the significance of the tsunami-induced overturning moment and suggests that the simplified method presented previously most likely did not accurately estimate the demand on the components because it did not properly simulate the overturning moment. Although the inclusion of the moment gives much better results for most of the bearings and columns, it still cannot predict the uplift forces on all connections and, particularly, bearings G3, G4 and the offshore column.
These findings will have significant implications for the development of tsunami resilient bridges and design guidelines because they demonstrate the necessity to develop methodologies that will be able to predict not only the maximum total applied tsunami forces, which have been the focus of most of the research studies available in the literature, but also the overturning moment in order to accurately calculate the demand on individual structural components.
5. Tsunami Demand Diagrams
In contrast to other extreme natural hazards such as earthquakes (EQs), where the applied loading in one direction is dictating the demand on the structural components of a bridge (e.g., for EQs the horizontal inertia forces are dictating the demand), for tsunamis this is not the case. In fact, as shown in previous sections of this paper, tsunami-like waves apply simultaneously large forces both in the horizontal (Fh) and vertical (Fv) direction as well as an overturning moment (OTM). This could possibly explain why so many bridges in the 2011 Great East Japan Earthquake were able to withstand the earthquake shaking but were damaged by the following tsunami. The time-histories of Fh, Fv and OTM gave an insight into the transient nature of the tsunami inundation mechanism and the temporal variation of the induced effects; however, due to the complexity of the phenomenon and its dependence on the wave type and wave height it is hard to decipher the physics involved and reach general conclusions. Hence, in an attempt to develop a more comprehensive understanding of the tsunami-induced effect the recorded forces and the moment were plotted against each other, developing what will be called in this paper “tsunami demand diagrams”. Such diagrams are shown in Figure 15 and Figure 16, with the former figure showing the total recorded horizontal force versus the total vertical force and the latter one showing the overturning moment versus the total vertical force. It should be stated that the concept of such a diagram is not new for structural engineers, who for decades have used interaction diagrams of axial force and moment as a means for determining the capacity of reinforced concrete columns.
Figure 15 and Figure 16 demonstrate a complex temporal variation of Fh versus Fv as well as OTM versus Fv (blue color in the graphs), which is different for each wave height, making it very challenging (if not impossible) to predict this transient behavior via simplified approaches. Alternatively, it could be simpler and more practical to develop envelopes of Fh versus Fv and OTM versus Fv and get a sense of the maximum demand. To that end, the experimental results were further analyzed in Matlab [39] and three different envelopes with different refinement levels (refined, medium, simplified) were developed using the “boundary” function. This function was preferred over the “envelope” function available in Matlab because it allows the specification of a shrink factor s in order to adjust the compactness of the generated boundary. For example, for s = 0 the function will yield the convex hull while for s = 1 the result will be a compact boundary that envelopes the points. Therefore, the strict definition of the technical term “envelope” used in engineering, would require an s = 1. For the “Env-refined” shown in the figures an s value equal to 0.95 was used, which is close enough to 1 and computationally less expensive. For the other two boundaries “Env-medium” and “Env-simplified” the selected value for s was 0.25 and 0.05 respectively. Figure 15 and Figure 16 demonstrate that:
- For most solitary waves, the maximum horizontal force and maximum uplift force occur at the same time, while for most bores the two maxima do not coincide (Section 3).
- All waves introduce significant clockwise moment (positive value on graph) and simultaneously large uplift loading, however for most wave heights the maxOTM does not take place at the same instant with maxFv. This implies that for the tsunami design of bridges engineers will have to consider several load cases (e.g., maxOTM with corresponding Fv and Fh or maxFv with corresponding OTM and Fh) in order to identify the worst-case scenario for each component.
- For all wave heights a large counter-clockwise moment is generated during the inundation, which was not expected beforehand. In fact, for solitary waves at the instant of the maximum counter-clockwise moment the wave applies a downward vertical load, while for bores this is not true and significant uplift is observed instead.
- The refined envelopes (red color) of Fh versus Fv and OTM versus Fv are quite complex and their shapes have significant differences between waves indicating a dependence on the wave height and wave type. However, as the envelope becomes less refined then similarities start appearing between the different heights. Especially, the simplified envelopes (Env-simplified) of Fh versus Fv and the ones of OTM versus Fv have very similar shapes among different bore heights. This tends to be true for the unbroken solitary waves too but the similarities are not as striking.
It is noteworthy that these 2D demand diagrams add to the understanding of the tsunami-induced loading. However, they are expected to have a direct application in engineering practice only for cases where the design of the connections and structural components depends on two of the three parameters (Fh, Fv, OTM). For example, the 2D diagrams could potentially be used for the design of bridges with elastomeric bearings and shear keys because in such cases the shear keys would be designed to take the horizontal load and the elastomeric bearings would be designed for the uplift load using the OTM versus Fv demand diagrams. For other types of bridges though, such as the ones with steel bearings, where the bearings have to withstand both the horizontal and vertical loading, 3D demand diagrams that represent combinations of (Fh, Fv, OTM) would have to be used.
In this study three different sets of 3D demand diagrams have been developed for each wave height using the exact same values of the scalar factor s used in the 2D diagrams, and the simplified envelope is presented in Figure 17 for several wave heights. In the 3D case the “boundary” function in Matlab returns a triangulation representing a single conforming 3-D boundary around the points (Fh, Fv, OTM). As observed in the graph, all simplified 3D demand diagrams have diamond-like shapes and the ones of the bores have similarities in shape but are different in magnitude for most wave heights. This also seems to be true for the solitary waves. It could be argued that in the same way that simplified 3D analytical interaction diagrams (N, Mx, My) have been developed in the past for estimating the capacity of RC concrete sections by determining just a few points on the diagram, a similar thing could be done for estimating the tsunami-induced loading in terms of (Fh, Fv, OTM). These findings are advancing the understanding of the tsunami-induced loading on bridges and are expected to have significant implications for the tsunami design of bridges because they demonstrate:
- The existence of fundamental differences in the effects introduced on the bridge by the two different wave types, which suggests the need for the development of methodologies that will be able to predict the exact wave type at a particular bridge location.
- The need to consider different load cases/combinations of (Fh, Fv and OTM) and not just maxFh and maxFv as done to date, since it is not a priori known which case will be governing the design of individual structural components of the bridge.
- The possibility to develop simplified 2D demand diagrams (Fh versus Fv, OTM versus Fv) or simplified 3D diagrams (Fh versus Fv versus OTM), which will have the same shape for all bores and a size that will change with the wave height. Once the shape is known then simplified predictive equations could potentially be developed for estimating the magnitude. This approach sounds quite futuristic for the time being; however, it is simpler than trying to predict both the spatial and temporal variation of the applied forces. Such an approach would be less economical but more convenient. Given the uncertainties involved in the tsunami wave breaking and impact on structures, some conservatism in the method that estimates the tsunami-induced loading on the structure might be acceptable.
6. Tsunami Inundation Mechanism of Bridges
The detailed analysis of the experimental data presented in the previous sections has demonstrated the complexity of the tsunami-induced loading. To decipher this complexity it is essential to understand the physical phenomenon that generates the loading. To this end, video recordings were processed and selected snapshots are presented in Figure 18. These snapshots show that after the wave impact on the offshore girder and overhang, part of the wave propagates below the deck flooding the chambers (as indicated by the air and water that escapes from the sides of the bridge), while the top part of the wave that hits the front face starts splashing, breaking and slamming on the top of the bridge deck until it inundates it. Interestingly, it is revealed that the wave propagates below the deck (and floods the chambers) faster than it moves above the deck, probably due the fact that the overtopping process is delayed by the splashing. This could explain why the vertical force histories exhibit first a significant uplift force followed by a downward one.
To decipher the bridge inundation mechanism and induced effects, it was critical to relate the experimental data from load cells, pressure gages and ultrasonic gages at different locations of the bridge. Figure 19 shows the locations of five ultrasonic gages, with two of them (uswg1 and uswg5) recording the wave height slightly before and after the bridge location (at a horizontal distance of 0.92 m and 0.82 m from the nearest bridge point respectively), and the other three gages recording the water height that overtops the deck. Moreover, the same figure shows the location of all pressures gages, with several gages recording the pressure on the girders (in the horizontal direction), below the offshore overhang of the bridge (P10), and below the deck in chambers 1, 2 and 3 (P11, P12 and P13 respectively). The recorded pressures and water height histories were normalized with their respective maximum values and are plotted in Figure 20 together with the force and overturning moment histories. In particular, the graph with the forces depicts the vertical forces in each bearing, the total induced horizontal and vertical force as well as the moment, while the graph with the normalized pressures shows the pressures below the deck at different locations starting from the offshore overhang and continuing with the chambers in order to get a sense about the spatial variation of the applied loading and location of the wave during its propagation through the bridge. Simultaneous examination of these three graphs reveals the existence of four main phases in the bridge inundation mechanism, as described below:
- Phase 1: This is a short duration phase during which the bridge experiences significant impulsive horizontal and vertical forces and occurs when the wave hits the offshore girder and overhang. This phase produced the maximum horizontal force for all bores and the maximum overturning moment, generating an uplift and a downward force in the offshore and onshore bearings respectively. Due to the simultaneously large uplift force and moment, this phase produces the largest uplift in the offshore bearings meaning that it could be the most catastrophic phase for the offshore structural components (bearings, connections, columns etc.).
- Phase 2: This is a longer duration phase that starts when the wave reaches chamber 1 and finishes when the wave has inundated chamber 2 of the bridge, at which point the uplift force is applied close to the CG of the deck. During this phase the overtopping process begins, with the tip of the wave splashing over the top of the offshore overhang. In this phase, the applied moment is small, however the bridge uplift force is very large and for some wave heights it can actually reach its maximum value. In this phase all bearings are in phase witnessing uplift forces, and the bearings of the interior girders (G2 and G3) are reaching their maximum uplift values for most waves. This phase can also produce the largest horizontal force for solitary waves, however this is not true for bores, the horizontal force of which is reduced significantly since the slamming component is minimized and only the hydrodynamic (drag) component remains.
- Phase 3: This phase occurs when the wave has reached chamber 3. During this phase the tip of the wave starts inundating the offshore side (uswg2) of the top surface of the deck and towards the end of the phase the water reaches the onshore side (uswg4). In this phase the horizontal force is reduced for all wave types, the vertical force is large -can even be at a maximum- and there is a counter-clockwise moment, which generates the largest uplift force in the onshore bearings. Therefore, this phase has to be considered because it is the governing one for the onshore bearings. It must be noted though that this phase is different for bores and solitary waves because the former waves introduce the maximum counter-clockwise moment in this phase, while this is not true for the latter waves.
- Phase 4: This phase occurs after the wave has passed the onshore chamber, the whole top surface of the deck becomes inundated and the overtopping water introduces large downward pressures on the deck (at P14). The slamming downward force on the deck is so high that it exceeds the simultaneously applied uplift force below the deck, consequently introducing compression in all bearings. This phase also produces the maximum counter-clockwise moment for all solitary waves.
The four phases are illustrated in Figure 21, which shows a schematic of the applied pressures, the direction of the vertical forces in the bearings (brown and green arrows), and the direction of the total forces and the overturning moment. Special attention should be given to Phase 1, which has been neglected to date because it introduced the largest tension in the offshore bearings for most waves. This is of utmost significance because it indicates that if the offshore bearings exceed their tensile capacity in Phase 1 due to the significant overturning moment and uplift load and get damaged, then the uplift loads would be redistributed to the remaining bearings with the possibility of leading to a progressive collapse mechanism that will eventually result in the washout of the bridge. Moreover, Phase 3, which has also not been investigated in previous research studies should also be considered in order to accurately estimate the uplift demand on the onshore bearings, columns and connections. The characteristic counter-clockwise moment generated in Phase 3 can also explain the observations made in previous sections according to which the onshore column-bent cap connections were seen to be getting larger uplift forces than the center ones for many of the tested wave heights.
As discussed in the literature review, most of the studies to date have focused on total uplift forces caused by tsunamis and hurricanes. However, the experimental results presented herein are indicating that the total uplift forces alone cannot sufficiently describe the effects on coastal bridges. The reason is the fact that the maximum total uplift can occur either in phase 1, 2 or 3; however, if the maximum occurs in phase 1 then the vertical force is distributed mainly to the four bearings of the first two girders (for the four-girder bridge examined herein), while if it occurs in phase 2 or 3 then the uplift force is distributed to all eight bearings of the girders. This is demonstrated in Figure 22, which depicts the vertical forces recorded in the four bearings at different time-instants. In general, the experimental data reveal that the maximum total uplift force does not necessarily correspond to the maximum uplift forces in all bearings. Therefore, the focus of future research studies should be the forces in the connections and other members of the bridge.
7. New Physics-Based Simplified Methodology for Engineering Practice
One methodology to accurately capture the transient tsunami effects would be the development of time-histories of total horizontal and vertical forces as well as moment. A less sophisticated methodology -presented in Section 5 of this paper- would be the development of tsunami demand diagrams either 2D or 3D ones. This method would be less accurate and economical than developing time-histories but will require less input parameters consequently increasing its practicality. An even simpler methodology would be the determination of several sets of forces with corresponding moments (Fhi, Fvi, OTMi for set i) or with corresponding locations of application (Fhi, locFhi, Fvi, locFvi), which were seen in the experiments to be producing the largest demand on different structural components.
This section will focus on the development of such a simple and practical methodology for predicting the tsunami-induced demand on bearings, columns and connections. To achieve the highest possible accuracy the method will be based on the physics involved in the inundation process of the bridge and all the findings presented in previous sections of this paper. The method will have to be able to simulate the tsunami loading and the generated overturning moment and ideally relate to the 4 phases of the bridge inundation mechanism. Given the fact that the uplift forces in (a) offshore bearings are maximized in Phase 1, (b) bearings G2 are maximized in Phase 1 or 2, (c) bearings G3 are maximized in Phase 2, and (d) bearings G4 are maximized in Phase 2 or 3, the method will have to use different load cases. Last but not least, since the objective of the method is the direct application in engineering practice and previous research studies have already developed equations for the prediction of the maximum total horizontal load (maxFh) and maximum uplift load (maxFv), the ideal case in terms of simplicity would be achieved if the improved method would require only maxFh and maxFv as input parameters. After several iterations and examined approaches, an improved physics-based methodology that meets all the above requirements was developed herein and is shown in Figure 23. The method consists of 3 load cases, which are described below:
- Load Case 1: In this case the maximum horizontal force is applied at the mid-height of the offshore girder and the maximum vertical force is applied at the mid-width of the offshore overhang, with the aim to represent Phase 1 of the inundation mechanism and the associated large overturning moment. This load case is expected to give the largest uplift forces in the offshore bearings, columns and connections. The experimental results demonstrated that it is more reasonable to apply the horizontal load at the mid-height of the girder, instead of the mid-height of the bridge or the CG of the deck, since as seen in [23] the recorded pressures histories on the offshore girder at Hgirder/3 and 2Hgirder/3 are simultaneously large in Phase 1, while the pressure on the offshore face of the overhang is maximized much later. It must be clarified though that this is limited only to bridges without barriers (rails) or barriers with perforations that do not have a significant effect on the total horizontal load. This situation might be different for solid barriers and for such a case further investigation is required.
- Load Case 2: In this load case the maximum uplift force is applied at the mid-width of chamber 1, while a reduced horizontal load is simultaneously applied at the mid-height of girder G2. The intent for this load case is to capture the effects associated with phase 2 of the inundation mechanism during which the wave could be reaching either chamber 1 or chamber 2. Therefore, the horizontal load is reduced (Fh = a×maxFh) using a calibrated factor that accounts for the observed trends in the recorded time-histories, which showed that for all bore heights and several solitary wave heights the horizontal load was reduced after the initial impact on the offshore girder. A factor a = 0.85 was seen to give reasonable results, however it must be noted that this number is not intended to be conservative in terms of estimating the horizontal force for all solitary waves, since in the experiments some large solitary waves (e.g., H = 0.70 m) showed continuously large horizontal forces during the whole inundation process, so for such waves a = 1 could be used. This load case will generate a smaller overturning moment than load case 1 and could possibly give a more accurate estimation of the uplift forces in bearings G2.
- Load Case 3: For load case 3 the maximum uplift force is applied at the mid-width of the onshore chamber 3 together with a reduced horizontal load (Fh = b×maxFh). The objective of this load case is to capture the maximum uplift in bearings G3 and G4, which were seen to be governed by the reverse overturning moment for most wave heights. In this study three values of the reduction factor “b” were examined and particularly b = 0, b = 0.5 and b = 0.65. The zero value would mean that the horizontal load is totally neglected leading to a larger counter-clockwise moment than the one generated by the other two values, and a conservative estimation of the uplift load in bearings G3 and G4.
This physics-based methodology was applied using the experimentally recorded maximum total horizontal force (maxFh) and maximum total uplift force (maxFv) together with Equations (1)–(4) in order to calculate vertical forces in the bearings and the column-bent connections. The ratios of the calculated to the experimentally measured connection forces for Load Cases 1, 2 and 3 are summarized in Table 5, Table 6 and Table 7 respectively.
As shown in Table 5, load case 1 estimates uplift forces in the offshore bearings that are conservative for all wave heights apart from two, for which however the predicted force is within 6% from the measured value. For the offshore bearings, this load case gives an over-prediction of 33% on average, demonstrating that the method can conservatively estimate the demand on the offshore connections. For bearings G2 and col. 2 (center) the over-prediction is even more significant with an average value of 66% and 87% respectively. A possible reason for the larger overestimation of the uplift forces in bearings G2 and col. 2 relative to the respective overestimation of the offshore connections, might be the rigid assumption made in Equations (1)–(4), which results in a linear distribution of the uplift force in the connections. On the other hand, Figure 22 showed that the experimentally measured distribution is not linear at the instant the uplift force in the offshore bearings is maximized. Therefore, future work should focus on the development of a 3D numerical model of the bridge that will simulate the actual stiffness of all bridge components and more accurately capture the distribution of the uplift in the connections. Nonetheless, the table shows that load case 1 tends to provide conservative estimates of the uplift demand in bearings G1 and G2 and columns 1 and 2, but fails to capture the respective demand in the rest of the bearings and columns.
The closer location of maxFv to the CG of the bridge in load case 2, and the corresponding smaller overturning moment, is probably the reason this load case fails to predict the uplift in the offshore bearings and columns, but it does give good estimates for bearing G2 and the center column (col. 2). In fact this load case provides a more accurate estimate of the uplift demand in the latter bearing and column than load case 1, by over-predicting on average by 38% and 55%, instead of 66% and 87%, the uplift forces in bearings G2 and col. 2 respectively. Therefore, this load case could be used for the design of bearings G2 and col. 2.
None of the above two load cases could estimate the uplift in the onshore bearings and columns or in bearings G3, however as shown in Table 7, load case 3 can successfully achieve that. If b = 0 then a conservative estimation of the counter-clockwise moment is made, which results in over-prediction of the uplift forces in bearings G3 and G4 and col. 3 by 52%, 156% and 111% on average respectively. Interestingly, this average value is driven by two of the smaller wave heights with H = 0.42 m and H = 0.46 m (over-prediction of uplift in G4 by 379% and 428%, respectively), which can reach the deck but lose energy after the initial impact on the overhang and offshore girder, and by the time they reach chamber 3 they do not apply significant uplift and consequently counter-clockwise moment. If these two outliers are not included in the calculation the average over-prediction is reduced. An alternative approach to neglecting the total horizontal force (b = 0) is to consider it reduced down to 0.5×maxFh or 0.65×maxFh. The 0.65 factor is an empirical value and is in agreement with trends seen in the experimentally measured bore forces. Although not shown in the table, the 0.65 value yields uplift forces in bearings G3 and G4 that are closer to the measured ones, with the overestimation being 29%, 106% and 25% for bearings G3 and G4 and col. 3 respectively; however, it under-predicts the uplift in the onshore columns for three waves with maximum under-prediction of 35%. Therefore, in order to reduce the under-prediction a value of b = 0.5 was also examined and the results (Table 7) showed an overestimation of 40%, 118% and 45% for bearings G3 and G4 and col. 3 respectively, and an under-prediction of the uplift in the onshore columns only for two waves, which was 13% and 5%. This demonstrates that engineers could use b = 0.5 for getting more reasonable values of the uplift demand and b = 0 for a conservative design.
It must be noted that as more research studies will be conducted in the future and more information will be generated, the actual values of factors “a” and “b” used in Load Cases 2 and 3 might change so as to result in more accurate estimation of uplift demands and economical designs of structural components. Moreover, some of the assumptions made in the current methodology e.g., the application of maxFv in all three phases, might also be improved and for each load case different magnitudes of the vertical force could be applied. The recommended load cases and factor values are intended for open girder bridges; however, the framework could be adjusted for other types of bridges such as bridges with diaphragms or box-girder bridges, as well as other types of elevated coastal structures such as jetties and wharves or even offshore platforms. Last but not least, it must be clarified that (a) these load cases were seen to give reasonable results for a rigid bridge assumption, however in future studies they will have to be calibrated and used in 3D structural models that will properly simulate the stiffness of all structural components, and (b) the intent of this method is to estimate the uplift demand in individual components and connections assuming that maxFh and maxFv are known parameters. Ongoing and future work of this research team will focus on evaluation, calibration and refinement of predictive equations for maxFh and maxFv.
8. Conclusions
This paper has presented a comprehensive analysis of data obtained during large-scale hydrodynamic experiments of tsunami waves impacting an I-girder bridge with cross-frames. Results obtained have improved the understanding of the tsunami impact and bridge inundation mechanism as well as the associated connection forces between the super- and sub-structures of these bridges. In contrast to the majority of published papers in the field, which focus on maximum total horizontal and vertical forces, this study has focused on forces in individual structural components in order to obtain insight into the temporal and spatial variation of tsunami-induced loading. The main purpose of this paper is to draw attention to bearing, column and connection forces, understand how they are related to wave impact, decipher the inundation process of the deck for unbroken solitary waves and bores, and develop methodologies for the estimation of tsunami demand on components. From the work presented herein it is concluded that:
- Bores introduce a significant, short-duration impulsive (slamming) force followed by a longer duration lateral force with significantly reduced amplitude. This is not the case for unbroken solitary waves. However, both types of waves apply a distinct short-duration impulsive uplift force when the wave hits the offshore overhang followed by (a) a longer duration uplift force as the chambers of the bridge flooded, and (b) a downward force as the deck is inundated.
- The maximum of the horizontal (Fh) and vertical (Fv) forces did not always occur at the same point of the flooding process nor did they coincide in time for all waves, and in fact the horizontal loading was seen to be reduced to 60% of its maximum value at the instant the uplift force was maximized. This demonstrates the transient nature of the tsunami inundation mechanism and its complexity, as well as the need to predict time-consistent vertical and horizontal forces in order to achieve an economical tsunami bridge design.
- The uplift forces in individual bearings and column-bent connections are maximized at different instants of the flooding and overtopping process and have different magnitudes, with the offshore components having to withstand the majority of the total deck uplift, reaching as high as 91% of maxFv for unbroken solitary waves and 96% for bores, with average values being 78% and 70% for the two wave types respectively. Similarly, for the same wave types, the offshore columns are subject to an average of 82% and 94% of maxFv, while for some wave heights the uplift demand can be up to 124% of maxFv, which seems counter-intuitive.
- The maximum uplift force individual bearings and columns do not necessarily coincide with the maximum applied uplift on the deck. This is a major finding because it indicates that the maximum total uplift on the deck might not result in the “worst case” scenario (largest demand) for every structural component, suggesting that the current approach of using the total tsunami force as the sole measure of tsunami demand might not be sufficient.
- The concurrent application of the maximum total horizontal and maximum uplift loading at the CG is not conservative for most bearing and column connections, in contrast to conventional wisdom. The reason behind this observation is the generation of a significant OTM, which has not been fully understood to date. This moment is always maximized at the initial impact of the wave on the offshore girder and overhang, and together with the concurrently large applied uplift force is causing the significant uplift demand on offshore connections and components.
Due to the complex temporal and spatial variation of the tsunami-induced loading, which results in variable effects on individual bearings, it is not possible to identify a priori the combinations of Fh and Fv with corresponding locations of application or corresponding moment that will govern the demand in each connection and structural component. To address this issue, the paper presents “tsunami demand diagrams”, which are 2D envelopes of (Fh, Fv) and (OTM, Fv), and 3D envelopes of (Fh, Fv, OTM). The demand diagrams together with the time-histories revealed significant differences in the patterns of horizontal and vertical forces, as well as the overturning moment between the unbroken solitary waves and bores, indicating that the physics governing the wave impact and induced effects on the bridge are different for the two wave types. This suggests the need to develop methodologies that will be able to predict the wave type expected at a specific bridge location, in order to design the connections safely and without undue conservatism.
Another topic of investigation in this paper was the tsunami inundation mechanism of bridges, which consisted of four main phases, from the time of the initial impact to the full overtopping of the bridge. Among these four phases, there exists a (a) short duration phase with large impulsive horizontal and vertical loads, and occurs when the wave hits the offshore girder and is trapped momentarily under the offshore overhang, generating the maximum horizontal bore forces, the maximum overturning moment and maximum uplift in the offshore bearings and column connections; (b) a longer duration phase that starts when the wave reaches chamber 1 and finishes when the wave has flooded the center chamber of the bridge, at which point the OTM is small but the total deck uplift force is maximized (for several waves) and is distributed to all bearings and all columns, governing the design of the center ones, and (c) a phase that occurs when the wave reaches the onshore chamber, at which point the uplift load is large and significant counter-clockwise moment is generated, introducing the largest uplift force in the onshore bearings, columns and connections for most waves. Based on the bridge inundation mechanism, a new physics-based methodology was developed for providing conservative estimates of uplift demand in each connection. The practicality of this methodology lies in the fact that it uses as an input only (a) two parameters -maxFh and maxFv- for which several predictive equations are available in the literature, and (b) two factors that have been calibrated based on the experimental results presented herein.
The findings in this paper indicate the need for a paradigm shift in the assessment of tsunami risk to coastal bridges to include not just the estimation of total tsunami load on a bridge but also the distribution of this load to individual structural components that are necessary for the survival of the bridge. It is acknowledged though that the findings presented in this paper are limited to bridges with four open girder lines with cross-frames, eight steel bearings, and no hand rails or crash barriers. Moreover, the findings might be limited by the assumptions made in the simplified methodology and particularly the fact that (a) the deck is assumed to be rigid, (b) the reactive moments in the steel bearings and in the column-bent connections are assumed to be zero, and (c) inertia and damping effects are not considered. Future studies should address these limitations and could attempt to expand the methodologies presented herein to other types of bridges or coastal decks, such as jetties.
Author Contributions
I.G.B. and D.I. conceived the need to more rigorously examine the hydraulic demand on connections and components in bridge superstructures during tsunami overtopping than had been done in the past, and designed and executed the large-scale experiments described in this paper. D.I. conducted the in-depth analyses of the experimental data, developed the technical content presented in this paper and wrote the first draft, while I.G.B. provided advice, feedback and editing of the paper. P.L. and S.Y. assisted with the design and conduct of the experiments, reviewed the current manuscript, and provided feedback.
Funding
The hydrodynamic experiments and a portion of the analyses presented in this paper were funded by the Federal Highway Administration (FHWA) under Contract No. DTFH61-07-C-00031, “Improving the Seismic Resilience of the Federal-Aid Highway System”, awarded to Ian Buckle, PI. The development of the physics-based methodology for estimating connections forces and the preparation of this manuscript was funded by the Oregon Department of Transportation (ODOT) under Contract No. 32399, “Verification of Tsunami Bridge Design Equations” awarded to Ian Buckle, PI, and Denis Istrati, Co-PI.
Acknowledgments
During the FHWA-funded project, technical guidance was provided by the following FHWA Representatives of the Contracting Officer (COR): Wen-huei (Phillip) Yen, Fred Faridazar and Sheila Duwadi. During the ODOT-funded project, research coordination was provided by Jon Lazarus and technical guidance was given by Bruce Johnson and Albert Nako from ODOT. The authors also recognize Tao Xiang, Anastasia Bitsani, Patrick Laplace, Chad Lyttle, Todd Lyttle, Tim Maddux, Alicia Lyman-Holt, James Batti, Jeff Gent for their technical assistance during the experiments. Moreover, the authors wish to thank Daniel Cox and Chris Higgins for agreeing to the author’s modification and upgrade of their experimental setup so it could be used for the tsunami experiments described in this paper. Last but not least, the authors appreciate the assistance provided by Information Technology at UNR and access to the HPC resources necessary to run the advanced CFD and FSI numerical analyses for the hydrodynamic design of the experiments.
Conflicts of Interest
The authors declare no conflict of interest.
References
- Unjoh, S. Bridge damage caused by tsunami. Jpn. Assoc. Earthq. Eng. 2007, 6, 6–28. [Google Scholar]
- Maruyama, K.; Tanaka, Y.; Kosa, K.; Hosoda, A.; Arikawa, T.; Mizutani, N.; Nakamura, T. Evaluation of tsunami force acting on bridge girders. In Proceedings of the Thirteenth East Asia-Pacific Conference on Structural Engineering and Construction (EASEC-13), Sapporo, Japan, 11–13 September 2013. Keynote-Lecture. [Google Scholar]
- Kosa, K. Damage analysis of bridges affected by tsunami due to Great East Japan Earthquake. In Proceedings of the Symposium on Engineering Lessons Learned from the 2011 Great East Japan Earthquake, Tokyo, Japan, 1–4 March 2012. [Google Scholar]
- Kasano, H.; Oka, J.; Sakurai, J.; Kodama, N.; Yoda, T. Investigative research on bridges subjected to tsunami disaster in 2011 off the pacific coast of Tohoku earthquake. In Australasian Structural Engineering Conference 2012: The Past, Present and Future of Structural Engineering; Engineers Australia: Barton, Australia, 2012; p. 51. [Google Scholar]
- Kawashima, K. Damage of bridges due to the 2011 great east japan earthquake. In Proceedings of the International Symposium on Engineering Lessons Learned from the 2011 Great East Japan Earthquake, Tokyo, Japan, 1–4 March 2012. [Google Scholar]
- Lau, T.L.; Ohmachi, T.; Inoue, S.; Lukkunaprasit, P. Experimental and numerical modeling of tsunami force on bridge decks. In Tsunami-a Growing Disaster; InTech: London, UK, 2011. [Google Scholar]
- Hayashi, H. Study on tsunami wave force acting on a bridge superstructure. In Proceedings of the 29th US-Japan Bridge Engineering Workshop, Tsukuba, Japan, 11–13 November 2013. [Google Scholar]
- Seiffert, B.; Hayatdavoodi, M.; Ertekin, R.C. Experiments and computations of solitary-wave forces on a coastal-bridge deck. Part I: Flat plate. Coast. Eng. 2014, 88, 194–209. [Google Scholar] [CrossRef]
- Hayatdavoodi, M.; Seiffert, B.; Ertekin, R.C. Experiments and computations of solitary-wave forces on a coastal-bridge deck. Part II: Deck with girders. Coast. Eng. 2014, 88, 210–228. [Google Scholar] [CrossRef]
- Bozorgnia, M.; Lee, J.J.; Raichlen, F. Wave structure interaction: Role of entrapped air on wave impact and uplift forces. Coast. Eng. Proc. 2011, 1, 57. [Google Scholar] [CrossRef]
- Yim, S.C.; Boon-intra, S.; Nimmala, S.B.; Winston, H.M.; Azadbakht, M.; Cheung, K.F. Development of a Guideline for Estimating Tsunami Forces on Bridge Superstructures; Report No. OR-RD-12-03; Oregon Department of Transportation: Salem, OR, USA, 2011. [Google Scholar]
- Kataoka, S.; Kaneko, M. Estimation of wave force acting on bridge superstructures due to the 2011 Tohoku Tsunami. J. Disaster Res. 2013, 8, 605–611. [Google Scholar] [CrossRef]
- Nakao, H.; Zhang, G.; Sumimura, T.; Hoshikuma, J. Numerical assessment of tsunami-induced effect on bridge behavior. In Proceedings of the 29th US-Japan Bridge Engineering Workshop, Tsukuba, Japan, 11–13 November 2013. [Google Scholar]
- Bricker, J.D.; Nakayama, A. Contribution of trapped air deck superelevation, and nearby structures to bridge deck failure during a tsunami. J. Hydraul. Eng. 2014, 140, 05014002. [Google Scholar] [CrossRef]
- Azadbakht, M.; Yim, S.C. Simulation and estimation of tsunami loads on bridge superstructures. J. Waterw. Port Coast. Ocean Eng. 2014, 141, 04014031. [Google Scholar] [CrossRef]
- Istrati, D.; Buckle, I.G. Effect of fluid-structure interaction on connection forces in bridges due to tsunami loads. In Proceedings of the 30th US-Japan Bridge Engineering Workshop, Washington, DC, USA, 21–23 October 2014. [Google Scholar]
- Fu, L.; Kosa, K.; Sasaki, T. Tsunami damage evaluation of utatsu bridge by video and 2-d simulation analyses. J. Struct. Eng. 2013, 59, 428–438. [Google Scholar]
- Kawashima, K.; Buckle, I. Structural performance of bridges in the tohoku-oki earthquake. Earthq. Spectra 2013, 29, S315–S338. [Google Scholar] [CrossRef]
- Araki, S.; Ishino, K.; Deguchi, I. Stability of girder bridge against tsunami fluid force. Coast. Eng. Proc. 2011, 1, 56. [Google Scholar] [CrossRef]
- Rahman, S.; Akib, S.; Shirazi, S.M. Experimental investigation on the stability of bride girder against tsunami forces. Sci. China Technol. Sci. 2014, 57, 2028–2036. [Google Scholar] [CrossRef]
- Maruyama, K.; Hosoda, A.; Tanaka, Y.; Kosa, K.; Arikawa, T.; Mizutani, N. Tsunami force acting on bridge girders. J. JSCE 2017, 5, 157–169. [Google Scholar] [CrossRef]
- Mazinani, I.; Ismail, Z.; Hashim, A.M.; Saba, A. Experimental investigation on tsunami acting on bridges. Int. J. Civ. Archit. Struct. Constr. Eng. 2014, 8, 1040–1043. [Google Scholar]
- Istrati, D. Large-Scale Experiments of Tsunami Inundation of Bridges Including Fluid-Structure-Interaction. Doctoral Dissertation, University of Nevada, Reno, NV, USA, May 2017. [Google Scholar]
- Hoshikuma, J.; Zhang, G.; Nakao, H.; Sumimura, T. Tsunami-induced effects on girder bridges. In Proceedings of the International Symposium for Bridge Earthquake Engineering in Honor of Retirement of Professor Kazuhiko Kawashima, Tokyo, Japan, 15 March 2013. [Google Scholar]
- Martinelli, L.; Lamberti, A.; Gaeta, M.G.; Tirindelli, M.; Alderson, J.; Schimmels, S. Wave loads on exposed jetties: Description of large-scale experiments and preliminary results. In Proceedings of the Conference on Coastal Engineering, Shanghai, China, 30 June–5 July 2010. [Google Scholar]
- Murakami, K.; Sakamoto, Y.; Nonaka, T. Analytical investigation of slab bridge damages caused by tsunami flow. Coast. Eng. Proc. 2012, 1, 42. [Google Scholar] [CrossRef]
- Motley, M.R.; Wong, H.K.; Qin, X.; Winter, A.O.; Eberhard, M.O. Tsunami-induced forces on skewed bridges. J. Waterw. Port Coast. Ocean Eng. 2015, 142, 04015025. [Google Scholar] [CrossRef]
- Wei, Z.; Dalrymple, R.A. Numerical study on mitigating tsunami force on bridges by an SPH model. J. Ocean Eng. Mar. Energy 2016, 2, 365–380. [Google Scholar] [CrossRef] [Green Version]
- Zhu, M.; Elkhetali, I.; Scott, M.H. Validation of opensees for tsunami loading on bridge superstructures. J. Bridge Eng. 2018, 23, 04018015. [Google Scholar] [CrossRef]
- Xu, G.; Cai, C.S.; Hu, P.; Dong, Z. Component level–based assessment of the solitary wave forces on a typical coastal bridge deck and the countermeasure of air venting holes. Pract. Period. Struct. Des. Constr. 2016, 21, 04016012. [Google Scholar] [CrossRef]
- Winter, A.O.; Motley, M.R.; Eberhard, M.O. Tsunami-like wave loading of individual bridge components. J. Bridge Eng. 2017, 23, 04017137. [Google Scholar] [CrossRef]
- Istrati, D.; Buckle, I.G.; Itani, A.; Lomonaco, P.; Yim, S. Large-scale fsi experiments on tsunami-induced forces in bridges. In Proceedings of the 16th World Conference on Earthquake Engineering, Santiago, Chile, 9–13 January 2017. [Google Scholar]
- Douglass, S.L.; Chen, Q.; Olsen, J.M.; Edge, B.L.; Brown, D. Wave Forces on Bridge Decks; Final Report Prepared for U.S.; Department of Transportation and Federal Highway Administration Office of Bridge Technology: Washington, DC, USA, 2006. [Google Scholar]
- McPherson, R.L. Hurricane Induced Wave and Surge Forces on Bridge Decks. Master’s Thesis, Texas A&M University, College Station, TX, USA, 2008. [Google Scholar]
- Bradner, C.; Schumacher, T.; Cox, D.; Higgins, C. Experimental setup for a large-scale bridge superstructure model subjected to waves. J. Waterw. Port Coast. Ocean Eng. 2010, 137, 3–11. [Google Scholar] [CrossRef]
- Hayatdavoodi, M.; Ertekin, R.C. Review of wave loads on coastal bridge decks. Appl. Mech. Rev. 2016, 68, 030802. [Google Scholar] [CrossRef]
- AASHTO. Guide Specifications for Bridges Vulnerable to Coastal Storms; AASHTO: Washington, DC, USA, 2008. [Google Scholar]
- FEMA P-646. Guidelines for Design of Structures for Vertical Evacuation from Tsunamis, 2nd ed.; Federal Emergency Management Agency: Washington, DC, USA, 2012; 174p. [Google Scholar]
- MATLAB User’s Guide Release 2016a; The MathWorks, Inc.: Natick, MA, USA, 2016.
Figure 1.
Damaged bridges after the 2011 Great East Japan Earthquake: (a) Koizumi bridge on the left (photo: E. Monzon) and (b) Utatsu Bridge on the right (photo: I. G. Buckle).
Figure 1.
Damaged bridges after the 2011 Great East Japan Earthquake: (a) Koizumi bridge on the left (photo: E. Monzon) and (b) Utatsu Bridge on the right (photo: I. G. Buckle).

Figure 2.
Cross-section of the Large Wave Flume (LWF) depicting the bathymetry, bridge location and flume instrumentation (not to scale).
Figure 2.
Cross-section of the Large Wave Flume (LWF) depicting the bathymetry, bridge location and flume instrumentation (not to scale).

Figure 3.
Test specimen and components during the pre-test assembly in the Large-Scale Structures Laboratory at the University of Nevada, Reno (UNR) and during the hydrodynamic testing phase in the LWF at Oregon State University.
Figure 3.
Test specimen and components during the pre-test assembly in the Large-Scale Structures Laboratory at the University of Nevada, Reno (UNR) and during the hydrodynamic testing phase in the LWF at Oregon State University.

Figure 4.
Cross-section of the experimental setup at the bridge location depicting the main structural components and load cells of the test case with steel bearings and rigid link.
Figure 4.
Cross-section of the experimental setup at the bridge location depicting the main structural components and load cells of the test case with steel bearings and rigid link.

Figure 5.
Wave heights recorded at wg12 for three selected unbroken solitary waves and three bores.

Figure 6.
Total horizontal and vertical forces for (a) solitary waves (top) with H = 0.42 m (left), H = 0.55 m (center) and H = 0.70 m (right), and (b) bores (bottom) with H = 1.0 m (left), H = 1.10 m (center) and H = 1.40 m (right).
Figure 6.
Total horizontal and vertical forces for (a) solitary waves (top) with H = 0.42 m (left), H = 0.55 m (center) and H = 0.70 m (right), and (b) bores (bottom) with H = 1.0 m (left), H = 1.10 m (center) and H = 1.40 m (right).

Figure 7.
Vertical force histories in the steel bearings for solitary waves with H = 0.70 m (a), and bores with H = 1.0 m (b), H = 1.10 m (c) and H = 1.40 m (d).
Figure 7.
Vertical force histories in the steel bearings for solitary waves with H = 0.70 m (a), and bores with H = 1.0 m (b), H = 1.10 m (c) and H = 1.40 m (d).

Figure 8.
Uplift forces measured in the offshore bearings at time instant of maximum total uplift versus the maximum uplift forces in offshore bearings for all solitary waves (a) and bores (b), and maximum uplift forces measured in the offshore bearings versus the maximum total uplift for solitary waves (c) and bores (d).

Figure 9.
Vertical force histories in column-bent cap connections for (a) solitary waves (top) with H = 0.42 m (left), H = 0.55 m (center) and H = 0.70 m (right), and (b) bores (bottom) with H = 1.0 m (left), H = 1.10 m (center) and H = 1.40 m (right).
Figure 9.
Vertical force histories in column-bent cap connections for (a) solitary waves (top) with H = 0.42 m (left), H = 0.55 m (center) and H = 0.70 m (right), and (b) bores (bottom) with H = 1.0 m (left), H = 1.10 m (center) and H = 1.40 m (right).

Figure 10.
Maximum uplift forces measured in the offshore column-bent cap connections versus the maximum total uplift for solitary waves (a) and bores (b).
Figure 10.
Maximum uplift forces measured in the offshore column-bent cap connections versus the maximum total uplift for solitary waves (a) and bores (b).

Figure 11.
Free body diagram showing applied loads and reaction forces for the simplified method.

Figure 12.
Calculation of tsunami-induced moment at the level of the bearings (top) and the level of the column-bent cap connections (bottom).
Figure 12.
Calculation of tsunami-induced moment at the level of the bearings (top) and the level of the column-bent cap connections (bottom).

Figure 13.
Total horizontal forces and moment for (a) solitary waves (top) with H = 0.42 m (left), H = 0.55 m (center) and H = 0.70 m (right), and (b) bores (bottom) with H = 1.0 m (left), H = 1.10 m (center) and H = 1.40 m (right).
Figure 13.
Total horizontal forces and moment for (a) solitary waves (top) with H = 0.42 m (left), H = 0.55 m (center) and H = 0.70 m (right), and (b) bores (bottom) with H = 1.0 m (left), H = 1.10 m (center) and H = 1.40 m (right).

Figure 14.
Measured maximum uplift in individual bearings as a function of maximum total uplift (left) and overturning moment (right).
Figure 14.
Measured maximum uplift in individual bearings as a function of maximum total uplift (left) and overturning moment (right).

Figure 15.
Demand diagrams of vertical and horizontal force for (a) solitary waves (top) with H = 0.42 m (left), H = 0.55 m (center), H = 0.70 m (right), and (b) bores (bottom) with H = 1.0 m (left), H = 1.10 m (center) and H = 1.40 m (right).
Figure 15.
Demand diagrams of vertical and horizontal force for (a) solitary waves (top) with H = 0.42 m (left), H = 0.55 m (center), H = 0.70 m (right), and (b) bores (bottom) with H = 1.0 m (left), H = 1.10 m (center) and H = 1.40 m (right).

Figure 16.
Demand diagrams of vertical force and moment for (a) solitary waves (top) with H = 0.42 m (left), H = 0.55 m (center) and H = 0.70 m (right), and (b) bores (bottom) with H = 1.0 m (left), H = 1.10 m (center) and H = 1.40 m (right).
Figure 16.
Demand diagrams of vertical force and moment for (a) solitary waves (top) with H = 0.42 m (left), H = 0.55 m (center) and H = 0.70 m (right), and (b) bores (bottom) with H = 1.0 m (left), H = 1.10 m (center) and H = 1.40 m (right).

Figure 17.
3D demand diagrams of forces and moment for (a) solitary waves (top) with H = 0.42 m (left), H = 0.55 m (center) and H = 0.70 m (right), and (b) bores (bottom) with H = 1.0 m (left), H = 1.10 m (center) and H = 1.40 m (right).
Figure 17.
3D demand diagrams of forces and moment for (a) solitary waves (top) with H = 0.42 m (left), H = 0.55 m (center) and H = 0.70 m (right), and (b) bores (bottom) with H = 1.0 m (left), H = 1.10 m (center) and H = 1.40 m (right).

Figure 18.
Snapshots during the wave impact and inundation of the bridge deck.

Figure 19.
Schematic of bridge deck with location of pressure gages and ultrasonic wave gages.

Figure 20.
Tsunami-induced bearing forces and moment histories (a), normalized pressure histories on and below the deck (b), and normalized wave height (c), for H = 1.40 m.
Figure 20.
Tsunami-induced bearing forces and moment histories (a), normalized pressure histories on and below the deck (b), and normalized wave height (c), for H = 1.40 m.

Figure 21.
Tsunami inundation mechanism of a bridge.

Figure 22.
Recorded bearing forces at different instants for (a) solitary waves (top) with H = 0.42 m (left), H = 0.55 m (center) and H = 0.70 m (right), and (b) bores (bottom) with H = 1.0 m (left), H = 1.10 m (center) and H = 1.40 m (right).
Figure 22.
Recorded bearing forces at different instants for (a) solitary waves (top) with H = 0.42 m (left), H = 0.55 m (center) and H = 0.70 m (right), and (b) bores (bottom) with H = 1.0 m (left), H = 1.10 m (center) and H = 1.40 m (right).

Figure 23.
Load cases for the improved physics-based simplified method.


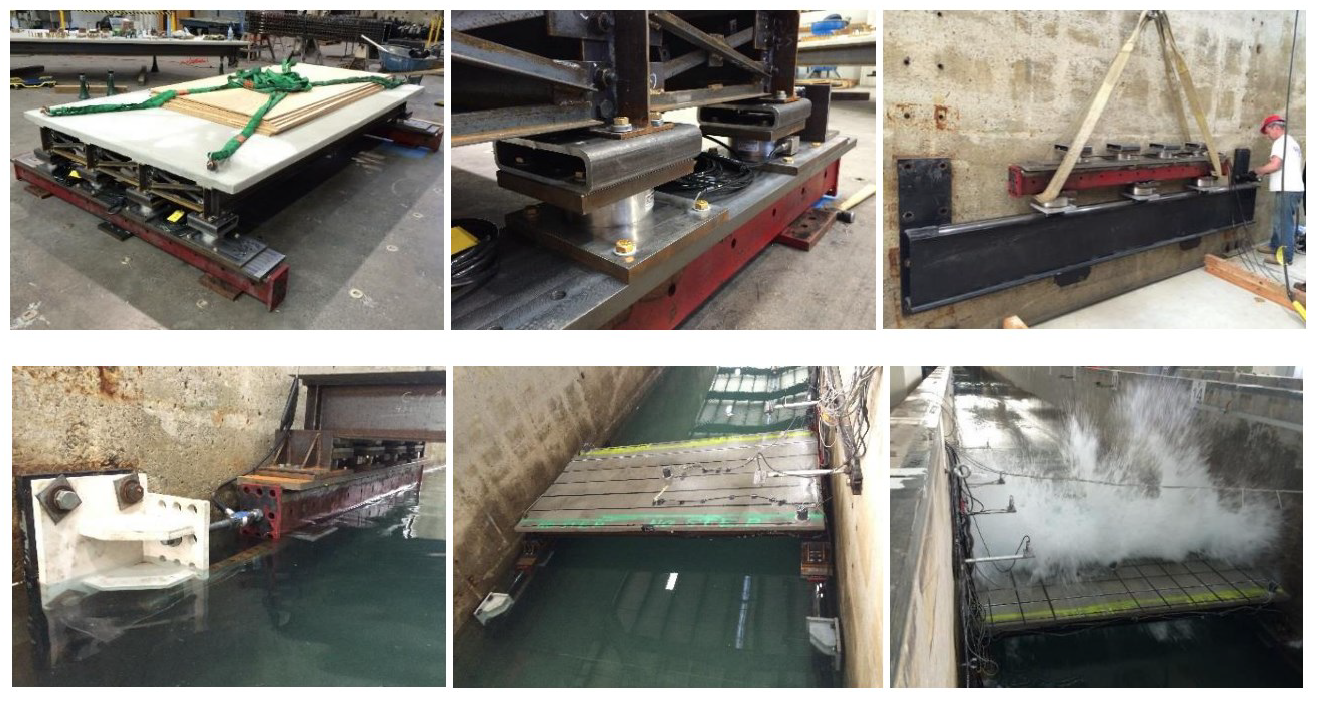
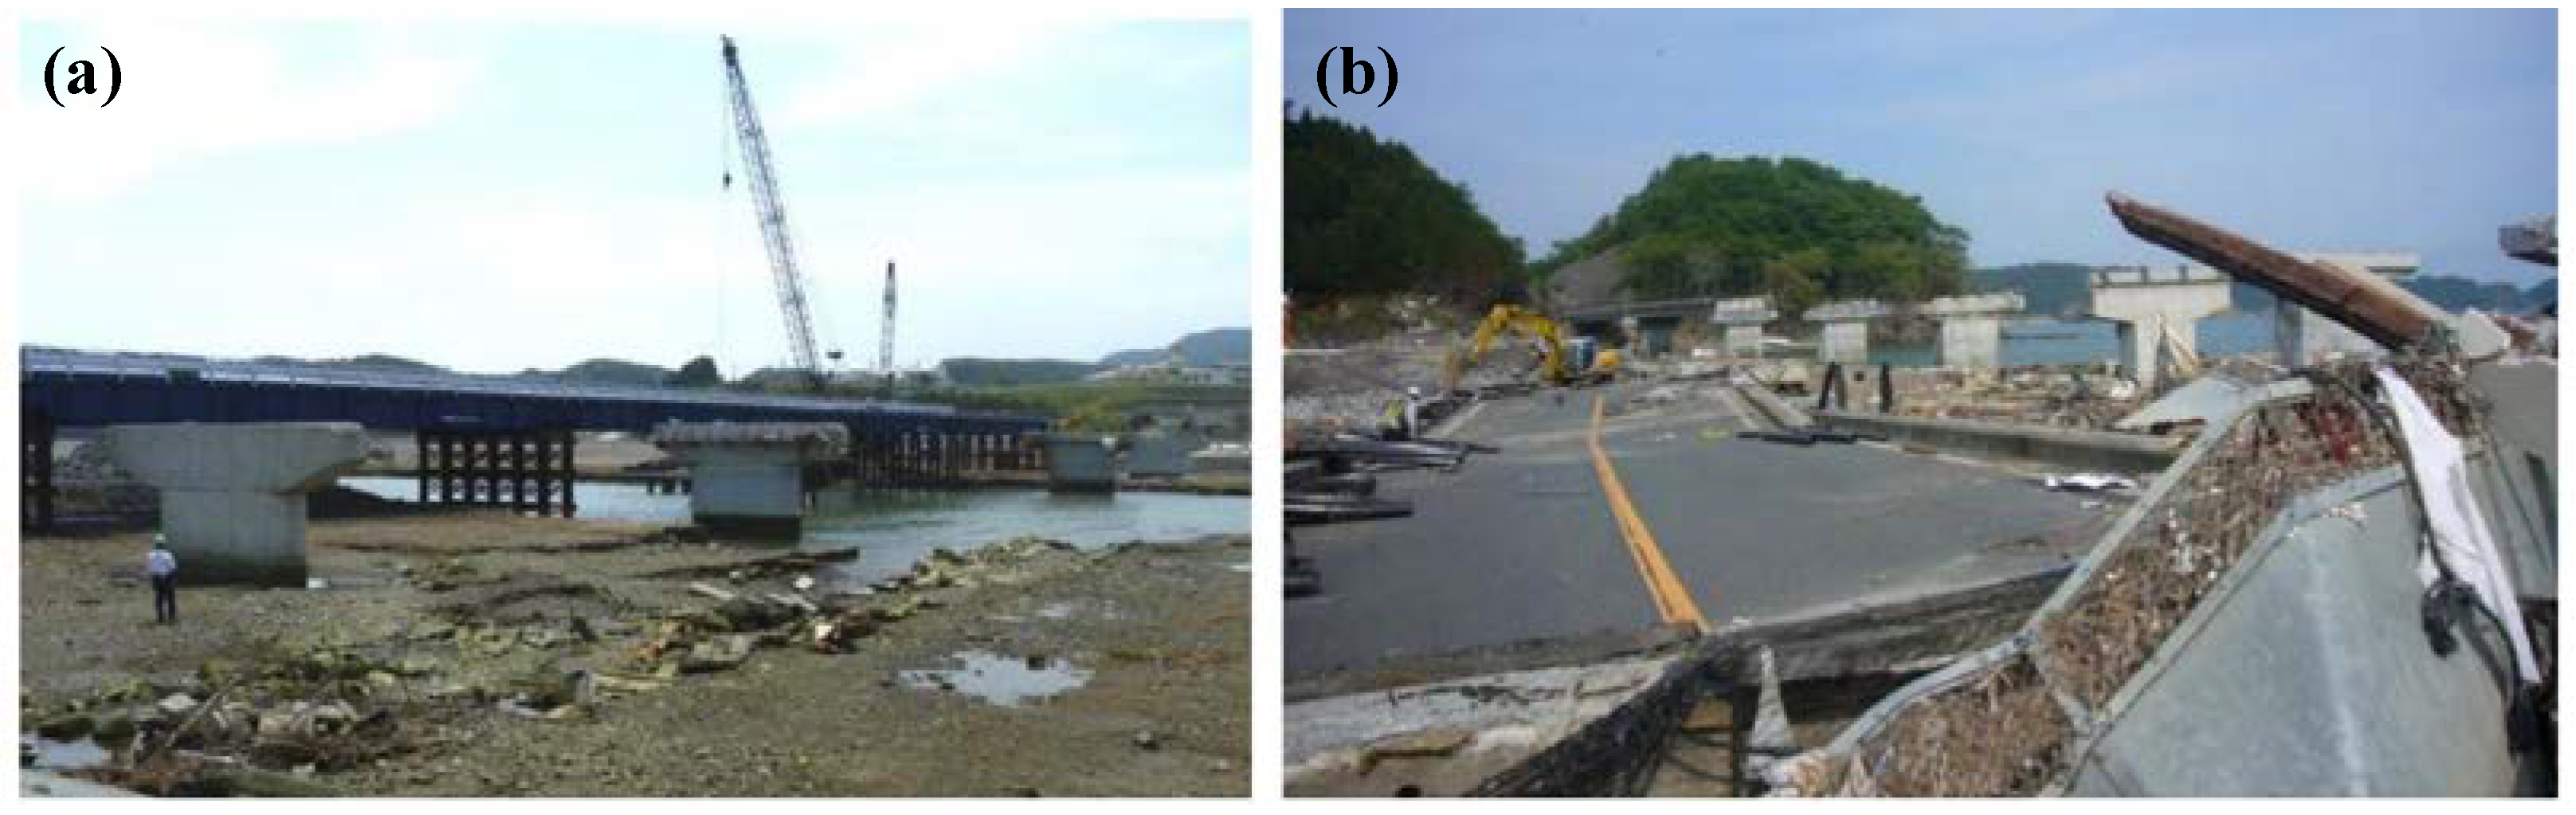
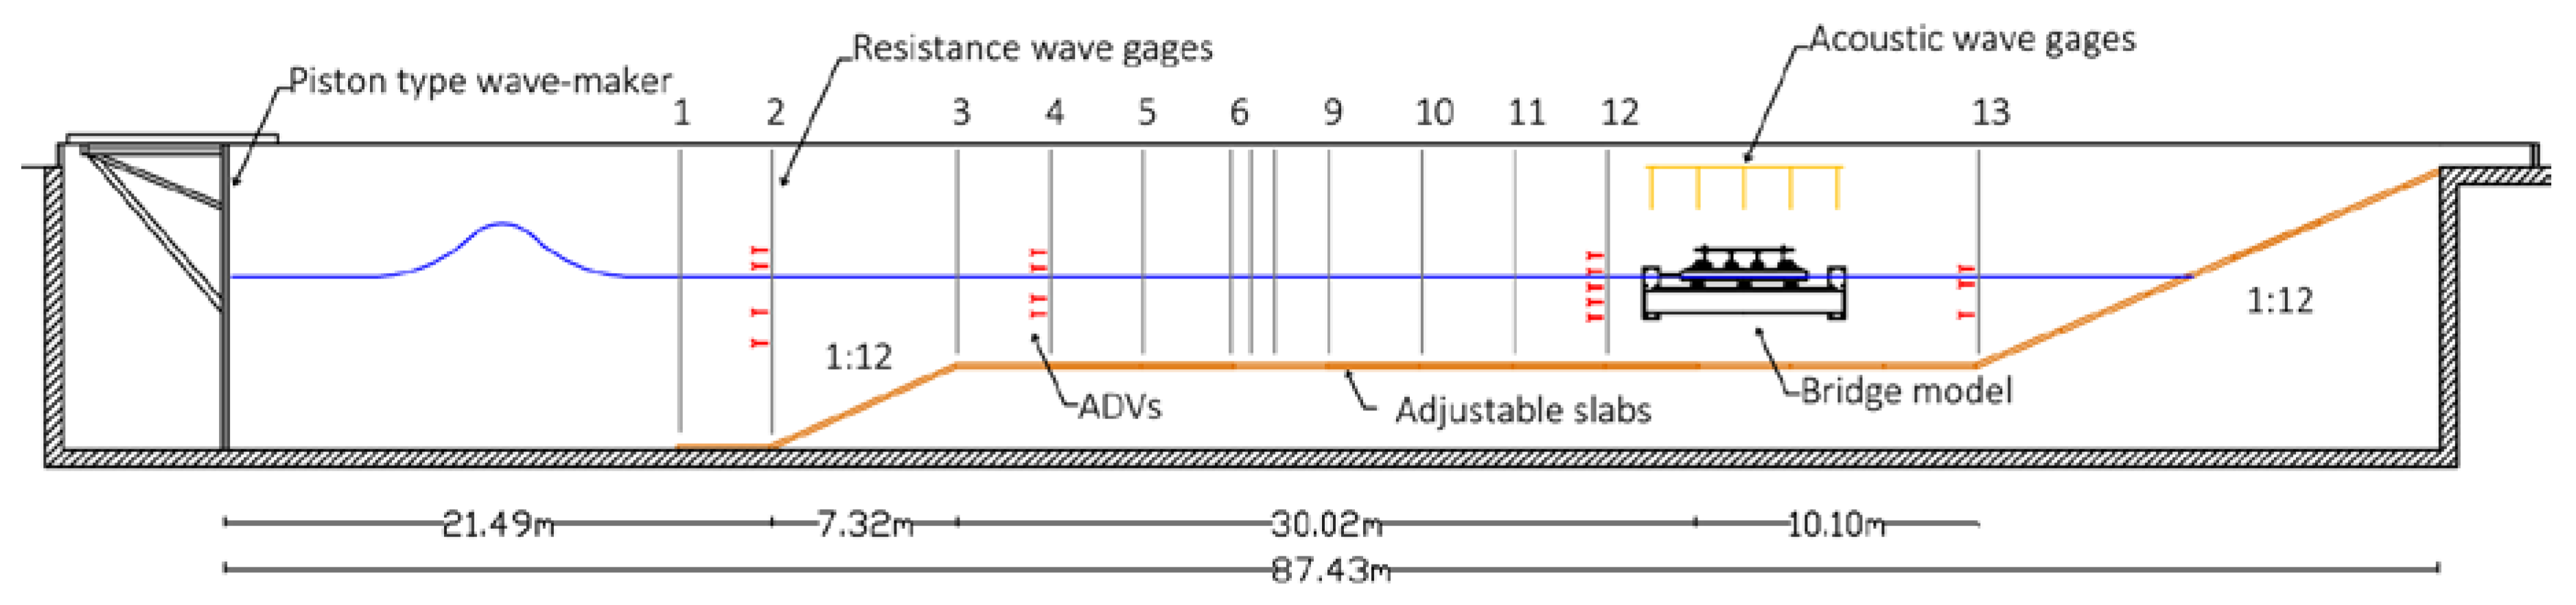
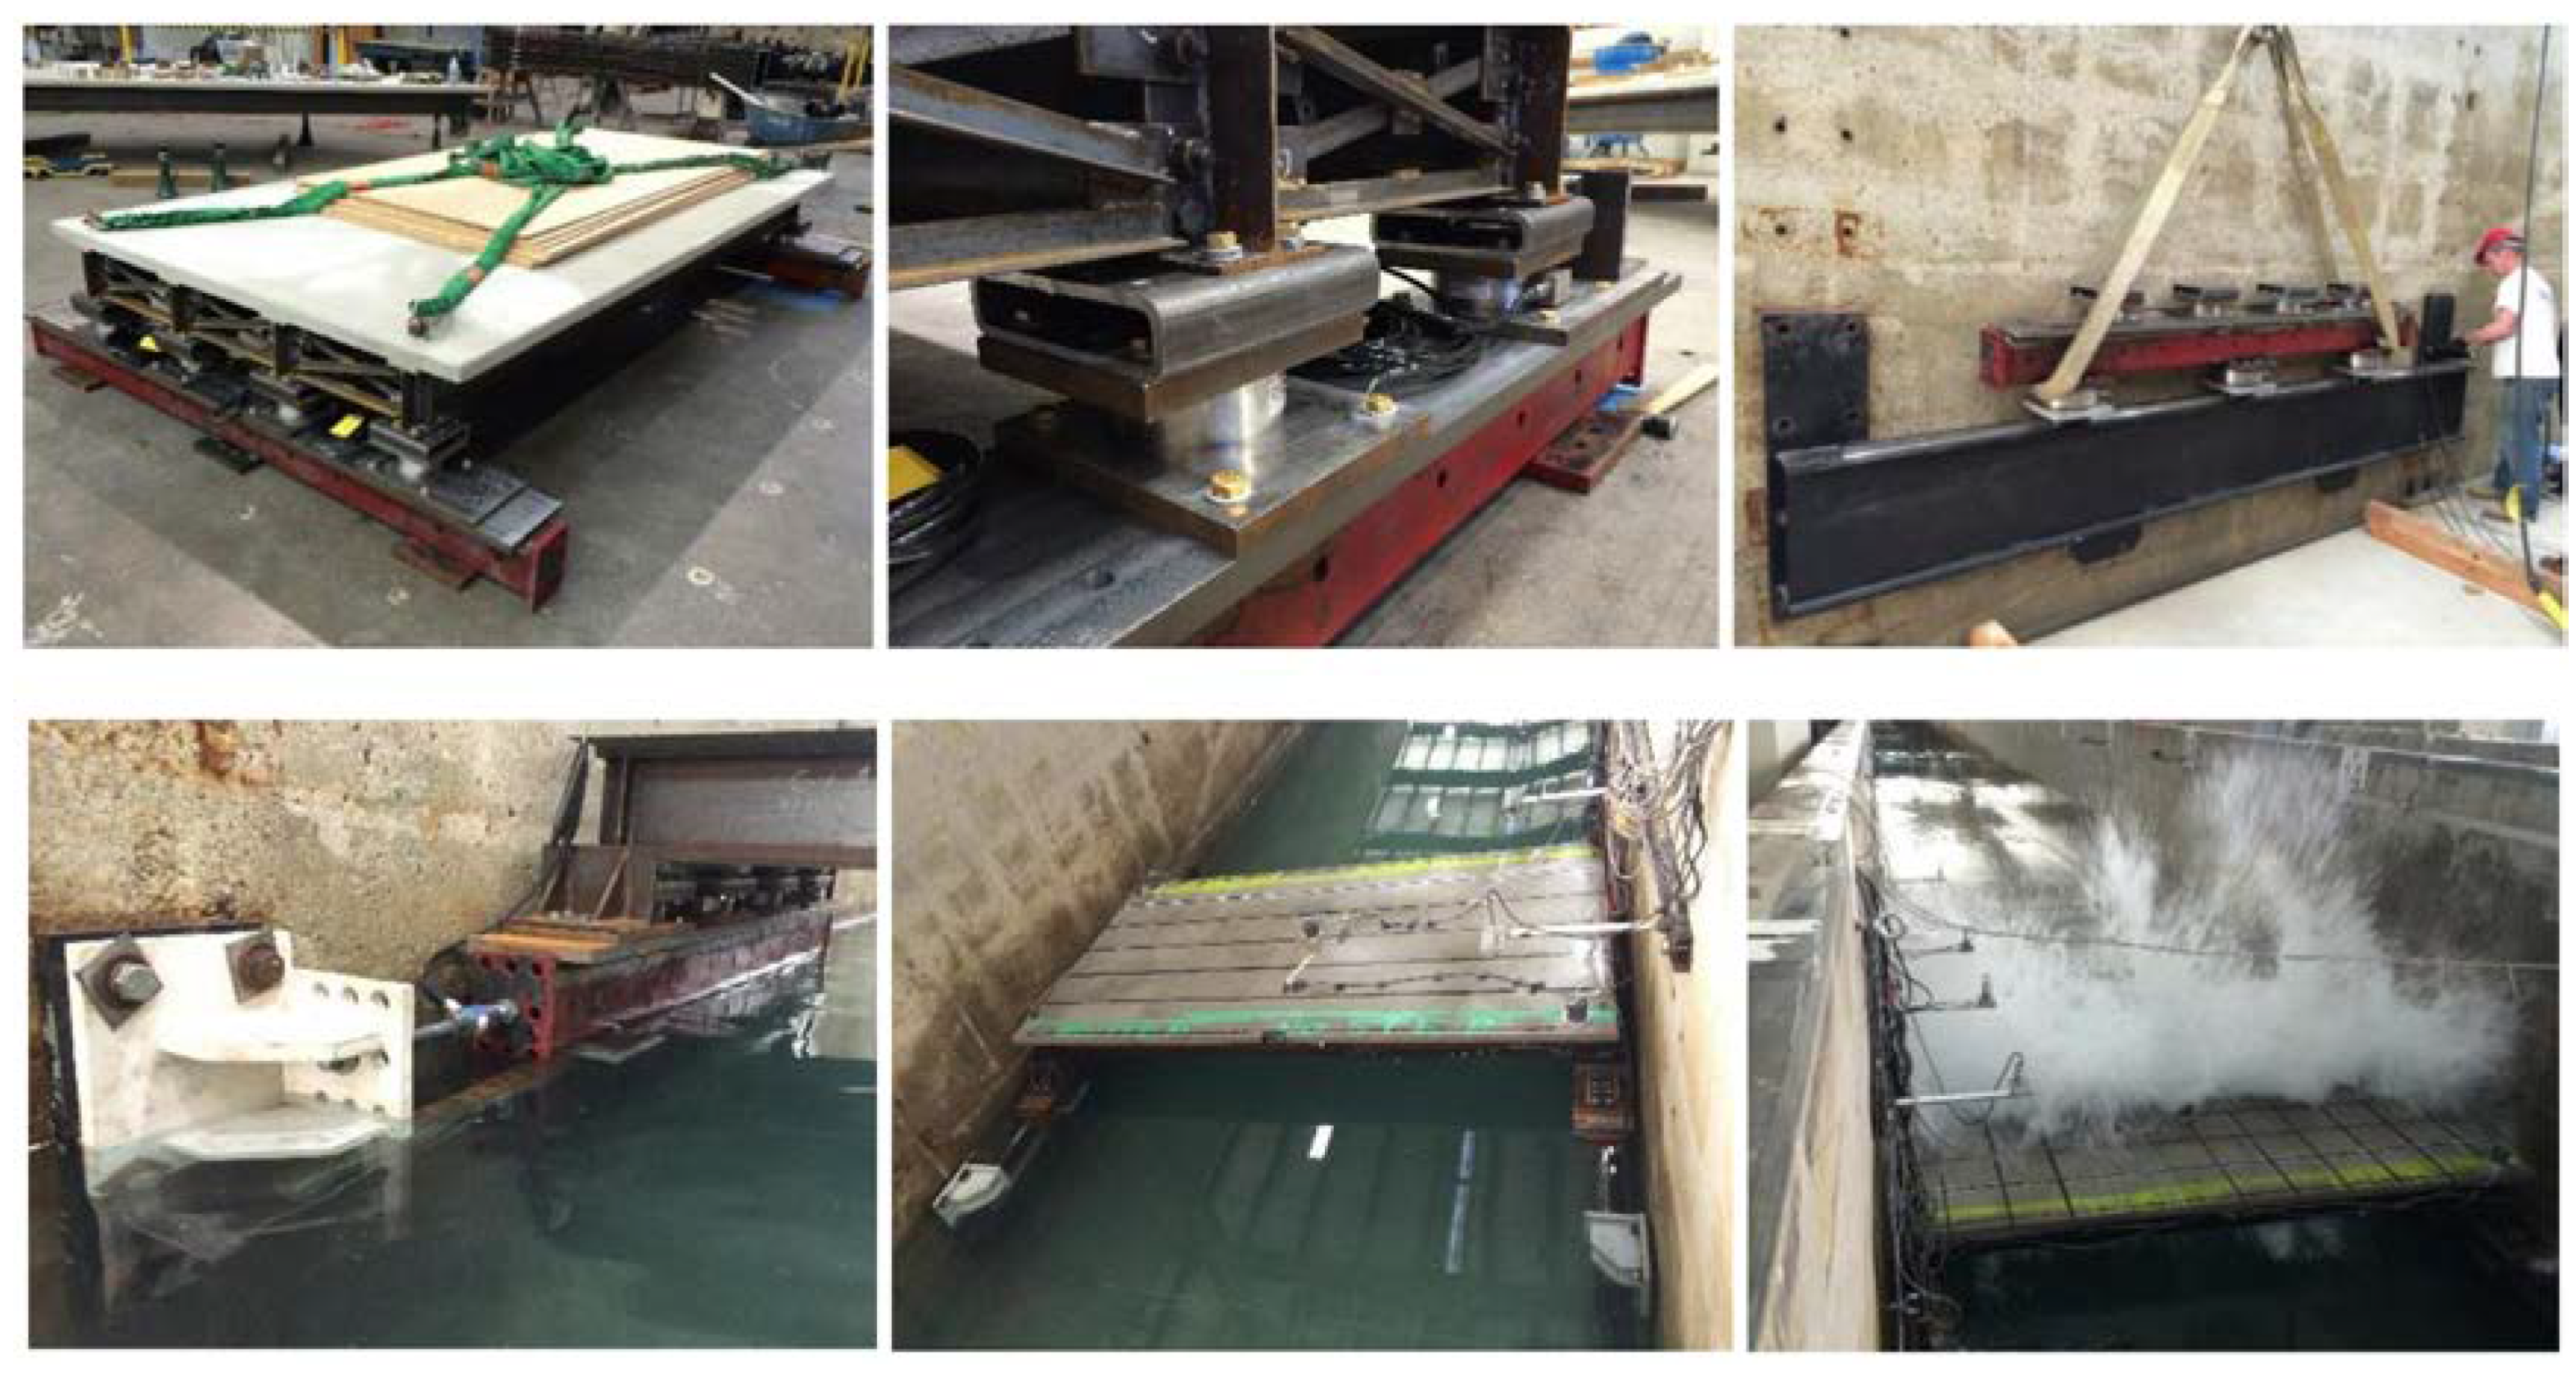
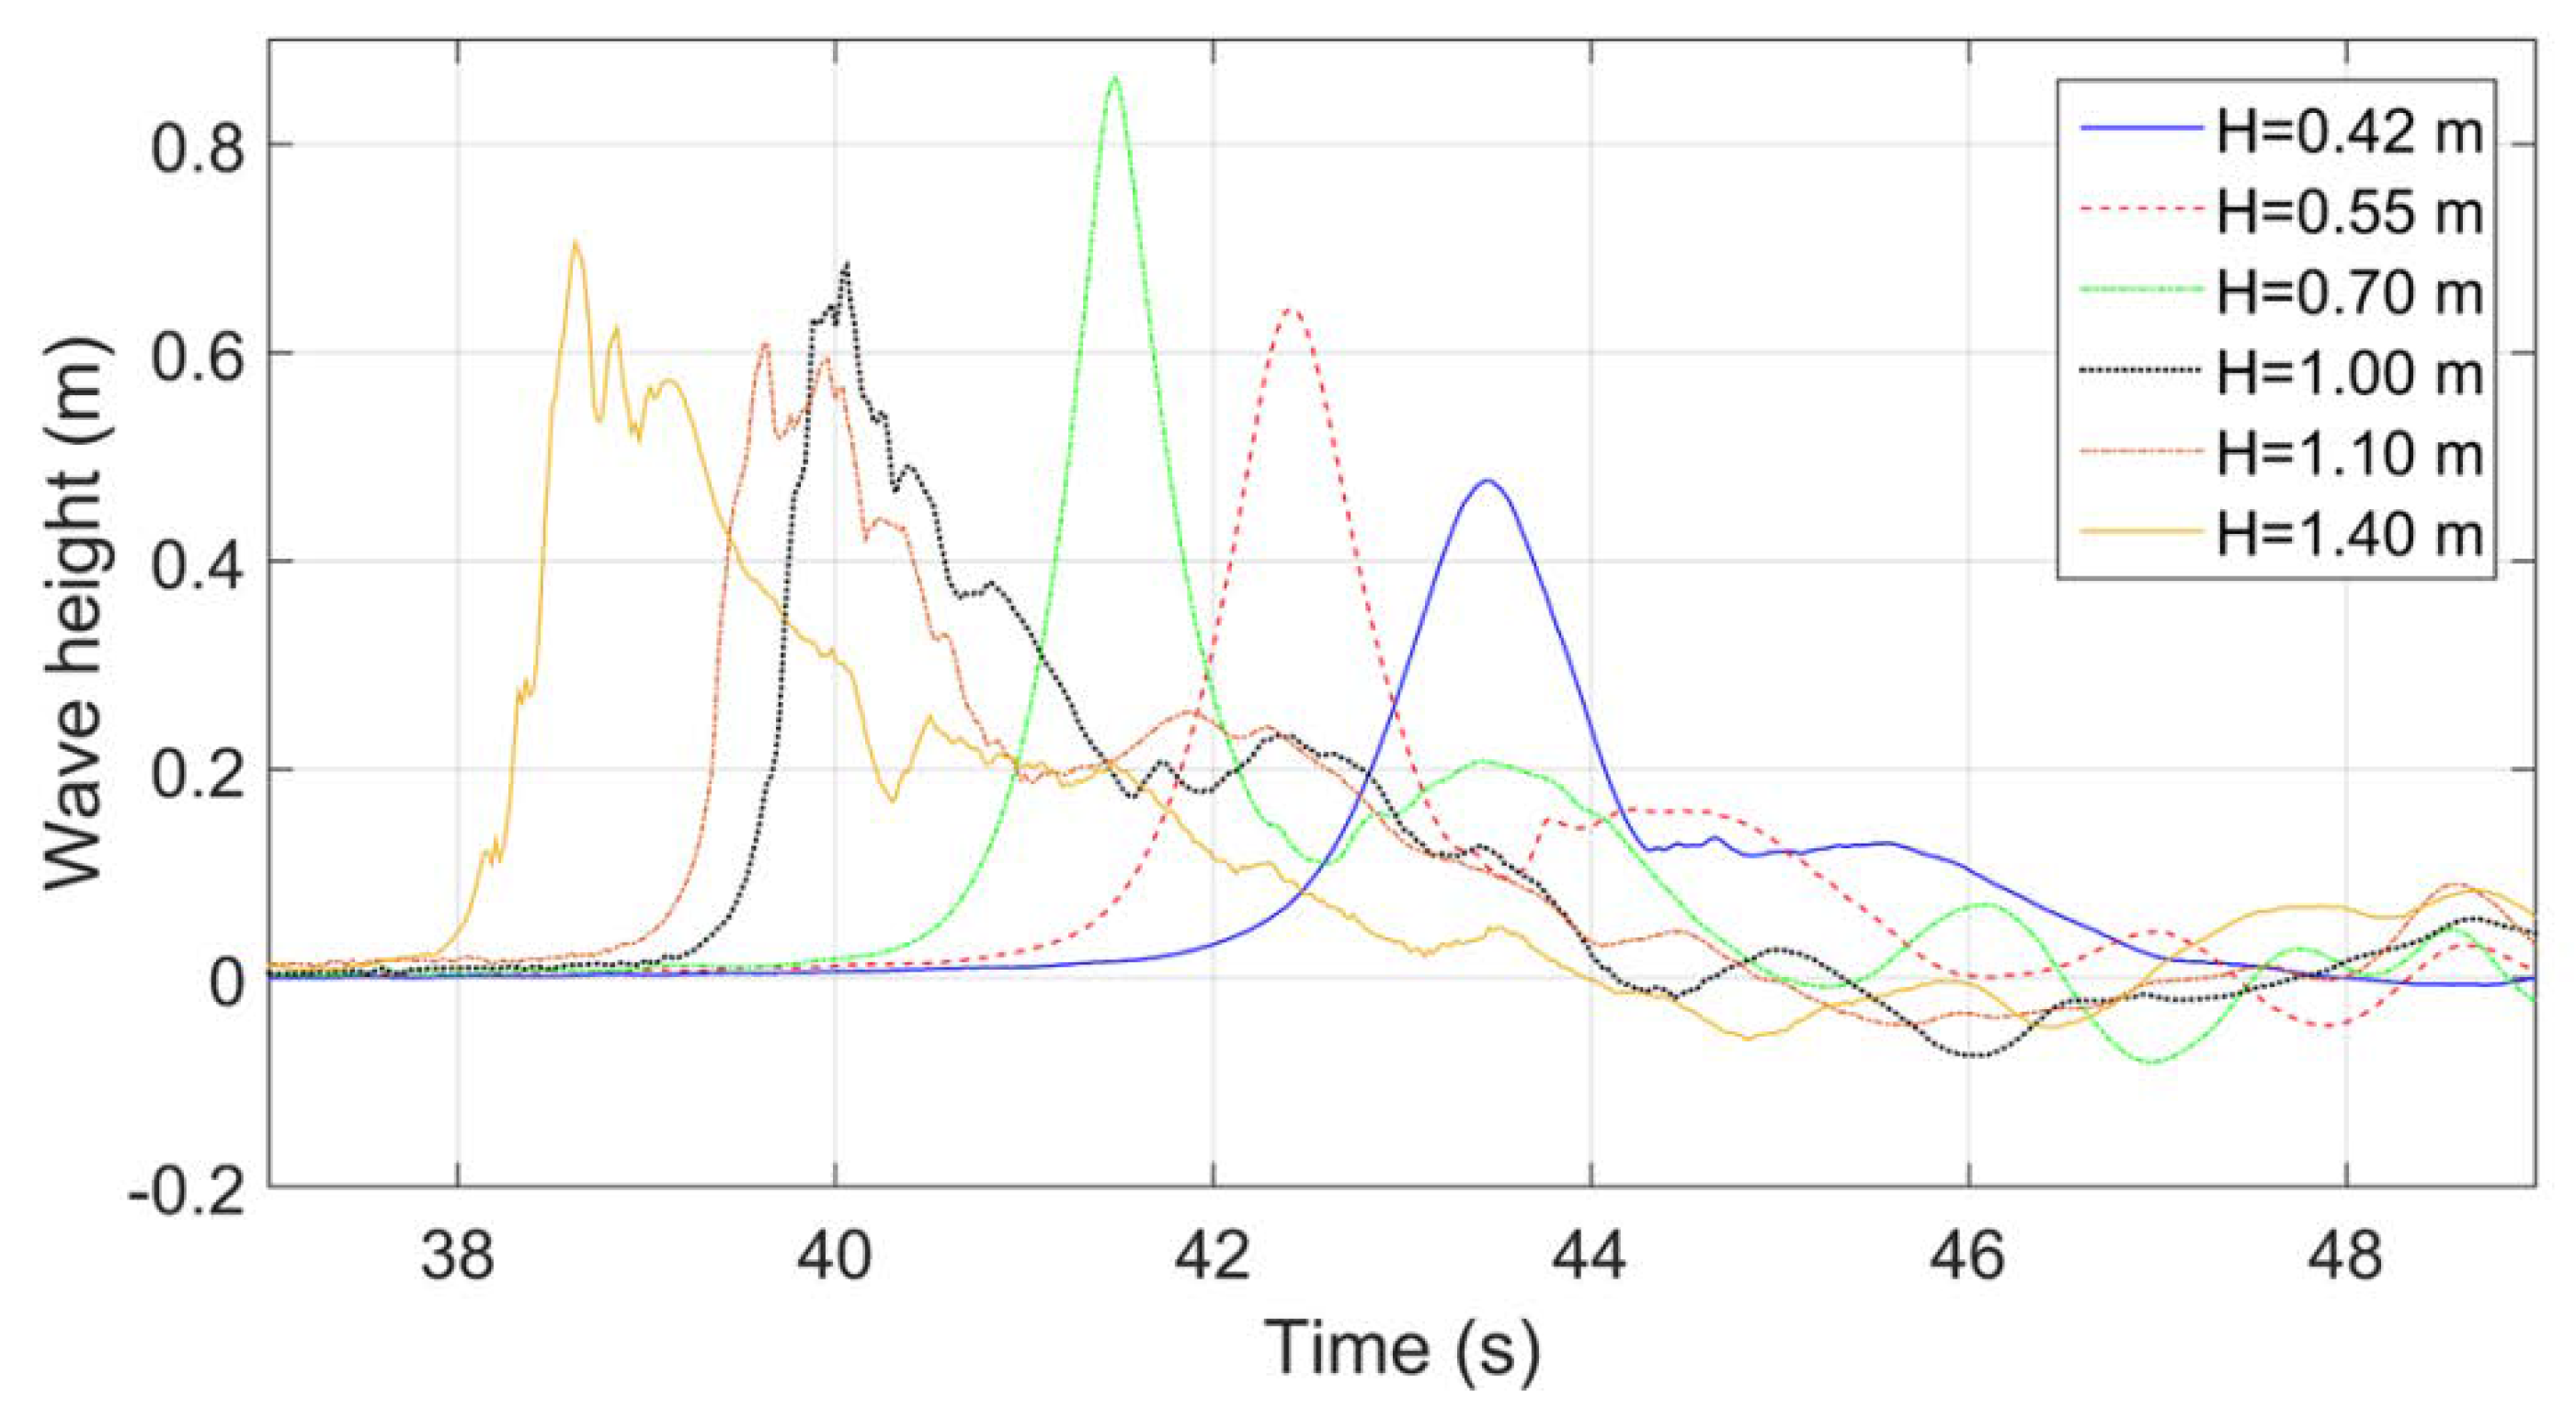
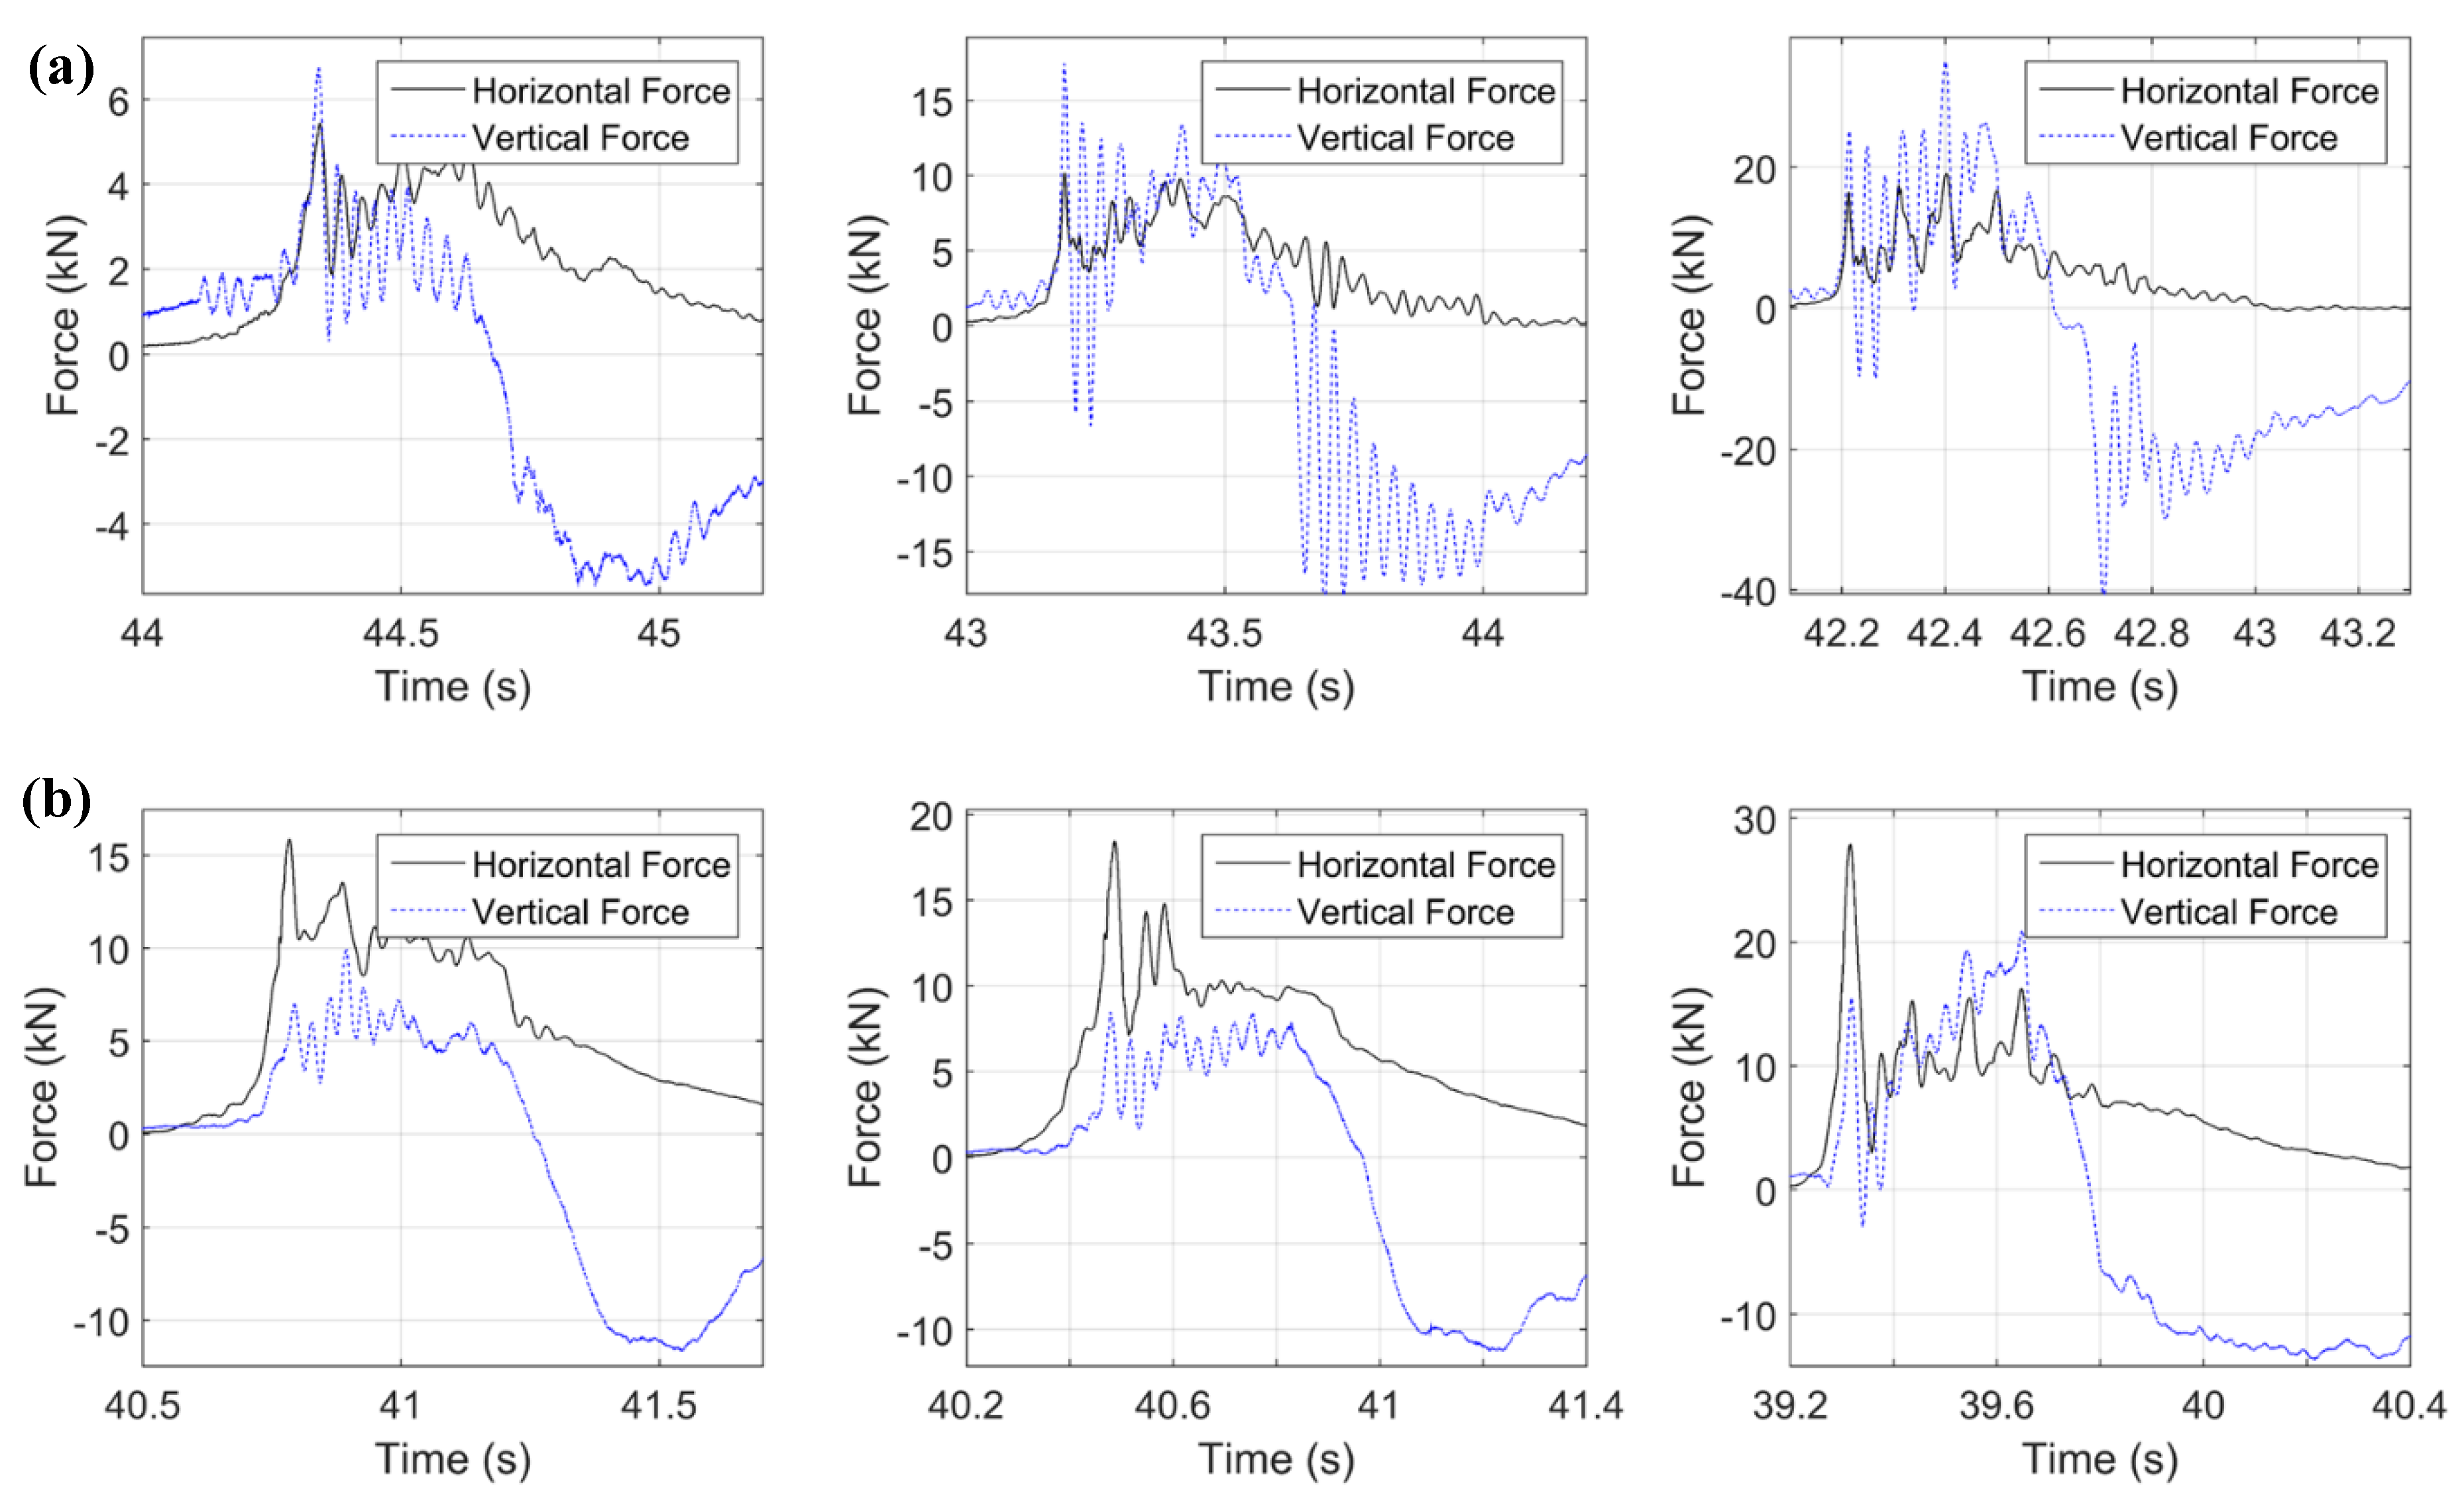
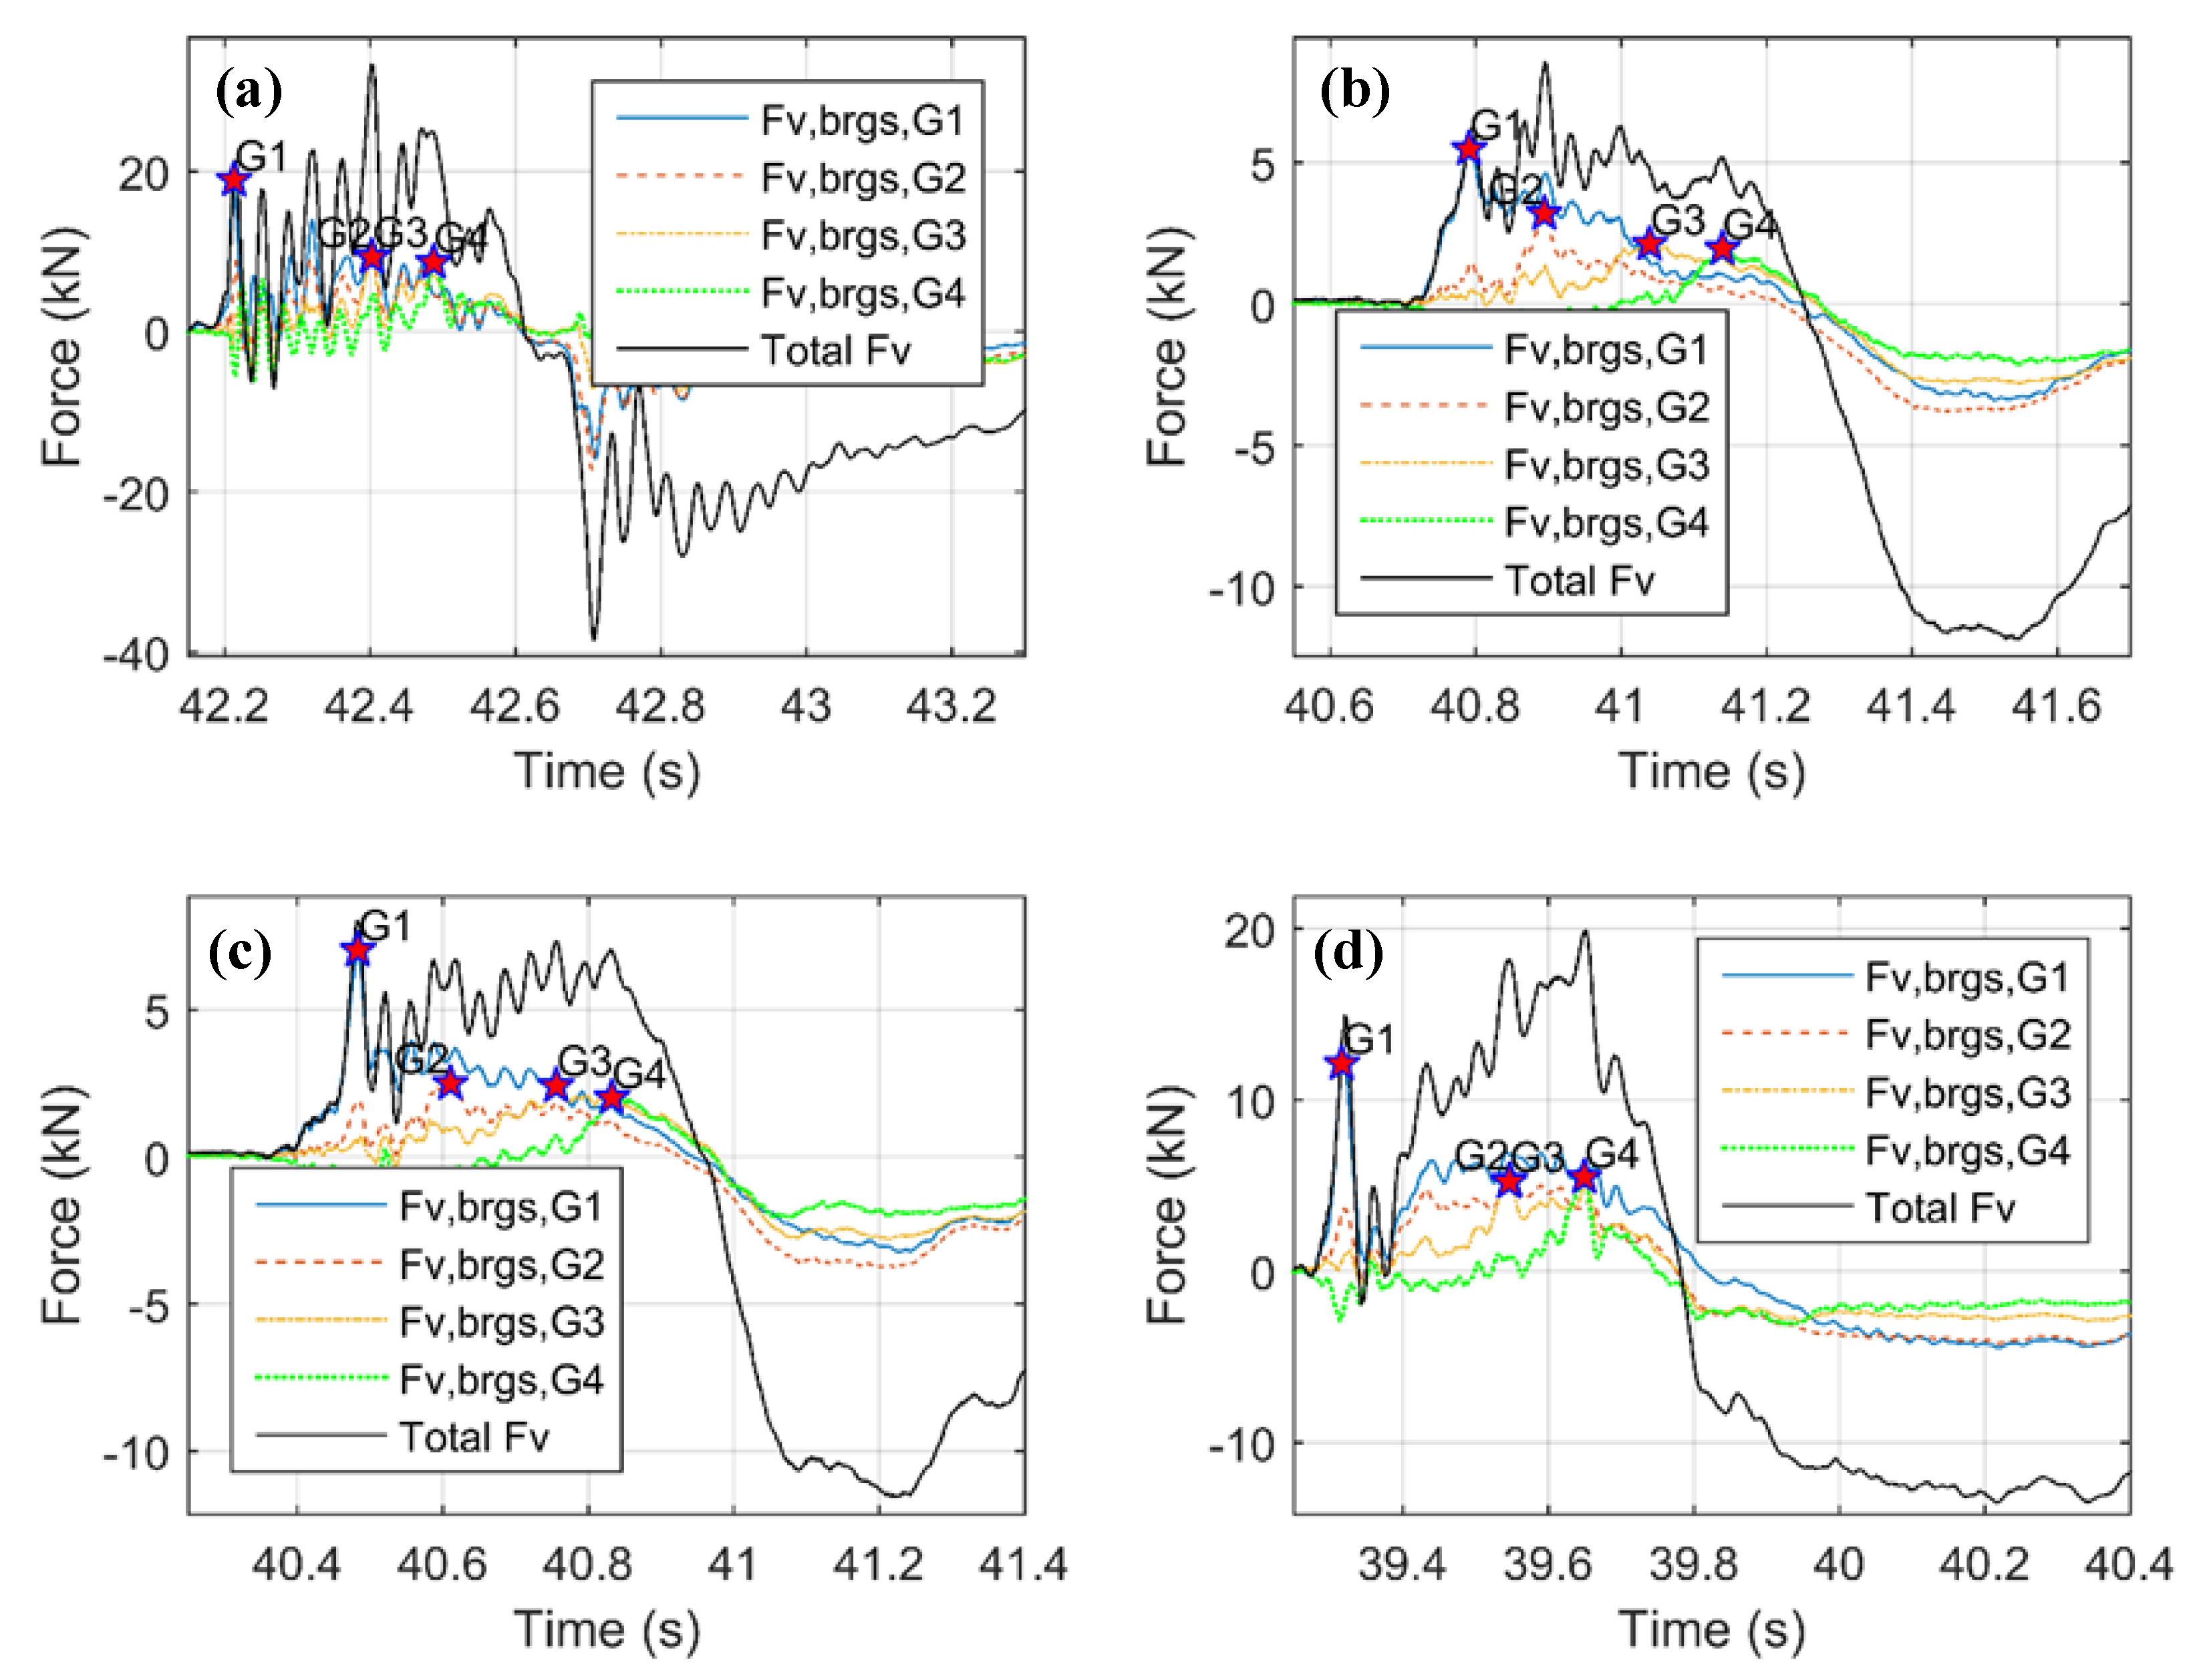
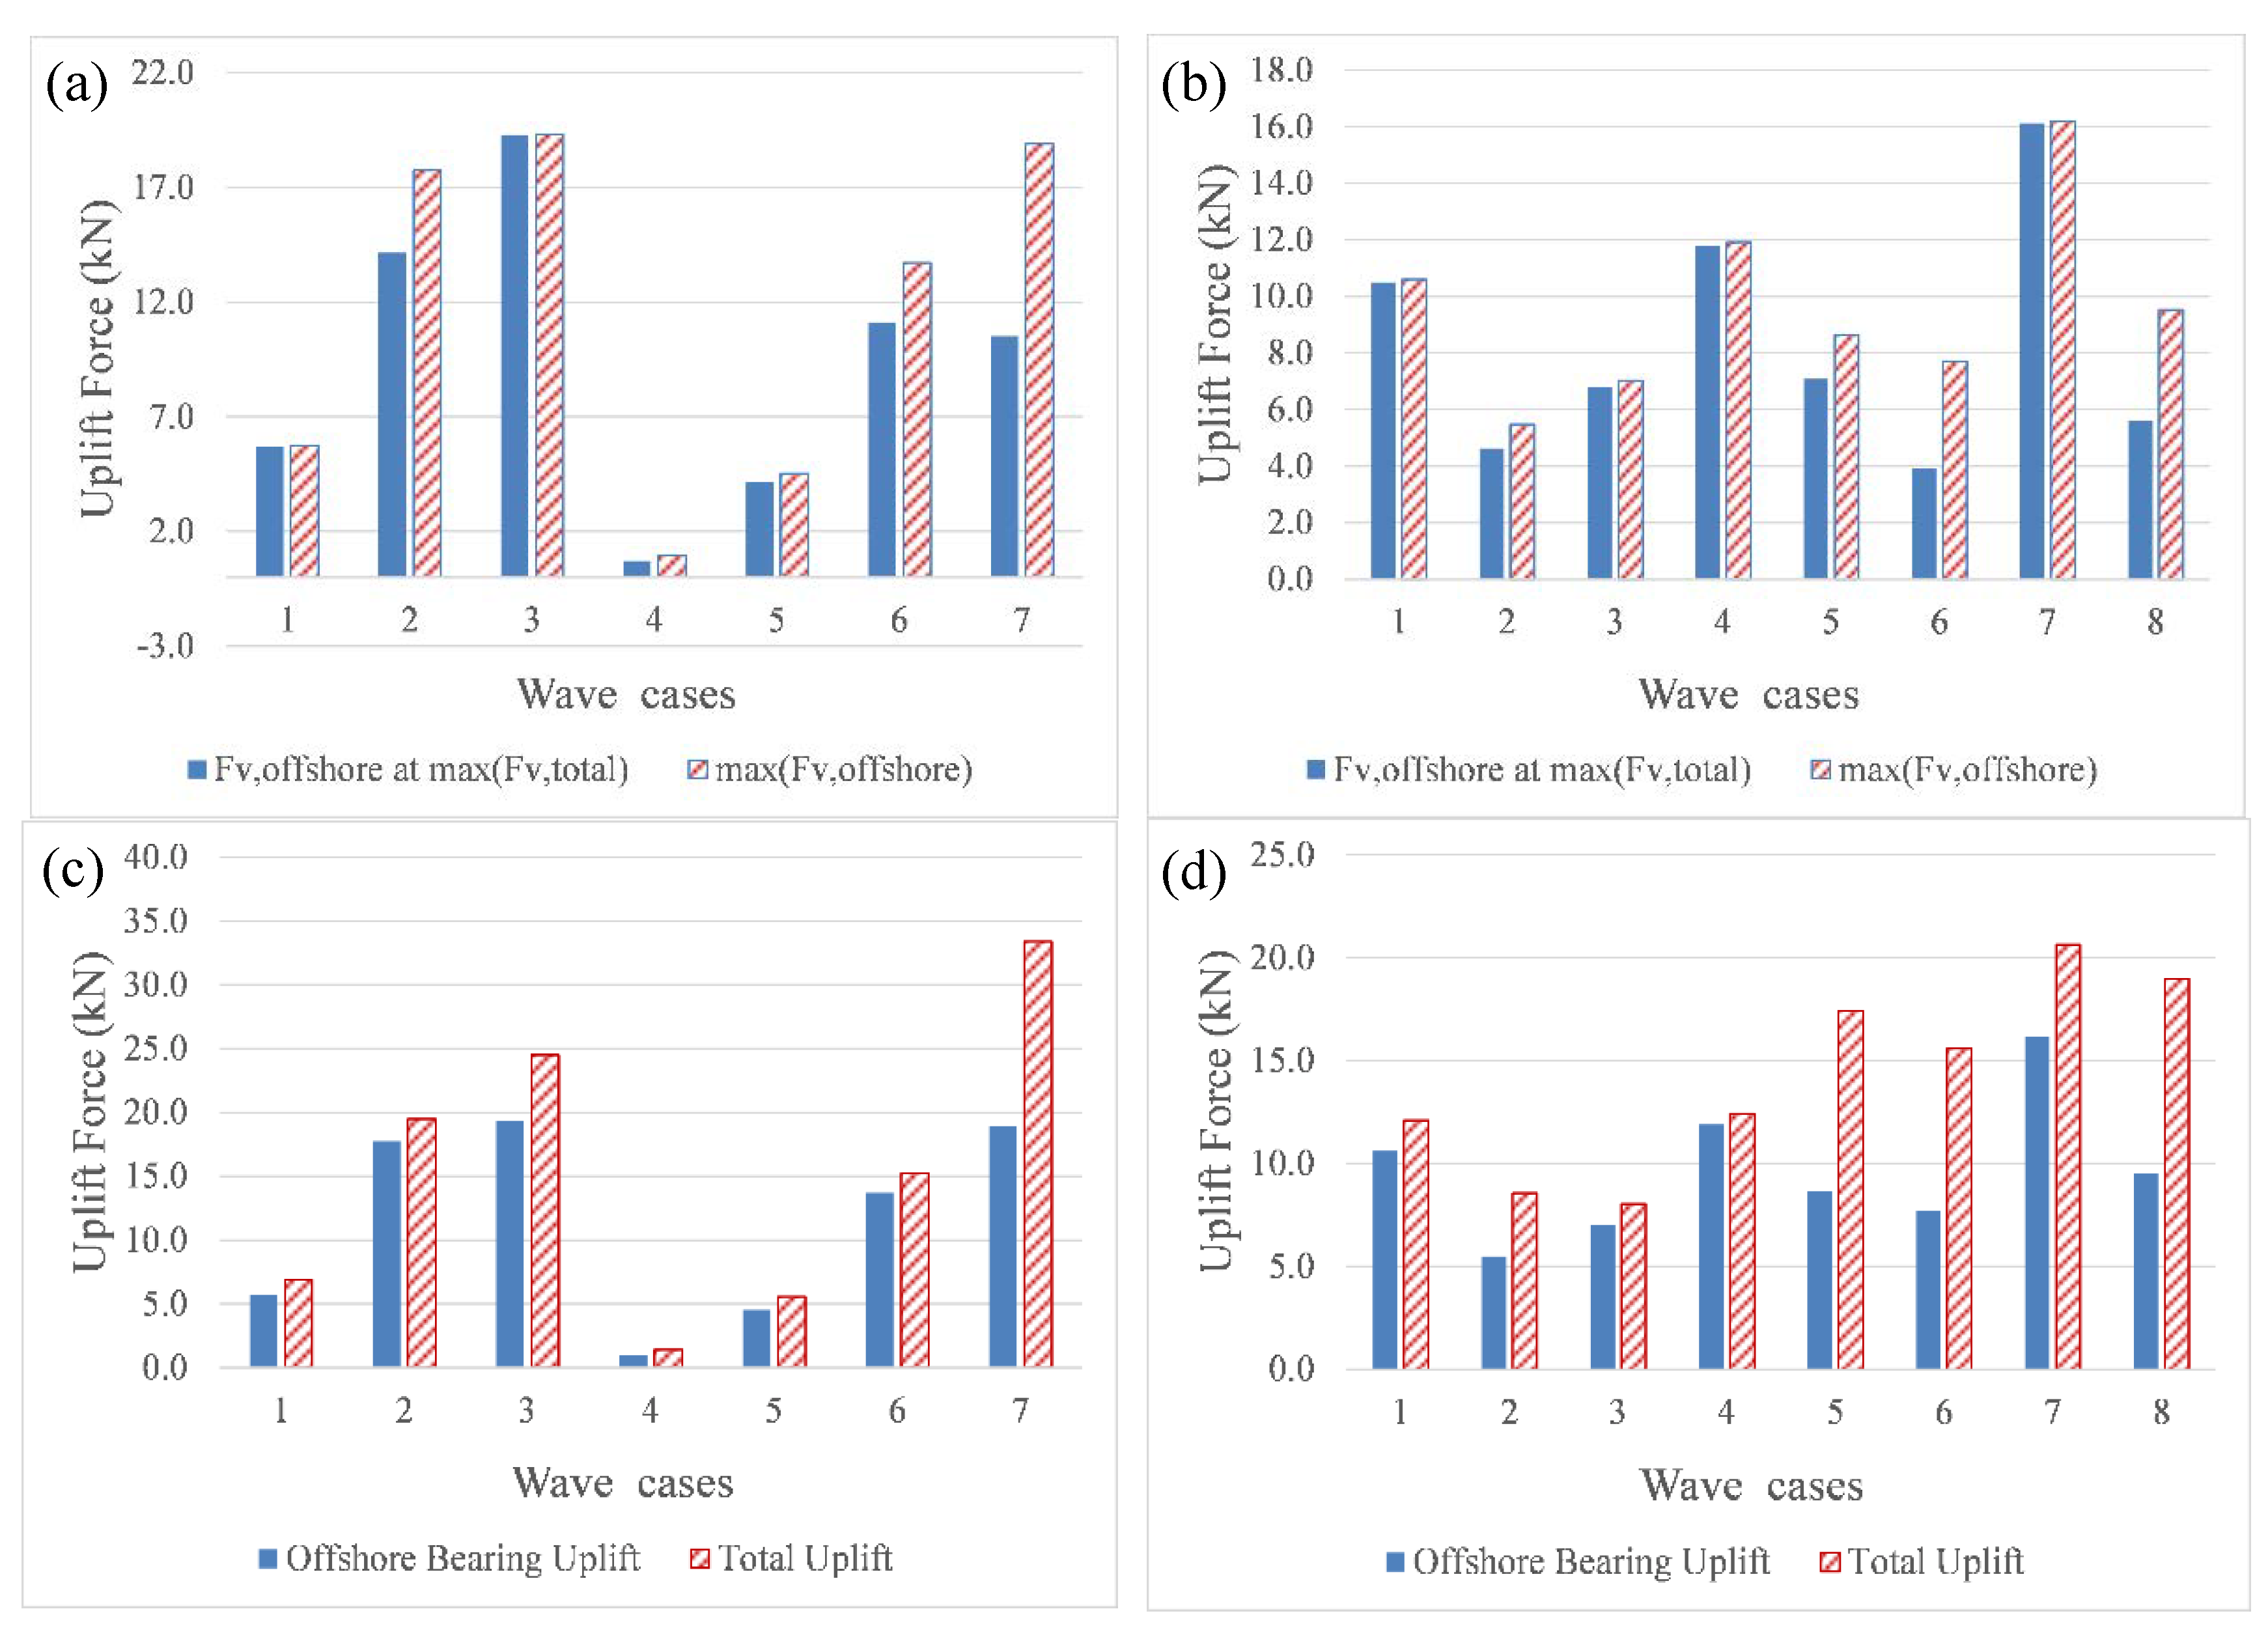
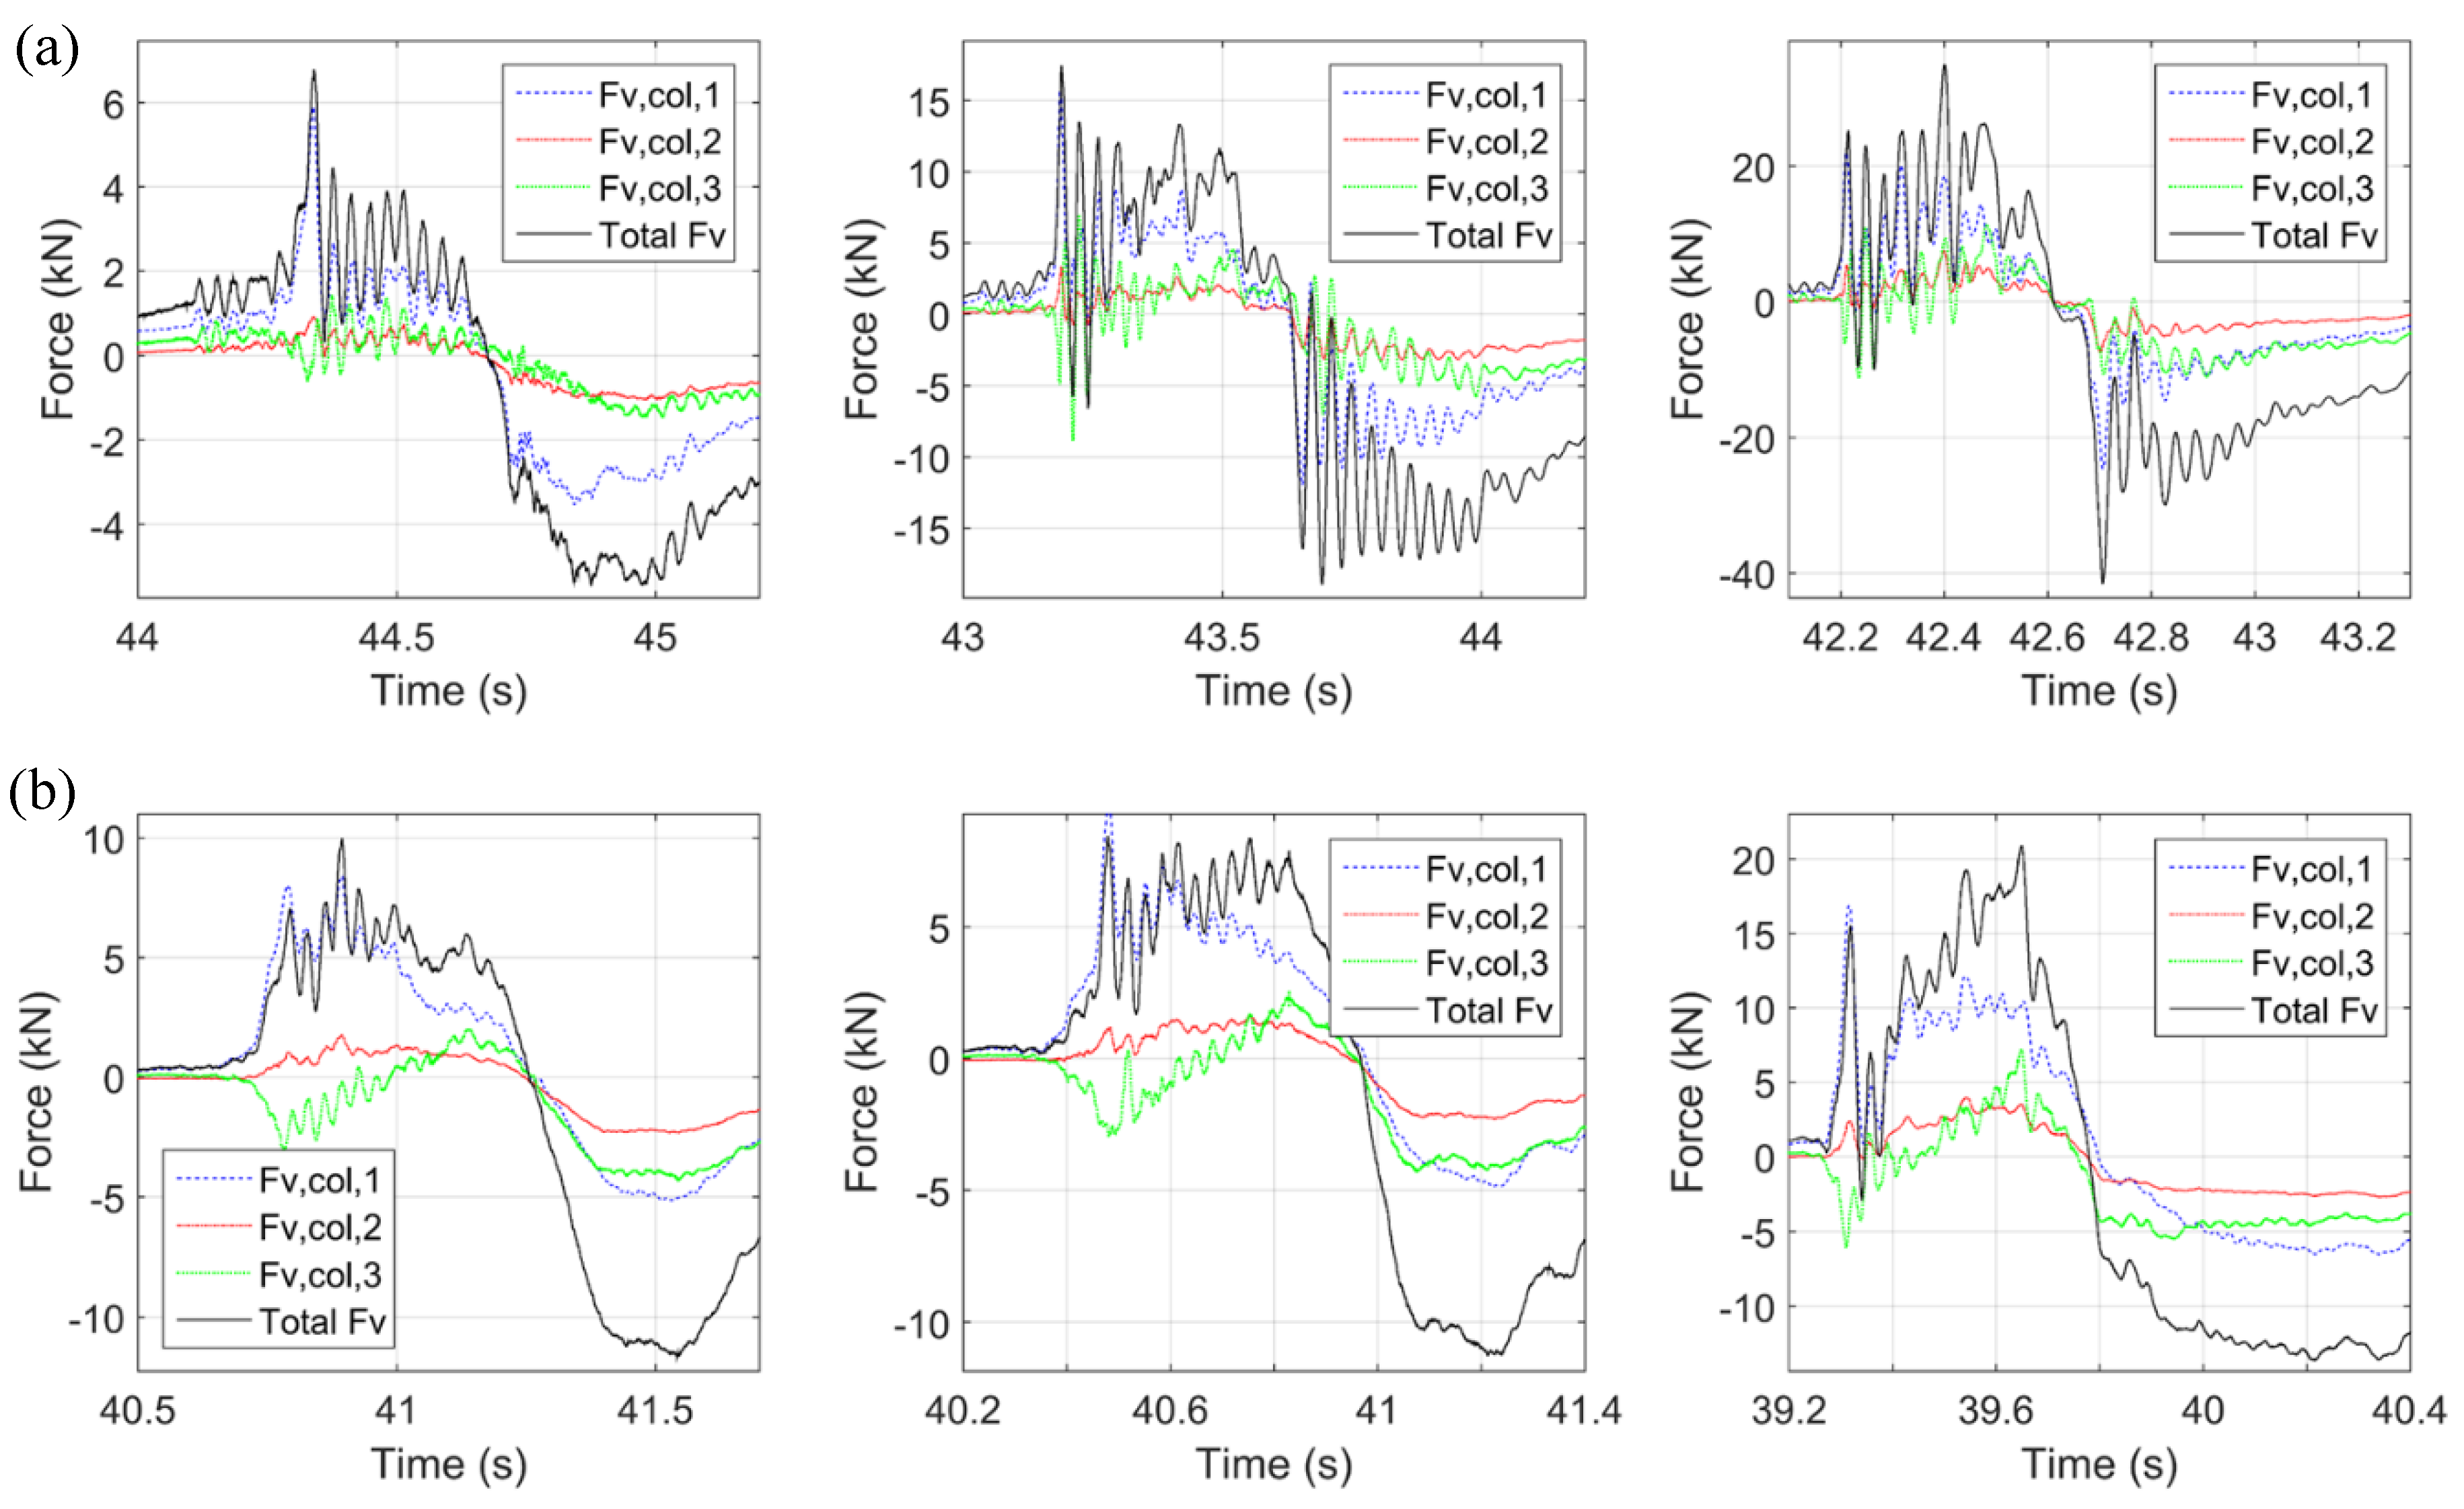
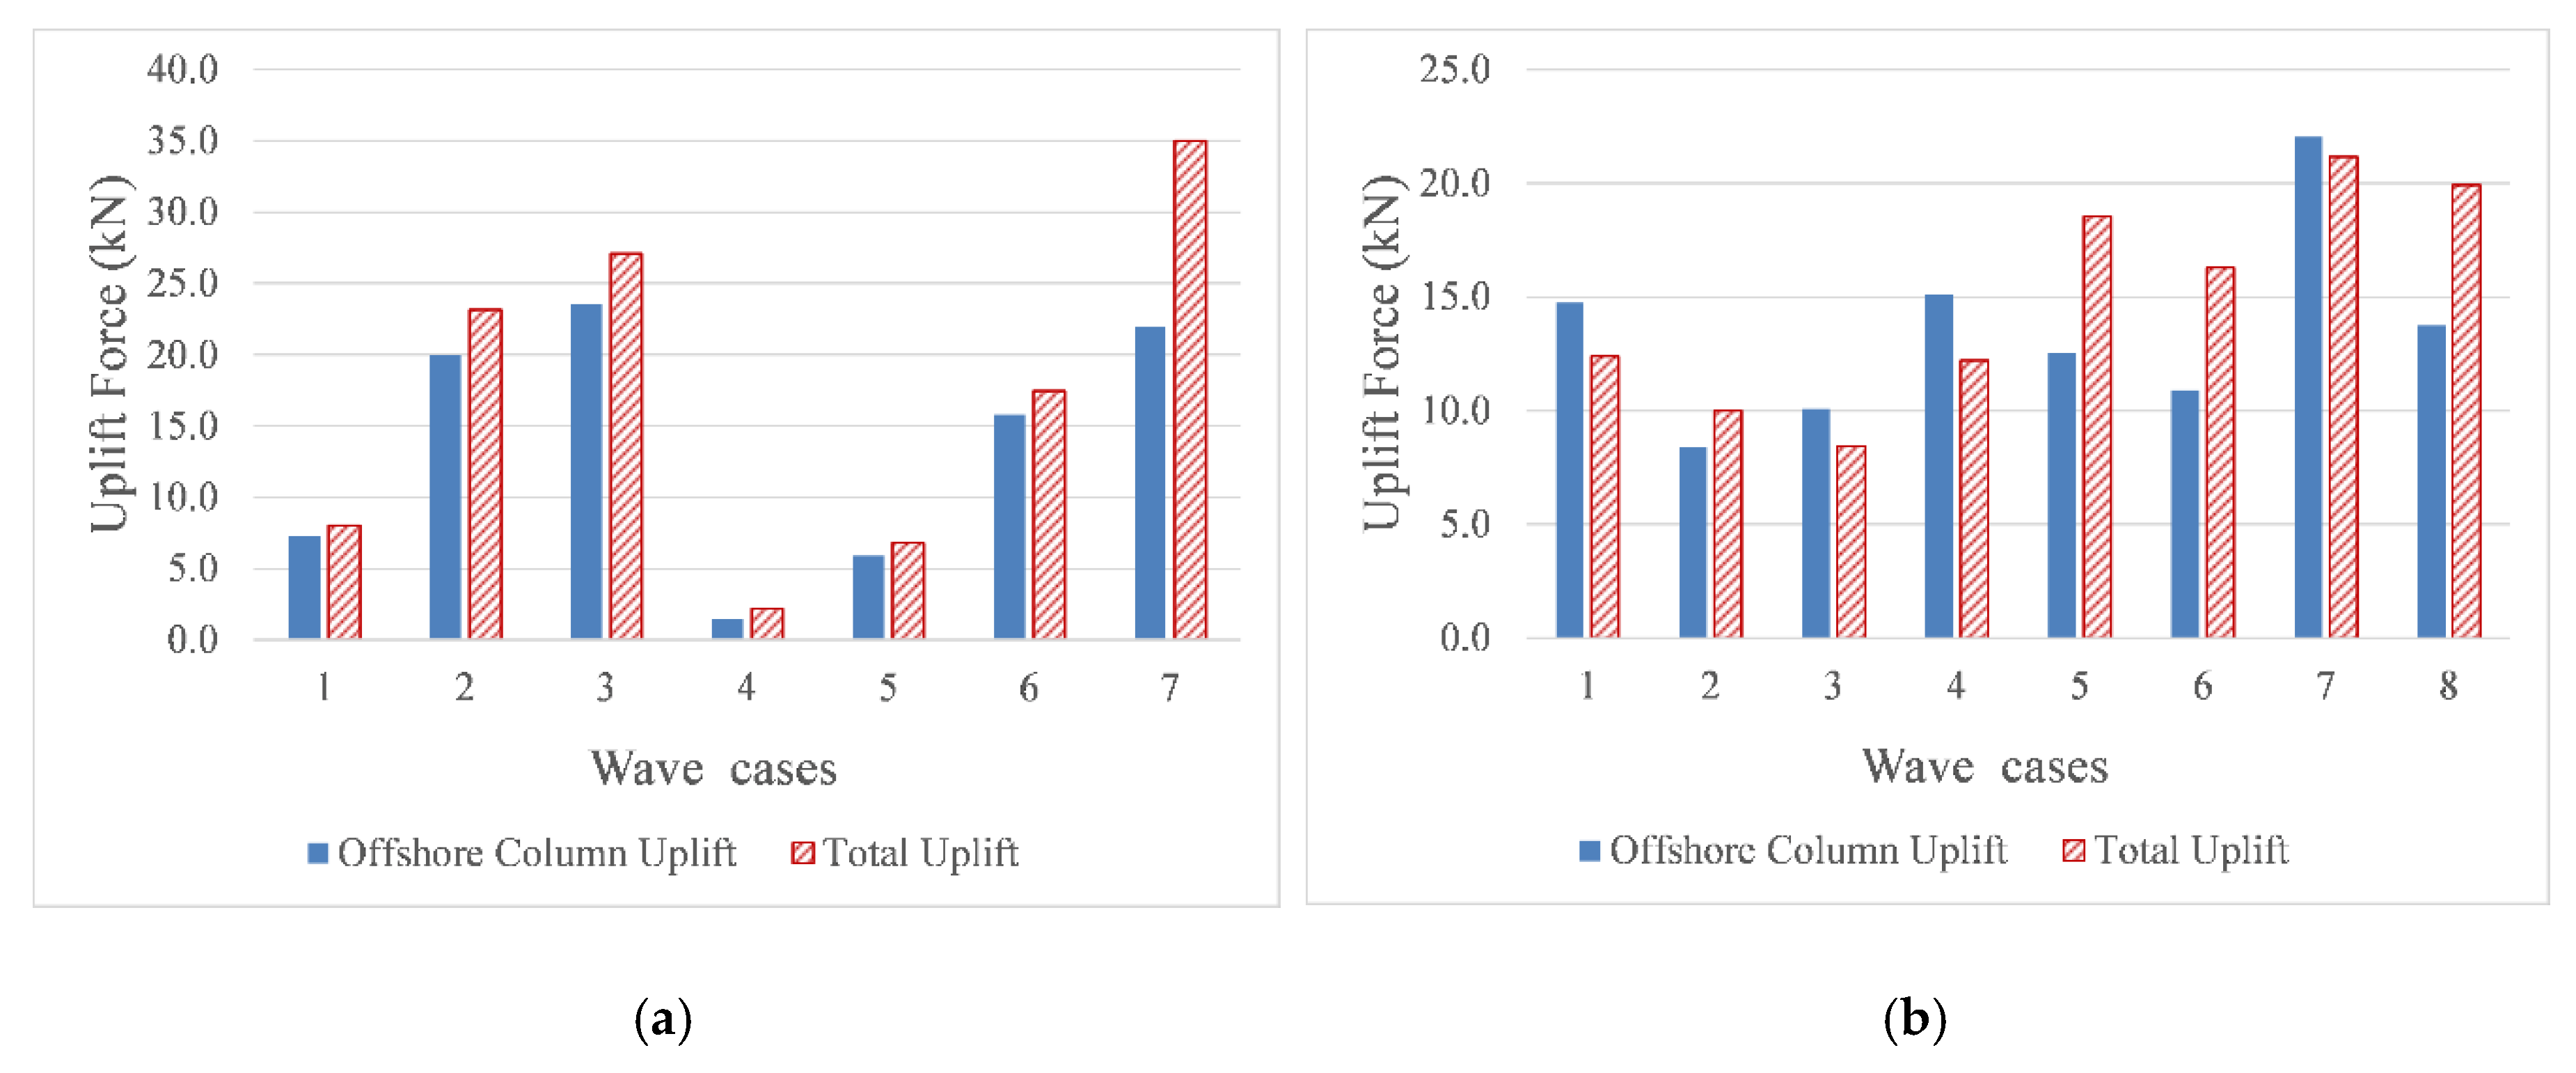
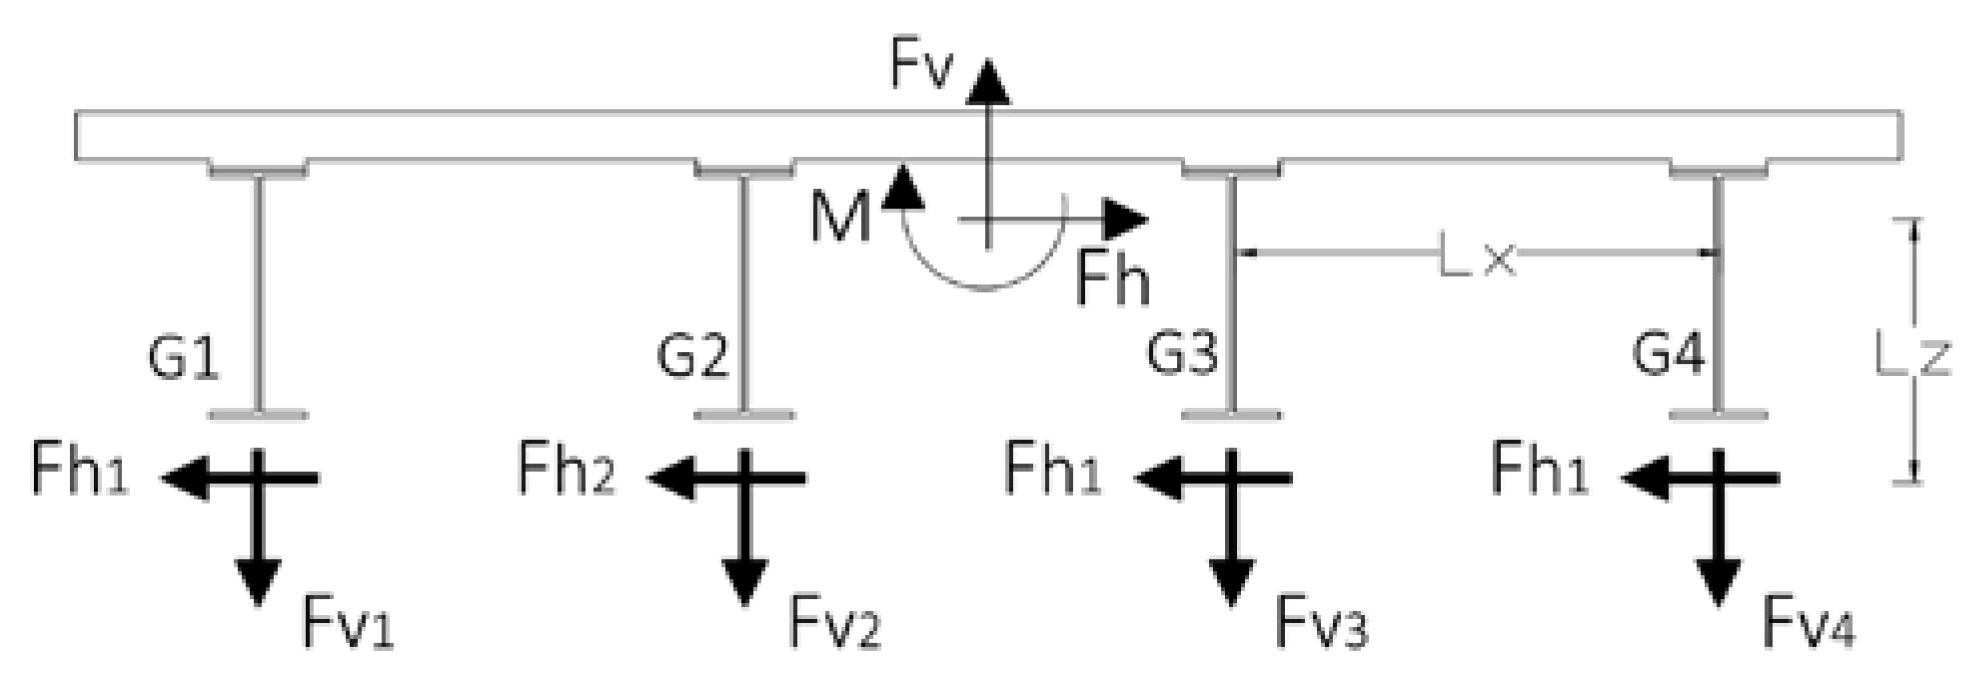
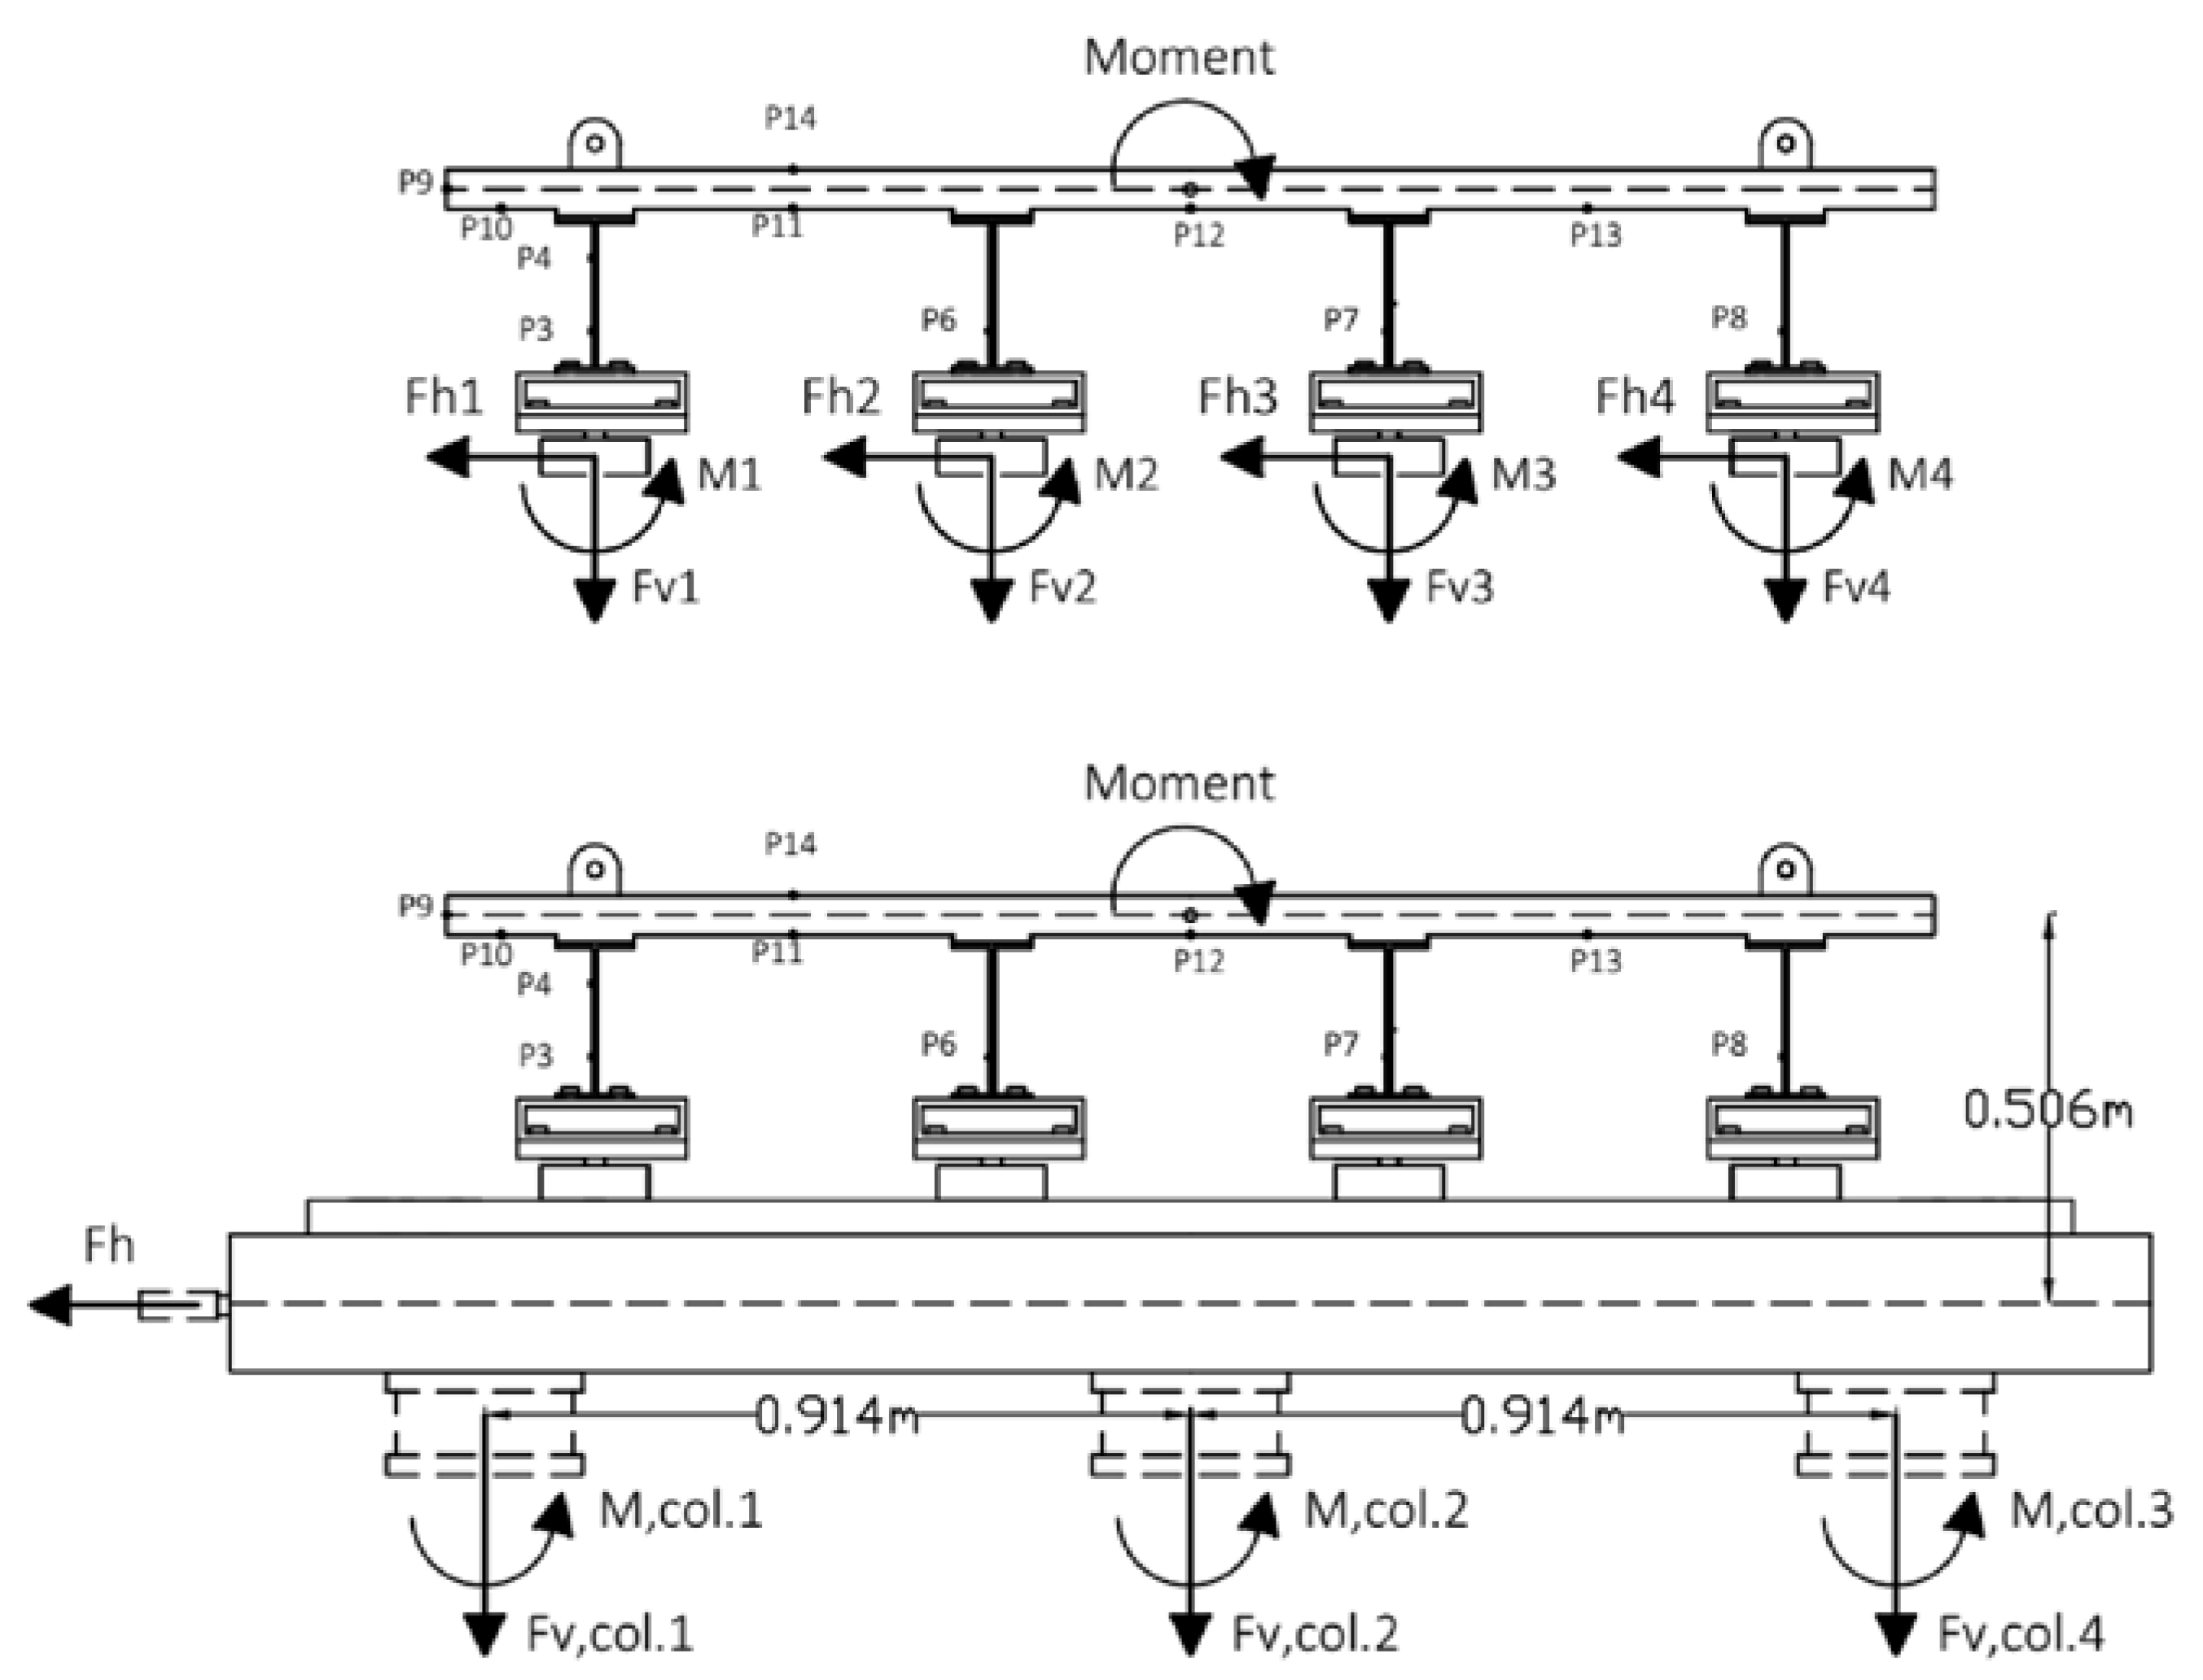
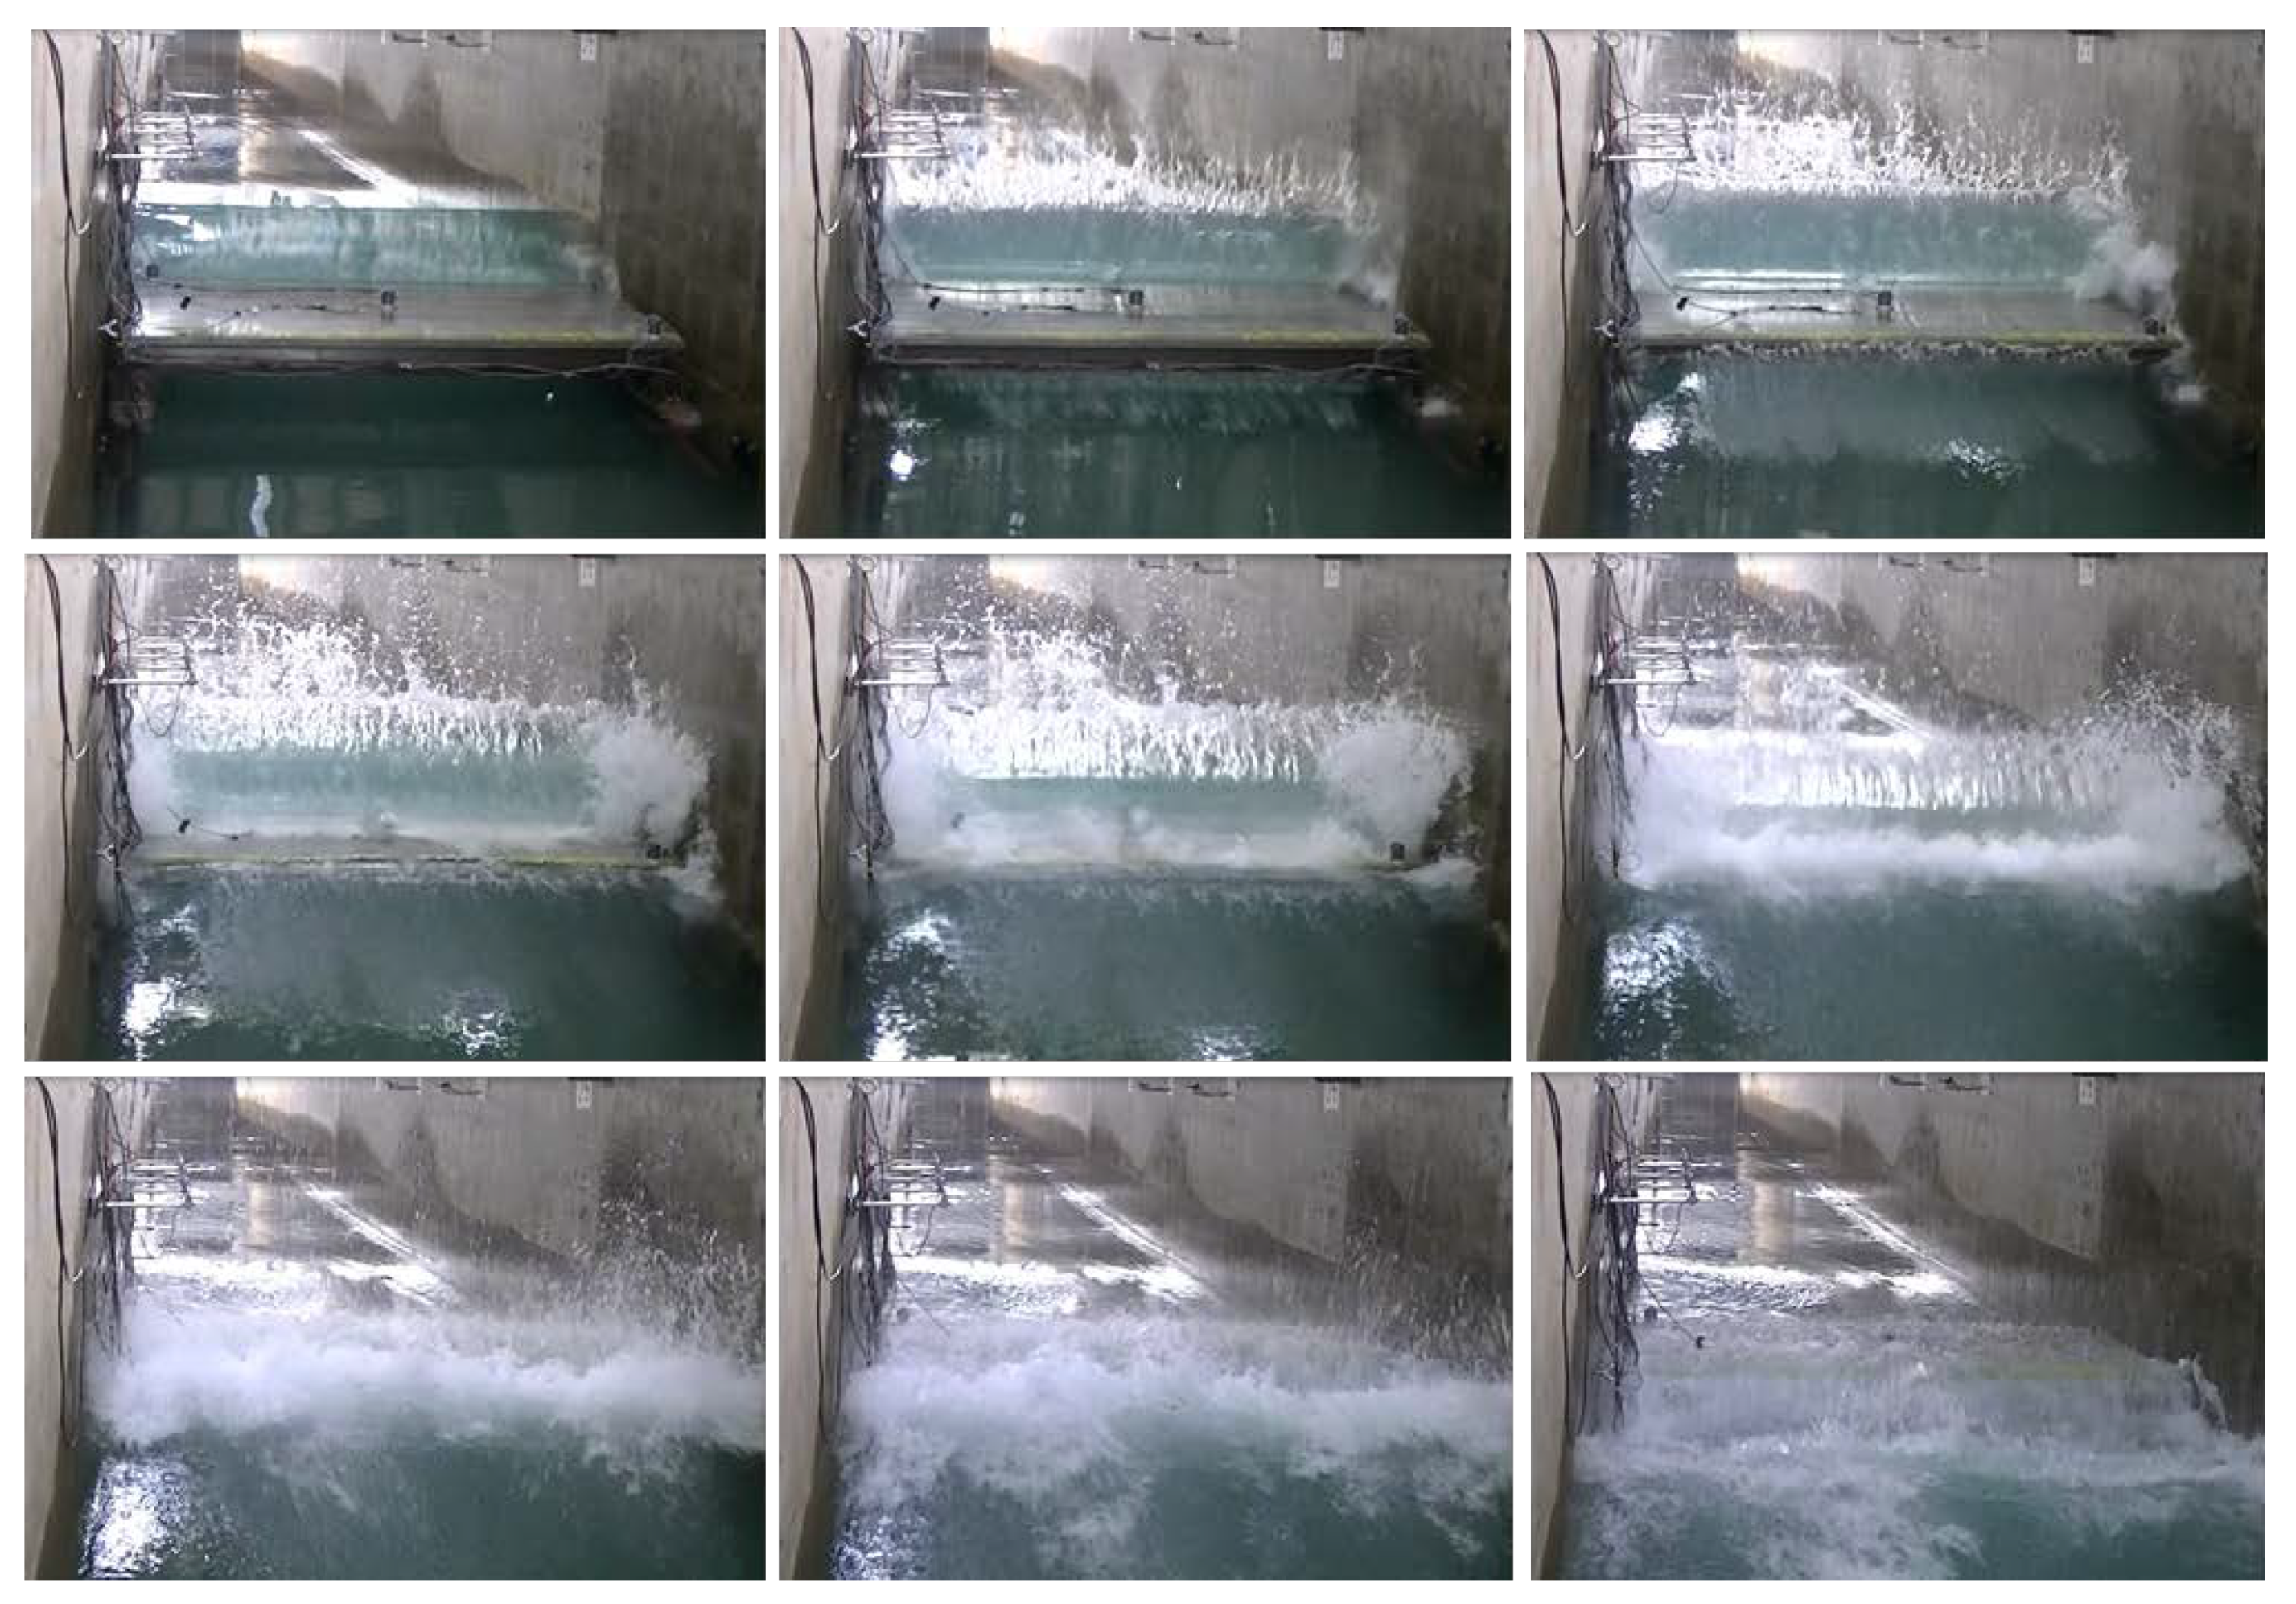
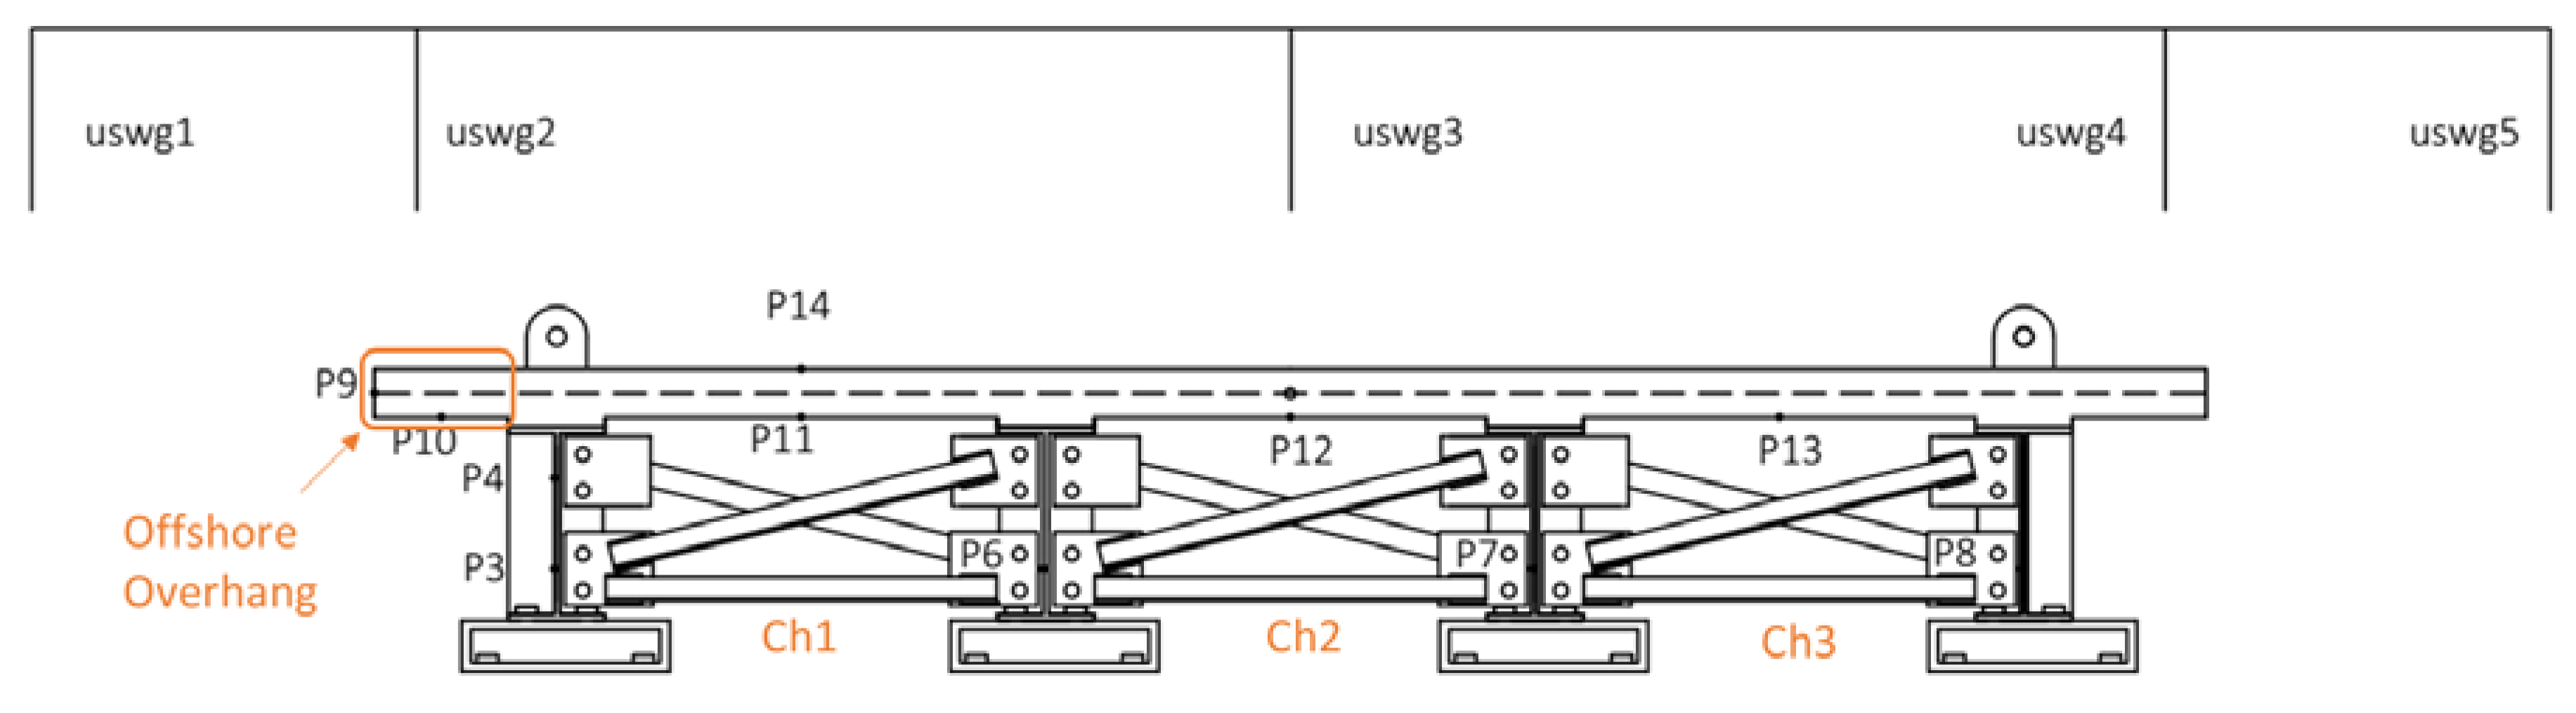
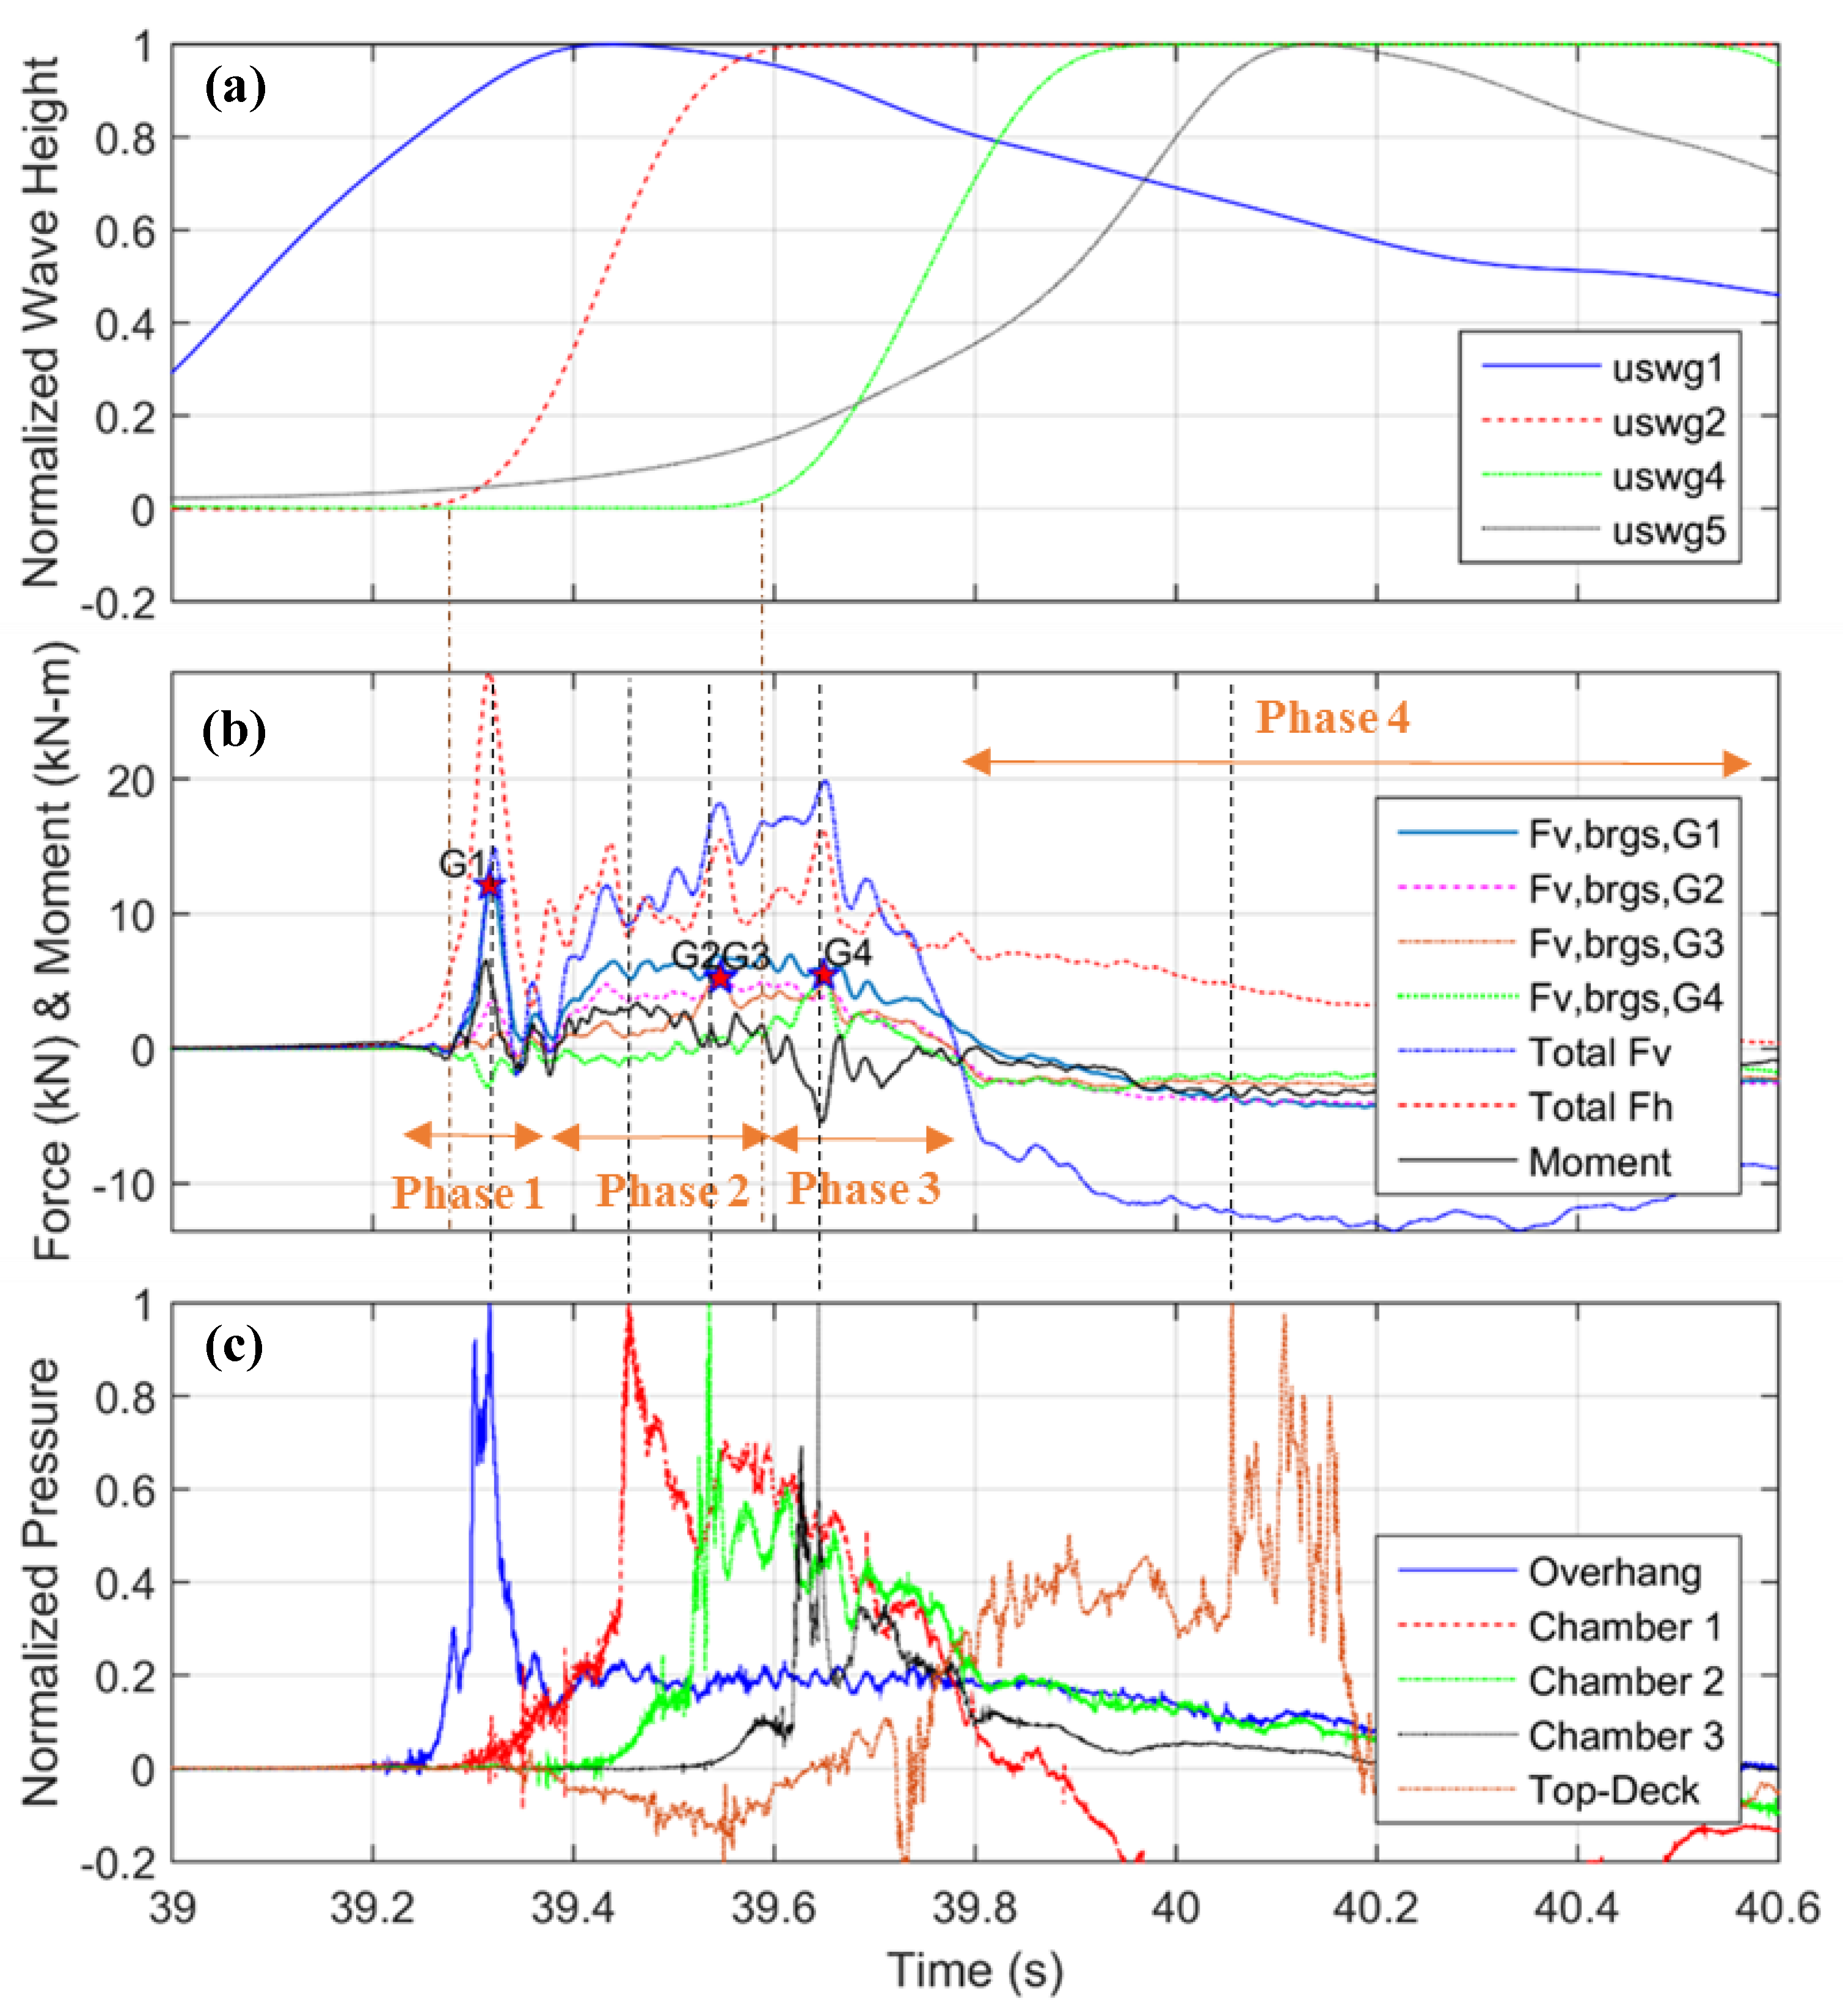
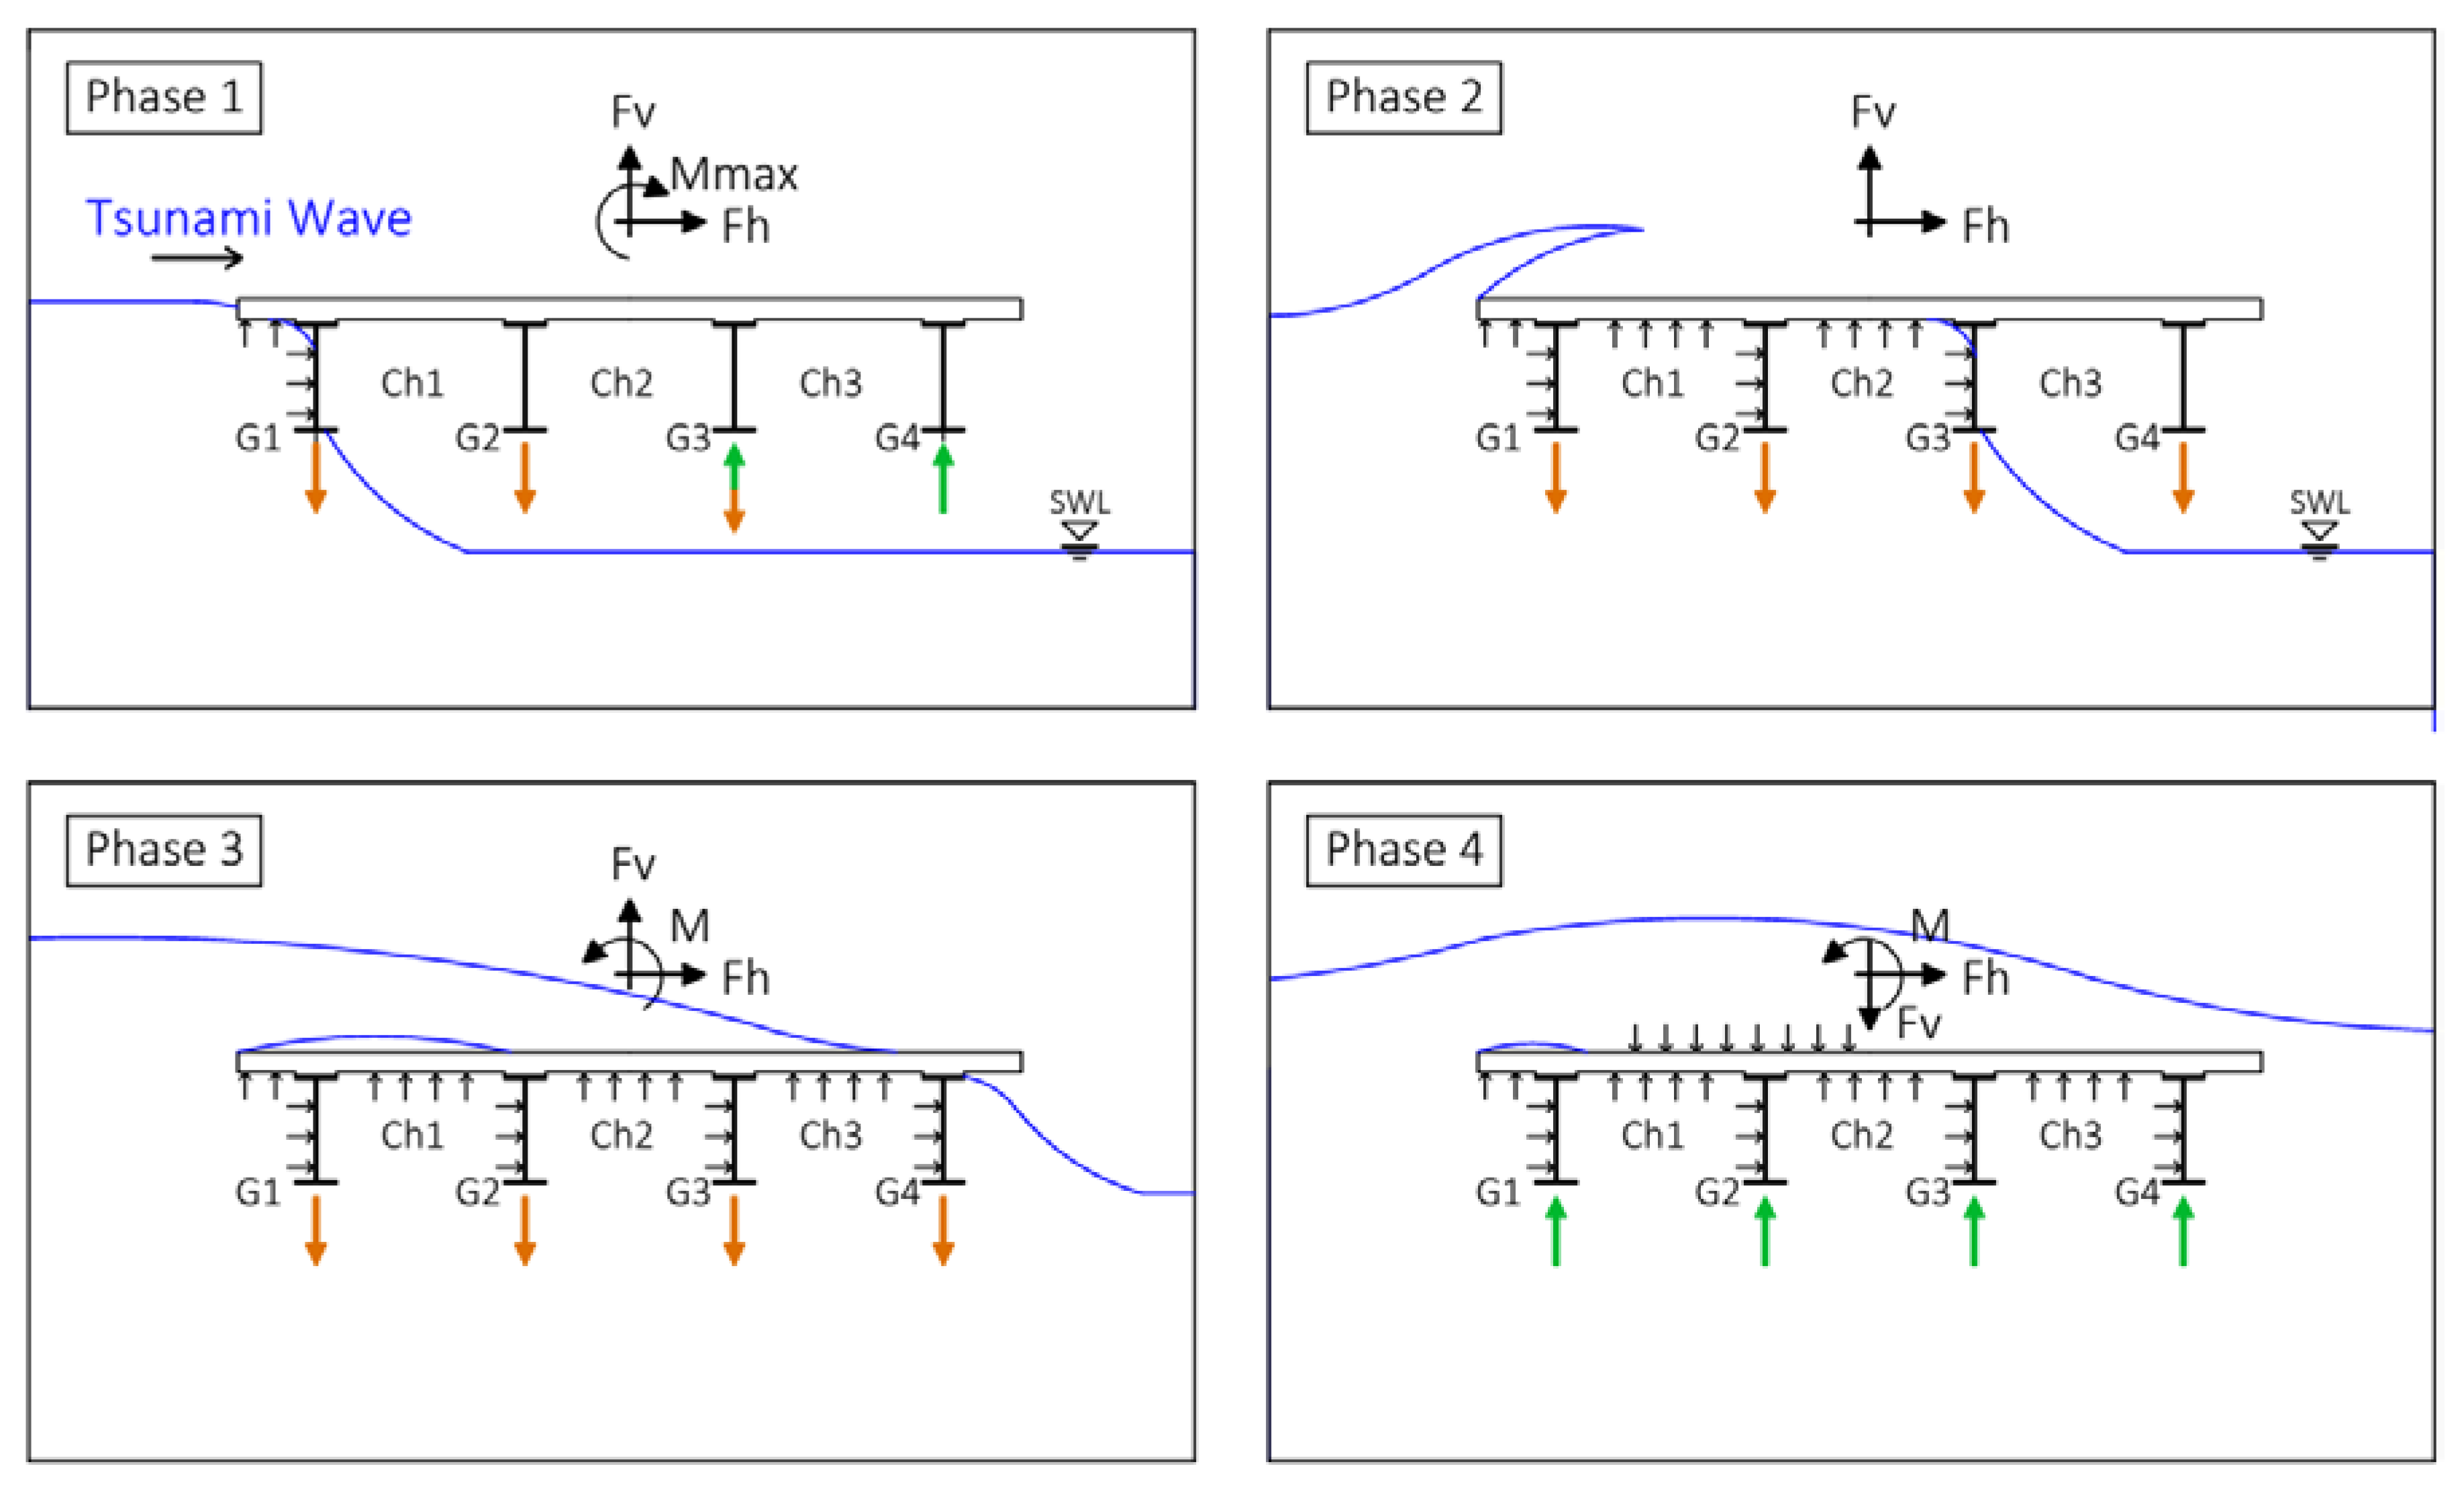
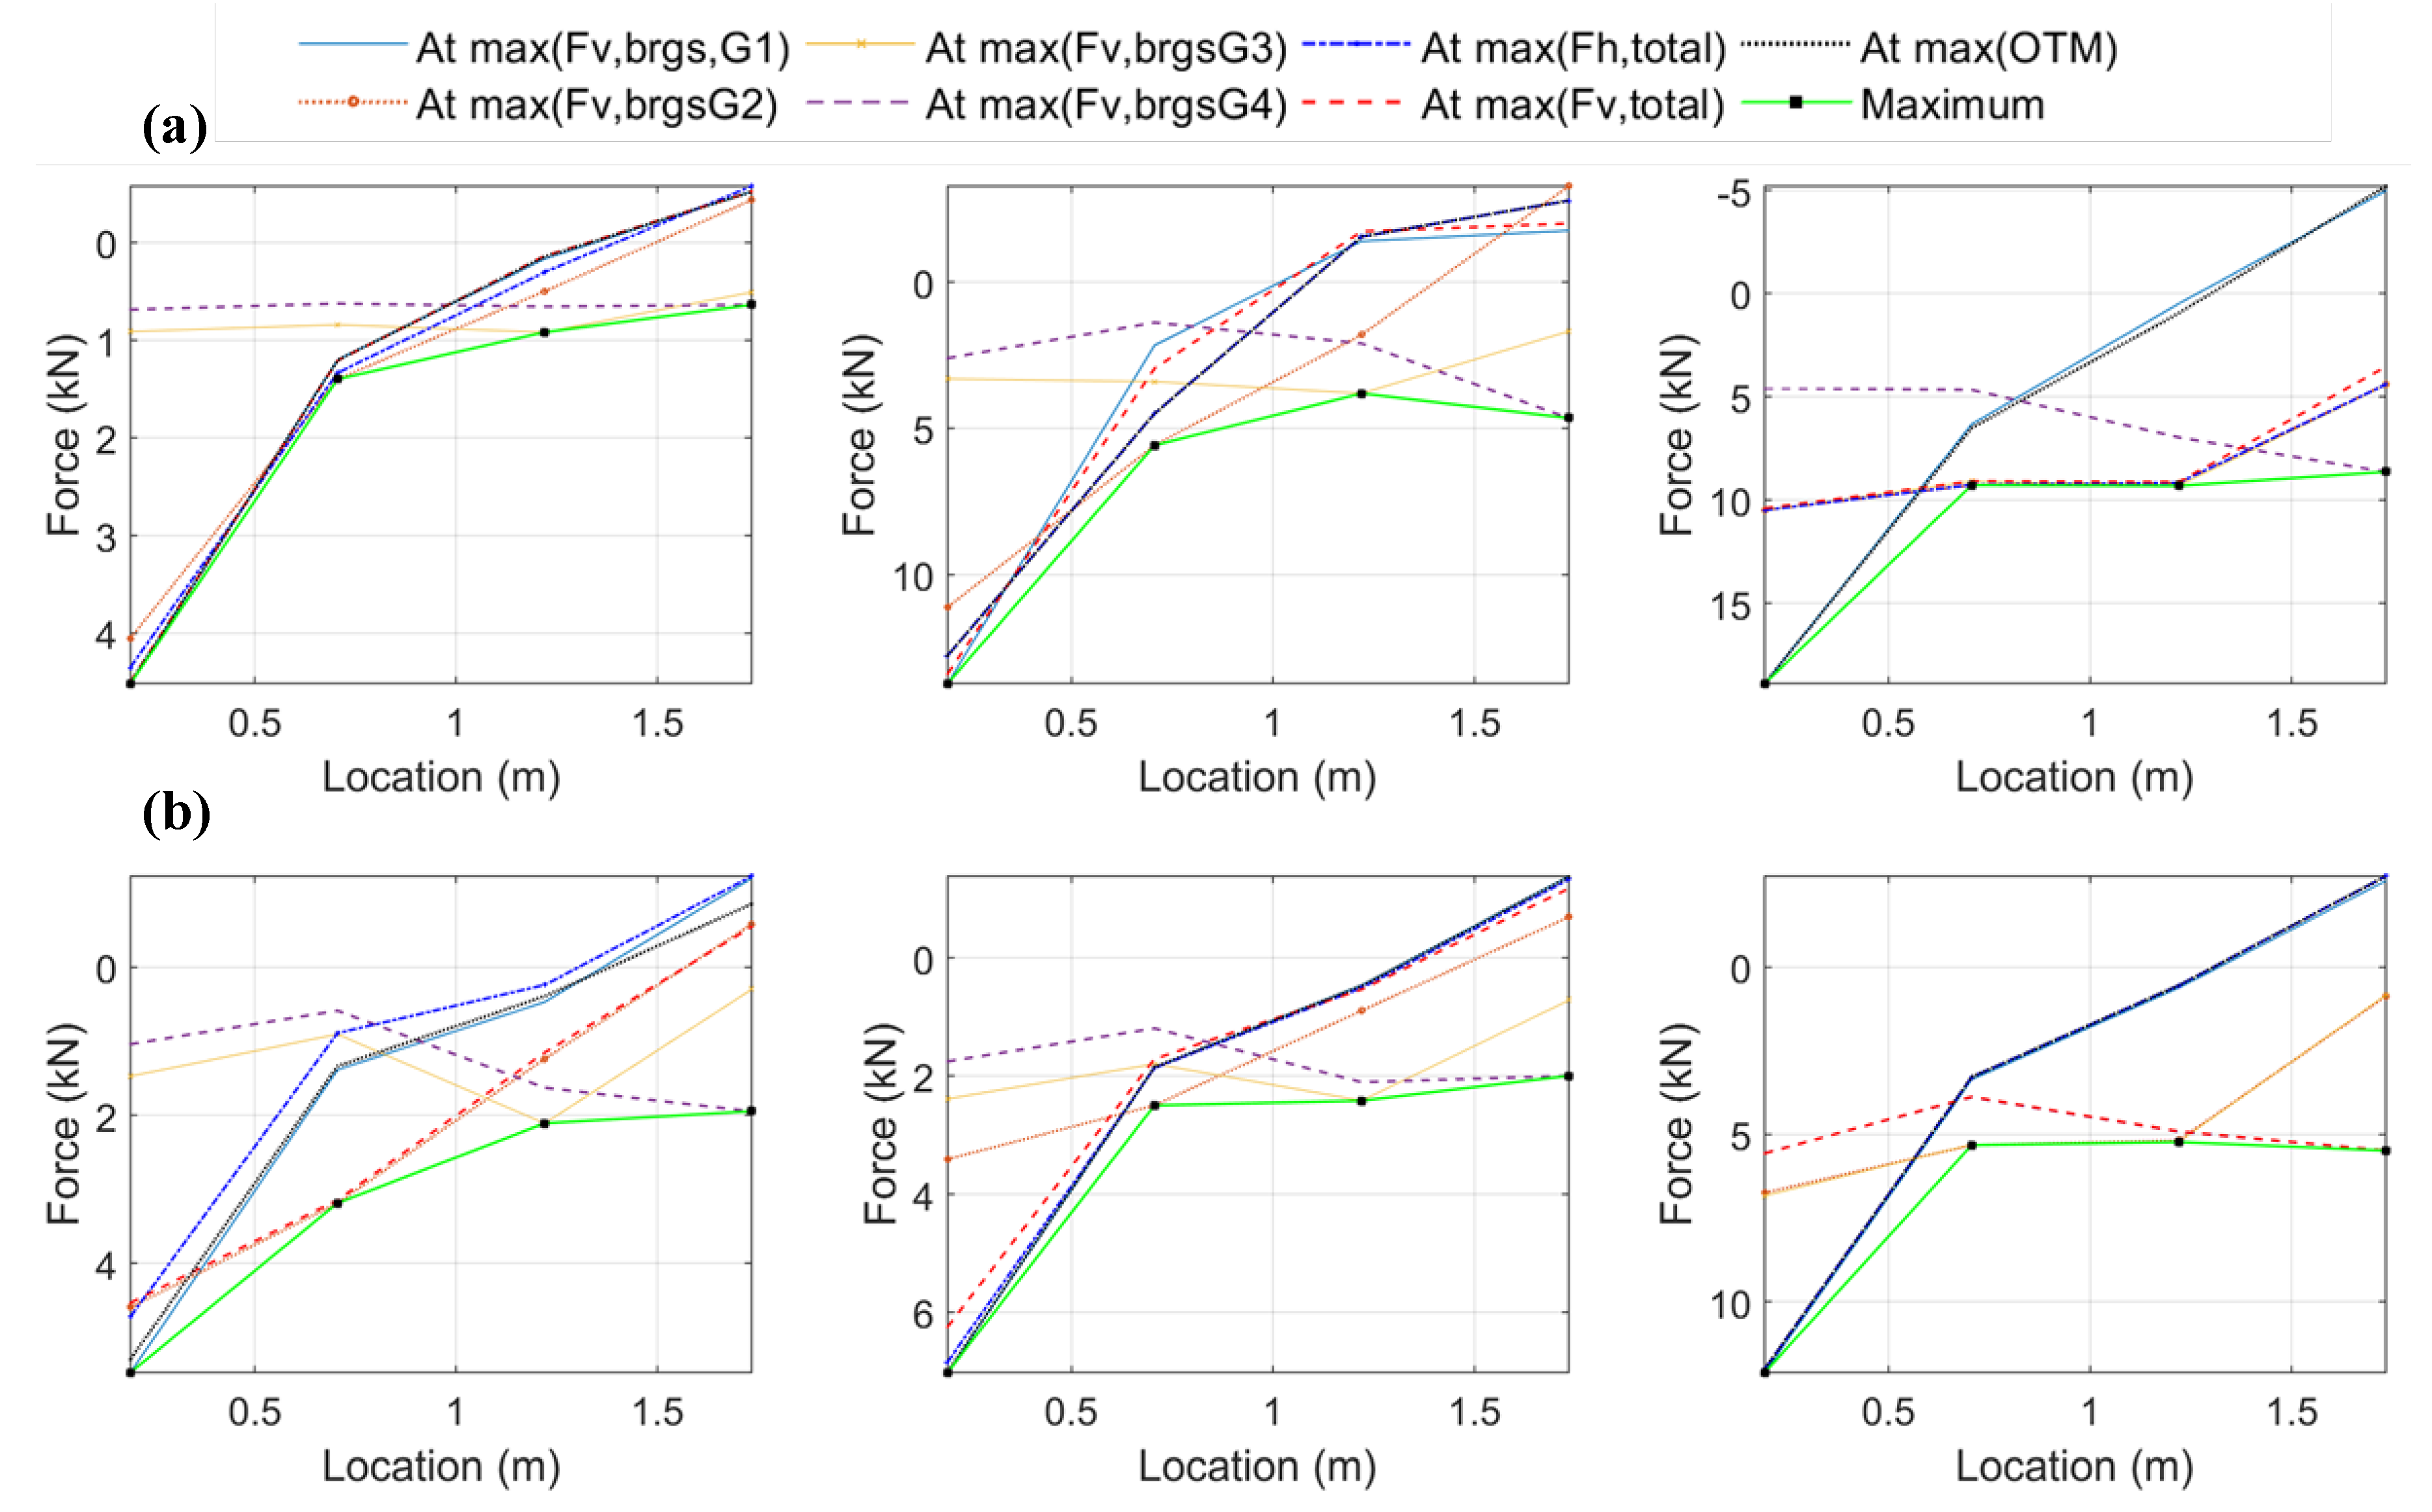
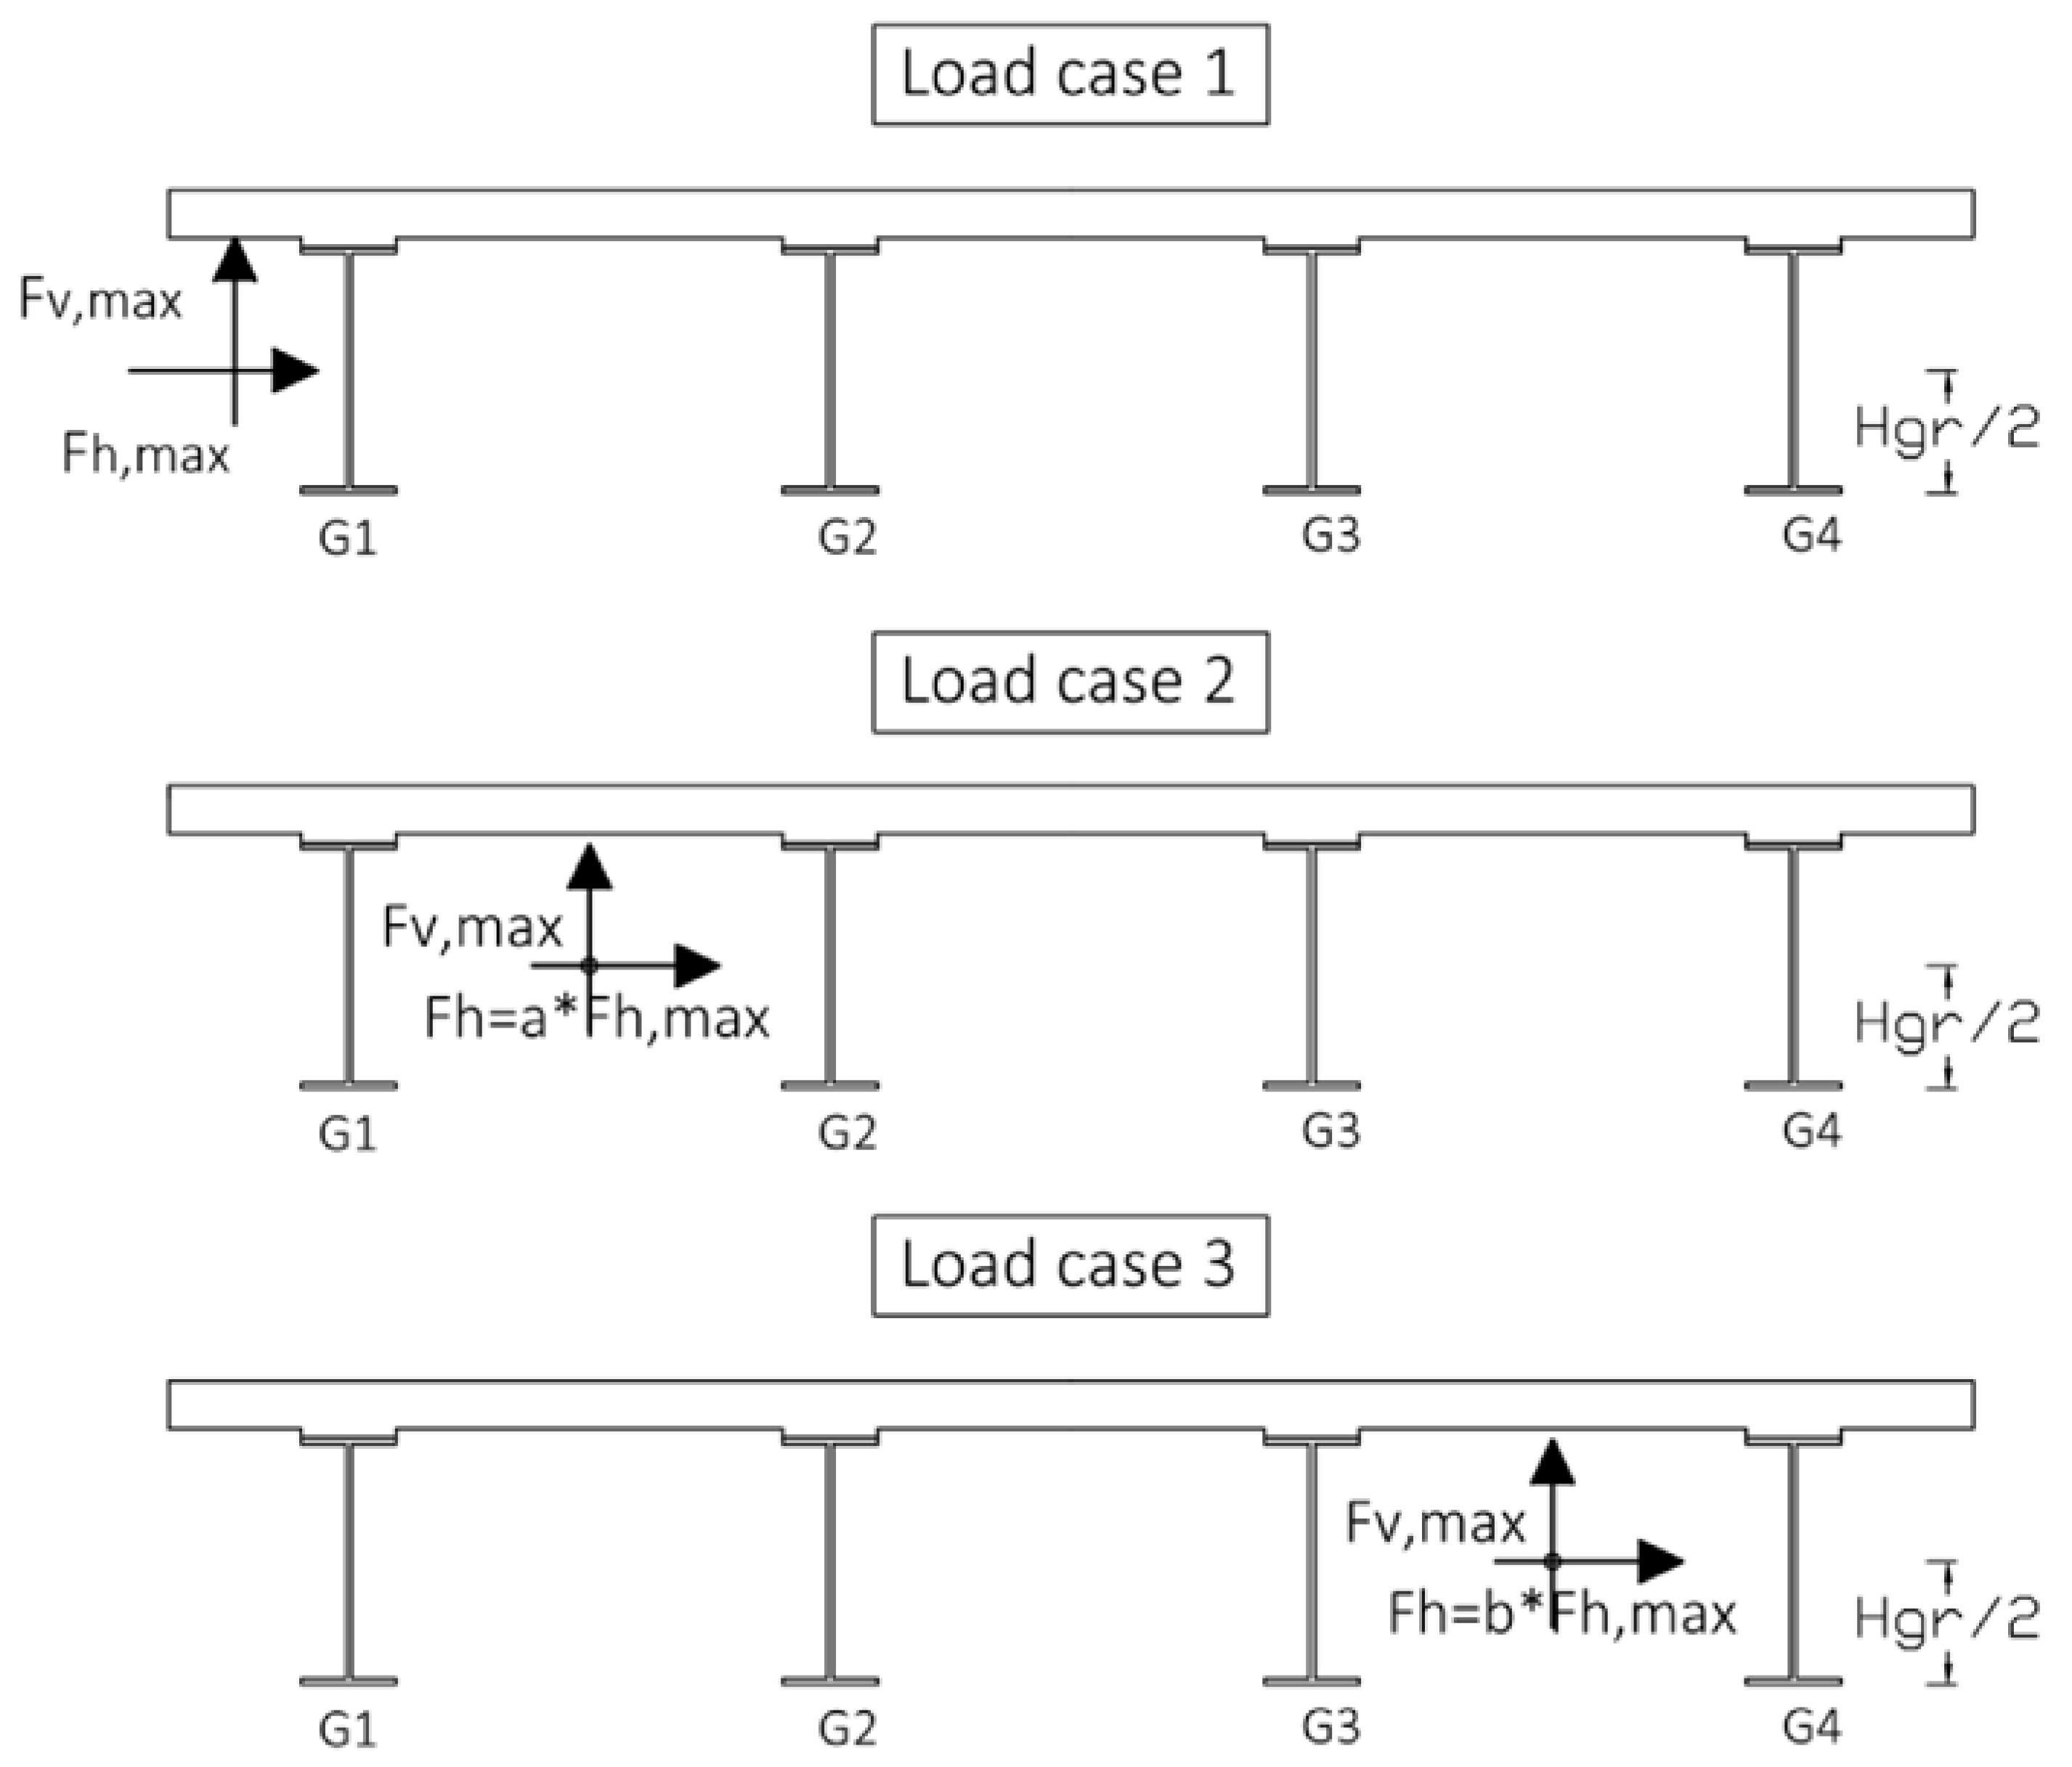
Table 1.
Wave matrix used in the experimental testing of the bridge with steel bearings.
| Water Depth (m) | Nominal Wave Height (m) | Wave Type |
|---|---|---|
| 1.90 | 0.46, 0.52, 0.65 | Unbroken solitary |
| 0.80, 1.00, 1.10, 1.30 | Bore | |
| 2.00 | 0.36, 0.42, 0.52, 0.70 | Unbroken solitary |
| 0.90, 1.00, 1.20, 1.40 | Bore |
Table 2.
Ratio of experimentally recorded maximum uplift forces in each bearing relative to the maximum total uplift.
Table 2.
Ratio of experimentally recorded maximum uplift forces in each bearing relative to the maximum total uplift.
| Wave Type | Depth (m) | Wave Case # | Hinput (m) | Hwg12 (m) | Fup, G1/Fup, tot | Fup, G2/Fup, tot | Fup, G3/Fup, tot | Fup, G4/Fup, tot |
|---|---|---|---|---|---|---|---|---|
| Un-broken solitary | 1.90 | 1 | 0.46 | 0.56 | 0.72 | 0.23 | 0.12 | 0.09 |
| 2 | 0.52 | 0.64 | 0.77 | 0.35 | 0.19 | 0.29 | ||
| 3 | 0.65 | 0.87 | 0.71 | 0.26 | 0.19 | 0.17 | ||
| 2.00 | 4 | 0.36 | 0.40 | 0.44 | 0.19 | 0.18 | 0.21 | |
| 5 | 0.42 | 0.48 | 0.67 | 0.21 | 0.14 | 0.09 | ||
| 6 | 0.55 | 0.64 | 0.79 | 0.32 | 0.22 | 0.27 | ||
| 7 | 0.70 | 0.86 | 0.54 | 0.27 | 0.27 | 0.25 | ||
| Bore | 1.90 | 1 | 0.80 | 0.85 | 0.86 | 0.23 | 0.20 | 0.21 |
| 2 | 1.00 | 0.68 | 0.55 | 0.32 | 0.21 | 0.19 | ||
| 3 | 1.10 | 0.61 | 0.83 | 0.30 | 0.29 | 0.24 | ||
| 4 | 1.30 | 0.72 | 0.97 | 0.25 | 0.25 | 0.16 | ||
| 2.00 | 5 | 0.90 | 0.84 | 0.47 | 0.26 | 0.27 | 0.31 | |
| 6 | 1.00 | 0.76 | 0.47 | 0.29 | 0.25 | 0.35 | ||
| 7 | 1.20 | 0.73 | 0.77 | 0.26 | 0.22 | 0.21 | ||
| 8 | 1.40 | 0.75 | 0.48 | 0.26 | 0.25 | 0.27 |
Table 3.
Ratio of bearing and column-bent cap connection uplift forces calculated from the simplified method to the respective values recorded in the experiments.
Table 3.
Ratio of bearing and column-bent cap connection uplift forces calculated from the simplified method to the respective values recorded in the experiments.
| Wave Type | Hinput (m) | Bearings, G1 | Bearings, G2 | Bearings, G3 | Bearings, G4 | Col. 1 | Col. 2 | Col. 3 |
|---|---|---|---|---|---|---|---|---|
| Un-broken solitary | 0.46 | 0.52 | 1.17 | 1.30 | 0.63 | 0.70 | 2.12 | 0.19 |
| 0.52 | 0.41 | 0.71 | 0.92 | 0.37 | 0.61 | 1.58 | 0.34 | |
| 0.65 | 0.54 | 1.06 | 0.91 | 0.40 | 0.73 | 1.87 | 0.11 | |
| 0.36 | 0.85 | 1.25 | 0.49 | −0.24 | 1.08 | 1.90 | −0.17 | |
| 0.42 | 0.53 | 1.23 | 1.15 | 0.62 | 0.70 | 2.43 | 0.27 | |
| 0.55 | 0.41 | 0.79 | 0.84 | 0.42 | 0.59 | 1.75 | 0.33 | |
| 0.70 | 0.63 | 1.02 | 0.77 | 0.56 | 0.83 | 1.55 | 0.45 | |
| Bore | 0.80 | 0.73 | 1.59 | 0.59 | −0.67 | 0.89 | 2.22 | −1.91 |
| 1.00 | 0.92 | 0.97 | 0.56 | −0.39 | 1.05 | 1.87 | −1.05 | |
| 1.10 | 0.77 | 1.25 | 0.37 | −0.68 | 0.91 | 1.69 | −1.37 | |
| 1.30 | 0.67 | 1.53 | 0.49 | −0.87 | 0.88 | 2.03 | −1.94 | |
| 0.90 | 0.95 | 1.18 | 0.62 | 0.09 | 1.07 | 1.64 | −0.17 | |
| 1.00 | 0.99 | 1.11 | 0.65 | 0.02 | 1.15 | 1.83 | −0.28 | |
| 1.20 | 0.68 | 1.29 | 0.70 | −0.14 | 0.82 | 1.82 | −0.71 | |
| 1.40 | 0.95 | 1.21 | 0.67 | 0.09 | 1.07 | 1.77 | −0.21 |
Table 4.
Ratio of bearing and column-bent cap connection uplift forces calculated from the improved simplified method (with applied moment) to the respective values recorded in the experiments.
Table 4.
Ratio of bearing and column-bent cap connection uplift forces calculated from the improved simplified method (with applied moment) to the respective values recorded in the experiments.
| Wave Type | Hinput (m) | Brngs, G1 | Brngs, G2 | Brngs, G3 | Brngs, G4 | Col. 1 | Col. 2 | Col. 3 |
|---|---|---|---|---|---|---|---|---|
| Unbroken solitary | 0.46 | 0.93 | 1.61 | 0.51 | −2.66 | 1.01 | 2.12 | −1.36 |
| 0.52 | 0.91 | 1.07 | 0.26 | −0.94 | 1.10 | 1.58 | −0.70 | |
| 0.65 | 0.96 | 1.44 | 0.38 | −1.37 | 1.14 | 1.87 | −1.02 | |
| 0.36 | 1.06 | 1.40 | 0.33 | −0.66 | 1.20 | 1.90 | −0.36 | |
| 0.42 | 0.90 | 1.64 | 0.53 | −2.05 | 0.98 | 2.43 | −0.89 | |
| 0.55 | 0.89 | 1.18 | 0.26 | −0.99 | 1.09 | 1.75 | −0.80 | |
| 0.70 | 1.13 | 1.36 | 0.43 | −0.53 | 1.30 | 1.55 | −0.46 | |
| Bore | 0.80 | 0.98 | 1.89 | 0.23 | −1.69 | 1.12 | 2.22 | −3.24 |
| 1.00 | 1.16 | 1.11 | 0.35 | −1.08 | 1.21 | 1.87 | −1.70 | |
| 1.10 | 0.99 | 1.46 | 0.15 | −1.46 | 1.09 | 1.69 | −2.08 | |
| 1.30 | 0.97 | 1.91 | 0.10 | −2.65 | 1.09 | 2.03 | −3.13 | |
| 0.90 | 1.29 | 1.38 | 0.42 | −0.43 | 1.36 | 1.64 | −0.74 | |
| 1.00 | 1.25 | 1.25 | 0.48 | −0.34 | 1.41 | 1.83 | −0.75 | |
| 1.20 | 0.97 | 1.58 | 0.36 | −1.19 | 1.05 | 1.82 | −1.66 | |
| 1.40 | 1.23 | 1.39 | 0.49 | −0.43 | 1.29 | 1.77 | −0.65 |
Table 5.
Ratios of bearing and column-bent cap connection uplift forces calculated from load case 1 of the improved method to the respective values recorded in the experiments.
Table 5.
Ratios of bearing and column-bent cap connection uplift forces calculated from load case 1 of the improved method to the respective values recorded in the experiments.
| Wave Type | Hinput (m) | Brngs, G1 | Brngs, G2 | Brngs, G3 | Brngs, G4 | Col. 1 | Col. 2 | Col. 3 |
|---|---|---|---|---|---|---|---|---|
| Unbroken solitary | 0.46 | 1.07 | 1.75 | 0.24 | −3.79 | 1.12 | 2.12 | −1.87 |
| 0.52 | 0.94 | 1.10 | 0.21 | −1.03 | 1.06 | 1.58 | −0.62 | |
| 0.65 | 1.13 | 1.59 | 0.18 | −2.07 | 1.19 | 1.87 | −1.17 | |
| 0.36 | 1.46 | 1.72 | 0.01 | −1.49 | 1.47 | 1.90 | −0.82 | |
| 0.42 | 1.10 | 1.84 | 0.22 | −3.40 | 1.12 | 2.43 | −1.45 | |
| 0.55 | 0.95 | 1.23 | 0.20 | −1.16 | 1.03 | 1.75 | −0.67 | |
| 0.70 | 1.49 | 1.61 | 0.19 | −1.32 | 1.53 | 1.55 | −0.92 | |
| Bore | 0.80 | 1.18 | 2.13 | −0.06 | −2.52 | 1.21 | 2.22 | −3.79 |
| 1.00 | 1.56 | 1.34 | 0.00 | −2.19 | 1.46 | 1.87 | −2.76 | |
| 1.10 | 1.21 | 1.67 | −0.06 | −2.22 | 1.22 | 1.69 | −2.58 | |
| 1.30 | 1.08 | 2.05 | −0.05 | −3.29 | 1.20 | 2.03 | −3.80 | |
| 0.90 | 1.85 | 1.72 | 0.09 | −1.28 | 1.68 | 1.64 | −1.36 | |
| 1.00 | 1.88 | 1.60 | 0.08 | −1.20 | 1.76 | 1.83 | −1.39 | |
| 1.20 | 1.22 | 1.83 | 0.06 | −2.10 | 1.21 | 1.82 | −2.29 | |
| 1.40 | 1.84 | 1.76 | 0.10 | −1.51 | 1.67 | 1.77 | −1.42 |
Table 6.
Ratios of bearing and column-bent cap connection uplift forces calculated from load case 2 of the improved method to the respective values recorded in the experiments.
Table 6.
Ratios of bearing and column-bent cap connection uplift forces calculated from load case 2 of the improved method to the respective values recorded in the experiments.
| Wave Type | Hinput (m) | Brngs, G1 | Brngs, G2 | Brngs, G3 | Brngs, G4 | Col. 1 | Col. 2 | Col. 3 |
|---|---|---|---|---|---|---|---|---|
| Unbroken solitary | 0.46 | 0.79 | 1.45 | 0.79 | −1.49 | 0.88 | 2.12 | −0.70 |
| 0.52 | 0.68 | 0.91 | 0.56 | −0.35 | 0.83 | 1.58 | −0.12 | |
| 0.65 | 0.82 | 1.32 | 0.55 | −0.80 | 0.93 | 1.87 | −0.45 | |
| 0.36 | 1.09 | 1.43 | 0.31 | −0.72 | 1.20 | 1.90 | −0.36 | |
| 0.42 | 0.80 | 1.52 | 0.70 | −1.32 | 0.88 | 2.43 | −0.48 | |
| 0.55 | 0.69 | 1.02 | 0.51 | −0.39 | 0.80 | 1.75 | −0.15 | |
| 0.70 | 1.08 | 1.33 | 0.47 | −0.42 | 1.18 | 1.55 | −0.23 | |
| Bore | 0.80 | 0.88 | 1.77 | 0.37 | −1.29 | 0.96 | 2.22 | −2.34 |
| 1.00 | 1.16 | 1.11 | 0.35 | −1.07 | 1.17 | 1.87 | −1.54 | |
| 1.10 | 0.90 | 1.38 | 0.23 | −1.16 | 0.97 | 1.69 | −1.61 | |
| 1.30 | 0.81 | 1.70 | 0.31 | −1.69 | 0.95 | 2.03 | −2.37 | |
| 0.90 | 1.36 | 1.43 | 0.38 | −0.54 | 1.31 | 1.64 | −0.64 | |
| 1.00 | 1.39 | 1.33 | 0.40 | −0.52 | 1.38 | 1.83 | −0.70 | |
| 1.20 | 0.91 | 1.52 | 0.43 | −0.96 | 0.95 | 1.82 | −1.25 | |
| 1.40 | 1.35 | 1.46 | 0.41 | −0.64 | 1.31 | 1.77 | −0.69 |
Table 7.
Ratios of bearing forces calculated from load case 3 of the improved method to the respective values recorded in the experiments.
Table 7.
Ratios of bearing forces calculated from load case 3 of the improved method to the respective values recorded in the experiments.
| Wave Type | Hinput (m) | b = 0 | b = 0.50 | ||||||
|---|---|---|---|---|---|---|---|---|---|
| Brg1 | Brg2 | Brg3 | Brg4 | Brg1 | Brg2 | Brg3 | Brg4 | ||
| Unbroken solitary | 0.46 | −0.06 | 0.57 | 2.41 | 5.28 | 0.01 | 0.64 | 2.27 | 4.68 |
| 0.52 | −0.05 | 0.36 | 1.54 | 1.60 | −0.01 | 0.40 | 1.48 | 1.48 | |
| 0.65 | −0.06 | 0.52 | 1.65 | 2.93 | 0.01 | 0.58 | 1.56 | 2.61 | |
| 0.36 | −0.07 | 0.52 | 1.24 | 1.67 | 0.09 | 0.65 | 1.11 | 1.33 | |
| 0.42 | −0.06 | 0.60 | 2.12 | 4.79 | 0.01 | 0.68 | 2.00 | 4.26 | |
| 0.55 | −0.06 | 0.41 | 1.40 | 1.80 | −0.01 | 0.45 | 1.34 | 1.67 | |
| 0.70 | −0.09 | 0.54 | 1.25 | 2.12 | −0.03 | 0.58 | 1.21 | 1.99 | |
| Bore | 0.80 | −0.06 | 0.63 | 1.72 | 2.59 | 0.09 | 0.81 | 1.51 | 1.97 |
| 1.00 | −0.08 | 0.40 | 1.42 | 2.42 | 0.10 | 0.50 | 1.27 | 1.92 | |
| 1.10 | −0.06 | 0.48 | 1.16 | 2.21 | 0.10 | 0.63 | 1.01 | 1.65 | |
| 1.30 | −0.05 | 0.60 | 1.43 | 3.39 | 0.08 | 0.78 | 1.25 | 2.58 | |
| 0.90 | −0.10 | 0.55 | 1.23 | 1.68 | 0.05 | 0.64 | 1.15 | 1.45 | |
| 1.00 | −0.10 | 0.50 | 1.34 | 1.52 | 0.06 | 0.59 | 1.24 | 1.29 | |
| 1.20 | −0.06 | 0.56 | 1.57 | 2.51 | 0.06 | 0.68 | 1.42 | 2.08 | |
| 1.40 | −0.10 | 0.56 | 1.34 | 1.97 | 0.05 | 0.65 | 1.24 | 1.70 | |
© 2018 by the authors. Licensee MDPI, Basel, Switzerland. This article is an open access article distributed under the terms and conditions of the Creative Commons Attribution (CC BY) license (http://creativecommons.org/licenses/by/4.0/).
Share and Cite
MDPI and ACS Style
Istrati, D.; Buckle, I.; Lomonaco, P.; Yim, S. Deciphering the Tsunami Wave Impact and Associated Connection Forces in Open-Girder Coastal Bridges. J. Mar. Sci. Eng. 2018, 6, 148. https://doi.org/10.3390/jmse6040148
AMA Style
Istrati D, Buckle I, Lomonaco P, Yim S. Deciphering the Tsunami Wave Impact and Associated Connection Forces in Open-Girder Coastal Bridges. Journal of Marine Science and Engineering. 2018; 6(4):148. https://doi.org/10.3390/jmse6040148
Chicago/Turabian StyleIstrati, Denis, Ian Buckle, Pedro Lomonaco, and Solomon Yim. 2018. "Deciphering the Tsunami Wave Impact and Associated Connection Forces in Open-Girder Coastal Bridges" Journal of Marine Science and Engineering 6, no. 4: 148. https://doi.org/10.3390/jmse6040148
Note that from the first issue of 2016, this journal uses article numbers instead of page numbers. See further details here.