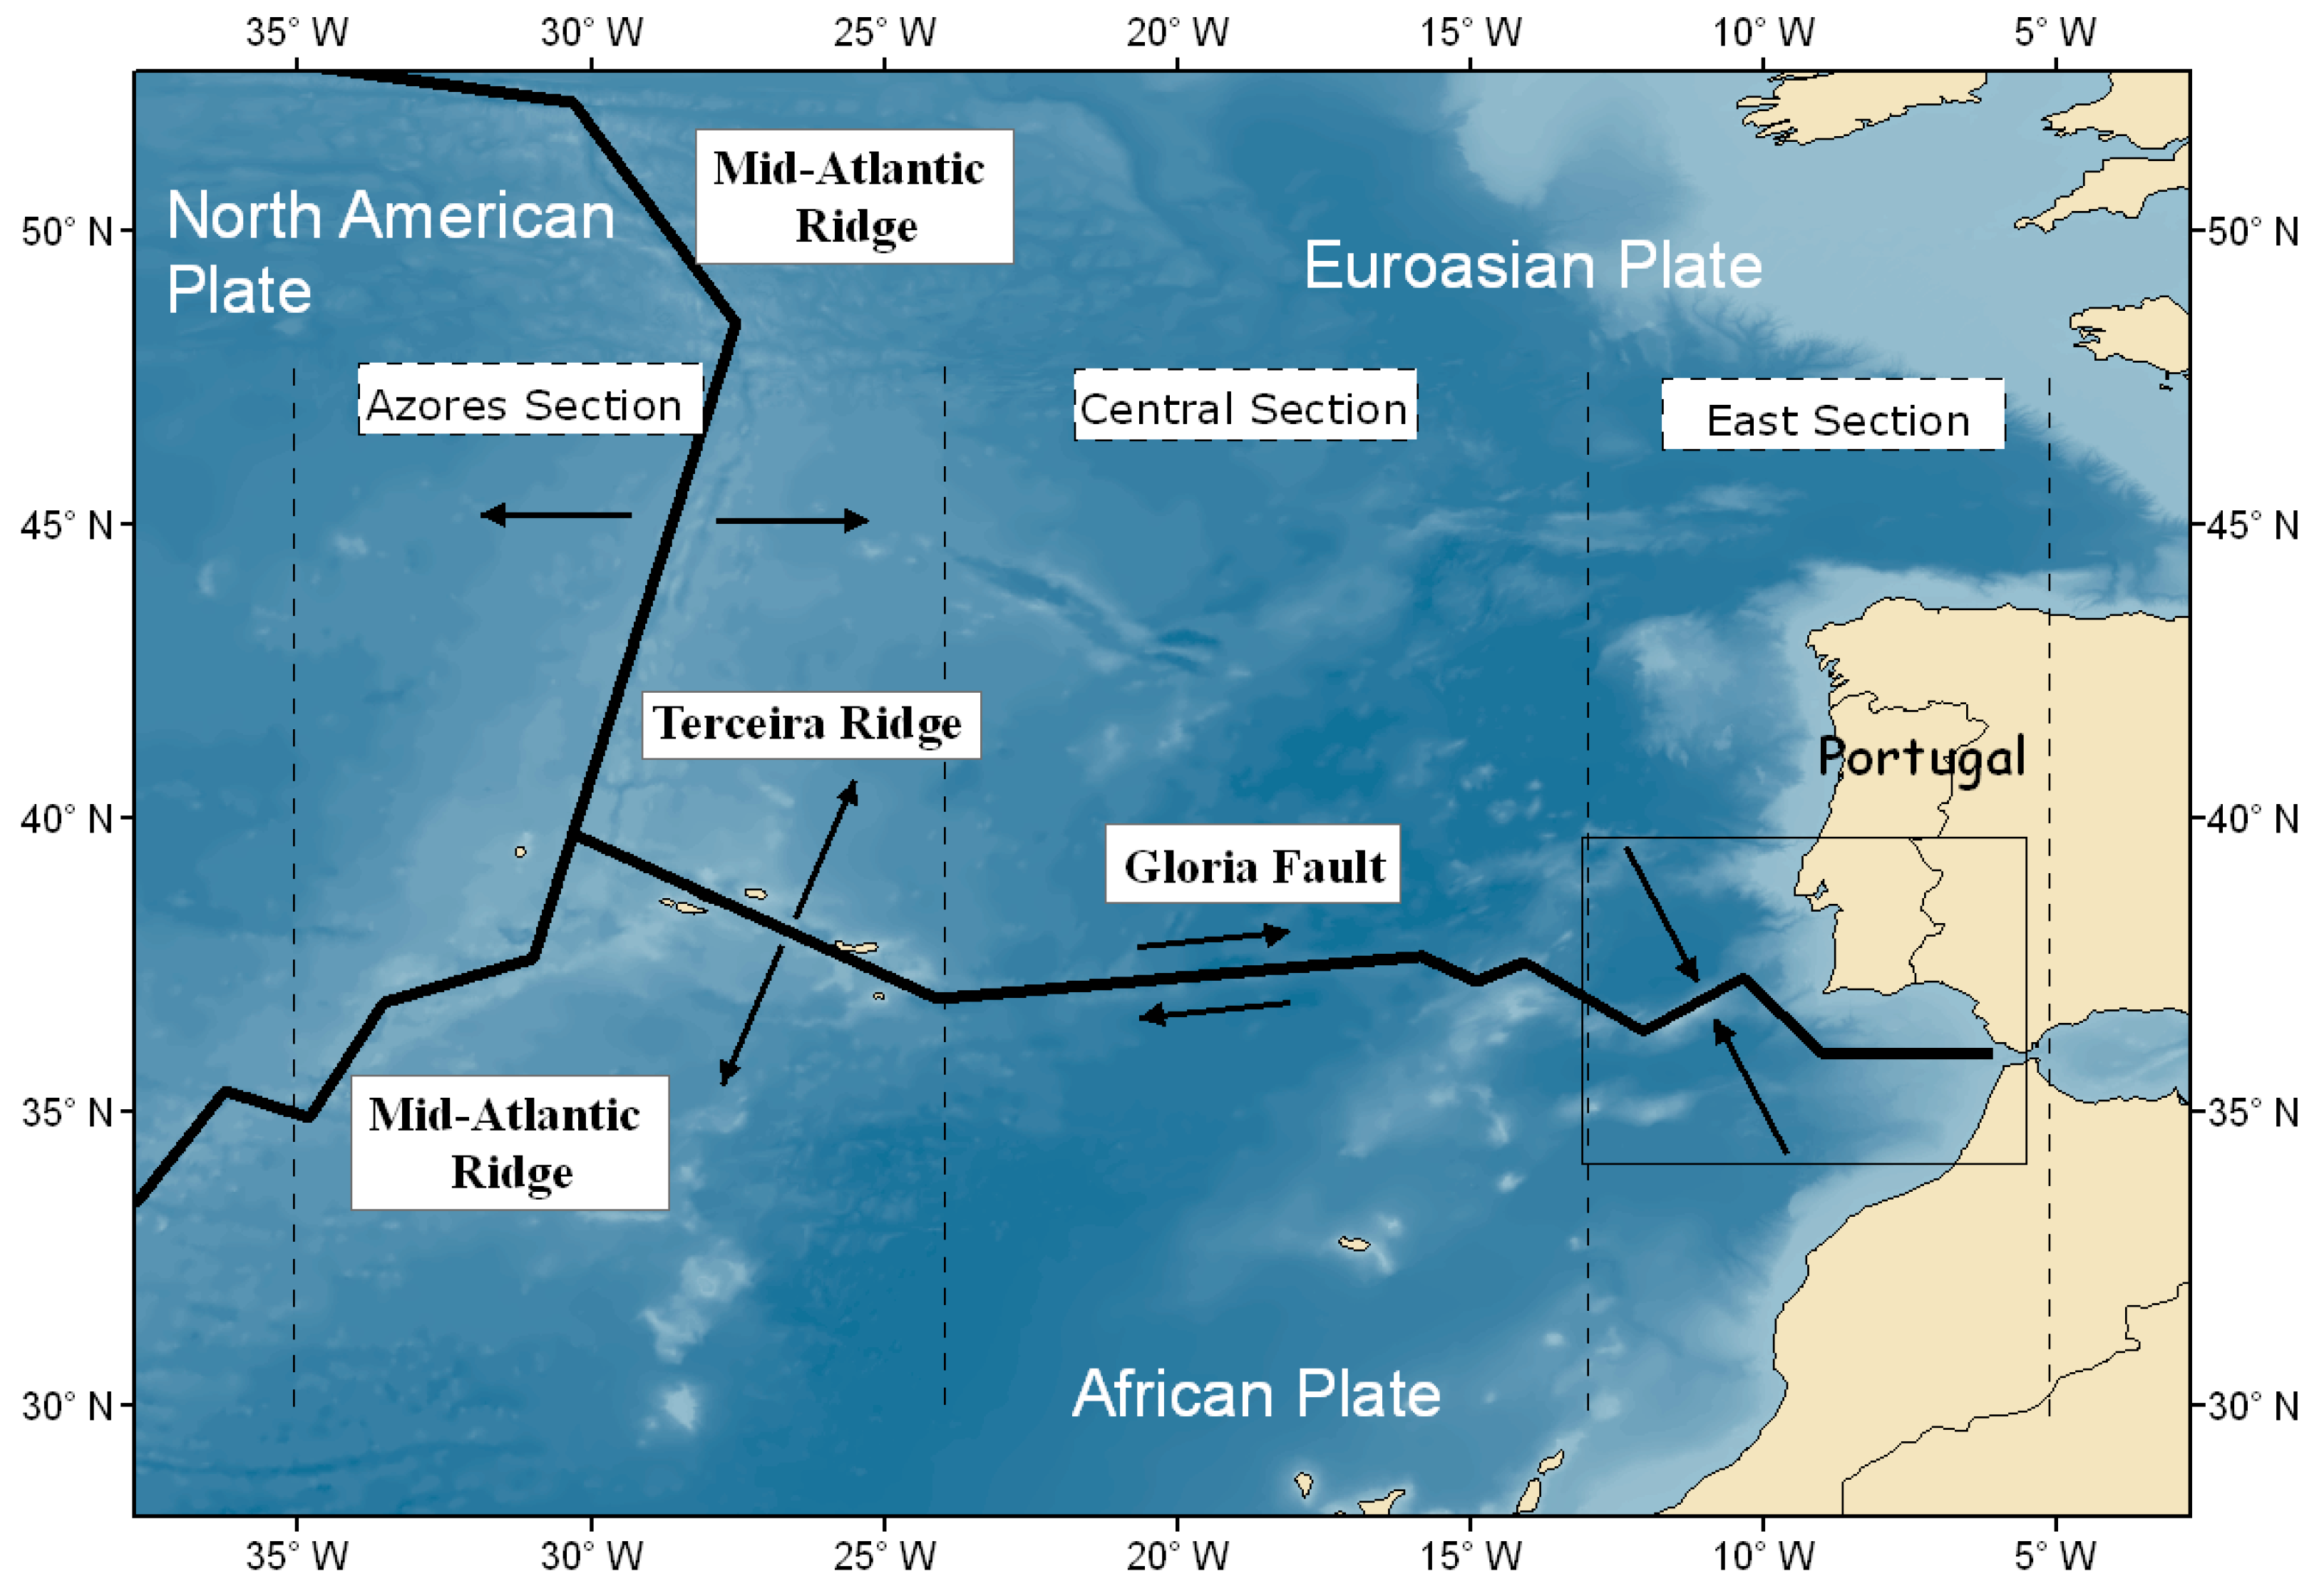
2. Review of the Seismo-Tectonics Offshore of the Portuguese Mainland
The seismo-tectonics offshore of the Portuguese mainland show that the current tectonic regime at the boundary of the African and Eurasian plates is located within 35–40°N. This boundary is commonly divided into three sections [
3], presented in
Figure 2 ([
4]): (i) the Azores Section (35°W to 24°W): the feature that dominates the Azores section is the triple point where the North American, Euroasian and African plates join. The Terceira Ridge is responsible for the active volcanism found in the Azores islands. (ii) The Central Section (24°W to 13°W): the main feature is the Gloria Fault, a rectilinear right-lateral fault. The east end of this fault is not well defined; (iii) the East section (13°W to 5°W): the tectonics of the East section (see the rectangle in
Figure 2) is governed by the interaction between the Euroasian and African plates [
5]. This is a region of complex bathymetry with a very low convergence rate of 4 mm yr
−1 [
6,
7], trending NW–SE, consistent with the observed maximum horizontal stress direction [
8,
9,
10,
11]. The transition between the localized and diffuse plate boundary may be due to a change in the nature and age of the lithosphere [
12]. The main bathymetry structures of the East section are presented in
Figure 3.
The East Section is dominated by the Gorringe Bank (
Figure 3). It is orientated in a SW–NE direction, consistent with the tectonics of the region, where the stress field is dominated by a trending approximately in the NW–SE direction [
5]. It has dimensions of 200 km by 80 km and reaches 25 m below the mean sea level, separating Tagus and Horseshoe Abyssal Plaines (
Figure 3); it is asymmetrical, with the northern flank steeper than the southern. Gorringe Bank consists of 2 seamounts, the Gettysburg Seamount, in the Southwest and Ormonde Seamount, in the Northwest, separated by a saddle-shaped structure [
13,
14,
15]. An idea of a thrust origin for the Gorringe Bank has been supported by in situ core sampling. A deep sea drilling project (DSDP) showed that the Gorringe Bank has a number of similarities to an ophiolite complex [
15]. The Gettysburg Seamount appears to be essentially formed of serpentinite, whereas the basement of the Ormonde Seamount appears to consist of an oceanic section with gabbros of Berriasian age (143 Ma). It has been proposed by several authors that the Gorringe Bank is an uplifted thrust block of crustal and upper mantle rocks, resulting from the Euroasia–Africa collision (for ex., [
14,
15]). In fact, it has been shown that the Gorringe Bank over thrusted the Tagus Abyssal Plain for 4–5 km [
16], although its seismic profile was inconclusive.
The Horseshoe Scarp (HSS) is situated to the SW of the Cabo São Vicente Canyon (CSVC) reverse fault, in the SE flank of the Horseshoe Abyssal Plain. It dips to the SE and just to the west of the fault. It is the origin of the
Ms = 8.0 earthquake occurred in 28 February, 1969 (
Figure 4). This was the highest instrumental earthquake event in the Iberia–Morocco–Atlantic domain [
11,
17].
The seismic activity at Cabo São Vicente Canyon (CSVC) could be attributed to infiltration of the sea water along the fault plane and corresponding lubrication, facilitating the movement along it [
13]. Deformation is distributed over an increasingly large area that can reach a N–S width of 300 km near the continental margin of Iberia [
18].
A small area between 7°W–8°W and 36°N–37°N shows significant seismic activity (
Figure 4), but the bathymetry variation is not significant, compared with the previous structures. The authors did not find publications related to this area and further tectonic investigation should be carried out in this zone. Nevertheless, it is the most likely location of the source of the 1722 earthquake and tsunami (
Figure 4c).
Another structure, but with less seismic activity, is the Pereira de Sousa Scarp (PSS), a N–S normal fault with downthrown of the west of the block. It was uplifted and rotated by ongoing compression without reactivation because it is not suitably oriented relative to the present stress field; below it is the East dipping blind thrust of Príncipe de Avis seamount. It is a possible source for the earthquake occurred on the 12th November, 1858, offshore Sines and Setúbal (
Figure 4).
Guadalquivir Bank (GaB) is an E–W pop-up, 50 km long and 30 km wide. It is the source of instrumental seismicity, suggesting active uplift of an inherited paleo-relief of late Mesozoic age [
8,
16].
Another interesting structure is the Marquês de Pombal Scarp (MPS), which was identified as a major overthrust [
18,
19], oriented NNE–SSW of the continental margin over the ocean basins to the WNW, with sea bottom elevation of 1.1 km in a domain located 100 km to the SW of Portugal; this thrust could be followed in that direction for 60 km and extended at least to 30 km depth [
3].
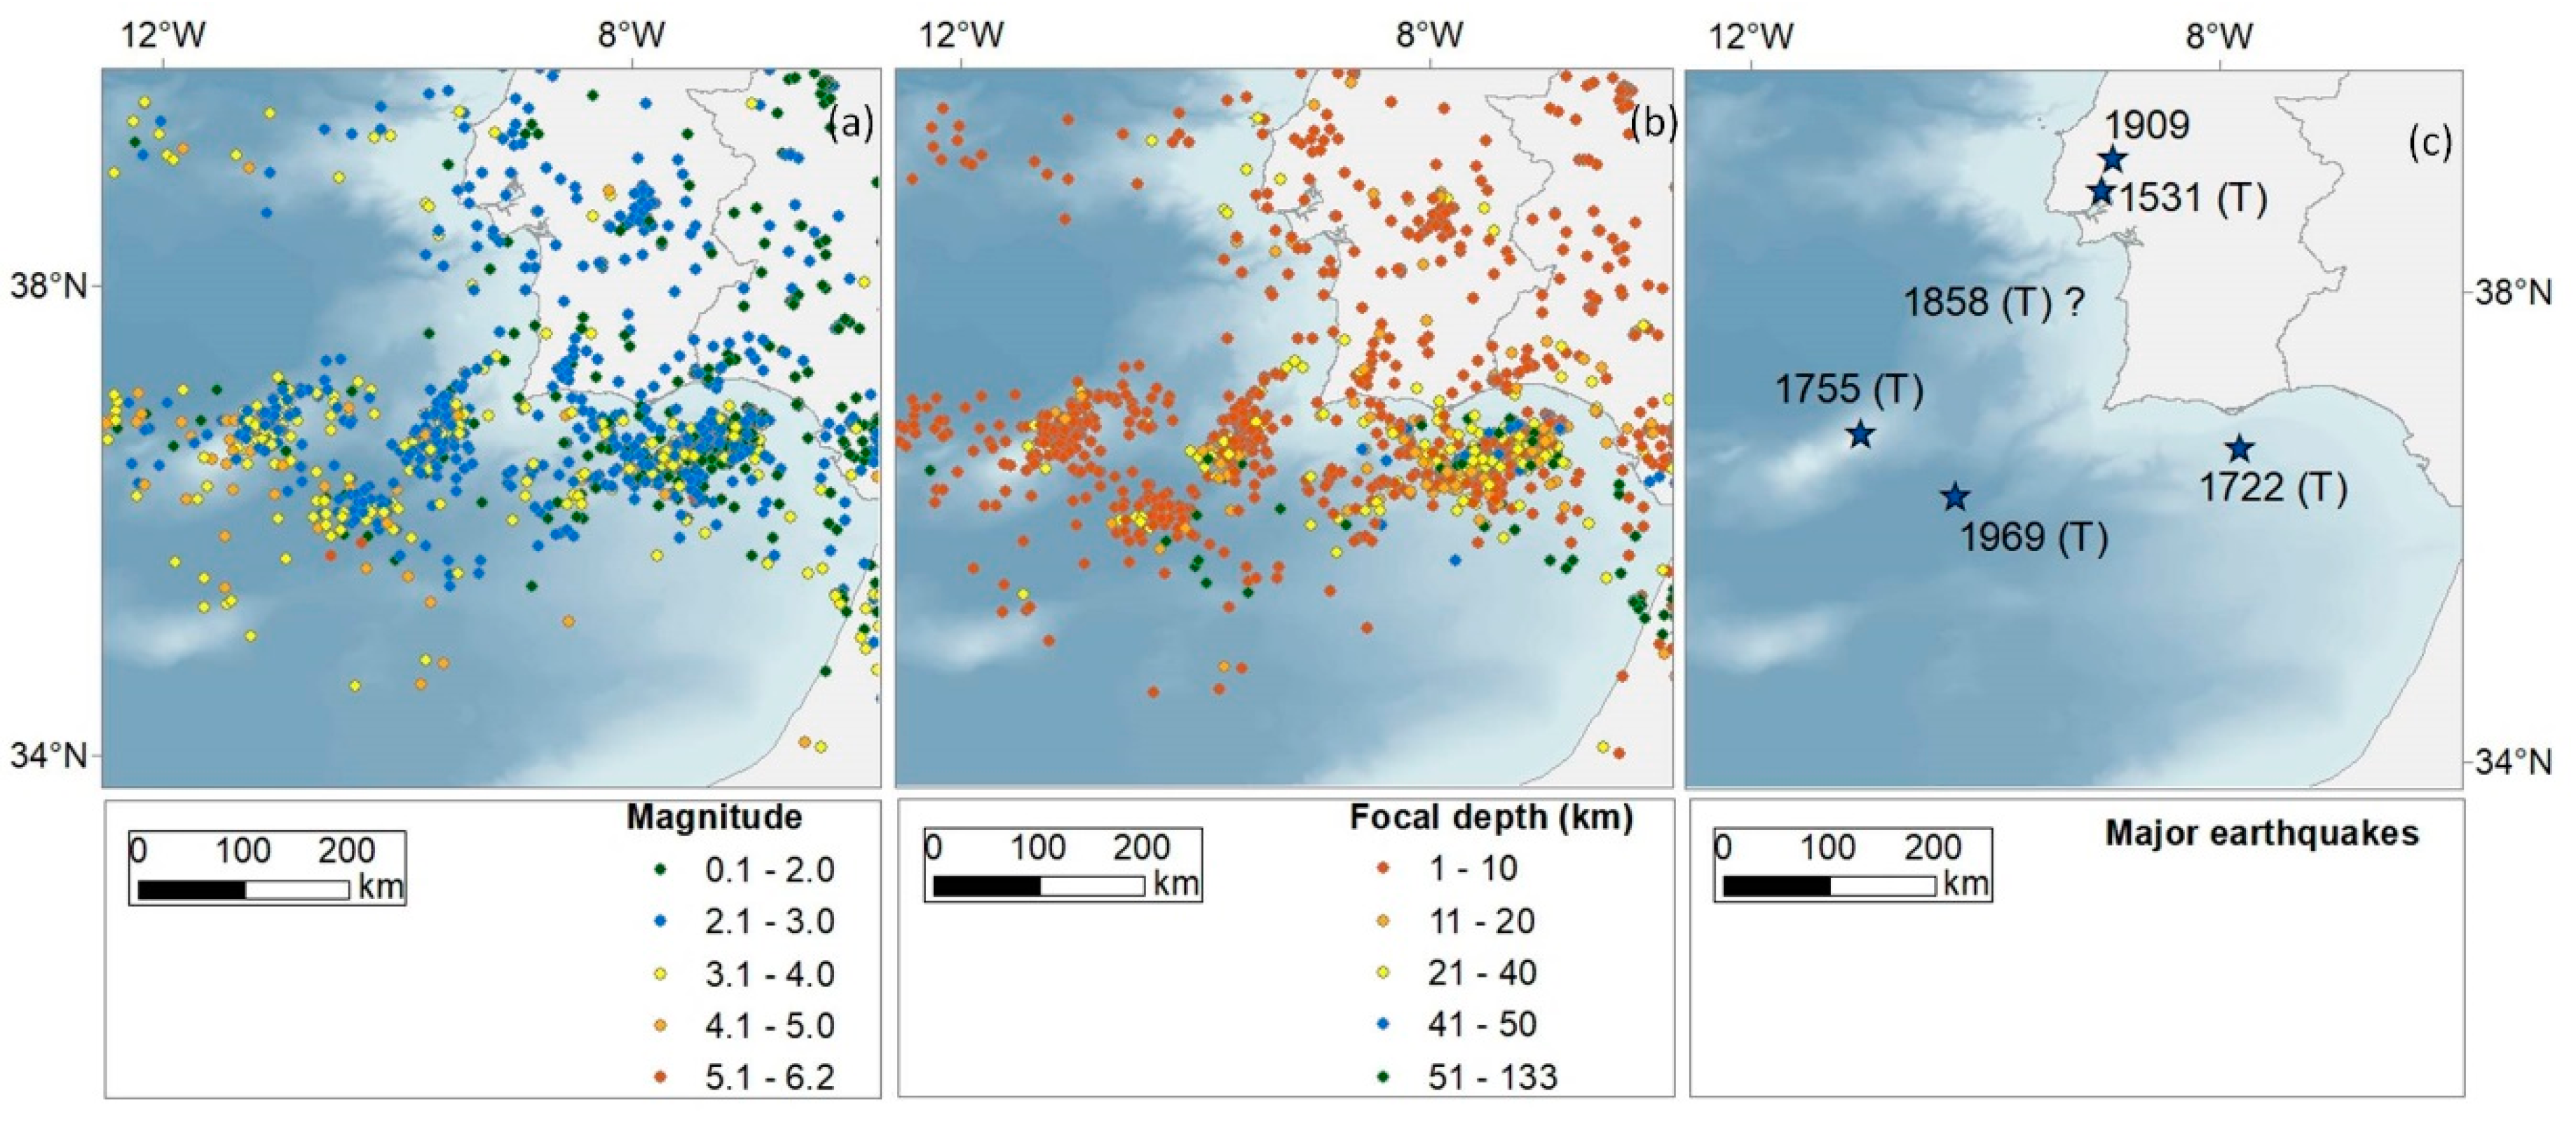
Furthermore, the instrumental seismicity of the East Section is complex and more diffuse [
3,
14] and the definition of the plate boundary is not clear. Generally, the earthquakes are shallow (less than 14 km), and the magnitude is less than 6.2 (
Figure 4). By analyzing
Figure 4, four clear clusters of earthquakes can be detected on the Gorringe Bank, on the Horseshoe Scarp (HSS), on the Cabo São Vicente Canyon (CSVC) and on a small area between 7°W–8°W and 36°N–37°N. The fact that many present-day earthquakes are situated on this section shows that the tectonic activity is still continuing, with the potential to generate large earthquakes that trigger tsunamis [
20,
21].
Since the 1755 earthquake and tsunami is a historical event, there are uncertainties related to the location of its source, combined with complex seismo-tectonics described above. One of the key tools to understand past tsunamis is to carry out numerical modeling, at regional scale (propagation) and local scale (inundation). A numerical model can be used to complement historical data, allowing the validation of the source model. Another advantage of this tool is to carry out simulations on coastal areas where there are no accounts. In this case, the model results provide a more comprehensive analysis of the tsunami impact. For these reasons, in this study, numerical modeling was carried out at the local scale (including inundation) at downtown Lisbon.
Moreover, several authors have used different methodologies that pointed out that the tsunami source area could be located on the Gorringe Bank (
Figure 3;
Figure 4): (a) Santos et al. [
22] re-analyzed tsunami travel times reported by the witnesses. They conducted the wave ray analysis and determined the tsunami source area could be located on the Gorringe Bank; (b) turbidities were found nearby the Gorringe Bank by two different teams of researchers [
23,
24] who concluded that the records were associated with the 1755 earthquake; (c) a seismic moment assessment was conducted by [
25] and the author proposed an earthquake of
Mw = 8.7, with the source model located on the Gorringe Bank, and with dimensions of 200 km by 80 km; (d) seismic intensity modeling was carried out by [
11], who were able to validate the observed seismic intensity; (e) numerical modeling of the 1755 tsunami was carried out at the regional scale by [
22]. The authors were able to validate the tsunami initial response, which was the subsidence at Cadiz, Spain and Morocco, as reported by the witnesses. The authors also validated most of the travel times reported by the witnesses, and tsunami water level waveforms in the UK; (f) numerical modeling of the 1755 tsunami carried out at the local scale on several Portuguese coastal areas allowed researchers to calculate the tsunami inundation, reproducing tsunami travel times and local tsunami features such as the number of waves, inundation extension, and run-up [
17,
26,
27,
28]. As a consequence, in this study, the tsunami source area will be considered at the Gorringe Bank, with the source parameters used by [
11,
17,
25,
26,
27,
28]. This is a key input for the numerical modeling of the 1755 tsunami.
3. Methods
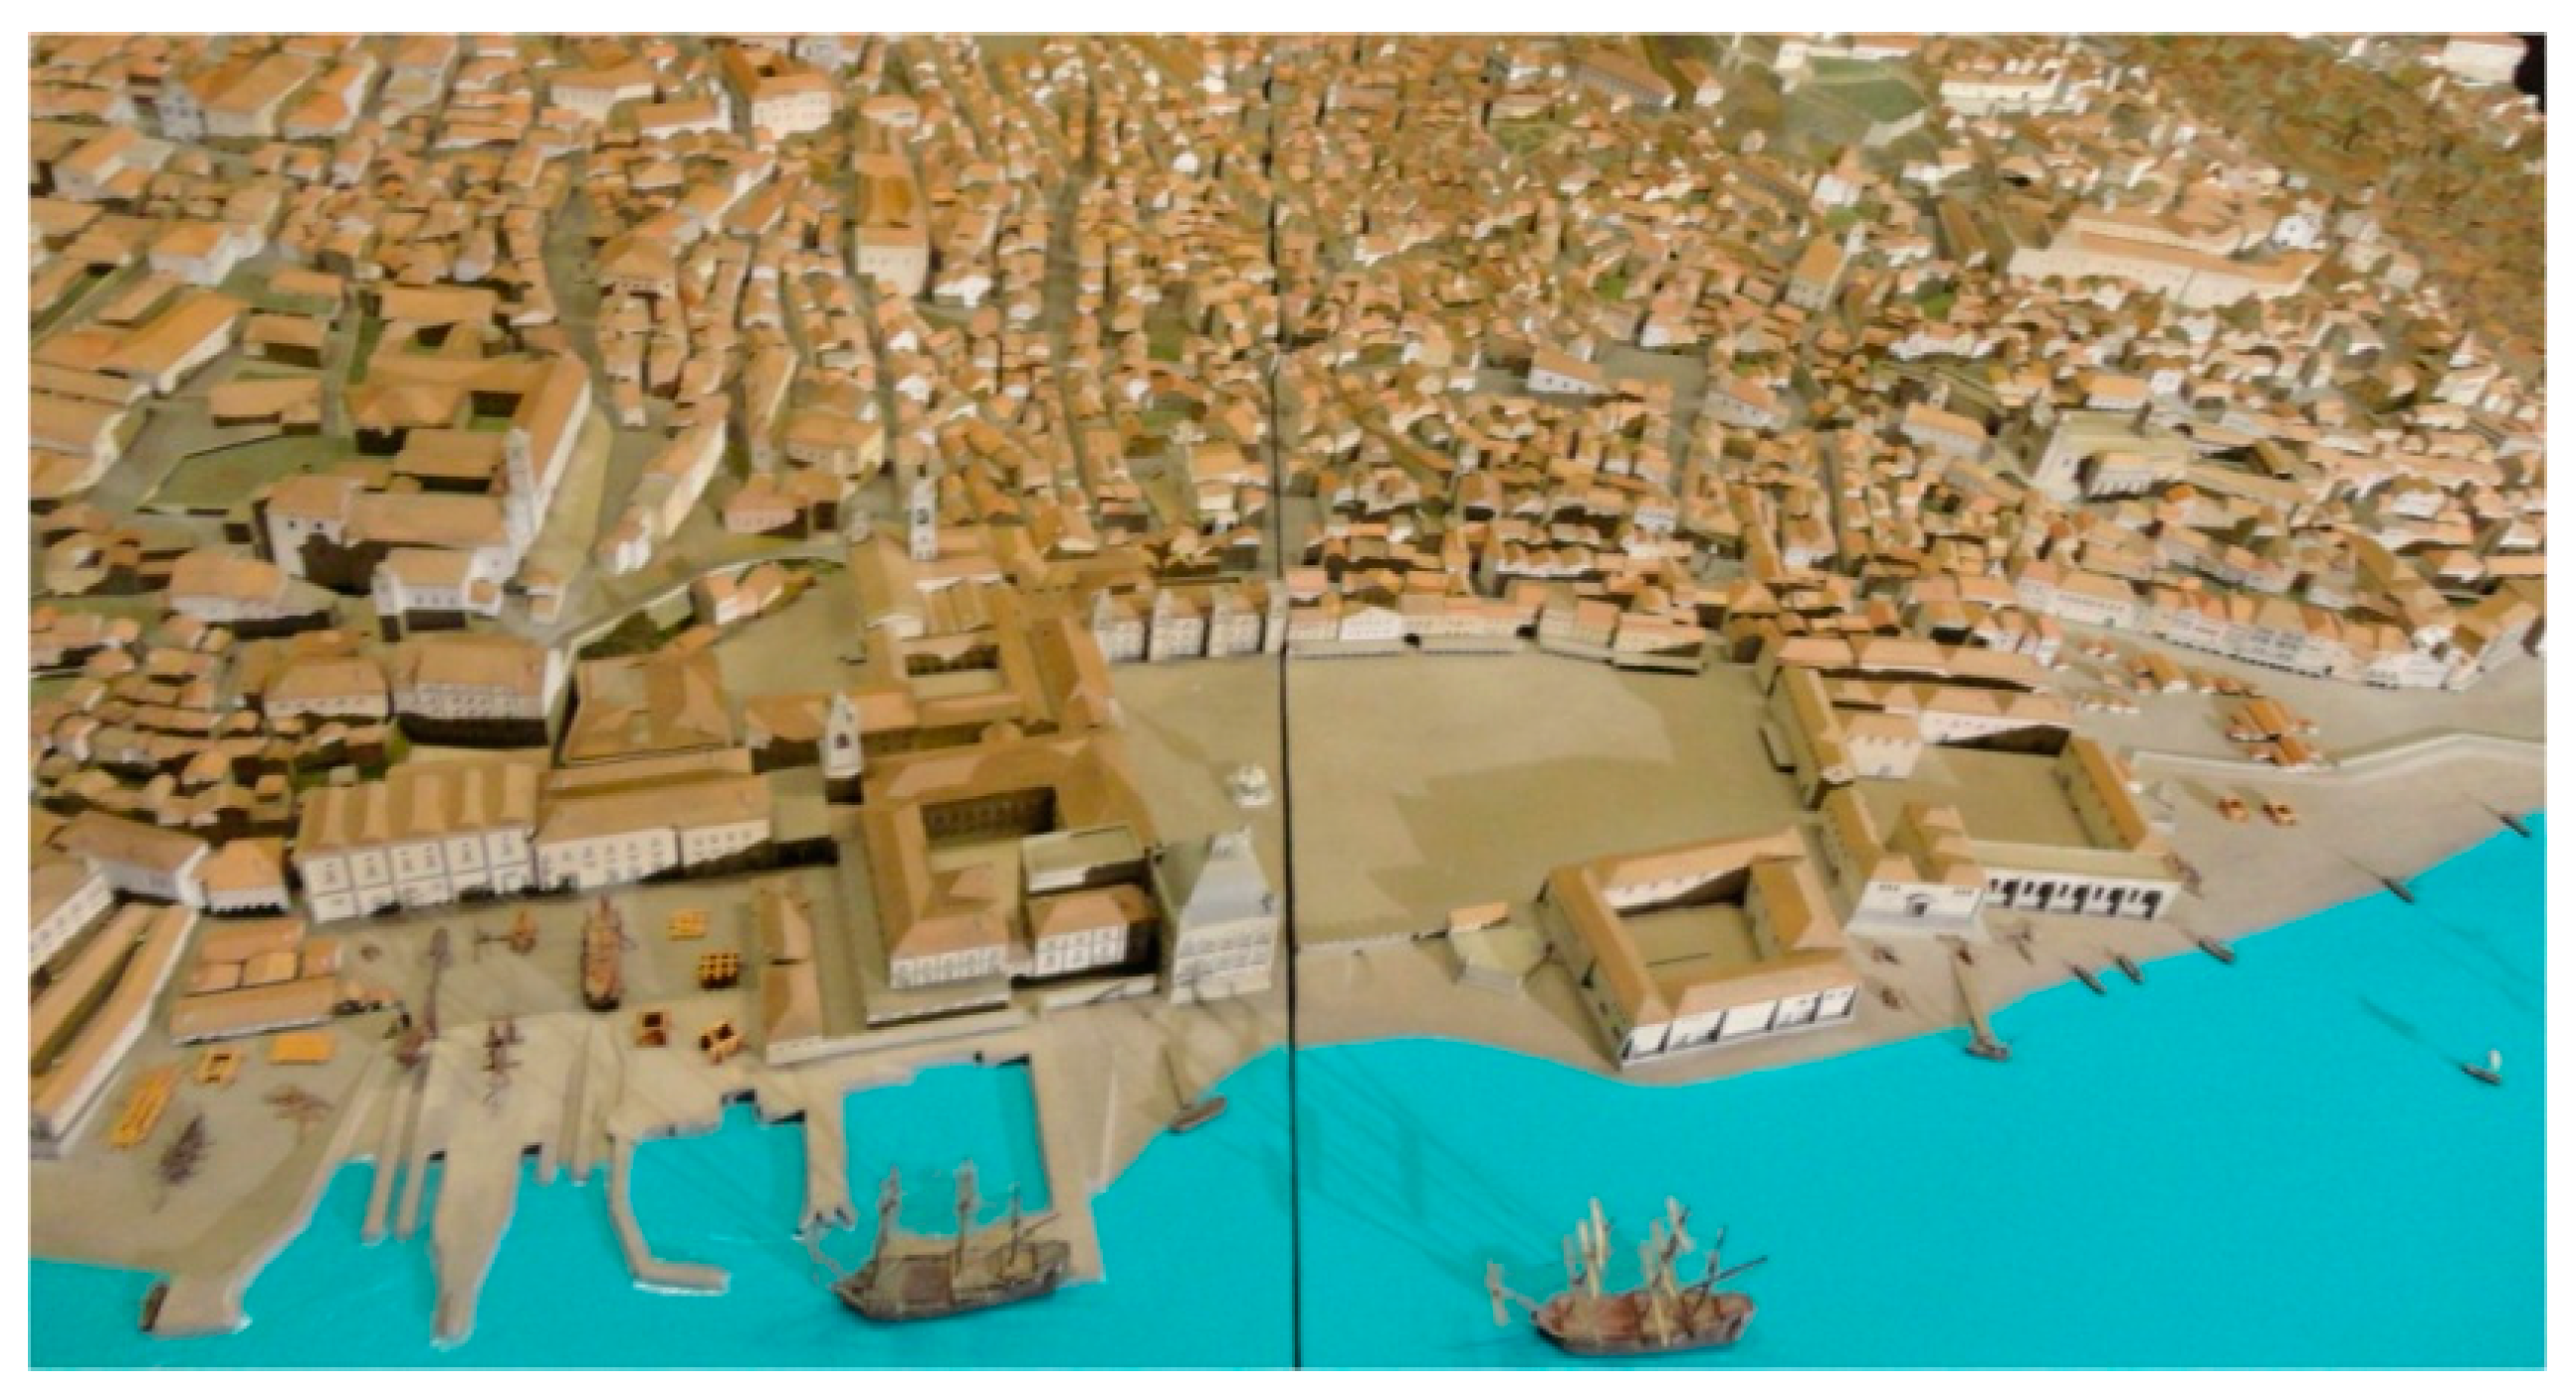
In this study several methods were used, as summarized in
Figure 5. The historical data were compiled from different sources, namely historical accounts [
29], and census data, both before and after the disaster [
1,
29]. In addition, the scale model of the city before the earthquake (
Figure 6) allows a 3D perspective of Lisbon, including an indication of the buildings’ heights.
In order to construct the detailed digital elevation model (DEM) for the tsunami model, it was necessary to prepare the vector plot of Lisbon before the earthquake. This has been an ongoing task that started in 2005. It was based mostly on the topographic plant of the ruined city of Lisbon [
30], presented in
Figure 7. In this map, also the new project for the reconstruction of the city is shown [
31]. The vector plot of the city before the earthquake has also been updated as new archeological evidence has been discovered [
32,
33,
34,
35,
36]. Furthermore, archeological data was also used to identify local altimetry of the study area before the disaster, combined with modern topographic data. In addition, in order to carry out an accurate numerical model, described in more detail below, historical bathymetry maps were also compiled [
37]. All the evidence shows that downtown Lisbon consisted of many open areas and squares before the earthquake. Almost all the streets were wider than 6 m, and only a few streets were narrow with the narrowest streets 3m wide. Hence, the resolution of the numerical model must reproduce these features and, accordingly, the cell size of the computational area for the inundation was 3 m.
The administrative limits of the civil parishes of Lisbon have been changing over time, and in some cases even the names have been changed. For this reason, the civil parishes’ limits before the earthquake have to be compiled [
38]. Iconography representing the disaster in Lisbon was also compiled. These images are available on a permanent exhibition at the Museum of Lisbon and allow a more comprehensive analysis of the disaster.
The tsunami source model considered the earthquake fault parameters proposed by [
11,
17,
25,
26,
27,
28], with dimensions of 200 km by 80 km, located on the Gorringe Bank. The co-seismic displacement of the seafloor is transferred to the sea surface displacement because the rupture process of an earthquake is usually much shorter than the tsunami wave period. Thus, the initial sea surface displacement of the 1755 tsunami was calculated by using the Okada formulas [
39], which lead to a maximum uplift of about 6 m and a subsidence of 0.4 m (
Figure 8a).
The tsunami modeling was carried out by using the TUNAMI-N2 code of the Tohoku University which considers the non-linear shallow water equations, discretized with a staggered leap-frog finite difference scheme [
40]. The governing equations, written in Cartesian coordinates, are:
where,
M and N are the discharge fluxes, and u and v are the velocities, in the x and y directions, respectively. D is the total water depth, η is the sea surface elevation, h is the still water depth, and g is the acceleration due to gravity. The bottom friction was considered with Manning’s roughness coefficient of n = 0.025.
The equations were applied to a nesting of six regions, where the regions have progressively smaller areas and finer grid cell sizes and are included in the previous region, as shown in
Figure 8. The first region is the largest and has a cell size of 729 m. The results of the tsunami propagation for region 1 allow a comprehensive analysis as to how the tsunami waves spread out from the tsunami source area. Then, regions 2, 3 and 4 have cell sizes of 243, 81 and 27 m, respectively. Finally, regions 5 and 6 have cell sizes of 9 and 3 m, respectively, and include details of the coastal areas and topography. During construction of each region (
Figure 8), several historical bathymetry charts and topographic maps were used, as indicated above. In computational region 6, tsunami inundation allows the tsunami run-up to be calculated. In addition, in region 6, a 3 m cell size is suitable for the study area because it accurately reproduces local natural topography variations as well as structures such as buildings and streets in downtown Lisbon before the earthquake.
The results calculated in region 6 include: water level histories; snapshots of water level height; tsunami travel times, which represent the elapsed time of the first wave crest since the earthquake; inundation depth; and maximum water level.
In addition, a field survey was conducted on several occasions. The goal was to identify churches, buildings and other landmarks that still exist today on the study area. A GPS was used to georeference the collected photos. This approach was useful in the construction of the DEM of region 6 (
Figure 8d). Therefore, as presented in
Figure 5, the historical data, together with the numerical model results, and field survey will allow more detailed analyzes of the impact of the 1755 tsunami on the coastline of downtown Lisbon.
4. Results and Discussion
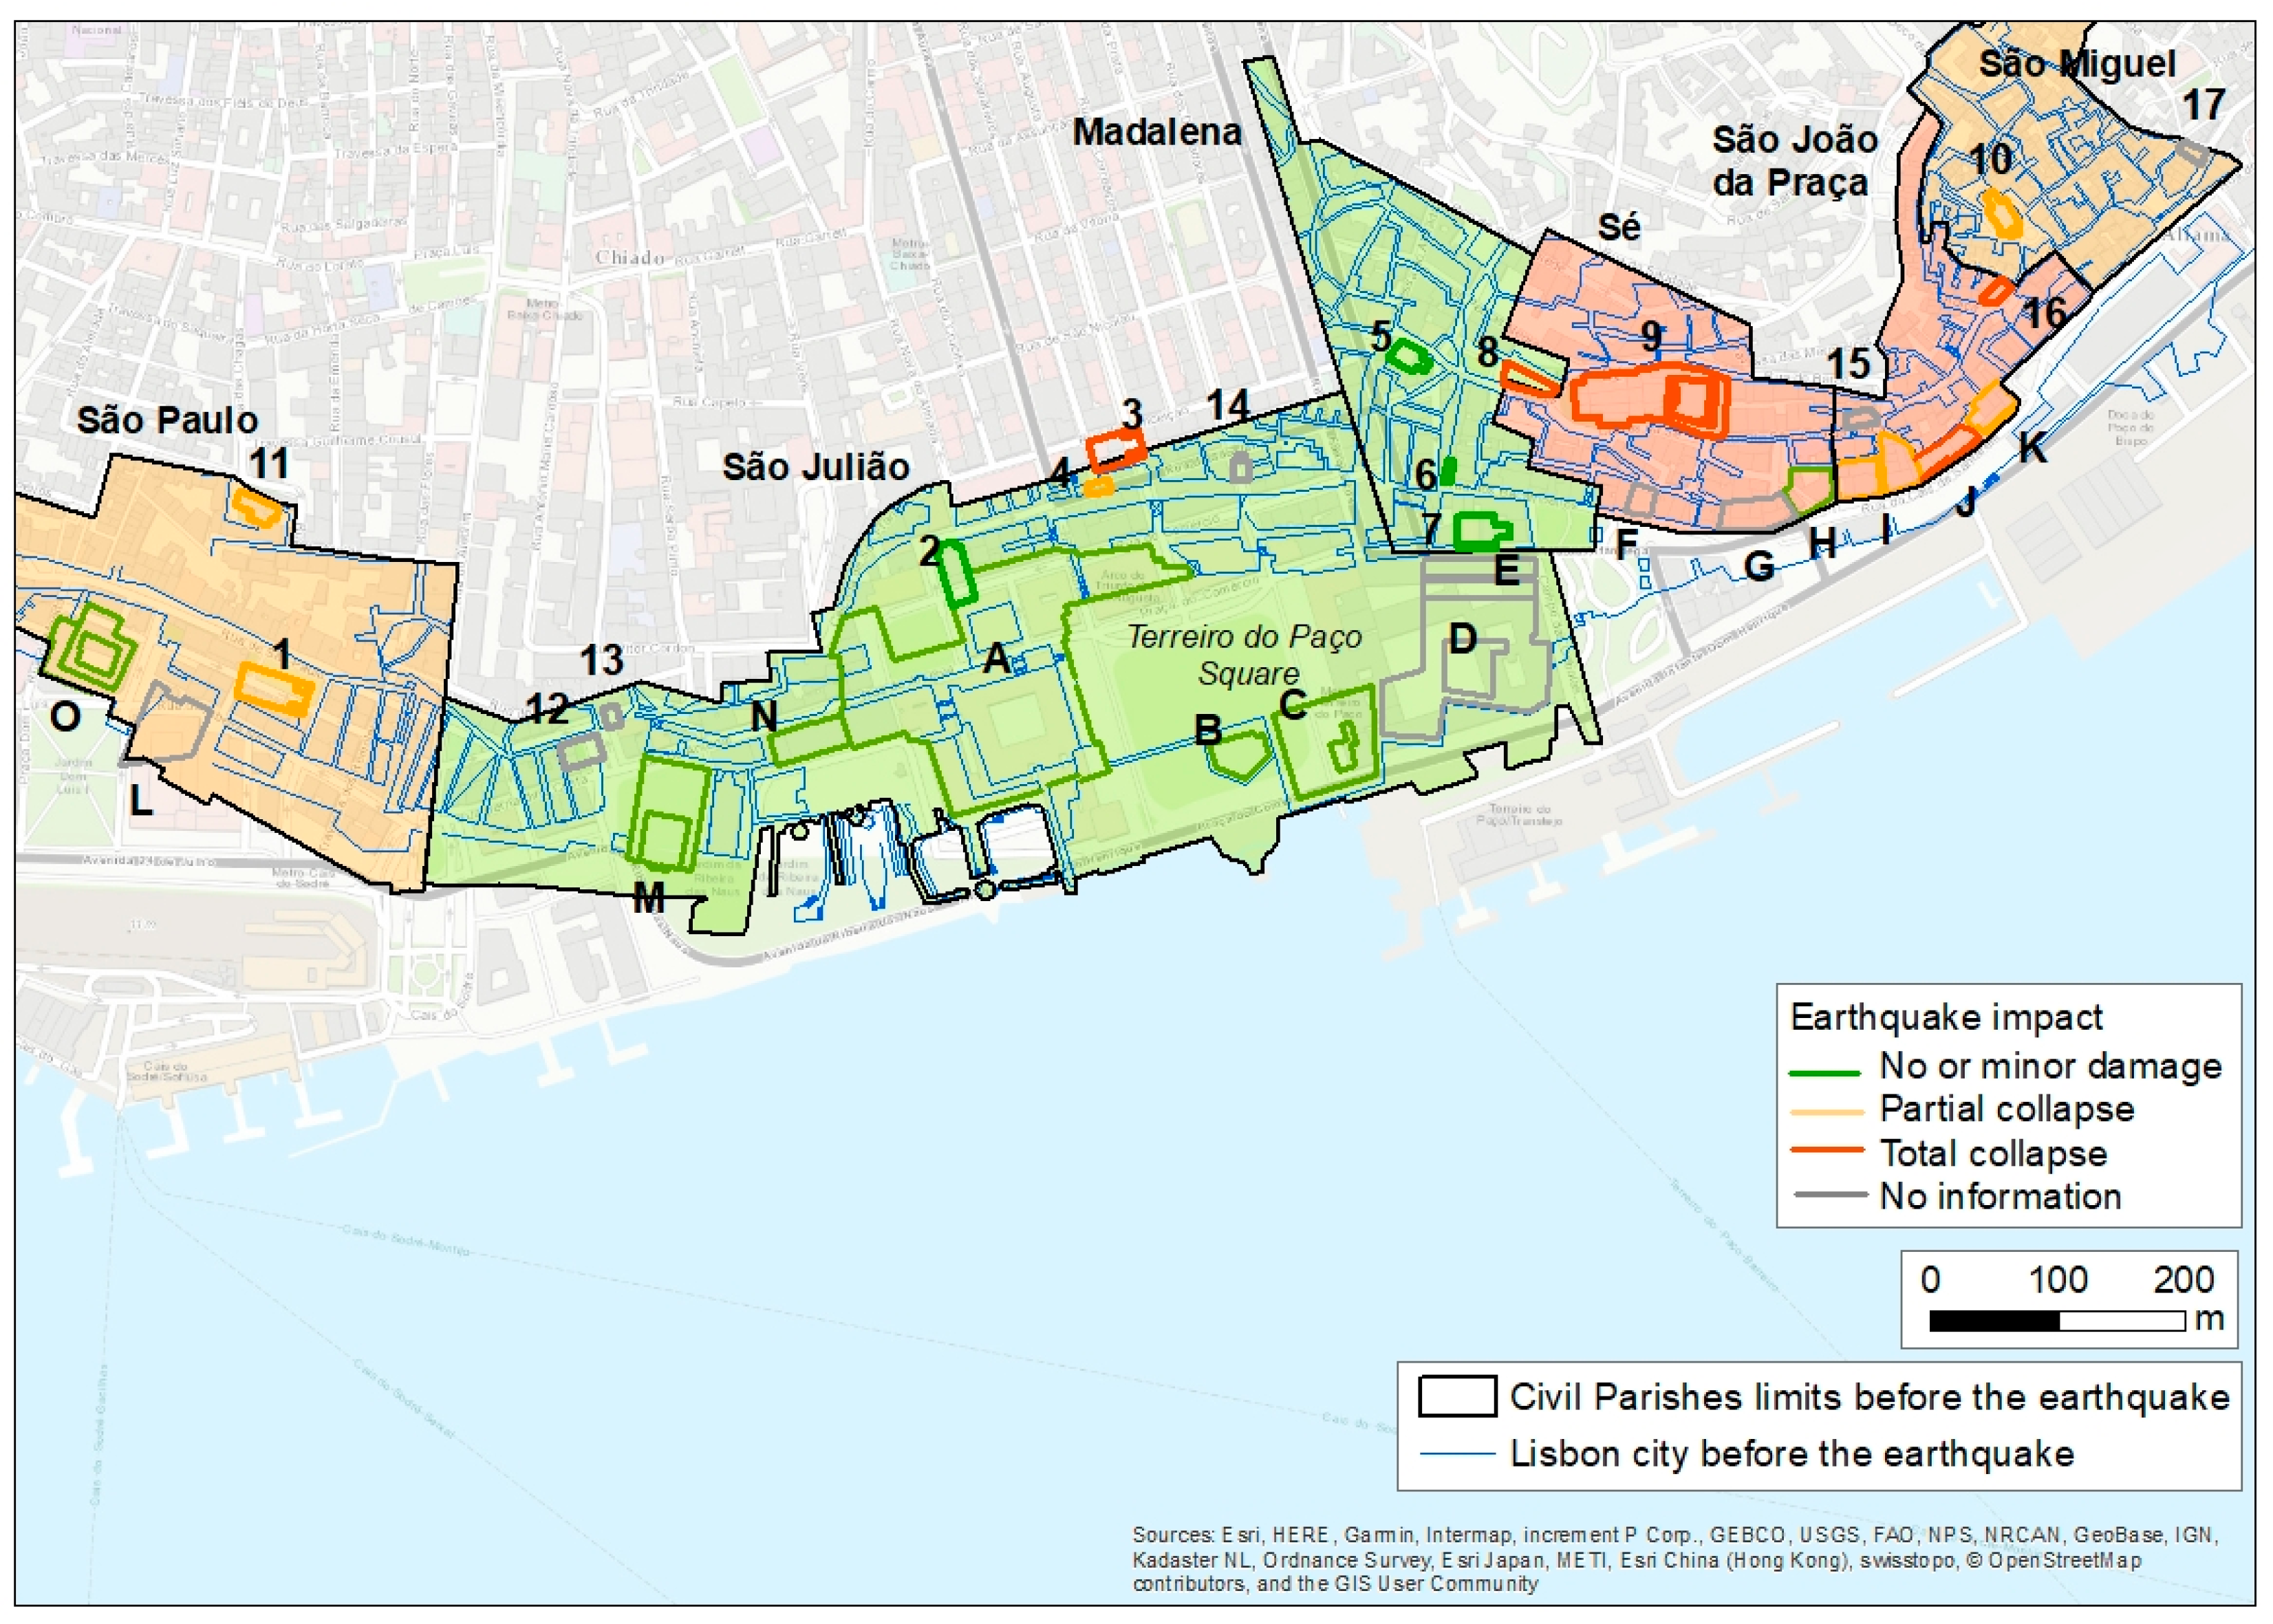
The results show the Lisbon coastline has changed significant since the earthquake, increasing the available land area, as presented in
Figure 9. The coastline moved between 50 m and a maximum of about 300 m. Also presented in
Figure 9 are the limits of the historical civil parishes. Although there are discrepancies between the layout of the city and the civil parishes’ limits, the compilation presented in
Figure 9 may be the best representation of the study area before the earthquake. On the other hand, the comparison between
Figure 1 and
Figure 9 shows there is a difference between the limits of the civil parishes of São Paulo, Madalena and Sé in 2010 and before the earthquake, respectively. In addition, São Julião, São João da Praça and São Miguel civil parishes did not exist in 2010. These discrepancies make the historical interpretation even more complicated.
Therefore, it is fundamental to preserve this data for future generations. Furthermore, during the field survey, remains of the old city have been found. The small marina presented in
Figure 9 is important because it shows that the vector plot of the historical map is correct and also shows that there was no significant alteration on the tide level. Thereby, the ground level remains approximately the same at about 3m above mean sea level. This was taken into consideration in the construction of the DEM for the numerical model (
Figure 8d).
The compilation of the historical data also shows some discrepancies in the census data, before and after the disaster, as presented in
Table 1. Although the records present different data, this was an attempt to identify the number of victims as well as to document the reconstruction of the city. The discrepancies are due to a variety of reasons: before the disaster, the collection of the population records was not established on credible statistical principles since the first official general census of population was carried out in 1864 (
www.ine.pt). The population records were compiled by the priests during the religious ceremonies, which is a regular practice even today. Although these records are important, they do not provide a complete statistical representation of the population. Moreover, children under seven years of age were not considered by the priests. After the disaster, all the record books of São Julião civil parish were destroyed in the fire. In São João da Praça the record book of the dead was destroyed as well. Still, there are several documents that survived and in spite of the differences, discrepancies and incomplete records, it is possible to understand the impact of the disaster on each civil parish, as summarized in
Table 1. The historical records show that about 1000 people died at the study area. There were fatalities in all civil parishes, except at São Miguel civil parish. In addition, the historical accounts show that the population decreased significantly because residents moved to other territories.
The historical accounts are quite vast, reporting the damages of the disaster. For this reason, the damage was classified according to the overall reports and, when possible, the damages from the earthquake, tsunami and fire were analyzed separately. In general, when the buildings were not affected by each disaster, or suffered minor damage, they were classified as “no or minor damage”. In several cases, the accounts report that only parts of the building were destroyed—for example, the area of the choir of a church collapsed. In these cases, these buildings were classified as “partial collapse”. When the reports state everything was destroyed, these buildings were classified as “total collapse”.
In spite of the vast descriptions, there are buildings that were identified but no description was found related to the 1755 disaster. As a result, this is ongoing research and, therefore, further investigation must continue; in these situations, the buildings were classified as “no information”.
The earthquake effects are presented in
Figure 10. The accounts show the earthquake itself did not cause significant damage in the São Julião and Madalena civil parishes, which contradicts the general knowledge, since it has been reported that the earthquake caused total destruction of the city. In addition, although the 1755 event has been largely discussed by the scientific community, stakeholders and the public, the authors did not find any publication that includes the detailed analyzes of this historical disaster in Lisbon. Therefore, this research shows that almost all the identified buildings suffered no damage or minor damage: Royal Palace (#A), Vedoria Fortress, later being only the pier, called “Cais da Pedra” (#B) and the Customs House (#C), as well as the churches (Patriarcal (#2), Madalena (#5), Padaria (#6) and Misericórdia (#7)). Other buildings that did not suffer any damage were the Palace of Corte Real (#M) and the Opera House (#N). At São Paulo and São Miguel civil parishes there was significant damage, with partial collapse of the buildings, except the Money House (#O) that also did not suffer any damage due to the earthquake. The most affected civil parishes were Sé and São João da Praça, where major damage was reported, with partial or total collapse of the buildings.
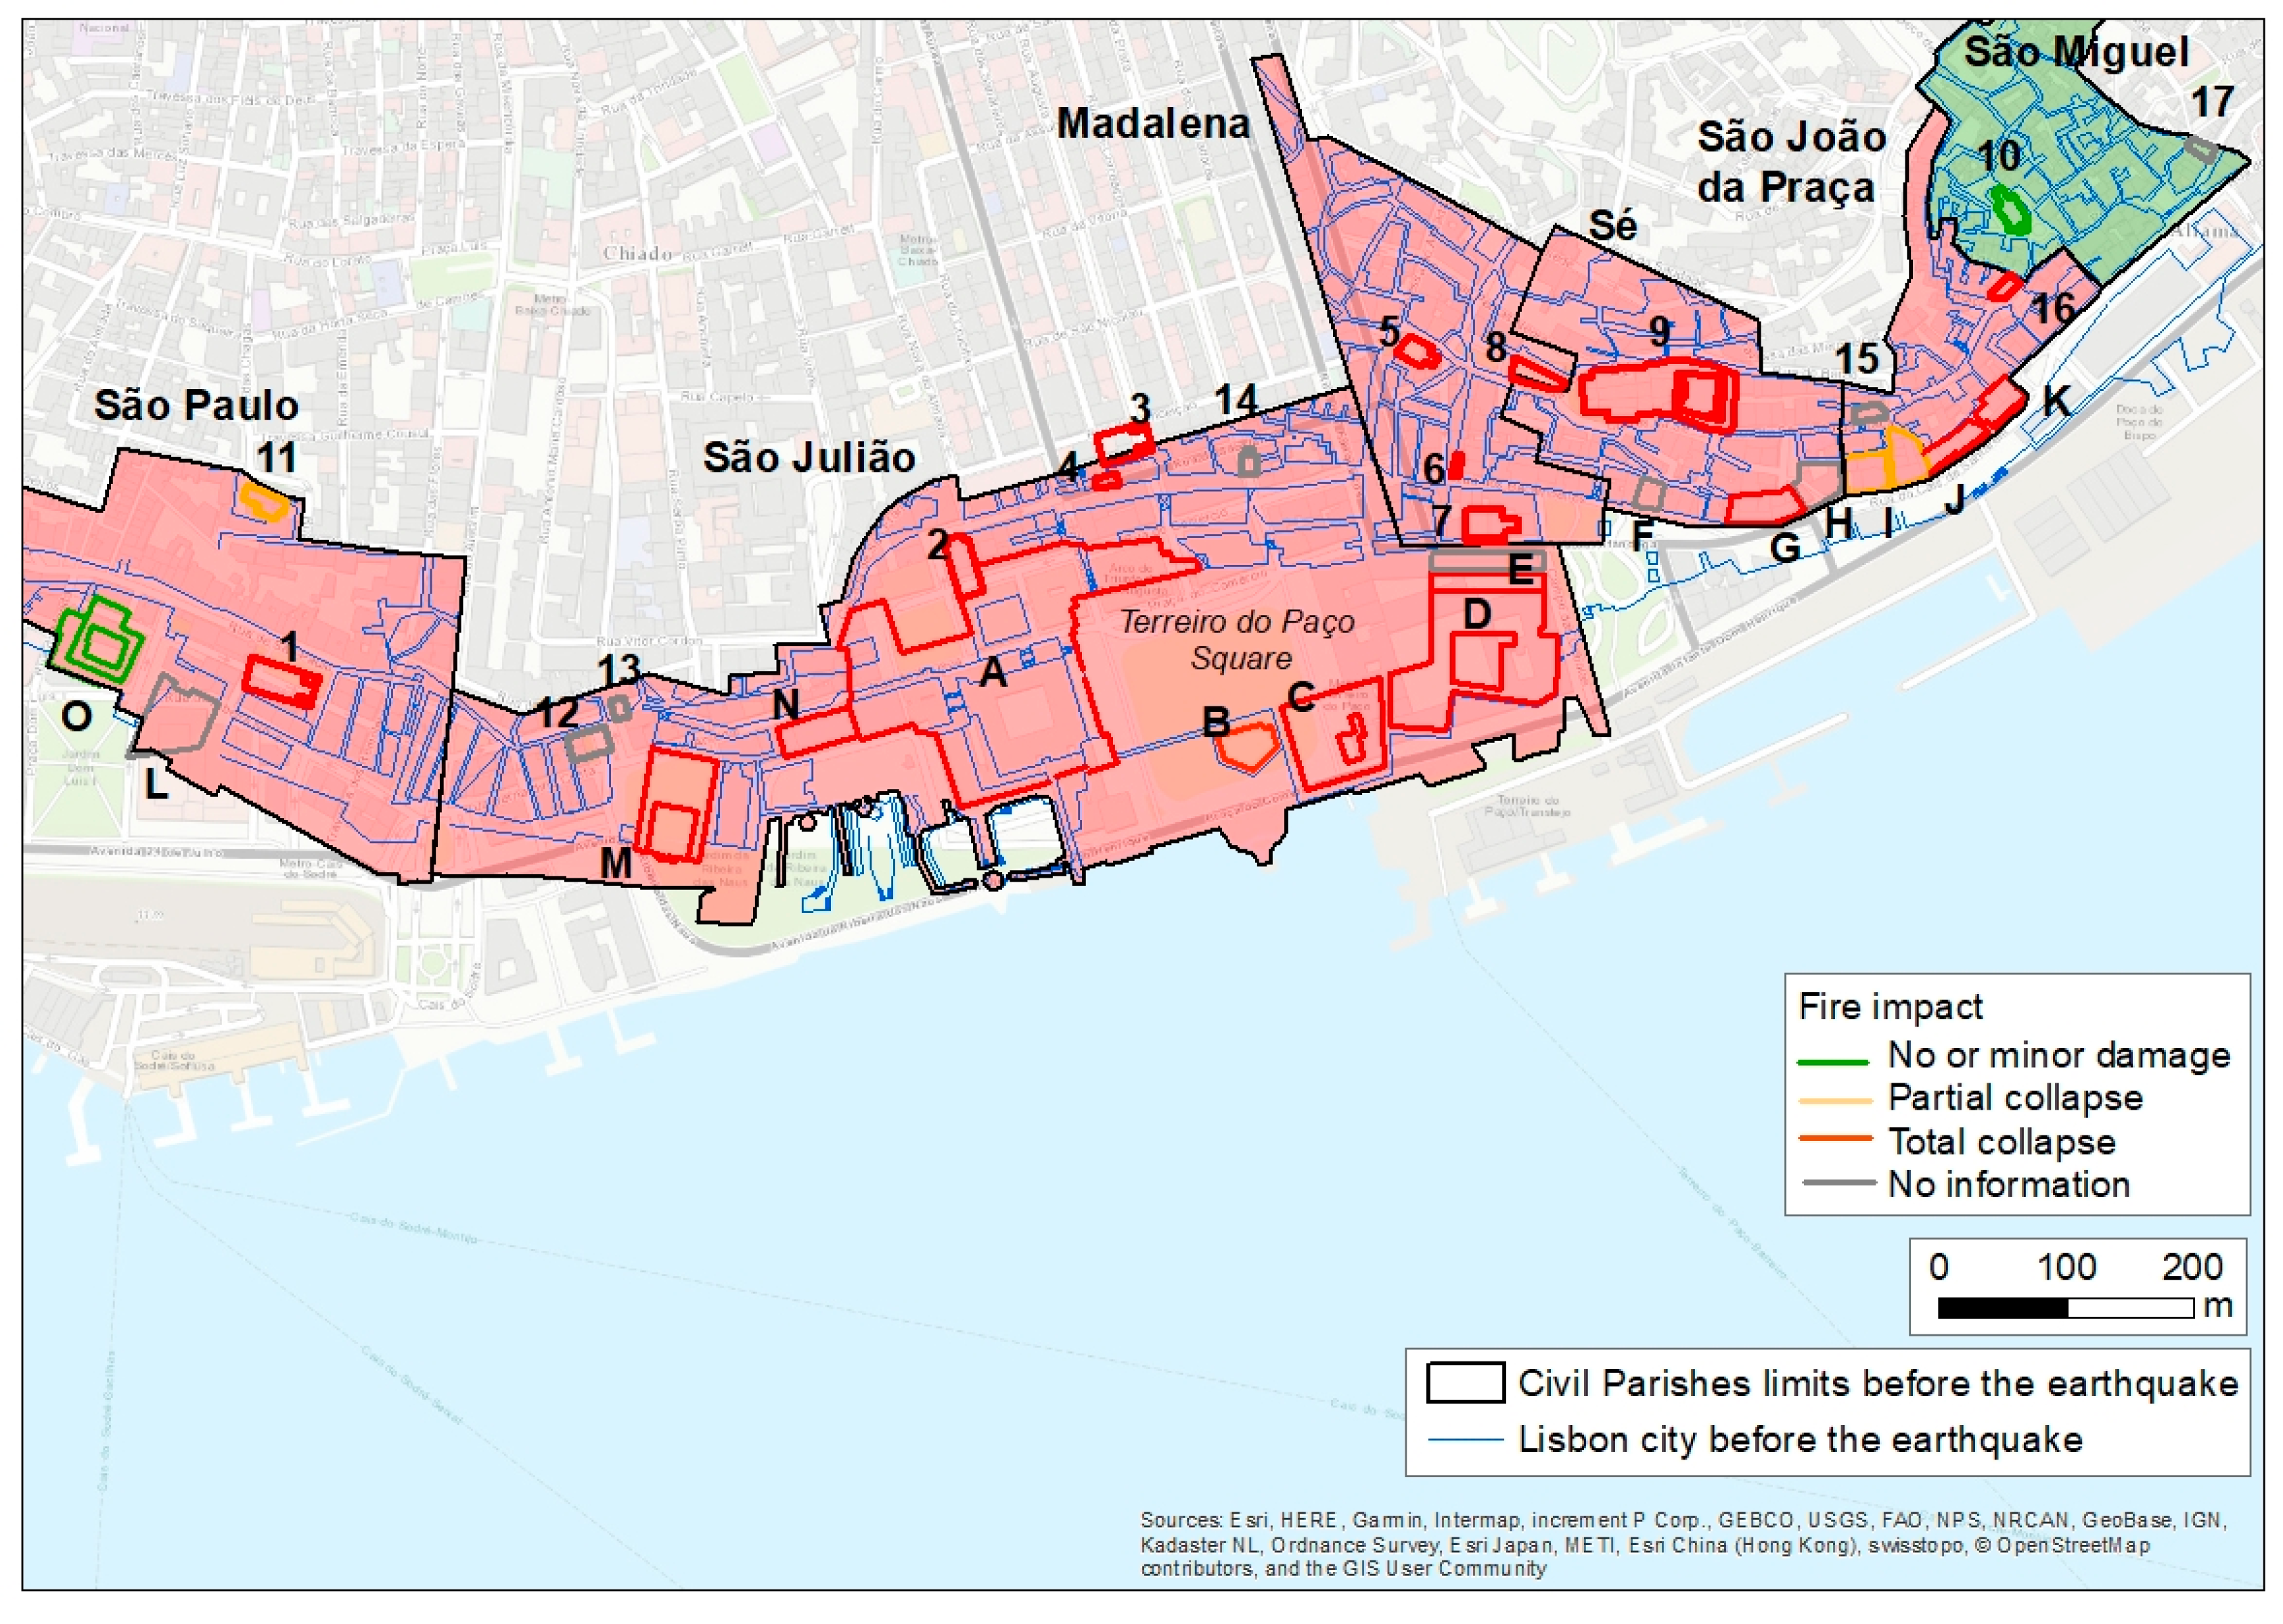
After the earthquake, the fire started and quickly spread throughout the city, being responsible for most damages to property at the entire study area (
Figure 11). Only the São Miguel civil parish was not affected. Only two buildings were not affected by the fire: the Money House (#O) and São Miguel church (#10). Other buildings were affected by the fire, but were not completely destroyed (Chagas church (#11) and Palace of Conde de Coculim (#I)).
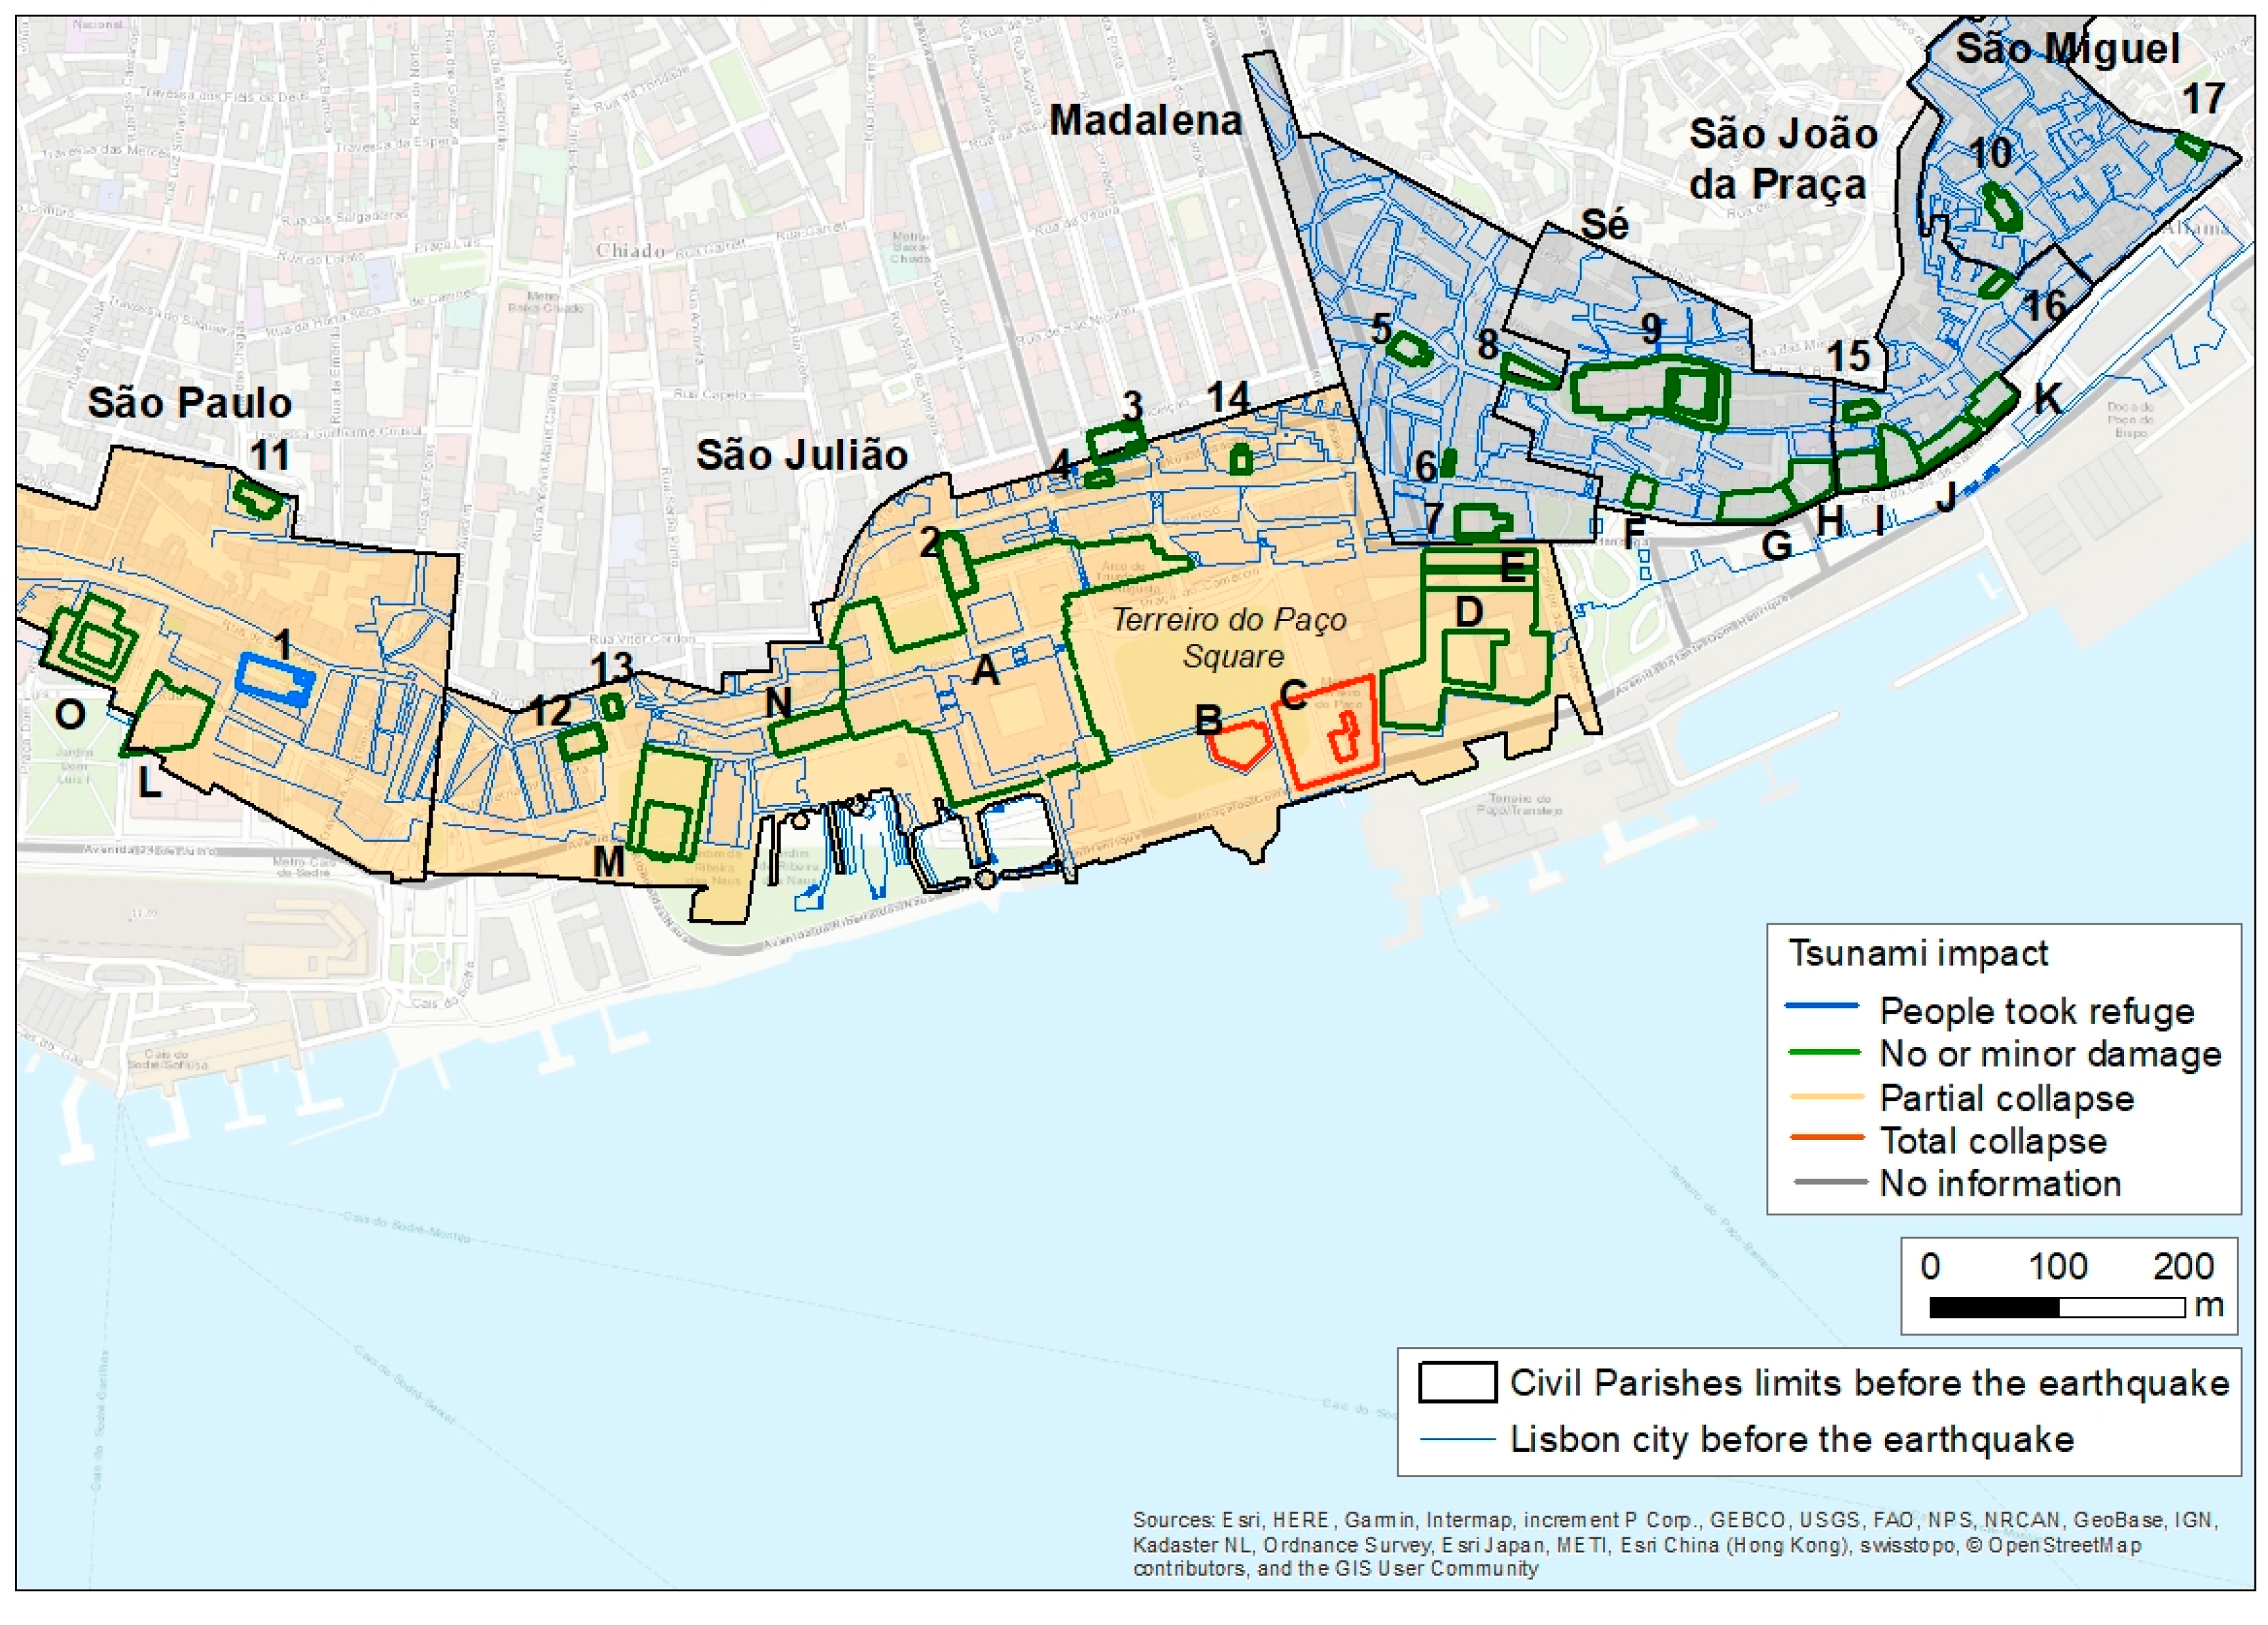
In addition, the tsunami was reported at São Paulo civil parish (
Figure 12). The witnesses’ accounts report people took refuge in the São Paulo church (#1) to escape the tsunami, but they were trapped inside the church and about 32 people died because of the fire. The church itself had already suffered partial collapse due to the earthquake (
Figure 10), where an unknown number of people died. This shows that people were in panic and did not know what to do. Taking refuge inside a large church would be a common sense attitude in the 18th century. However, if people had evacuated in the direction of Chagas church (#11) they would have been safe from the tsunami (because it is located on higher ground, above 10 m) and probably the fire (because this was the limit of the burnt area). The tsunami was also reported (
Figure 12) to have inundated the beaches (low ground areas) and at São Julião civil parish inundating the Terreiro do Paço square, and destroying the Vedoria Fortress, that later became a pier called Cais da Pedra (#B) and the Customs House (#C). At Terreiro do Paço more than 900 people died because they were caught by the tsunami when they tried to escape the fire. Although an open square might be a safe area to evacuate from a fire, if it is not located on high ground it could be exposed to a tsunami. Other Portuguese cities have similar urban fabric characteristics, such as an old town with narrow streets located on low ground areas. Therefore, in order to mitigate tsunamis and other urban disasters, it is fundamental to implement emergency plans, which include installation of emergency equipment, disaster awareness activities for residents and the regular practice of evacuation exercises and drills [
17]. A previous study showed that in Lisbon municipality the disaster killed more than 10,000 people due to the earthquake, fire, and tsunami [
1]. However, as presented in
Table 1, about 1000 people died at the downtown area. These results show that the tsunami was quite relevant to the overall disaster impact on downtown Lisbon.
The accounts are contradictory in relation to the number of waves at São Julião civil parish: some witnesses reported 3 major waves affected the Terreiro do Paço, while others observed 2 major waves. In the other civil parishes (Madalena, Sé, São João da Praça and São Miguel) there were no records about the tsunami.
The field survey shows that the House of the Pointed Stones (F) still exists today (
Figure 13). It was reconstructed on the same place (
Figure 10,
Figure 11 and
Figure 12). Although no information was found from the historical data, onsite information indicates the third and fourth floors of the building were destroyed during the 1755 disaster. This would be classified as a “partial collapse”, although no indication was provided if the damage was due to the earthquake, fire, or both.
On the other hand, the iconography allows another perspective of the disaster on the study area.
Figure 14 shows the Royal Palace (#A), with view from the Terreiro do Paço. As reported by the historical accounts, the earthquake caused minor damage to the building. In addition, the drawing shows that even after the fire the building itself did not collapse. Similarly, the Opera House (#N) did not suffer significant damages due to the earthquake. However, the fire caused the total collapse of the building, and only the major stone columns remained. The São Paulo church (#1) suffered partial collapse due to the earthquake. It was then impacted by the tsunami, although no information was found about its impact on the church. Later, the building was completely destroyed by the fire. The Sé (9) was severely destroyed by both the earthquake and fire.
The tsunami model results show the first wave arrived to the study area 60 min after the earthquake (
Figure 15a), inundated the low ground areas of the São Paulo civil parish. It reached up to 4.7 m high which is significant, inundating the São Paulo church (#1). This is in agreement with the witnesses reports. The first wave continued to inundate most parts of the coastline areas from 65 min onwards (
Figure 15b), including the narrowest streets, the Royal Palace (A) and Terreiro do Paço square. The second wave reached the area at about 90 min but did not inundate the lower ground areas, since its height was limited to about 2 m. The third wave arrived at 130 min. In addition, some witnesses have reported 2 major waves, while others reported 3 major waves, therefore validating the numerical model results.
Another model output is the inundation depth, presented in
Figure 16. The results show the tsunami inundated almost all the lower ground area of the downtown Lisbon coastline. The inundation depth on the São Paulo church (#1) was about 1.4 m high, at the Royal Palace (#A) it reached up to 1.0 m high, and in the Pier (Cais da Pedra) (#B) and the Customs House (Alfândega do Tabaco) (#C) it reached up to 3.0 m high. According to witnesses accounts the Customs House (#C) was destroyed by the fire and the tsunami. In the reconstruction plan of the city, it was relocated to a new location, about 650 m to the east, and still exists nowadays (
Figure 16). The model results show that this area was not inundated by the tsunami. Although there are no records reporting the tsunami inundation at the São João da Praça and São Miguel civil parishes, the numerical model shows the new location for the Customs is indeed a safe place from a tsunami of this height. All these results validate the tsunami model results as well as the tsunami source model, which considered an earthquake with magnitude
Mw = 8.7 at the Gorringe Bank. Furthermore, the new Customs building has a unique reinforcement of the facade (
Figure 16) which is facing the Tagus river. This is a unique feature that was not observed on the other facades of the building, or in any other building. These results show the Portuguese stakeholders took special care in the reconstruction of the city, by providing the building with extra structural features that would ensure the safety of the building for a future tsunami.
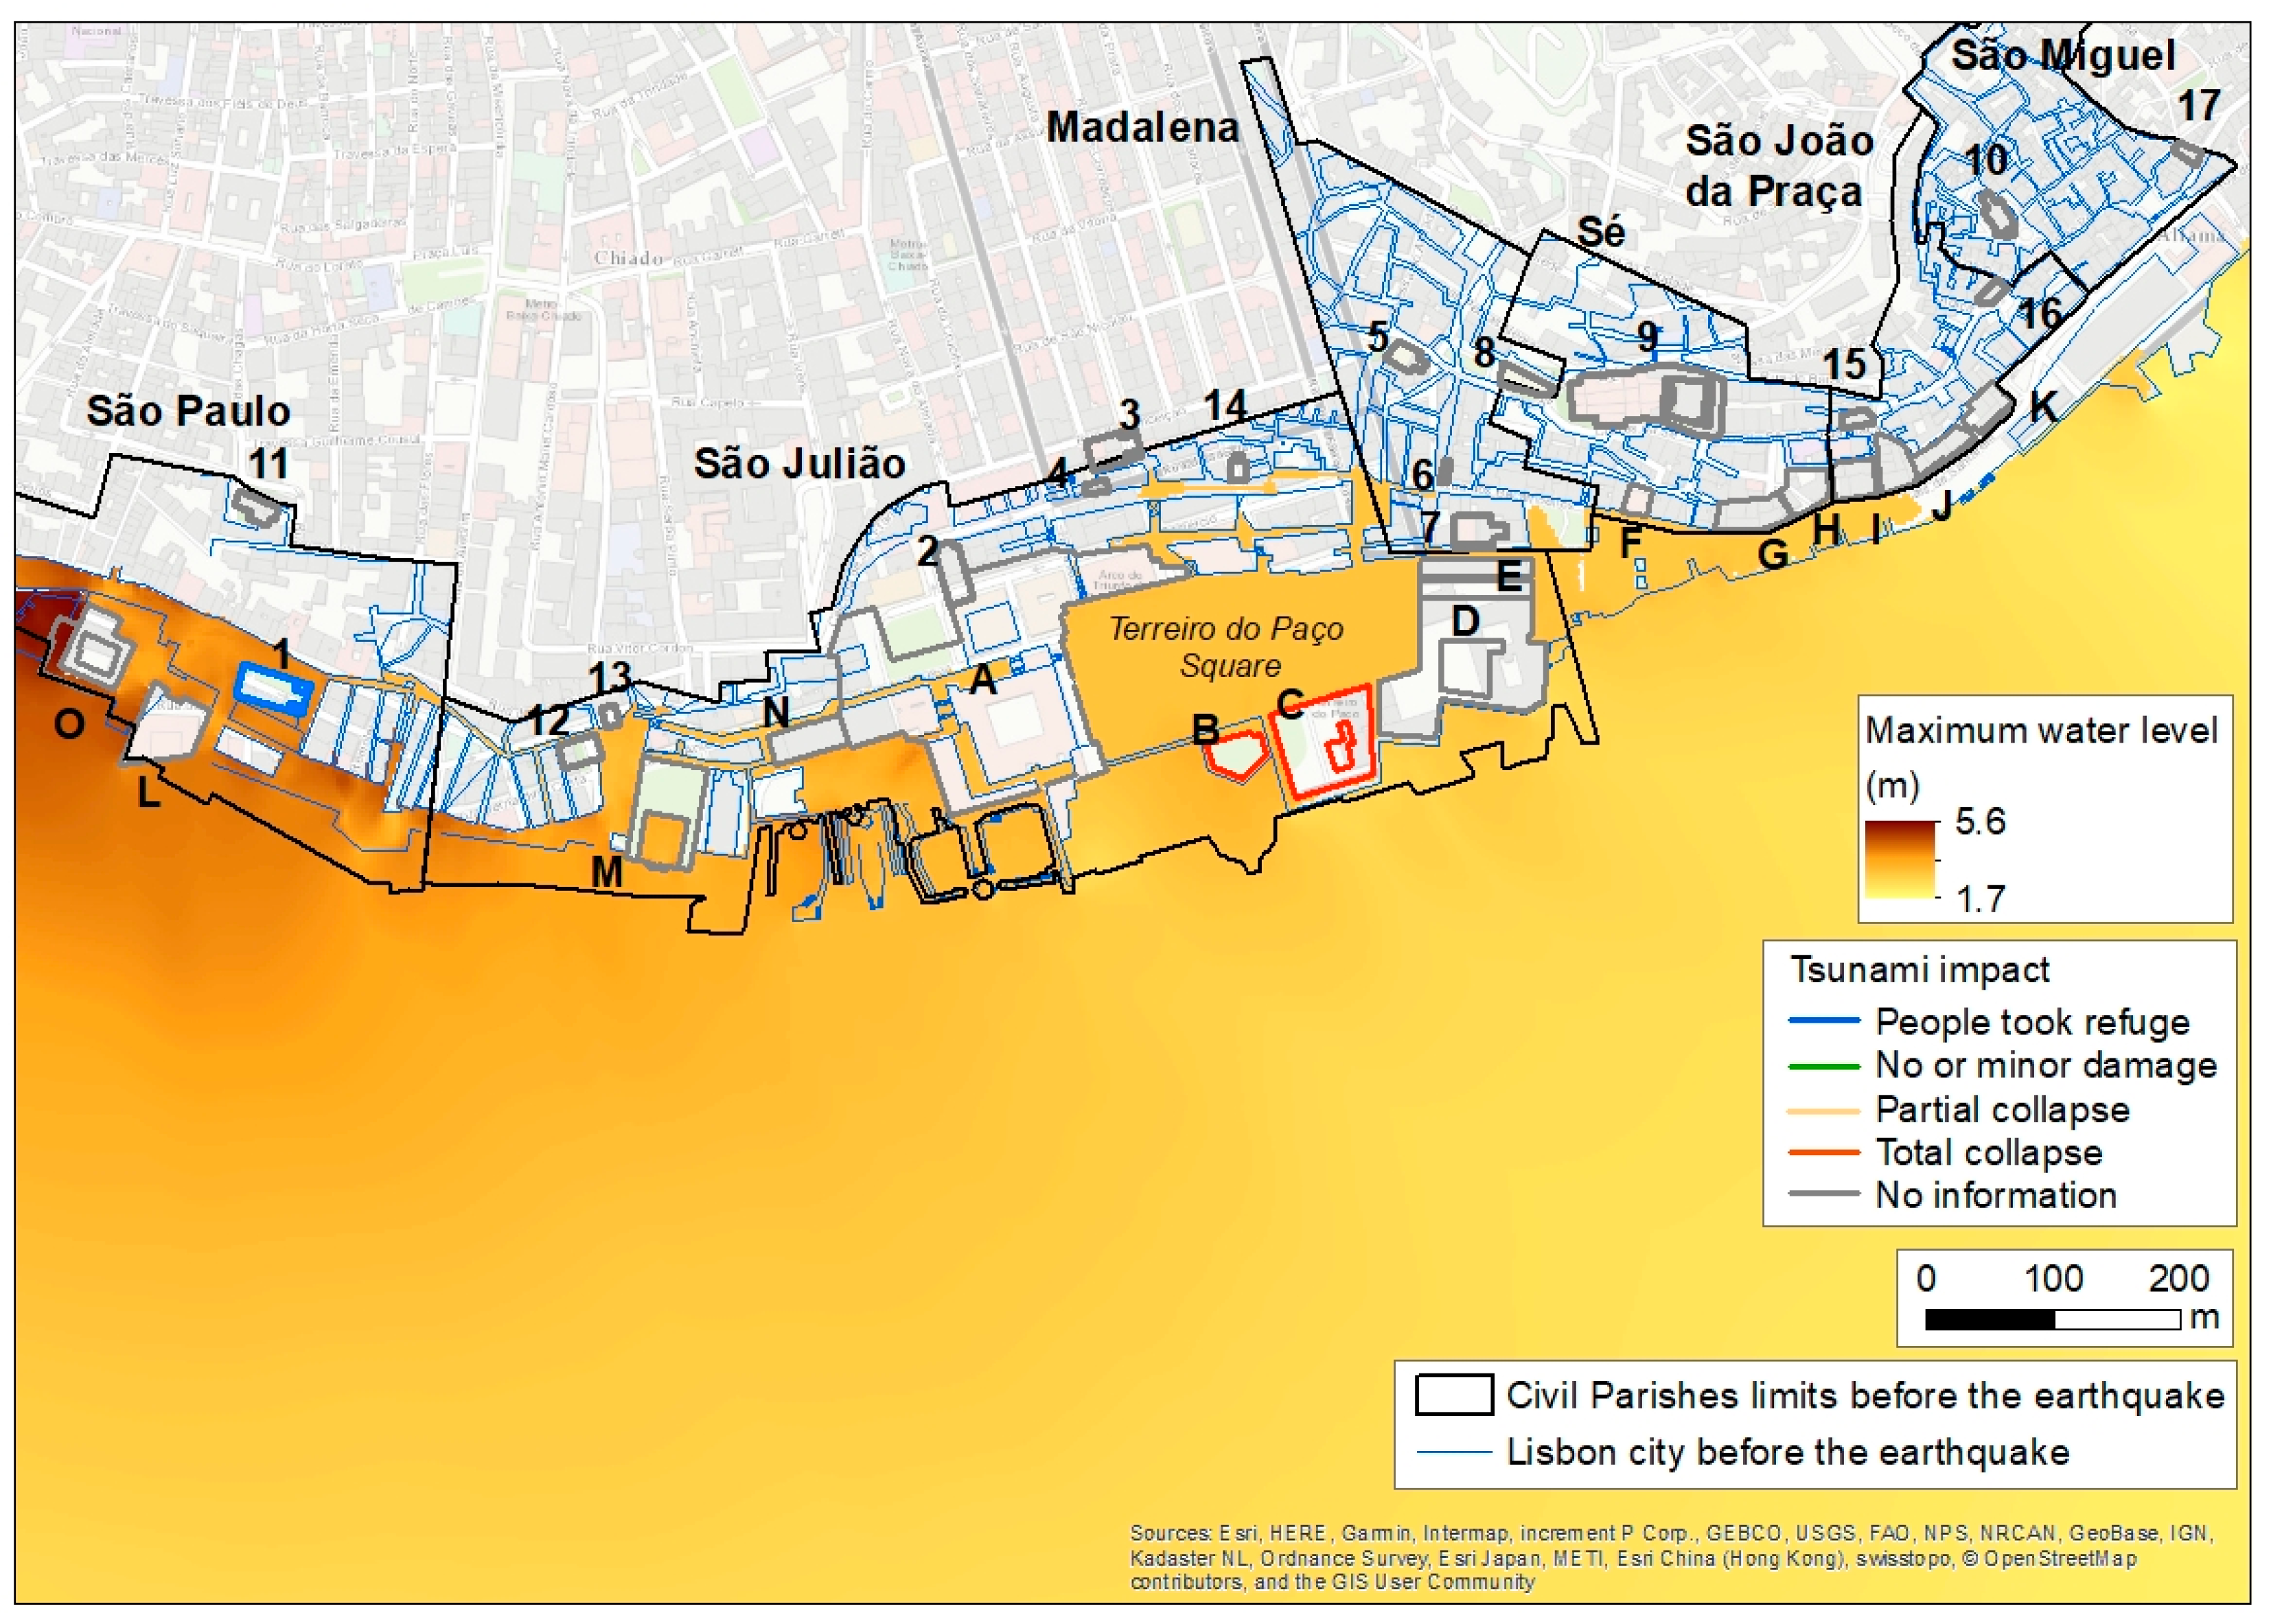
The maximum water level (
Figure 17) shows the tsunami had a significant impact on the river, since it reached a height of 3.9 m at the shipyard and the marina. The maximum calculated value was 5.6 m on the west part of the city and the minimum height was 1.7 m on the east part of the city, on the river. The average value was 2.5 m. These values are sufficient to cause damage to the vessels that were on the river.
The analysis of fire propagation is beyond the scope of this research. Still, from the tsunami model results it is possible to identify some hints of the fire behavior. The first wave hit São Paulo church before the fire; this means the fire reached the church later than 60–65 min after the earthquake. On the other hand, at Terreiro do Paço, the fire started first, meaning the fire arrived in the area before 65 min. Although these are rough indications, the fire may have started in the vicinity of the Terreiro do Paço, at about 1 hour after the earthquake and then propagated to the western part of the city. Still, a detailed study focusing on the fire should be conducted in the future. This is particularly important because on 28 August 1988, there was a large fire in Chiado, Lisbon. The fire caused two deaths, and injured more than 130 firefighters and local people. More than 300 people were evacuated and 18 buildings were totally destroyed. The area was renovated with modern concrete buildings and several safety improvements were implemented [
45]. This shows that the city is still vulnerable to urban fires.
5. Conclusions
The aim of this research was to understand and reconstruct the impact of the 1755 event in downtown Lisbon. In order to achieve this, several methods were used, namely the compilation and interpretation of historical data, tsunami modeling, and field surveys. The combination of these methods allowed a more detailed analysis of the damage caused by the earthquake, tsunami, and fire, number of victims, as well as tsunami parameters (travel times, number of waves and inundation area).
This research showed that the coastline of downtown Lisbon has changed significantly since the earthquake, increasing the available land area by 50 m to about 300 m. In the reconstruction process of the city, the urban fabric also suffered a significant change. In addition, the administrative limits of the city’s civil parishes have been changing over time. In some cases, the civil parishes have been merged or separated, which made the interpretation of the historical accounts even more difficult. Thus, the preservation of historical maps is very important in order to understand what the city looked like before the earthquake. The scale model available at the Museum of Lisbon also provided important input to reproduce the DEM of the city before the disaster.
On the other hand, census data of the studied area presented many discrepancies due to a lack of appropriate record compilation of the population. In addition, some documents were destroyed due to the fire. Still, it was possible to conclude that before the disaster there were about 5500 buildings and about 26,200 residents in downtown Lisbon; after the disaster, no records of the building were found, and there were about 6000–8800 residents. There were about 1000 deaths, mainly due to the tsunami because people evacuated to the Terreiro do Paço square, instead of moving to higher ground. Nevertheless, the number of residents decreased significantly in the study area because they moved to other territories.
Thirty two buildings were identified, among them 17 churches. In spite of the vast descriptions provided by historical data, there are buildings that were identified but no description was found relating to the 1755 disaster. For that reason, further investigation must continue.
Contradicting the general knowledge, it was possible to separate most of the buildings’ damage related to the earthquake, tsunami, and fire on each historical civil parish. Moreover, the accounts show the earthquake itself did not cause significant damage in the São Julião and Madelena civil parishes, which also contradicts the general knowledge. However, at Sé and São João da Praça civil parishes, the earthquake destroyed almost all the buildings. At São Paulo and São Miguel civil parishes, the earthquake caused a partial collapse of the buildings. Moreover, the fire affected the entire study area, except São Miguel civil parish, causing the total collapse of the buildings.
The numerical model results show that the tsunami affected mostly the western and central parts of the study area and there were two major waves, which were validated by historical accounts. The model results also showed that the location of the new Customs House is in a safe area from a tsunami inundation of a similar height. These results showed that the Portuguese stakeholders took special care in the reconstruction of the city, by providing this building with extra structural features that would ensure its safety in a future tsunami. Although more than 260 years have passed since the event, there is no operational tsunami warning system in downtown Lisbon at present. As a consequence, it is fundamental to conduct tsunami awareness activities and implement evacuation strategies in order to inform residents and tourists the safest areas to evacuate in a future event.

 ,
, 


