Article

Experimental Study on Extreme Hydrodynamic Loading on Pipelines Part 2: Induced Force Analysis

1
Department of Civil Engineering, University of Ottawa, Ottawa, ON K1N 6N5 Canada
2
Leichtweiß-Institute for Hydraulic Engineering and Water Resources, Technische Universität Braunschweig, 38124 Braunschweig, Germany
*
Author to whom correspondence should be addressed.
J. Mar. Sci. Eng. 2019, 7(8), 262; https://doi.org/10.3390/jmse7080262
Submission received: 23 May 2019 / Revised: 5 August 2019 / Accepted: 6 August 2019 / Published: 9 August 2019
(This article belongs to the Special Issue Tsunami Science and Engineering II)

Abstract

:
Adequate design of pipelines used for oil, gas, water, and wastewater transmission is essential not only for their proper operation but particularly to avoid failure and the possible extreme consequences. This is even more drastic in nearshore environments, where pipelines are potentially exposed to extreme hydrodynamic events, such as tsunami- or storm-surge-induced inundation. The American Society of Civil Engineers (ASCE), in its ASCE7 Chapter 6 on Tsunami Loads and Effects which is the new standard for tsunami impacts and loading, specifically stresses the need to study loads on pipelines located in tsunami-prone areas. To address this issue, this study is the first of its kind to investigate loading on pipelines due to tsunami-like bores. A comprehensive program of physical model experiments was conducted in the Dam-Break Hydraulic Flume at the University of Ottawa, Canada. The tests simulated on-land tsunami flow inundation propagating over a coastal plain. This allowed to record and investigate the hydrodynamic forces exerted on the pipe due to the tsunami-like, dam-break waves. Different pipe configurations, as well as various flow conditions, were tested to investigate their influence on exerted forces and moments. The goal of this study was to propose, based on the results of this study, resistance and lift coefficients which could be used for the design of pipelines located in tsunami-prone areas. The values of the resistance and lift coefficients investigated were found to be in the range of 1 <   C R < 3.5 and 0.5 ≤   C L < 3 , respectively. To that end, the study provides an upper envelope of resistance and lift coefficients over a wide range of Froude numbers for design purposes.

1. Introduction

Pipelines located in coastal areas are important infrastructures which are used for gas and oil transportation, as well as for conveying and disposing of potable and wastewater, respectively. The Canadian Energy Pipeline Association [1] published a report on “pipeline watercourse management” which focuses on damage to pipelines caused by natural hazards and proposes practices to ensure the safety of public and environment in the case of severe damages to operating pipelines in Canada. Safe design of pipelines in coastal areas is of critical importance, as damage to these pipelines can have significant economic and environmental consequences. Different engineering criteria need to be considered as pipes located in the vicinity of coastal waters or in the shallow water region are subject to a variety of regular loading conditions, such as waves, tides, and nearshore currents, in addition to extreme loads, such as storm surges and tsunamis. Until now, the focus of research on pipe loading exclusively focused on hydrodynamic forces exerted in steady unidirectional or oscillatory flows for horizontal or vertical cylinders.
To study the hydrodynamic forces exerted on pipelines, understanding the flow behavior around the pipe is critical. Several studies on flow behavior around circular cylinders near a plane boundary (wall) were performed.
Flow around a circular cylinder changes depending on the flow characteristics defined, among other parameters, by the cylinder Reynolds number.
Re = D u ν ,
where D is the diameter of the cylinder, u is the flow velocity, and ν is the kinematic viscosity. The flow undertakes considerable changes with an increase in Re as the wake and boundary layer characteristics experience massive change. Details of such changes were given by Sumer and Fredsøe [2].
Vortex shedding behind an isolated circular cylinder, which occurs when flow turbulence reaches above a critical Reynolds number (Re = 40), is a commonly observed phenomenon which causes uncertainties in the estimation of the drag and lift forces. Due to the frequent vortex shedding occurring behind the pipe placed in flow, local pressure along the cylinder circumference changes and, hence, causes superimposing fluctuations to the drag and lift forces exerted on the cylinder [3]. Drag and lift forces are usually expressed by their non-dimensional forms as drag and lift coefficient, respectively. Drag and lift coefficients depend on both the cylinder geometry and the incoming flow characteristics. In the case of horizontal cylinders close to plane boundaries, the turbulent characteristics of the flow in the region close to that boundary change depending on the boundary properties such as its roughness. Such variations in the flow characteristics affect the abovementioned non-dimensional parameters.
The effect of the wall proximity on the exerted hydrodynamic forces, as well as the properties of the vortex shedding on horizontal circular cylinders, made the subject of intense research in the past. When pipelines are placed on the seabed, flow around the pipe may cause scouring of the bed material. This may lead to the pipe being suspended above the bed with an underlying gap, usually in the range from 0.1D to 1.0D [2]. Above-ground transmission pipelines, installed in initially dry conditions, are also usually installed onto supports which ensure a prescribed distance between the pipe and the ground. When such pipes are accidentally flooded, this distance can significantly impact the flow around the pipeline. Therefore, it is important to understand the flow characteristics that occur in the proximity of such a pipe.
Several researchers studied the induced forces on pipes placed near seabeds, such as Aristodemo et al. [4] who proposed a new numerical model for the estimation of the horizontal and vertical hydrodynamic forces induced on submarine pipelines exposed to non-linear wave and current conditions.
The parameter gap ratio, e/D (e being the distance between the lower edge of the pipe and the ground), is defined for the purpose of investigating the impact of bed proximity on flow hydrodynamics around the pipe. In the case of large e/D values (e/D > 1), the pipe acts similar to a free cylinder with no boundary effects.
Figure 1a defines the location of a stagnation point (a point in a flow field where the local velocity of the fluid is zero) and separation point (the position where a boundary layer separates from the surface of a solid body), while Figure 1b illustrates the displacement of these points in the existence of a plane boundary during a wave and/or current flow around a circular cylinder.
According to Sumer and Fredsøe [2], flow around a cylinder placed close to the bed as shown in Figure 1b may change as follows depending on the gap ratio e/D:
The angular position of the stagnation point displaces and moves to lower angles.
A change in the gap ratio also changes the angular position of the separation point. As the gap ratio decreases, the separation point at the free-stream side of the cylinder moves upstream, while the separation point at the wall side moves downstream.
Vortex shedding suppression happens when e/D < 0.3 due to the asymmetry of the generated vortices on the free stream and wall side of the cylinder. Larger vortices on the free-stream side interact with small vortices occurring near the wall and cause vortex shedding suppression compared to regular vortex shedding, which results in increased suction on the free side of the cylinder.
Most studies revealed a gap ratio of e/D = 0.3 as the distance for which vortex shedding suppression commences. Bearman and Zdravkovich [5], Angrilli et al. [6], and Zdravkovich [7] supported this hypothesis by looking into the power spectra of hot-wire anemometer signals occurring in the wake region behind a cylinder. However, results from Buresti and Lanciotti [8] showed a gap ratio of e/D = 0.4 to be the critical gap ratio. The existence of vortex shedding causes the occurrence of a peak in the power spectra which disappears due to the suppression at a specific gap ratio.
A new topic in pipeline design emerged due to the recent extreme events, such as the impact of pipelines by coastal flooding generated by tsunamis and storm surges, which caused massive damage to such infrastructure. Catastrophic events, such as the 2011 Tōhoku Tsunami in Japan and the 2012 Typhoon Haiyan in the Philippines, increased the interest of researchers to re-evaluate existing design and safety standards to consider the effects of such extreme events. The American Society of Civil Engineers (ASCE), through its ASCE7 Tsunami Loads and Effects Committee, developed a new standard for tsunami impacts and loading, ASCE7 Chapter 6 [9]. Amongst the potential effects of such extreme events on infrastructure, the standard specifically emphasized the need to investigate tsunami loads on pipelines located in the flood zone.
Several research articles focused on investigating forces induced by a hydraulic bore on infrastructure experimentally. Wind wave forces on cylinders were the subject of many studies in the context of hydrodynamics [2] and coastal engineering studies [10,11]. Qi et al. [12] investigated the tsunami inundation forces exerted on structures using steady flow data. Several other studies [13,14,15,16,17] evaluated the forces induced from tsunami wave–structure interaction under unsteady conditions. Aristodemo et al. [18] conducted a small-scale experimental study in a wave flume along with a numerical investigation using a smoothed-particle hydrodynamics model. In their study, they investigated the induced loading from a solitary wave on a horizontal circular cylinder.
Various guidelines are available for the design of buildings against tsunami loads and effects. Among them, the Federal Emergency Management Agency (FEMA [19]), in the section related to the design of Structures for Vertical Evacuation from Tsunamis, mentions different forces exerted on a body during a tsunami as follows:
  • Hydrostatic and buoyant forces: Hydrostatic forces occur when still or slow-moving water interacts with a fixed body. The vertical component of the hydrostatic force is the buoyancy force. For partially or fully submerged bodies, the buoyancy force is exerted at the centroid of the displaced water volume.
  • Hydrodynamic force: Also referred to as the drag force, it is caused by fluid flowing around a structure. The structure’s geometry, and its flow characteristics and fluid density influence the magnitude and direction of the hydrodynamic force. The drag force is a combination of the pressure force from moving the mass of fluid, as well as friction force between the flowing fluid and the structure. The hydrodynamic force is exerted at the centroid of the wetted surface and can be calculated as
    F d = 1 2 ρ s C d B ( h w u 2 ) m a x ,
    where ρ s is the water density, C d is the drag coefficient, B is the width of the structure in the plane normal to the direction of flow, h w is the water surface elevation or flow depth, and u is flow velocity at the location of the structure. C d depends on both flow characteristics and the structure’s geometry and orientation. FEMA [19] suggests using a drag coefficient value C d = 2 , while the recent update to the ASCE7 standard [9] suggests values based on the width-to-inundation-depth ratio and the type of structural component. Suggested C d values in the ASCE7 are in the range of 1.2 < C d < 2.5.
  • Impulse force: Impulse or impact forces act on a body when the leading edge of the bore reaches the structure rapidly. Several studies focused on measuring and analyzing the impulse force on vertical structures. FEMA [19] guideline refers to different studies such as Arnason [14] and Ramsden [20] and suggests an impulse force equal to 1.5 times the hydrodynamic force in the case of structural wall elements. Consequently, such forces cause damage to the structural element, as well as to the joints, and may cause massive damage on the structure even when the hydrodynamic force is larger than the impulse force [11,21]. The impulse force is usually followed by an increase in force magnitude as the bore flow accumulates in front of the structure causing a “bulb-like” wake. This force is also termed “run-up force” or “transient hydrodynamic force” [21].
  • Uplift force: Uplift forces are usually exerted on elevated surfaces that are submerged during tsunami inundation waves. In fact, water passes through a gap between the ground and the elevated surface remarkably fast during a tsunami and this induces uplift onto the bottom surface of the elevated horizontal components. This uplift force adds to the hydrostatic vertical component (the buoyancy force). FEMA [19] suggests a formula for computing the uplift force as
    F u = 1 2 C u ρ s A f u v 2 ,
    where C u is the lift coefficient, and ρ s is the fluid density. FEMA [19] suggests C u = 3.0. A f is the area of the floor panel, and u v is the estimated vertical velocity or water rise rate.
The abovementioned force components were previously addressed in studies and guidelines for the design of vertical evacuation structures. However, to the authors’ knowledge, no study investigated the loads exerted in the case of tsunami inundation waves impacting horizontal circular cylinders or pipelines, and there is a lack of knowledge regarding the characteristics of such loads on the following:
-
Above-ground pipelines, placed at a given distance from the ground using supports.
-
Fully submerged pipelines placed onto or near the ocean or seabed.
-
Partially submerged pipelines.

Objectives

Based on the above outlined lack of knowledge, this study details the findings in this second portion of a two-part work describing a comprehensive experimental program to investigate extreme hydrodynamic loading on pipes. The first part of this study [22] focused on the description of the experimental program and instrumentation, the hydrodynamics of the extreme flow generated, and the influence of the pipe presence on flow hydrodynamics. This second part details the results of the study with respect to the hydrodynamic forces measured and the calculation of the force coefficients. The specific objectives of this second part of the study are as follows:
  • Measuring and analyzing the changes in drag and lift forces exerted on the pipe due to a tsunami-like bore using different pipe elevations or gap ratios e/D for the dry bed condition.
  • Studying the effect of still water depth d and of the impoundment head-to-depth ratio d/h, d being the still water depth and h being the reservoir depth, on the various force components caused by tsunami-like dam-break wave on the pipelines in the wet bed condition.
  • Investigating the variation of the drag and lift forces exerted on fully and partially submerged pipelines with the different initial level of submergence ratio S/D, in order to examine the influence of the submergence on the force components.
  • Studying the characteristics and the magnitude of the forces exerted on pipelines by dam-break waves generated using different reservoir impoundment depth h, for both dry and wet bed conditions.
  • Proposing force coefficients for various flow conditions and pipe configurations.
It is anticipated that these results will lead to formulating recommendations for the optimal design of pipelines located in tsunami-prone areas, which will be both environmentally and economically safe during such extreme events. The research will also allow for better design and determine load conditions in regions subjected to potential natural hazards.

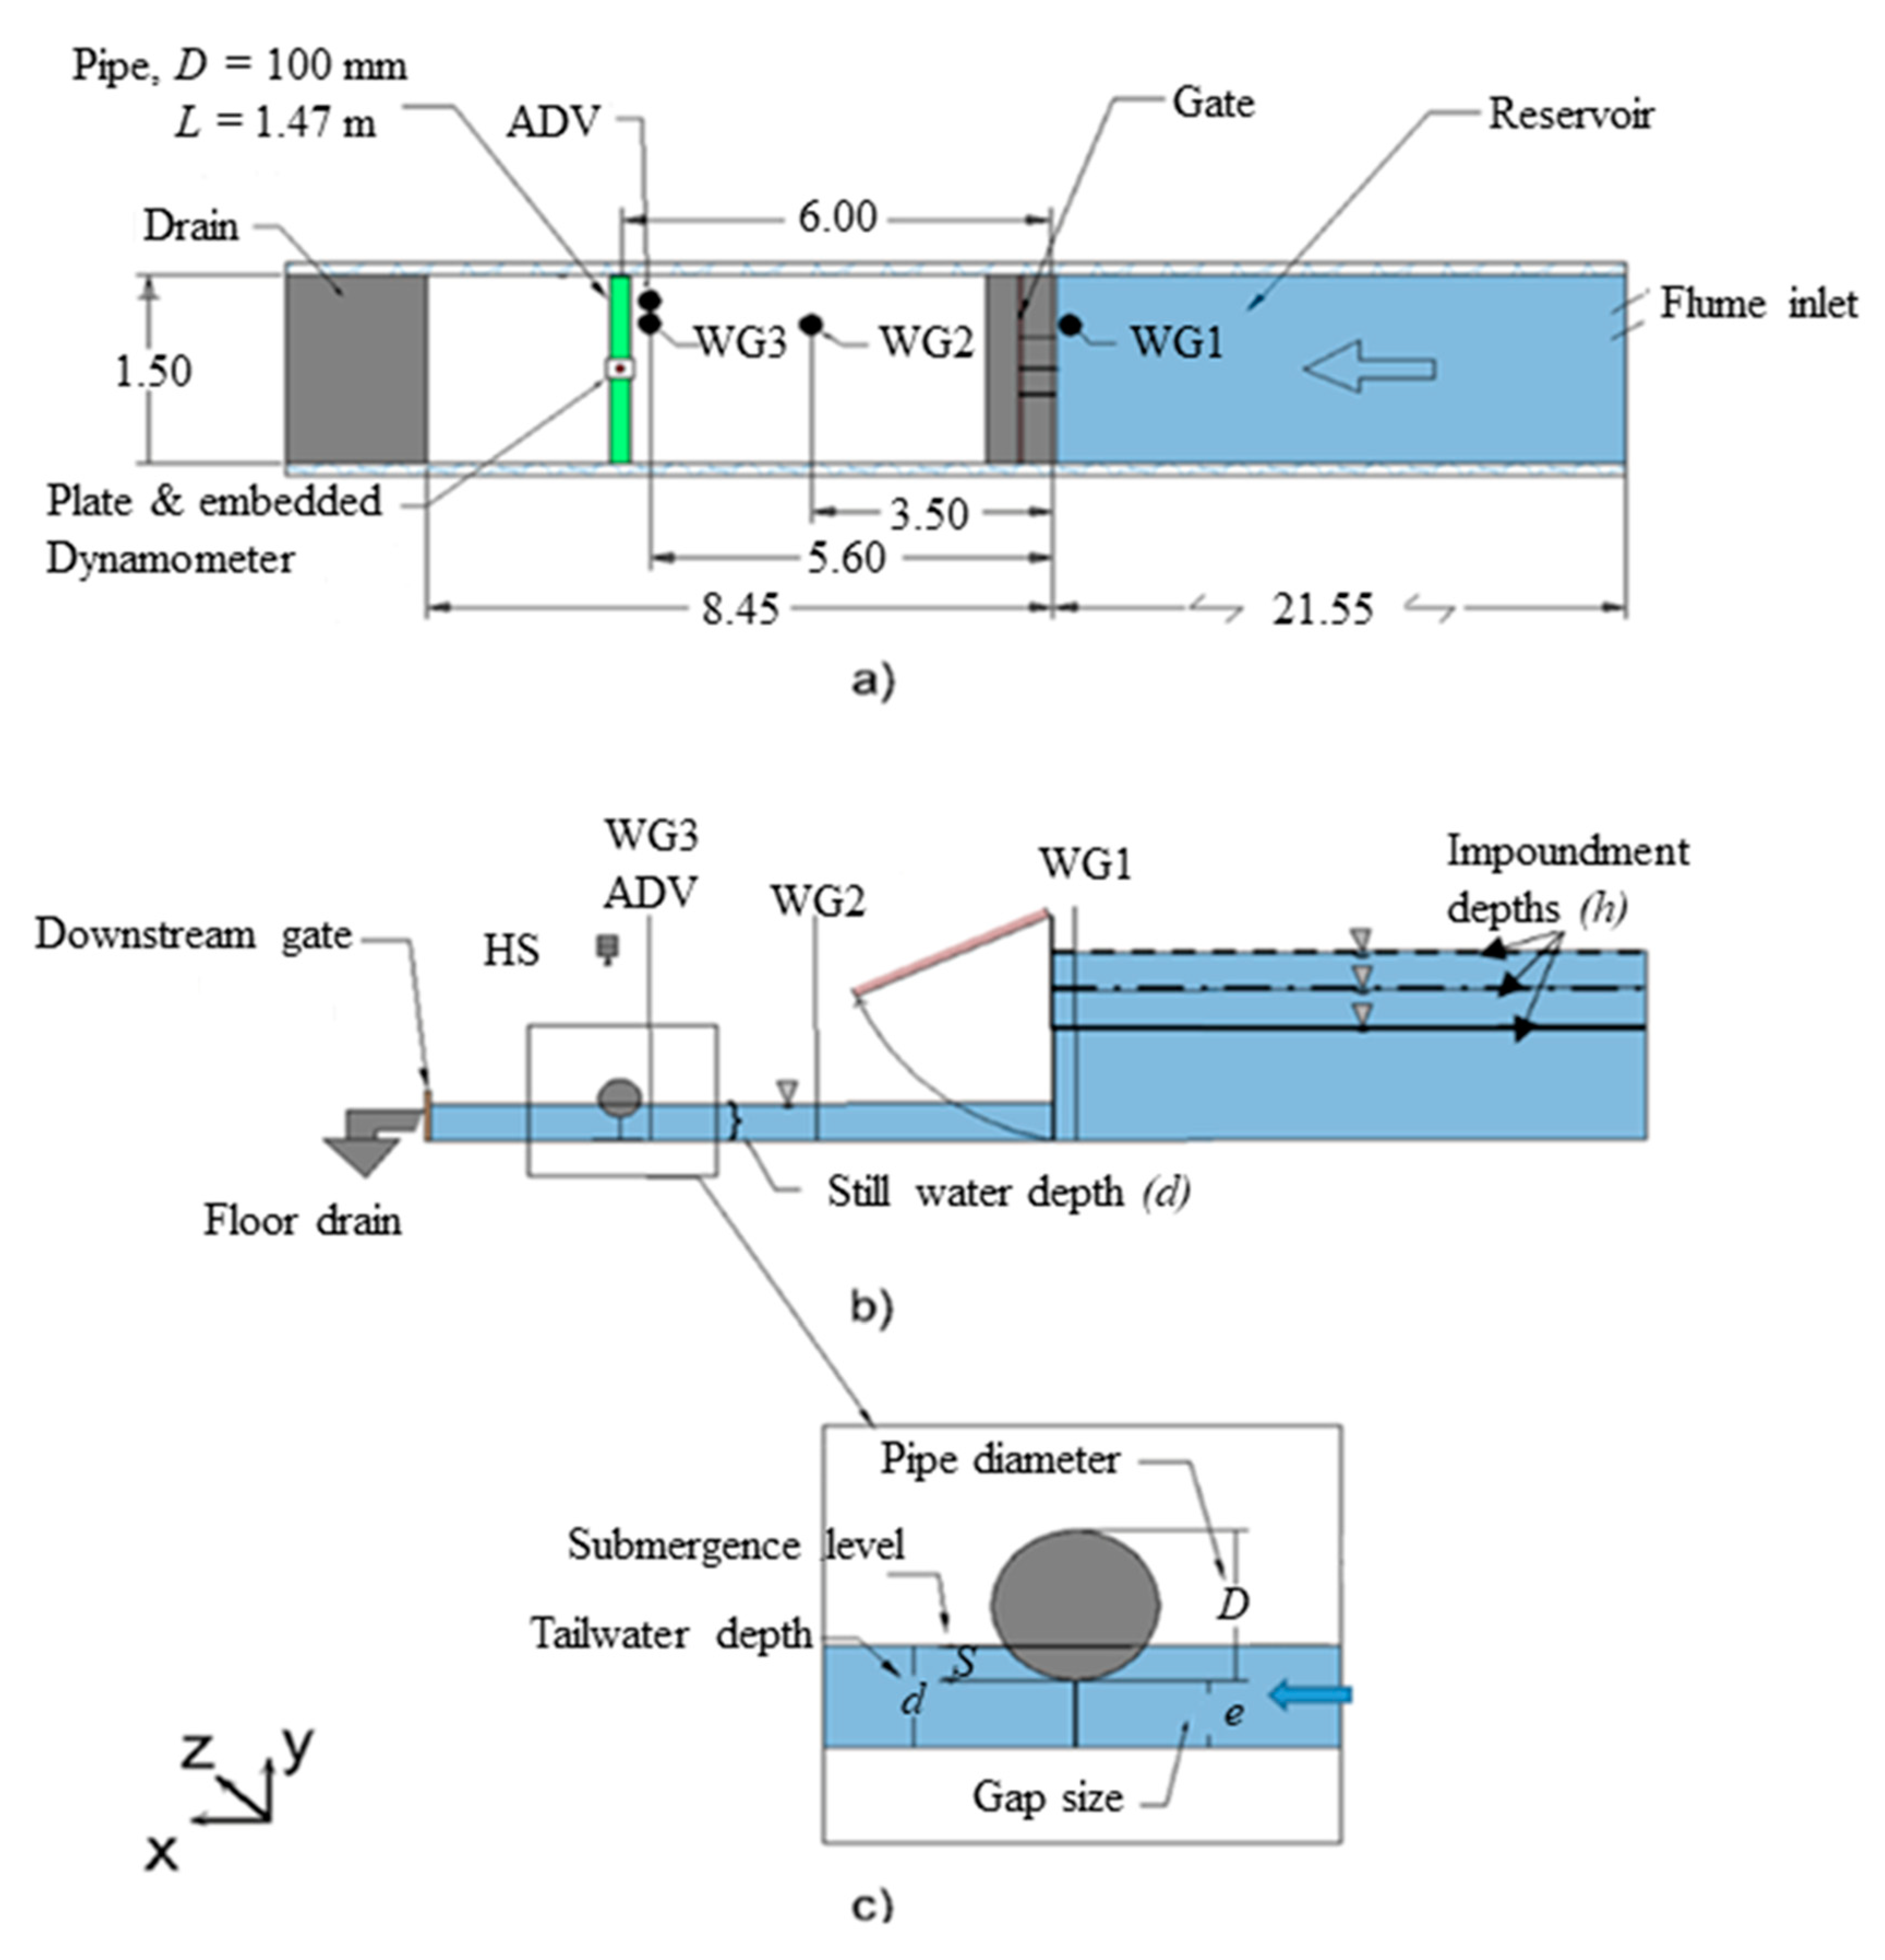
2. Experimental Set-Up

A comprehensive experimental program was designed and conducted in the Dam-Break Flume in the Hydraulic Laboratory at the University of Ottawa, Canada. The flume is 30.1 m long, 1.5 m wide, and 0.5 m deep. Various hydrodynamic parameters, as well as the forces exerted on the physical model of the horizontal pipeline (0.1 m in diameter and 1.47 m in length), were measured during the tests. Figure 2 illustrates the schematic view of the dam-break flume and location of instruments and the experimental parameters (impoundment depth and downstream water levels).
Details of the experimental facilities and their characteristics are reported in the companion paper [22]. Table 1 presents an overview of the instruments used in the experiments and their specifications.

Experimental Program

A comprehensive experimental study was conducted to investigate effects of design parameters on extreme hydrodynamic loadings on pipelines. Parameters considered in this study include reservoir depth, h, still water depth, d, ratio of the lower edge of pipe distance to bed, e, to diameter, e/D, and pipe level of submergence, S, to pipe diameter ratio, S/D. An initial set of tests was performed without the pipe installed in the flume to investigate the initial hydrodynamic conditions.
The second set of tests was conducted with the pipe installed inside the flume to study bore–structure interaction and to measure and analyze the forces exerted on the pipe due to the impacting bore. The pipe was filled with water in all the conducted tests. A detailed list of experimental parameters and results with respect to the hydrodynamics of this experimental program is presented in the companion paper [22].

3. Results and Discussion

3.1. Flow Hydrodynamics

The hydrodynamic properties of the generated dam-break waves were affected by the flume bed conditions, i.e., dry and wet bed conditions. The dry bed condition represents the first tsunami-like wave flowing on land, while the wet bed condition represents the following waves flowing on an existing layer of water remaining from the earlier wave attack. The flow hydrodynamics at the location of the pipe for dry and wet bed conditions are described below. Details of the flow hydrodynamics throughout the entire flume, as well as its change in the presence of the pipe, are discussed in more detail in the companion paper [22]. However, due to consistency and completeness of this work, a summary of the evolution of the surface elevation, velocity, and Froude number time-histories is presented below.

3.1.1. Dry Bed Condition

The flow characteristics at the pipe location were studied to analyze the forces exerted on the pipeline. Figure 3 illustrates the dry bed surge characteristics as the time-history of the water surface profile (wave gauge 3, WG3), the flow velocity, and the Froude number at the location of the pipe. The reference time for all experimental tests is the bore arrival time at WG3. There was a delay in velocity measurements using the ADV due to the air entrainment close to the wave arrival time, which corresponds to the zone with no data in the first few seconds in Figure 3b,c. Time-histories of the Froude numbers for the dry bed condition and different reservoir heights are shown in Figure 3. It should be noted that, for the impoundment depth of h = 30 cm, the water level increased and the flow velocity decreased more gradually compared to the cases with h = 40 cm and h = 50 cm. As shown in Figure 3c, the dry bed surge was supercritical, Fr > 1, throughout the studied time frame for all three impoundment depths. The Froude numbers remained almost constant in the case of h = 30 cm, whereas they gradually decreased for h = 40 cm and h = 50 cm.

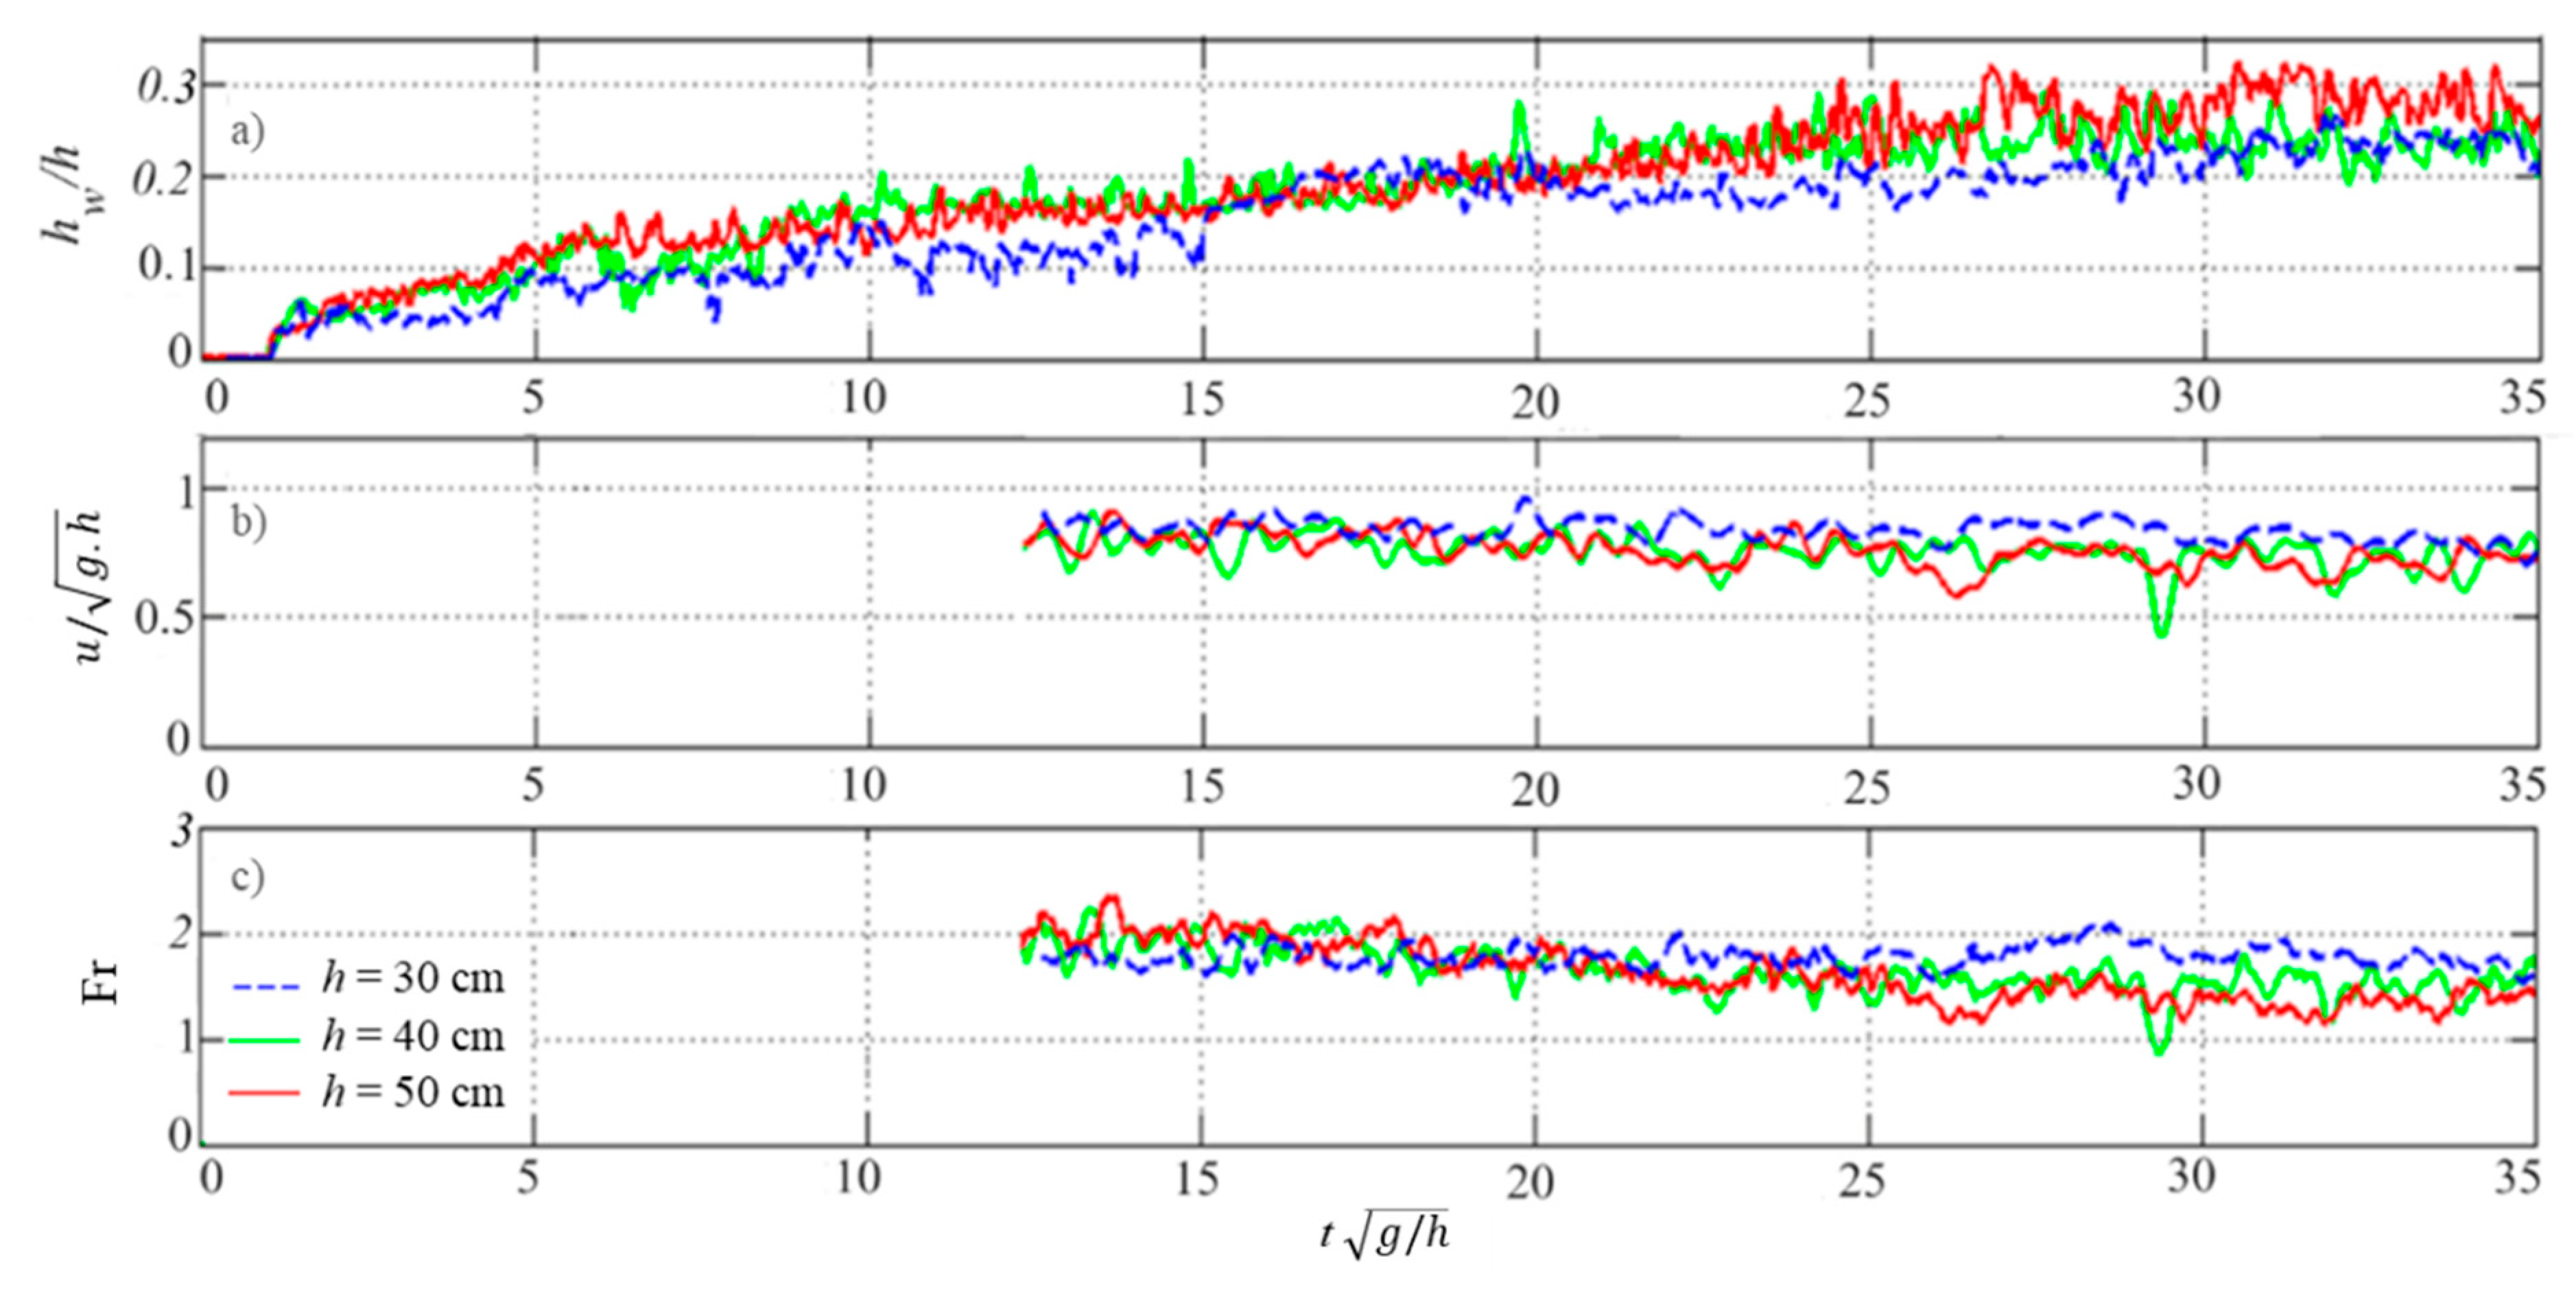
3.1.2. Wet Bed Condition

Figure 4 shows the wet bed bore time-histories of the flow velocity and the derived Froude numbers for the cases where the wet bed condition was employed, for a constant impoundment depth, h = 40 cm, and for different d. The reference time for all the cases shown in Figure 4 is the wave arrival time to wave gauge WG3. The flow velocity data at the beginning of the bore propagation were considered invalid and were eliminated from Figure 4b–d. Results show a noticeable decrease in flow velocity (Figure 4b) and the estimated Froude number (Figure 4c), with an increase in the d/h ratio. This is because waves generated using a smaller pressure head (small difference between the impoundment depth and the downstream still water depth) result in slower flow velocities and smaller associated Froude numbers. Results from all the three tested impoundment depths, i.e., h = 30, 40, and 50 cm, show that, for d/h > 0.3, the flow was subcritical, while, for d/h     0.2, the flow was supercritical. The d/h values around 0.2 resulted in a critical flow regime with the Froude number magnitude fluctuating around 1.0. A similar trend was observed for the case with h = 30 cm and h = 50 cm.

3.2. Drag and Lift Forces

Results from tests using different impoundment water depths and water depths downstream of the gate for different e/D values in wet and dry bed conditions are presented in this section. For clarity, all results are shown starting 1.0 s prior to the wave arrival time. The force magnitude in vertical (lift) and horizontal (drag) directions were set to zero shortly before the start of each test to eliminate the effect of the latent hydrostatic forces, as well as that of the pipe’s own weight.

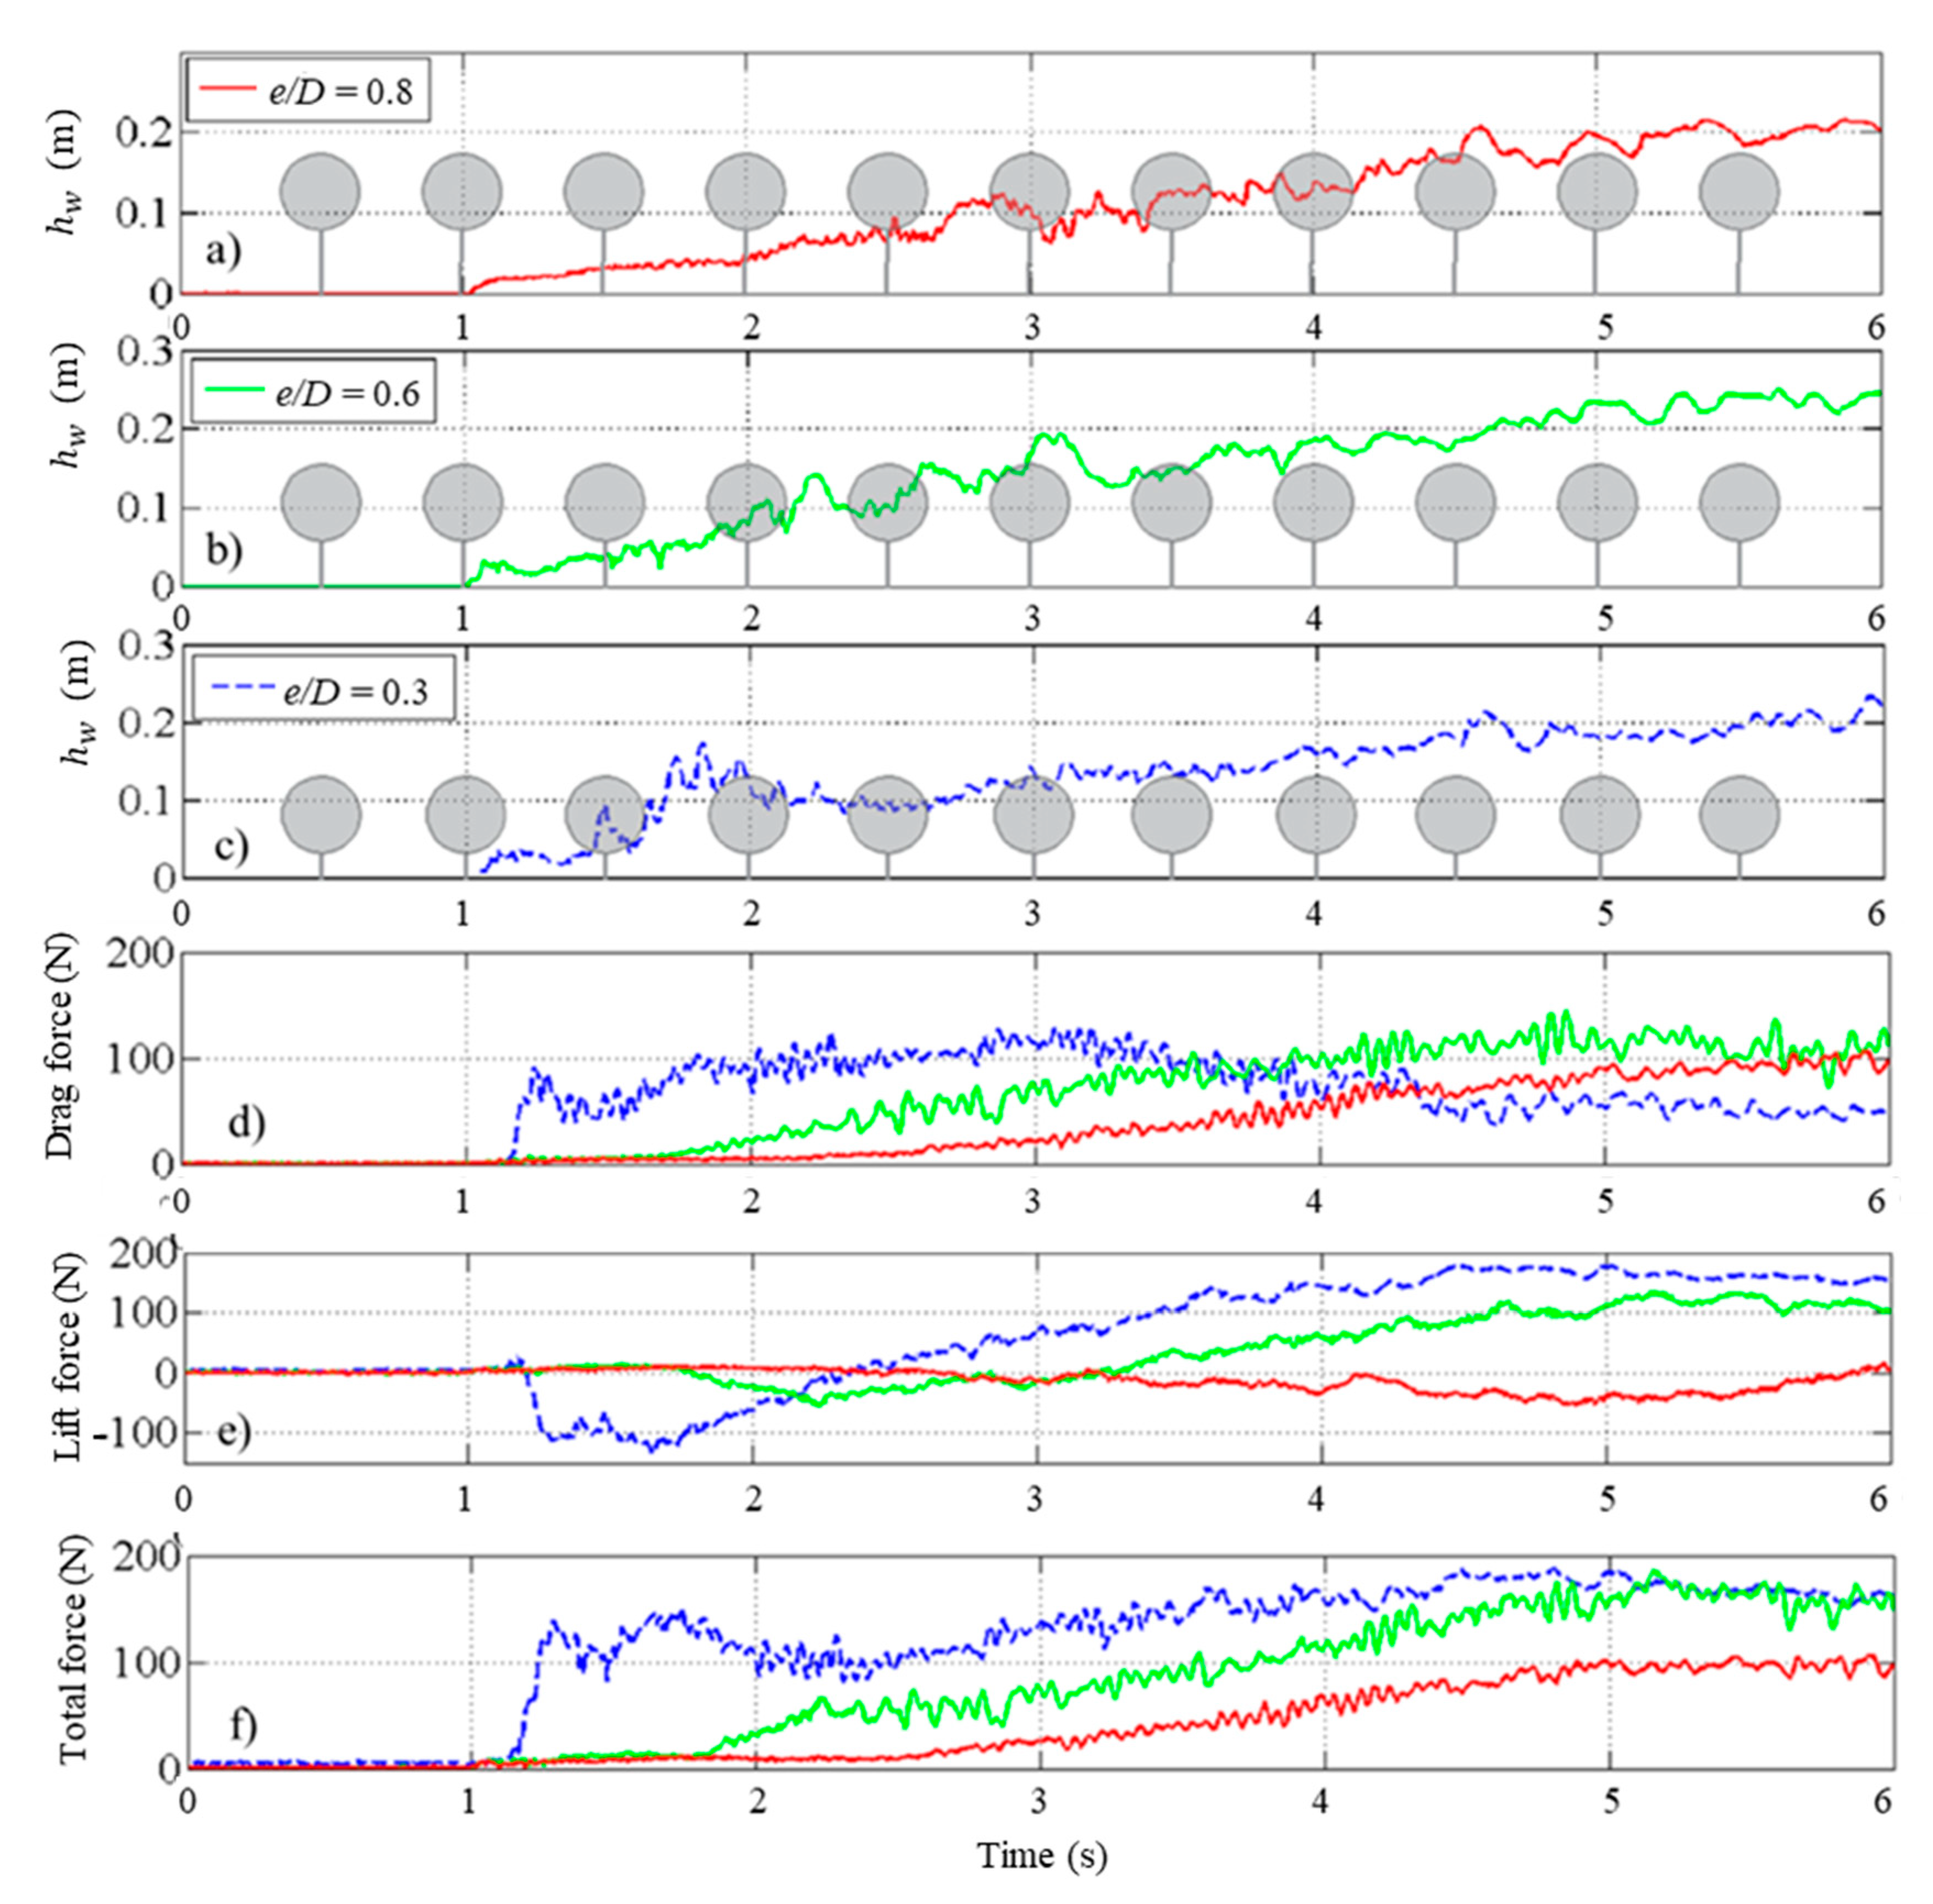
3.2.1. Force Time-History for the Dry Bed Condition

(a) Influence of pipe gap ratio (e/D)
Figure 5 shows the results from a test conducted with a wave generated by an impoundment depth h = 40 cm in the dry bed condition downstream of the gate. Figure 5a shows the water level time-history recorded by WG3 for the case with a gap ratio e/D = 0.3, while Figure 5b,c show the time-histories of the water level for e/D = 0.6 and 0.8, respectively. The schematic of the pipe with the corresponding distance from the bed is shown in Figure 5a–c for e/D = 0.8, 0.6, and 0.3, respectively, in order to visualize the level of the submergence and the full submergence time for each case. The water level for e/D = 0.3 rose rapidly immediately after the wave impact time, while it gradually increased for cases with gap ratios of e/D = 0.6 and e/D = 0.8. Figure 5d shows the measured drag force time-history for the three gap ratios. In Figure 5d, one can observe that, for e/D = 0.3, the drag force behavior was considerably different when compared to data obtained using other e/D ratios. For this particular value of e/D = 0.3, an impulse force at the wave arrival instant was recorded, whereas, for the other two gap ratios e/D, no such considerable force was recorded. In the cases with a large gap ratio (e/D = 0.6 and e/D = 0.8), water passed through the gap for the first few seconds of the wave propagation. However, in the case of a smaller gap size (e/D = 0.3), less water passed through the gap and, instead, a large portion of the incoming flow separated from the bed and surged on top of the pipe. This observation can also be explained by the sudden rise in the water level for e/D = 0.3 at t = 1.5 s (half a second after wave arrival).
Hence, the impulse force was considerably larger for the test with e/D = 0.3 while a longer rise time was observed for the force to reach its maximum value for the tests with e/D = 0.6 and e/D = 0.8. A smaller volume of the water passing through the gap and a shorter rise time for the tests with e/D = 0.6 when compared to that e/D = 0.8 resulted in higher water levels and larger drag forces at e/D = 0.6. For the test with e/D = 0.3, the water level reached the top edge of the pipe at t = 3.16 s. At this time, a surface roller formed right upstream of the pipe and started to propagate upstream, causing a considerable decrease in the drag force. The surface roller was also observed in the case of vertical structure obstructing a dam-break flow impacting a column by Reference [23]. For the other two gap ratios of e/D = 0.6 and 0.8, the observed surface roller was much smaller in size and the upstream propagation speed was considerably slower. Therefore, only in the test performed with e/D = 0.3 was a sudden decrease in the drag force observed. After t = 4.4 s, when the pipe was submerged in all the three gap sizes, the lowest drag force magnitude was associated with the gap ratio e/D = 0.3. This could be explained by the small distance of the pipe to the bottom, which caused the lower separation point to move downstream of the lower edge of the pipe while the upper separation point moved upstream of the upper edge. Such a separation point displacement by reduction of the gap ratio results in a larger wake size at the back of the pipe, which in turn results in a smaller drag force. This was observed and reported in previous studies [3,5,7,24]. Moreover, after full submergence, at smaller gap ratios (e/D < 0.3), vortex shedding suppression occurs due to the asymmetry of the vortices occurring at the top and bottom of the pipe. Therefore, von Kármán vortex shedding behind the cylinder suppresses and causes larger suction and smaller drag force exerted on the pipe.
The measured vertical (lift) force component time-history for the three gap ratios tested is shown in Figure 5e. This figure shows that the magnitude of the lift force increased considerably as the gap ratio decreased during the entire time-history. The variations observed in the time-history of the lift force occur mainly due to the displacement of the stagnation point. At larger gap sizes, the stagnation point moves away from the plane boundary which causes a considerable decrease in the lift force. A large gap ratio also diminishes the plane boundary effect, and the pressure distribution becomes symmetric. As a result, both the drag and lift forces decrease considerably. Moreover, at the beginning of the surge, the lift force at e/D = 0.8 was extremely small due to the longer duration it takes for the wave to reach the lower edge of the pipe. The downward-oriented lift force at the beginning of the bore surge at e/D = 0.3 can be explained with the large volume of water surging on top of the pipe immediately after the bore impact time, which pushes the pipe toward the flume bed. After the first impact, this downward vertical force was not observed in the tests when e/D = 0.6 and e/D = 0.8 as the flow passed through the gap. Figure 5f shows the total force which was calculated using the following equation:
F T = F y 2 + F z 2 .
Results from Figure 5f indicate that the total force increased considerably as e/D decreased with the highest values recorded for the tests when e/D = 0.3. This is due to the larger drag and lift force observed at smaller gap ratios. The same trend in the force time-history was observed for the tests with the reservoir impoundment depths of h = 50 and 30 cm.
(b) Influence of the impoundment depth
Figure 6 shows the water level and the force components for different reservoir impoundment depths for the smallest e/D ratio used in the tests (e/D = 0.3). As expected, due to the larger initial head which translated into the dam-break wave with the highest flow depth, the reservoir depth h = 50 cm generated the largest force components magnitudes (Figure 6b). As discussed in the companion paper [22], higher impoundment depths lead to higher flow velocities and bore heights. This, in turn, increased the exerted drag force. For the impoundment depth h = 30 cm, the impulse force was considerably smaller compared to the two other larger impoundment depths. Waves generated using larger reservoir depths exhibited significantly steeper bore fronts, which impacted the pipe front face and caused a sudden water level rise and a larger impulse force at the time of bore impact. Figure 7 shows the more abrupt water level rise, which results in a larger impulse force in higher reservoir depths. For the cases with larger impoundment depth (h = 50 and 40 cm), large standing waves are generated in front of the pipe after the initial impact. After t = 4 s, the standing waves dissipated and started to move upstream toward the gate surface roller which resulted in a decrease in the drag force. In the case of the smallest impoundment depth h = 30 cm, standing waves and a returning surface roller were not observed. Therefore, the drag force increased gradually until reaching the maximum magnitude and remained then constant.
The lift force time-history in all three cases showed a downward peak which became larger with an increase in the reservoir impoundment depth from h = 30 to 50 cm. In Figure 6c, the negative peak of the vertical force (Fz) varied from −25 N to −50 N and to −150 N for water depths h = 30, 40, and 50 cm, respectively. This is due to the larger amount of water surging over the top of the pipe and pushing the pipe downward as the wave was larger. The lift force was generally larger for waves generated by the larger reservoir depths, mainly due to the higher flow velocity of the dam-break waves generated with higher impoundment depths. The total force magnitude, which is a function of the combination of the drag and lift forces, was maximum for waves generated using h = 50 cm (Figure 6d).

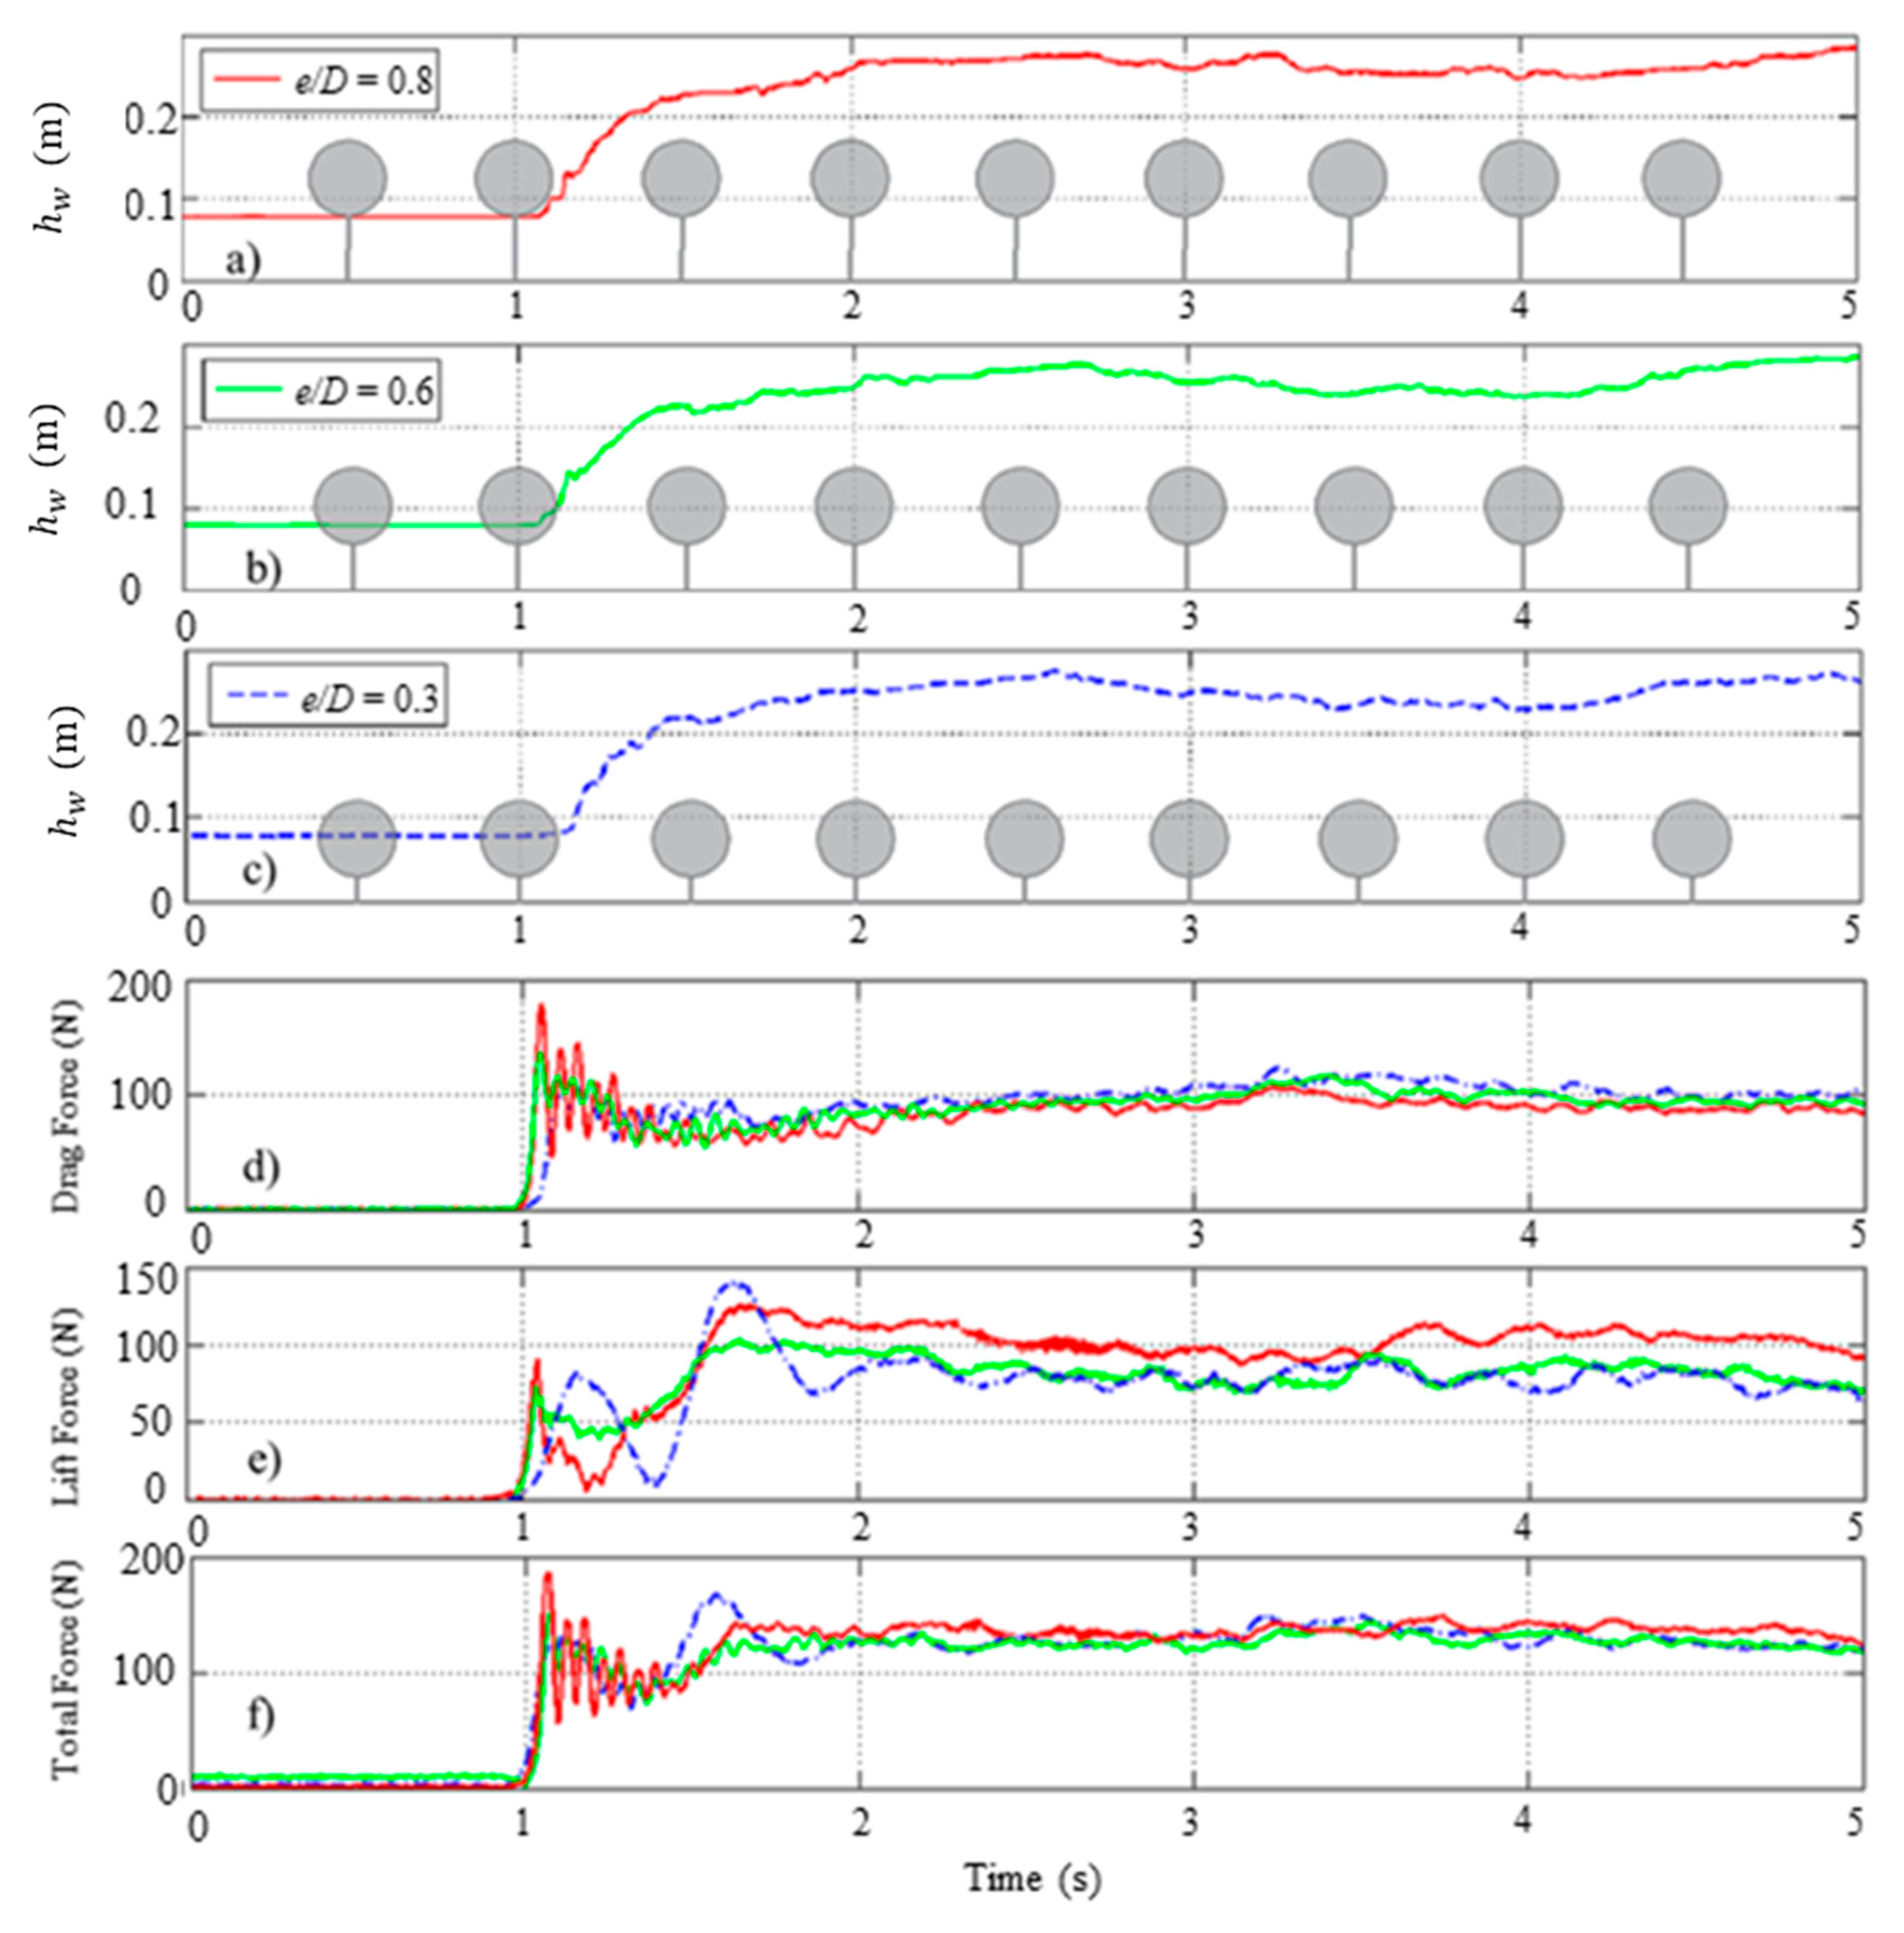
3.2.2. Force Components for the Wet Bed Condition

(a) Influence of pipe gap ratio (e/D)
Figure 8 shows hydrodynamic force components in the case of the wet bed condition for a wave generated by an impoundment depth h = 40 cm and a relative downstream water level d/h = 0.2. For the same initial forcing conditions, considerable changes in the hydrodynamic force time-history pattern can be observed at the time of bore impact when compared to the case with a dry bed condition; in the wet bed condition, the horizontal impulse force shown in Figure 8d for all three gap ratio values is significant compared to the case of a dry bed (Figure 5d). In the wet bed condition, the gap between the pipe and the boundary was filled with water. Therefore, unlike the dry bed case where the flow passed through the gap and gradually reached the pipe, the bore impacted the entire pipe cross-section at the bore arrival time, resulting in a large impulse force. Moreover, according to Yeh [25], the impulse force increases due to the impact of a steeper bore front onto the object in the path of the flow. Hence, the absence of a clear impulse force for the case of the dry bed condition can be attributed to the significantly milder slope of the bore as discussed in the companion paper [22]. From Figure 8d, it can be concluded that, for the wet bed condition, the drag force magnitude during the impact time does not change drastically by changing the gap ratio (e/D). Since, for the wet bed condition, the gap between the pipe and flume bed was partially or completely filled with water prior to the arrival of the bore, the effects of the gap ratio and boundary conditions, such as bed roughness, as well as separation and stagnation point, on the recorded force components are also decreased. Only the horizontally directed impulse force subsided in magnitude as the pipe was further submerged by the incoming bore and as the gap ratio decreased. This was due to an increase in the effective contact area of the pipe with the incoming surge by a lower initial level of submergence.
Similar to the drag force time history for the wet bed condition, results of the lift force time-history in Figure 8e show a considerable initial impulse vertical force. A general trend for the lift force time-history e/D = 0.6 and 0.8 with a smaller initial submergence ratio (S/D < 0.3) was observed, where increasing e/D led to an increase in the impulse lift magnitude. However, for e/D = 0.3, with the initial level of submergence S/D = 0.5, the pipe was totally submerged right after the bore impacted the pipe, and the vertical force exhibited an oscillatory behavior with smoother changes in its time-history. The maximum peak of the lift force was observed for the smallest gap ratio (e/D = 0.3) due to the increased suction forces on the free-stream side of the pipe. No distinct difference between the results for different gap ratios was observed in the total force time-history (Figure 8f).
(b) Influence of the wet bed still water depth d and submergence ratio S/D
Figure 9 shows the results for the water depth, the drag force, lift force, and the total force for different still water level depths downstream of the gate for the case of e/D = 0.6. The d/h ratio was adjusted by varying the still water depth d and using a constant impoundment depth h, which resulted in different levels of pipe submergence S/D as shown in Figure 9a.
The time-history of the drag force (Figure 9b) shows that. for S/D = 0 (the pipe not being submerged at the initial stage before opening the gate), the drag force initially exhibited an initial bore impact (impulse force) and further decreased to lower magnitudes afterward. When the initial still water level was below the bottom edge of the pipe (d/h = 0.075), the measured run-up force was larger compared to the impulse force just a few seconds after the bore impact. However, when the pipe was partially submerged with S/D < 0.5, the impulse force was the maximum one. For S/D ≥ 0.5, a smaller impulse force was observed and the magnitude of the drag force remained constant as the pipe became fully submerged. In the case of a fully submerged pipe with S/D = 1, no considerable impulse force was recorded and a gradual drag force magnitude increase was observed, mainly due to an increase in the flow velocity. The run-up force was caused by the pipe obstructing the flow. Therefore, as the pipe was increasingly submerged, this force decreased. This occurred faster for the pipe with a larger initial level of submergence.
The time-history of the lift force shown in Figure 9c indicates a decrease in this force’s magnitude with an increase in d and, as a result, an increase in the initial S/D ratio. Lowest values were observed for the case of the fully submerged pipe (S/D = 1). In this case, incoming flow only passed over the top of the pipe inducing small, mostly downward, vertical forces. The downward lift force at the time of the bore impact for the cases when S/D = 0 is due to the volume of water surging on top of the pipe at the time of bore impact. The rapidly surging water further pushed the pipe downward. Figure 9d shows the decrease in the total force time history with an increase in the d/h and S/D ratios. As discussed in the companion paper [22], a significant decrease in flow velocity was observed as the downstream still water level was increased. This explains the smaller force component magnitudes in larger d/h ratios. A similar trend in total force time-histories was observed for the cases when e/D = 0.3 and e/D = 0.8.

3.3. Force Coefficients

Force coefficients are used to determine the drag and lift forces exerted on a body placed within flow. Current design guidelines recommend force coefficient values for different bodies including horizontal cylinders exposed to steady flow conditions. For the case of unsteady flow conditions, force coefficients were suggested mostly for vertically oriented bluff bodies. For the first time, this research investigates the variation of force coefficients for horizontal cylinders placed in unsteady flow conditions (dam-break waves). Due to the unsteady nature of the dam-break flow, force coefficients are not constant but vary considerably over the duration of the flow–structure interaction [14]. In this study, the measured horizontal force incorporates both the hydrodynamic and hydrostatic components. Therefore, the term “resistance coefficient”, rather than “drag coefficient”, was used for the experimentally determined horizontal force coefficient, similar to studies by Gupta and Goyal [26] for steady flows around bridge piers, and Arnason [14] for tsunami impacts on vertical structures. The resistance coefficient for different pipe configurations, different impoundment depths, and different wet bed conditions downstream of the gate were calculated using
C R = 2 F H ρ L D u 2 ,
where F H is the measured horizontal force during the experimental work, and D and L are the pipe diameter and pipe length, respectively. u is the depth average free-stream velocity as the average of ADV measurements at the highest water level, the location where the pipe center was later placed, and 0.03 m above the bed.
The lift coefficients were calculated using
C L = 2 F Z ρ L D u 2 ,
where F z is the measured vertical force.
Figure 10 shows the calculated resistance coefficient values as a function of the Froude number for all experiments. The values of the maximum estimated resistance coefficients were used to define an upper envelope for the resistance coefficients,   C R . In the case of the dry bed condition, due to the higher flow velocities, the values of the resistance coefficients are found at the right side of the graph, corresponding to the larger Froude numbers which characterized this particular condition. Based on the results presented in Figure 10 the suggested C R values vary between 1.0 and 3.5. Figure 10 shows that, for the case of supercritical flows (Fr > 1), C R was almost constant, while it linearly increased with a decrease in Fr in the subcritical flow regime (Fr < 1). The black line in Figure 10 represents the upper envelope encompassing the entire range of experimental cases, from non-critical to supercritical flow conditions. As shown, it covers a variety of submergence conditions and gap widths, as well as both wet and dry bed conditions. The previous study by Li and Lin [26] on induced forces by waves and currents on horizontally submerged circular cylinders suggested drag coefficients in the range of 0.6 <   C D < 4 for waves and 0.7 <   C D < 0.5 for currents.
Similar to the resistance coefficient, the experimentally determined lift coefficients were plotted against the calculated Froude numbers (Figure 11). The maximum lift coefficients for all experimental cases were calculated by the authors to further propose an upper C L envelope. This study suggests that C L values for pipelines in unsteady flow conditions vary in the range of 0.5 ≤   C L < 3 . Similar to the resistance coefficient behavior, C L remained almost constant in the supercritical flow region, while it increased as the value of Fr decreased in the subcritical flow region. Li and Lin [27] suggested lift coefficients in the range of 0.6 <   C L   < 6 for horizontal circular cylinders impacted by waves and 1.5 <   C L < 4 for cylinders impacted by currents.

4. Conclusions

A comprehensive experimental program was conducted to investigate the mechanisms of the extreme hydrodynamic loading exerted on a pipe due tsunami-like hydraulic bore flows. The time-histories of the hydrodynamic forces exerted on the pipe were measured and analyzed for different experimental conditions with respect to the pipe installation (distance/gap from the bed), as well as the flow characteristics (degree of submergence and hydraulic bores with different heights, as well as dry versus wet bed conditions over which the bore propagated).
Dam-break waves generated using higher reservoir impoundment depths propagating over the dry bed resulted in larger drag and lift forces due to considerably higher flow velocities compared to the case of the wet bed condition for the same relative impoundment depth.
Under the dry bed condition, the horizontal impulse force, observed at the initial impact of the bore, was considerably larger for smaller e/D, i.e., e/D ≤ 0.3. The small gap space between the pipe and the bed led to a full impact of the steep bore front. However, after the complete submergence of the pipe, the magnitude of the horizontal force decreased due to vortex shedding suppression. The lift force time-history for the dry bed condition showed larger lift forces for smaller e/D ratios due to the asymmetry in the pressure distribution at the bottom and top of the pipe when this was placed close to the bed.
Changing the pipe distance to the bottom (gap ratio, e/D) for the wet bed condition did not significantly alter the force components. However, the impulse force recorded in the case of the wet bed condition was considerably larger for the same relative impoundment depth when compared to the same wave propagating under the dry bed condition. This is due to the impact of a steeper bore front on the entire pipe at the initial impact.
The effect of the downstream still water depth d was investigated, and it was concluded that, for d/h ratios corresponding to a smaller initial level of submergence S/D, the impulse force was considerably larger compared to the cases with larger submergence levels. For the case of the fully submerged pipe S/D = 1, no impulse force was observed due to the elimination of effective contact area of the pipe exposed to surge.
The pipe resistance coefficient exhibited lower values for the case of supercritical flow conditions (Froude number > 1.0), for both the dry and the wet bed conditions. This study suggested force coefficient values for various Froude numbers and several pipe configurations. The wide range of suggested force coefficients for various flow and pipe characteristics could be helpful for design purposes. The suggested resistance coefficients are in the range of 1 < CR < 3.5 and lift coefficient values in the range of 0.5 ≤ CL < 3 for the experimental conditions investigated.

Author Contributions

B.G. developed the methodology and carried out the experiments. B.G. was also the main author responsible for the analysis of the data and writing the manuscript. J.S. assisted in conducting the experiments and contributed in reviewing and editing. I.N. and A.M. conceived the presented idea, supervised the work, and contributed in reviewing and editing. N.G. provided some of the instruments utilized in the study, assisted in the experimental set-up, and also contributed in reviewing and editing.

Funding

This research was funded by NSERC Discovery Grants held by Ioan Nistor, No. 210282 and Majid Mohammadian, No. 210717. Partial support for the study came through the Marie Curie International Outgoing Fellowship of Nils Goseberg within the 7th European Community Framework Program, No. 622214).

Acknowledgments

The authors are grateful to the University of Ottawa Hydraulic Laboratory Technician, Mark Lapointe, as well as to Adrian Simpalean and Derek Eden, graduate students at the University of Ottawa, for their assistance during the experimental work.

Conflicts of Interest

The authors declare no conflict of interest.

References

  1. CEPA. Pipeline Watercourse Management Program; Canadian Energy Pipeline Association: Calgary, AB, Canada, 2013. [Google Scholar]
  2. Sumer, B.M.; Fredsøe, J. Hydrodynamics around Cylindrical Structures; World Scientific Publishing Company: Singapore, 1997. [Google Scholar]
  3. Lei, C.; Cheng, L.; Kavanagh, K. Re-examination of the effect of a plane boundary on force and vortex shedding of a circular cylinder. J. Wind Eng. Ind. Aerod. 1999, 80, 263–286. [Google Scholar] [CrossRef]
  4. Aristodemo, F.; Tomasicchio, G.R.; Veltri, P. New model to determine forces at on-bottom slender pipelines. Coast. Eng. J. 2011, 58, 267–280. [Google Scholar] [CrossRef]
  5. Bearman, P.W.; Zdravkovich, M.M. Flow around a circular cylinder near a plane boundary. J. Fluid Mech. 1978, 89, 33–47. [Google Scholar] [CrossRef]
  6. Angrilli, F.; Bergamaschi, S.; Cossalter, V. Investigation of wall induced modifications to vortex shedding from a circular cylinder. J. Fluids Eng. 1982, 104, 518–522. [Google Scholar] [CrossRef]
  7. Zdravkovich, M.M. Forces on a circular cylinder near a plane wall. Appl. Ocean Res. 1985, 7, 197–201. [Google Scholar] [CrossRef]
  8. Buresti, G.; Lanciotti, A. Mean and fluctuating forces on a circular cylinder in cross-flow near a plane surface. J. Wind Eng. Ind. Aerod. 1992, 41, 639–650. [Google Scholar] [CrossRef]
  9. ASCE/SEI (ASCE/Structural Engineering Institute). Minimum Design Loads and Associated Criteria for Buildings and Other Structures; ASCE/SEI 7-16; ASCE/SEI: Reston, VA, USA, 2017; pp. 25–50. [Google Scholar]
  10. Li, C.W.; Lin, P.A. Numerical study of three-dimensional wave interaction with a square cylinder. J. Ocean Eng. 2001, 28, 1545–1555. [Google Scholar] [CrossRef]
  11. Sundar, V.; Vengatesan, V.; Anandkumar, G.; Schlenkhoff, A. Hydrodynamic coefficients for inclined cylinders. Ocean Eng. J. 1998, 25, 277–294. [Google Scholar] [CrossRef]
  12. Qi, Z.X.; Eames, I.; Johnson, E.A. Force acting on a square cylinder fixed in a free surface channel flow. J. Fluid Mech. 2014, 756, 716–727. [Google Scholar] [CrossRef]
  13. Nouri, Y.; Nistor, I.; Palermo, D. Experimental investigation of tsunami impact on free standing structures. Coast. Eng. J. 2010, 52, 43–70. [Google Scholar] [CrossRef]
  14. Arnason, H. Interactions between an Incident Bore and a Free-Standing Coastal Structure. Ph.D. Thesis, University of Washington, Seattle, WA, USA, 2005. [Google Scholar]
  15. Al-Faesly, T.; Palermo, D.; Nistor, I.; Cornett, A. Experimental modelling of extreme hydrodynamic forces on structural models. Int. J. Prot. Struct. 2012, 3, 477–506. [Google Scholar] [CrossRef]
  16. Bremm, G.C.; Goseberg, N.; Schlurmann, T.; Nistor, I. Long wave flow interaction with a single square structure on a sloping beach. J. Mar. Sci. Eng. 2015, 3, 821–844. [Google Scholar] [CrossRef]
  17. Foster, A.S.J.; Rossetto, T.; Allsop, W. An experimentally validated approach for evaluating tsunami inundation forces on rectangular buildings. Coast. Eng. J. 2017, 128, 44–57. [Google Scholar] [CrossRef]
  18. Aristodemo, F.; Tripepi, G.; Meringolo, D.D.; Veltri, P. Solitary wave-induced forces on horizontal circular cylinders: Laboratory experiments and SPH simulations. Coast. Eng. J. 2017, 129, 17–35. [Google Scholar] [CrossRef]
  19. FEMA P646. Guidelines for the Design of Structures for Vertical Evacuation from Tsunamis; Federal Emergency Management Agency: Washington, DC, USA, 2012.
  20. Ramsden, J.D. Tsunamis: Forces on a Vertical Wall Caused by Long Waves, Bores, and Surges on a Dry Bed. Ph.D. Dissertation, California Institute of Technology, Pasadena, XA, USA, 1993. [Google Scholar]
  21. Palermo, D.; Nistor, I.; Al-Faesly, T.; Cornett, A. Impact of tsunami forces on structures: The University of Ottawa experience. In Proceedings of the Fifth International Tsunami Symposium, Ispra, Italy, 3–5 September 2012. [Google Scholar]
  22. Ghodoosipour, B.; Stolle, J.; Nistor, I.; Mohammadian, A.; Goseberg, N. Experimental study on extreme hydrodynamic loading on pipelines. Part 1: Flow hydrodynamics. J. Mar. Sci. Eng. 2019, 7, 251. [Google Scholar] [CrossRef]
  23. St-Germain, P.; Nistor, I.; Townsend, R.; Shibayama, T. Smoothed-particle hydrodynamics numerical modelling of structures impacted by tsunami bores. J. Waterw. Port Coast. 2013, 140, 66–81. [Google Scholar] [CrossRef]
  24. Grass, A.J.; Raven, P.W.J.; Stuart, R.J.; Bray, J.A. The influence of boundary layer velocity gradients and bed proximity on vortex shedding from free spanning pipelines. J. Energy Resour. ASME 1984, 106, 70–78. [Google Scholar] [CrossRef]
  25. Yeh, H. Design tsunami forces for onshore structures. J. Disaster Res. 2007, 2, 531–536. [Google Scholar] [CrossRef]
  26. Gupta, V.P.; Goyal, S.C. Hydrodynamic forces on bridge piers. J. Inst. Eng. Civ. Eng. Div. 1975, 56, 12–16. [Google Scholar]
  27. Li, Y.; Lin, M. Hydrodynamic coefficients induced by waves and currents for submerged circular cylinder. Procedia Eng. 2010, 4, 253–261. [Google Scholar] [CrossRef] [Green Version]
Figure 1. Schematic of the flow around a circular cylinder, showing stagnation and separation points: (a) free cylinder, and (b) cylinder near a plane boundary (adapted from Reference [3]).
Jmse 07 00262 g001
Figure 2. Experimental setting and instrument locations (unless otherwise specified, all dimensions are in m): (a) plan view, (b) side view, and (c) close view.
Jmse 07 00262 g002
Figure 3. Dry bed surge characteristics at x = 6.5 for h = 30, 40, and 50 cm: (a) water surface profile (recorded by wave gauge 3, WG3), (b) flow velocity, and (c) Froude number.
Jmse 07 00262 g003
Figure 4. Wet bed bore characteristics at x = 6.5 for h = 40 cm, where different line types correspond to different d/h values: (a) water surface profile at WG3, (b) flow velocity, and (c) Froude number.
Jmse 07 00262 g004
Figure 5. Time-history of the water level and the drag and lift force component measurements for the dry bed condition and an impoundment depth h = 40 cm: (a) water level with e/D = 0.8, (b) water level with e/D = 0.6, (c) water level with e/D = 0.3, (d) drag force time-history for e/D = 0.3, 0.6, and 0.8, (e) lift force time-history for e/D = 0.3, 0.6, and 0.8, and (f) total force for e/D = 0.3, 0.6, and 0.8.
Jmse 07 00262 g005
Figure 6. Time-history of the measured water level and force components for the dry bed condition for e/D = 0.3 and impoundment depths h = 50, 40, and 30 cm: (a) water level at WG3, (b) drag force time-history, (c) lift force time-history, and (d) total force time-history.
Jmse 07 00262 g006
Figure 7. Bore impact on the pipe for three impoundment depths: (a) h = 50 cm, (b) h = 40 cm, and (c) h = 30 cm.
Jmse 07 00262 g007
Figure 8. Time-history of the water level and force component measurements at WG1 for the wet bed condition, impoundment depth h = 40 cm, still water depth d = 8 cm, and d/h = 0.2: (a) water level for e/D = 0.8 and S/D = 0, (b) water level for e/D = 0.6 and S/D = 0.2, (c) water level for e/D = 0.3 and S/D = 0.5, (d) drag force time-history for e/D = 0.3, 0.6, and 0.8, (e) lift force time-history for e/D = 0.3, 0.6, and 0.8, and (f) total force for e/D = 0.3, 0.6, and 0.8.
Jmse 07 00262 g008
Figure 9. Time-history of the water level and force component measurements at WG3 for the wet bed condition, different d/h ratios (d/h = 0.075, 0.15, 0.2, 0.3, and 0.42), and e/D = 0.6: (a) water level, (b) drag force time-history, (c) lift force time-history, and (d) total force.
Jmse 07 00262 g009
Figure 10. Calculated resistance coefficients versus Froude numbers for all the experimental cases tested in this study.
Jmse 07 00262 g010
Figure 11. Maximum calculated lift coefficients versus Froude numbers for all the experiments conducted in this study.
Jmse 07 00262 g011
Table 1. Instruments used in the experimental program.
InstrumentManufacturer, ModelSampling RateAccuracy
Wave gauge (WG)RBR WG-50, capacitance-type300 Hz±0.002
Acoustic doppler velocimeter (ADV)Nortek, Vectrino200 Hz±1 mm/s
DynamometerInterface-6A68E300 Hz±0.04%
High-speed camera (HS)Flare 2M360-CL200 Hz-

