
The FINDING-Food Intervention: A Mixed-Methods Feasibility Study Addressing Food Insecurity


1
School of Medicine, Stanford University, Stanford, CA 94305, USA
2
College of Health Solutions, Arizona State University, Phoenix, AZ 85004, USA
*
Author to whom correspondence should be addressed.
Challenges 2023, 14(4), 43; https://doi.org/10.3390/challe14040043
Submission received: 5 October 2023
/
Revised: 24 October 2023
/
Accepted: 26 October 2023
/
Published: 28 October 2023
Abstract
:Food insecurity is an economic and social condition involving limited or uncertain access to food. The problem of food insecurity in communities is influenced by economic conditions, food deserts, and barriers to accessing healthy food. Individuals experiencing food insecurity often endure concurrent problems of financial instability, hunger, and poor mental and physical health. Public and non-profit services in the U.S., such as the federally supported Supplemental Nutrition Assistance Program (SNAP) and community food banks, provide food-related assistance to individuals who are at a high risk of experiencing food insecurity. Unfortunately, many individuals who qualify for these services still experience food insecurity due to barriers preventing them from accessing food. Effective approaches for removing barriers that prevent individuals from accessing food are needed to mitigate the increased risk of chronic disease among vulnerable populations. This study tested a novel food insecurity intervention called FINDING-Food, which stands for Frequent Informational Nudges Directing Individuals to Needed Goods. Informational nudges were used to promote food security through the removal of information barriers to accessing food. The intervention used in this mixed-methods feasibility study consisted of informational nudges in the form of weekly text messages that were sent to food pantry clients experiencing food insecurity (n = 24). The study aims were to test the efficacy and acceptability of the intervention by examining whether the informational nudges could enhance food pantry utilization, increase SNAP registration, and promote food security. Quantitative study results showed a lower prevalence of food insecurity in the intervention group than the control group at the end of the study. Qualitative findings revealed how intervention group participants who completed the study (n = 9) found the text messages to be helpful and informative. These study findings can enhance future food insecurity interventions aiming to eliminate barriers that prevent individuals who are food insecure from accessing healthy food.
Keywords:
food insecurity; food access; food assistance; food pantry; SNAP; barriers; text message; information; nudge; feasibility; intervention; mixed methods1. Introduction
Food security is essential for human wellbeing, as it comprises consistent access to enough food for an active and healthy life [1]. Individuals who struggle to become or remain food secure are considered to be food insecure due to resource deficiencies (i.e., money, transportation) that hinder their ability to obtain sufficient food [2]. Recent estimates detailing the prevalence of food insecurity indicate that greater than one in ten people residing in the U.S. experience food insecurity [3]. This approximation suggests that more than 10% of people in the U.S. struggle to regularly obtain enough healthy food to maintain a healthy lifestyle. As a social determinant of health, the public health hazards and greater societal consequences of unaddressed food insecurity are multitudinous [4]. The United Nations’ 2023 Sustainable Development Goals have (1) No Poverty, (2) Zero Hunger, and (3) Good Health and Wellbeing at the top of their list of goals [5]. Successful implementation of evidence-based approaches to preventing food insecurity could produce a prodigious progression toward the achievement of the United Nations’ Sustainable Development Goals and a perpetual promotion of food security.
The disadvantages faced by individuals who are food insecure are at risk of being exacerbated among the most vulnerable populations if this issue is not properly resolved. Health risks affiliated with food insecurity generally stem from dietary imbalances brought on by nutritional deficiencies during chronic food insecurity experiences [6]. Diet-related health problems and chronic diseases that have been correlated with food insecurity include, but are not limited to, high blood pressure [7], inflammation [8], obesity [9], type-2 diabetes [10], cardiovascular disease [11], and cancer [12]. Food insecurity has also been linked to poor mental health outcomes involving high stress levels [13], anxiety [14], depression [15], hopelessness [16], and suicidal behaviors [17]. Furthermore, food insecurity has been shown to increase the odds of unhealthy behaviors that contribute to the onset and worsening of chronic diseases, which consist of disordered eating [18], social isolation [13], physical inactivity [19], smoking [20], and alcohol and drug misuse [21].
Food insecurity experiences are often resultant of barriers that prevent people from accessing food. Typical barriers that deter people from obtaining the food necessary to be food secure include finances [22], transportation [23], skills [24], and information [25]. Research interventions have aimed to prevent and alleviate food insecurity through a variety of approaches, including the promotion of food pantry utilization [26], educational programs focused on healthy food identification and cooking skill development [27], distribution of home-delivered meals [28], vouchers for discounted fruits and vegetables [29], and produce prescription programs where doctors prescribed healthy food (i.e., fruits and vegetables) to patients who were experiencing or at risk of diet-related chronic diseases [30].
Separately, observational studies have observed how policy changes improved food security among vulnerable populations through approaches involving the expansion of Medicaid eligibility [31], enrollment in the federally funded Supplemental Nutrition Assistance Program (SNAP) [32], and the establishment of a supermarket in a food desert [33]. SNAP has been shown to alleviate food insecurity [34], so it is important to discover ways to identify individuals who are food insecure and eligible for SNAP but are not yet enrolled in SNAP, while also determining how to best nudge these individuals to access the food assistance that is readily available to them. In all, these approaches have shown to adequately address the removal of food access barriers involving finances, transportation, and skills, but no known food insecurity interventions have specifically focused on eliminating the information barriers that prevent individuals from obtaining food.
Informational nudges are an emerging intervention approach used for promoting the adoption of specific behaviors to improve health outcomes [35]. Research interventions have demonstrated success in improving behavioral and health outcomes by leveraging text messages as informational nudges to encourage targeted behaviors [36]. Text messages have been used as informational nudges to achieve health outcomes including cancer prevention, smoking cessation, weight loss, increased physical activity, decreased substance misuse, safe sex, and improved nutritional status [37]. Given the novelty of using informational nudges in food security research, we designed, tested, and modified a text message for use as an informational nudge in this present food insecurity intervention study [38].
The present study pursued the following study aims: (1) Identify whether food pantry utilization was greater among participants receiving informational nudges; (2) determine if informational nudges increased SNAP registration rates; and (3) test the extent to which informational nudges improved food security. Study hypotheses in the same order included the following: (1) Informational nudges will increase food pantry utilization; (2) informational nudges will raise SNAP registration rates; and (3) informational nudges will improve food security status. A primary objective of this research was to address a critical knowledge gap regarding the efficacy and acceptability of using informational nudges to promote food security. The intention of this intervention was to adequately inform adults experiencing food insecurity about when, where, and how they can obtain much-needed food.
2. Methods
2.1. Study Design
A mixed-methods feasibility study was conducted to test a novel food insecurity intervention called FINDING-Food, which stands for Frequent Informational Nudges Directing Individuals to Needed Goods. Phase 1 of the research, which has been previously described in detail [38], involved testing a text message to be used as an informational nudge for this food insecurity intervention. Phase 2 of the research, which entails the present study, involved a two-month food insecurity intervention that included limited efficacy testing of the intervention effect on food security and an acceptability assessment of the participants’ perceptions of the informational nudges. This research was carried out over the span of five months from November 2022 to March 2023.
The food insecurity intervention was designed to promote food security through informational nudges delivered to food pantry clients in the form of weekly text messages containing food assistance information including the name, location, and hours of operation of a local food pantry along with details about services the food pantry offers to help clients register for SNAP benefits. Limited efficacy testing of the intervention involved quantitative estimation for whether the intervention increased food pantry utilization, SNAP registration, and food security. Intervention acceptability assessments included a qualitative questionnaire that focused on intervention group participant perceptions of the food insecurity intervention [39]. The study was conducted in accordance with the Declaration of Helsinki, and the protocol was approved by a university Institutional Review Board (MOD00018982).
2.2. Theoretical Model
The theory of planned behavior (TPB) is the theoretical model that informed the design of this intervention study. In focusing on behavioral intention, the TPB was founded on the notion that health behaviors are influenced by personal beliefs, social norms, and perceived behavioral control [40]. In the context of this study, informational nudges were used to improve the perceived behavioral control of food pantry clients by equipping them with critical information concerning when, where, and how they can obtain food. Perceived behavioral control was promoted by treating food assistance information as a facilitating factor for obtaining food by using informational nudges (i.e., text messages) to communicate this critical information. The intended purpose of communicating critical food assistance information to food pantry clients was to remove informational barriers acting as inhibiting factors that were preventing these vulnerable individuals from accessing food assistance.
2.3. Setting
This study was carried out in collaboration with NourishPHX in downtown Phoenix, Arizona. As a non-profit organization, NourishPHX operates with the purpose of supporting individuals who are economically disadvantaged by providing basic needs aid that includes food, clothing, registration for financial assistance programs, financial literacy training, and various self-enrichment workshops. Although the study intervention did not occur at NourishPHX’s physical location since the informational nudges were delivered to participants via text messaging, NourishPHX was the sole setting for participant recruitment throughout the study.
2.4. Participant Sampling
Adult food pantry clients were recruited and sampled as participants in this study. Individuals who were eligible for research participation included: adults aged 18 years or older who are fluent in English, food insecure, not registered for SNAP, and had regular access to a mobile phone that can receive text messages. Study recruitment occurred at NourishPHX by placing flyers into boxes of food assembled for food pantry clients obtaining food from NourishPHX. Informational content on the flyers included written details for the opportunity to participate in a “Food Assistance Information Study” with a brief study description highlighting the potential to earn USD 20 for full study participation. Both a QR code and a website URL address were included on the flyer for interested respondents to determine their participation eligibility by completing an online screener survey via Qualtrics.
The participant screener survey contained questions concerning a respondent’s age, English language fluency, past food pantry utilization, food security, SNAP enrollment status, and mobile phone access. The exclusion criteria for this study precluded individuals from participating if they were minors, not fluent in English, food secure, registered for SNAP, or did not have access to a mobile phone. Eligible respondents who wanted to join the study after completing the screener survey proceeded to sign an online informed consent form and then continued to the online baseline survey. Participants were randomly assigned into either the intervention group or the control group immediately after completing the baseline survey by flipping a two-sided coin to place each participant into either the intervention group (heads) or the control group (tails) [41].
2.5. Intervention
Participants assigned to the intervention group received informational nudges via weekly text messages that contained details about local food assistance resources. This intervention approach was informed by a similar research intervention used in a recent study that applied informational nudges as antecedent prompts to direct vulnerable individuals to needed goods and services [42]. Participants assigned to the control group received no intervention. No-treatment control groups are ideal for testing novel interventions in feasibility research where there is uncertainty regarding whether the intervention will work [43], which was the case in this research.
The informational nudges delivered to intervention group participants included a text message that stated, “The NourishPHX food pantry is open this week Monday through Friday from 9–11 a.m. Come visit at 501 S 9th Ave, Phoenix, AZ. Ask a NourishPHX member about registering for SNAP food benefits! SNAP provides funds that can be used to buy food. Take care, The Food Assistance Information Team”. Weekly text messages have been shown to aid program retention while producing meaningful changes in targeted outcomes [44], so a total of eight text messages were sent to intervention group participants once per week for eight weeks. Text messages were sent on a fixed frequency of once per week, as intervention delivery on a fixed frequency has been shown to produce favorable intervention outcomes compared to varying frequencies [45].
2.6. Study Measures
2.6.1. Participant Characteristics
Personal biological and sociodemographic information was collected during the baseline data collection to characterize the participant sample. The participant characteristics that were measured included age, sex, race/ethnicity, education, and annual income. Age was measured with one item stating, “Please indicate your age in years”. Response options for the age item ranged from 18 to 120. Sex was assessed with one item stating, “Please indicate your biological sex”. Response options for the sex item were “Female” or “Male”. Race/Ethnicity was determined with one item stating, “Please indicate your race/ethnicity”. Response options for the race/ethnicity item were “American Indian/Alaska Native”, “Asian”, “Black”, “Hispanic/Latino”, “Native Hawaiian/Pacific Islander”, “White”, or “More Than One Race”. Education was measured with one item stating, “Please indicate your highest level of education”. Response options for the education item were “Less Than High School”, “High School Graduate”, “Some College”, “Bachelor’s Degree”, or “Graduate Degree”. Income was assessed with one item stating, “Please indicate your annual income level”. Response options for the income item were “Less than $25,000”, “$25,000 to $49,999”, “$50,000 to $74,999”, “$75,000 to $99,999”, or “$100,000 or More”.
2.6.2. Food Security
Food security was the primary outcome of this study. The Hunger Vital Sign Two-Question Screener Tool, which includes the first two items of the Adult FSSM, was used to screen for food security prior to the full baseline data collection [46]. The 10-item USDA Adult FSSM was used to measure food security in the primary study phase [47]. These 10 items include the following: “In the last 30 days, (1) I worried whether my food would run out before I got money to buy more; (2) the food that I bought just didn’t last, and I didn’t have money to get more; (3) I couldn’t afford to eat balanced meals; (4) did you or other adults in your household ever cut the size of your meals or skip meals because there wasn’t enough money for food?; (5) how often did this happen?; (6) did you ever eat less than you felt you should because there wasn’t enough money for food?; (7) were you ever hungry but didn’t eat because there wasn’t enough money for food?; (8) did you lose weight because there wasn’t enough money for food?; (9) did you ever not eat for a whole day because there wasn’t enough money for food?; (10) how often did this happen?”.
Responses provided on each of the 10 Adult FSSM items were scored as affirmative or negative. Affirmative responses to Adult FSSM items were scored one point per item, and negative responses were scored zero points. An ordinal food security variable was then created using the total Adult FSSM scores. High food security was indicated by a total score of 0, marginal food security was signified by a total score of 1 or 2, low food security was implied by a total score ranging from 3 to 5, and very low food security was suggested by a total score spanning from 6 to 10. A dichotomous food security variable was then created using the ordinal food security variable. For the dichotomous variable, high food security and marginal food security were combined as food secure, while low food security and very low food security were merged as food insecure.
2.6.3. Food Pantry Utilization and SNAP Enrollment
Food pantry utilization was another primary outcome in this study. To measure food pantry utilization, this study included one single-item measure in the baseline data collection and a separate single-item measure for data collections at mid-intervention and post-intervention. The one-item baseline food pantry utilization measure asked: “Was your recent visit to NourishPHX the first time you had ever used a food pantry to obtain food?” Response options for this item were “Yes” or “No”. Separately, the one-item measure to evaluate food pantry utilization mid-intervention and post-intervention asked: “In the last 30 days, how many times did you obtain food from a food pantry?” Response options for this item were “Zero”, “Once”, or “Twice” due to a statewide monthly limit on food pantry utilization. SNAP enrollment was another primary study outcome that was estimated with a single-item measure. The one-item SNAP enrollment measure was derived from the CDC’s National Health and Nutrition Examination Survey [48], and went as follows: “Do you or anyone in your household currently get SNAP or Food Stamps?” Response options for this item were “Yes” or “No”.
2.6.4. Intervention Acceptability
The extent to which intervention group participants perceived that the study intervention was acceptable was evaluated with a mixed-methods approach involving three closed-ended questions and one open-ended question during the post-intervention data collection. The first closed-ended question asked, “Did you read the text messages that you had received during the Food Assistance Information Study?”. A second closed-ended question asked, “Were the text messages that you had received during the Food Assistance Information Study easy to understand?”. The third closed-ended question asked, “Were the text messages that you had received during the Food Assistance Information Study helpful?”. Response options for the three closed-ended questions were “Yes” or “No”. The one open-ended question stated, “In a few words, what do you think of the text messages that you had received during the Food Assistance Information Study?”.
2.7. Data Collection
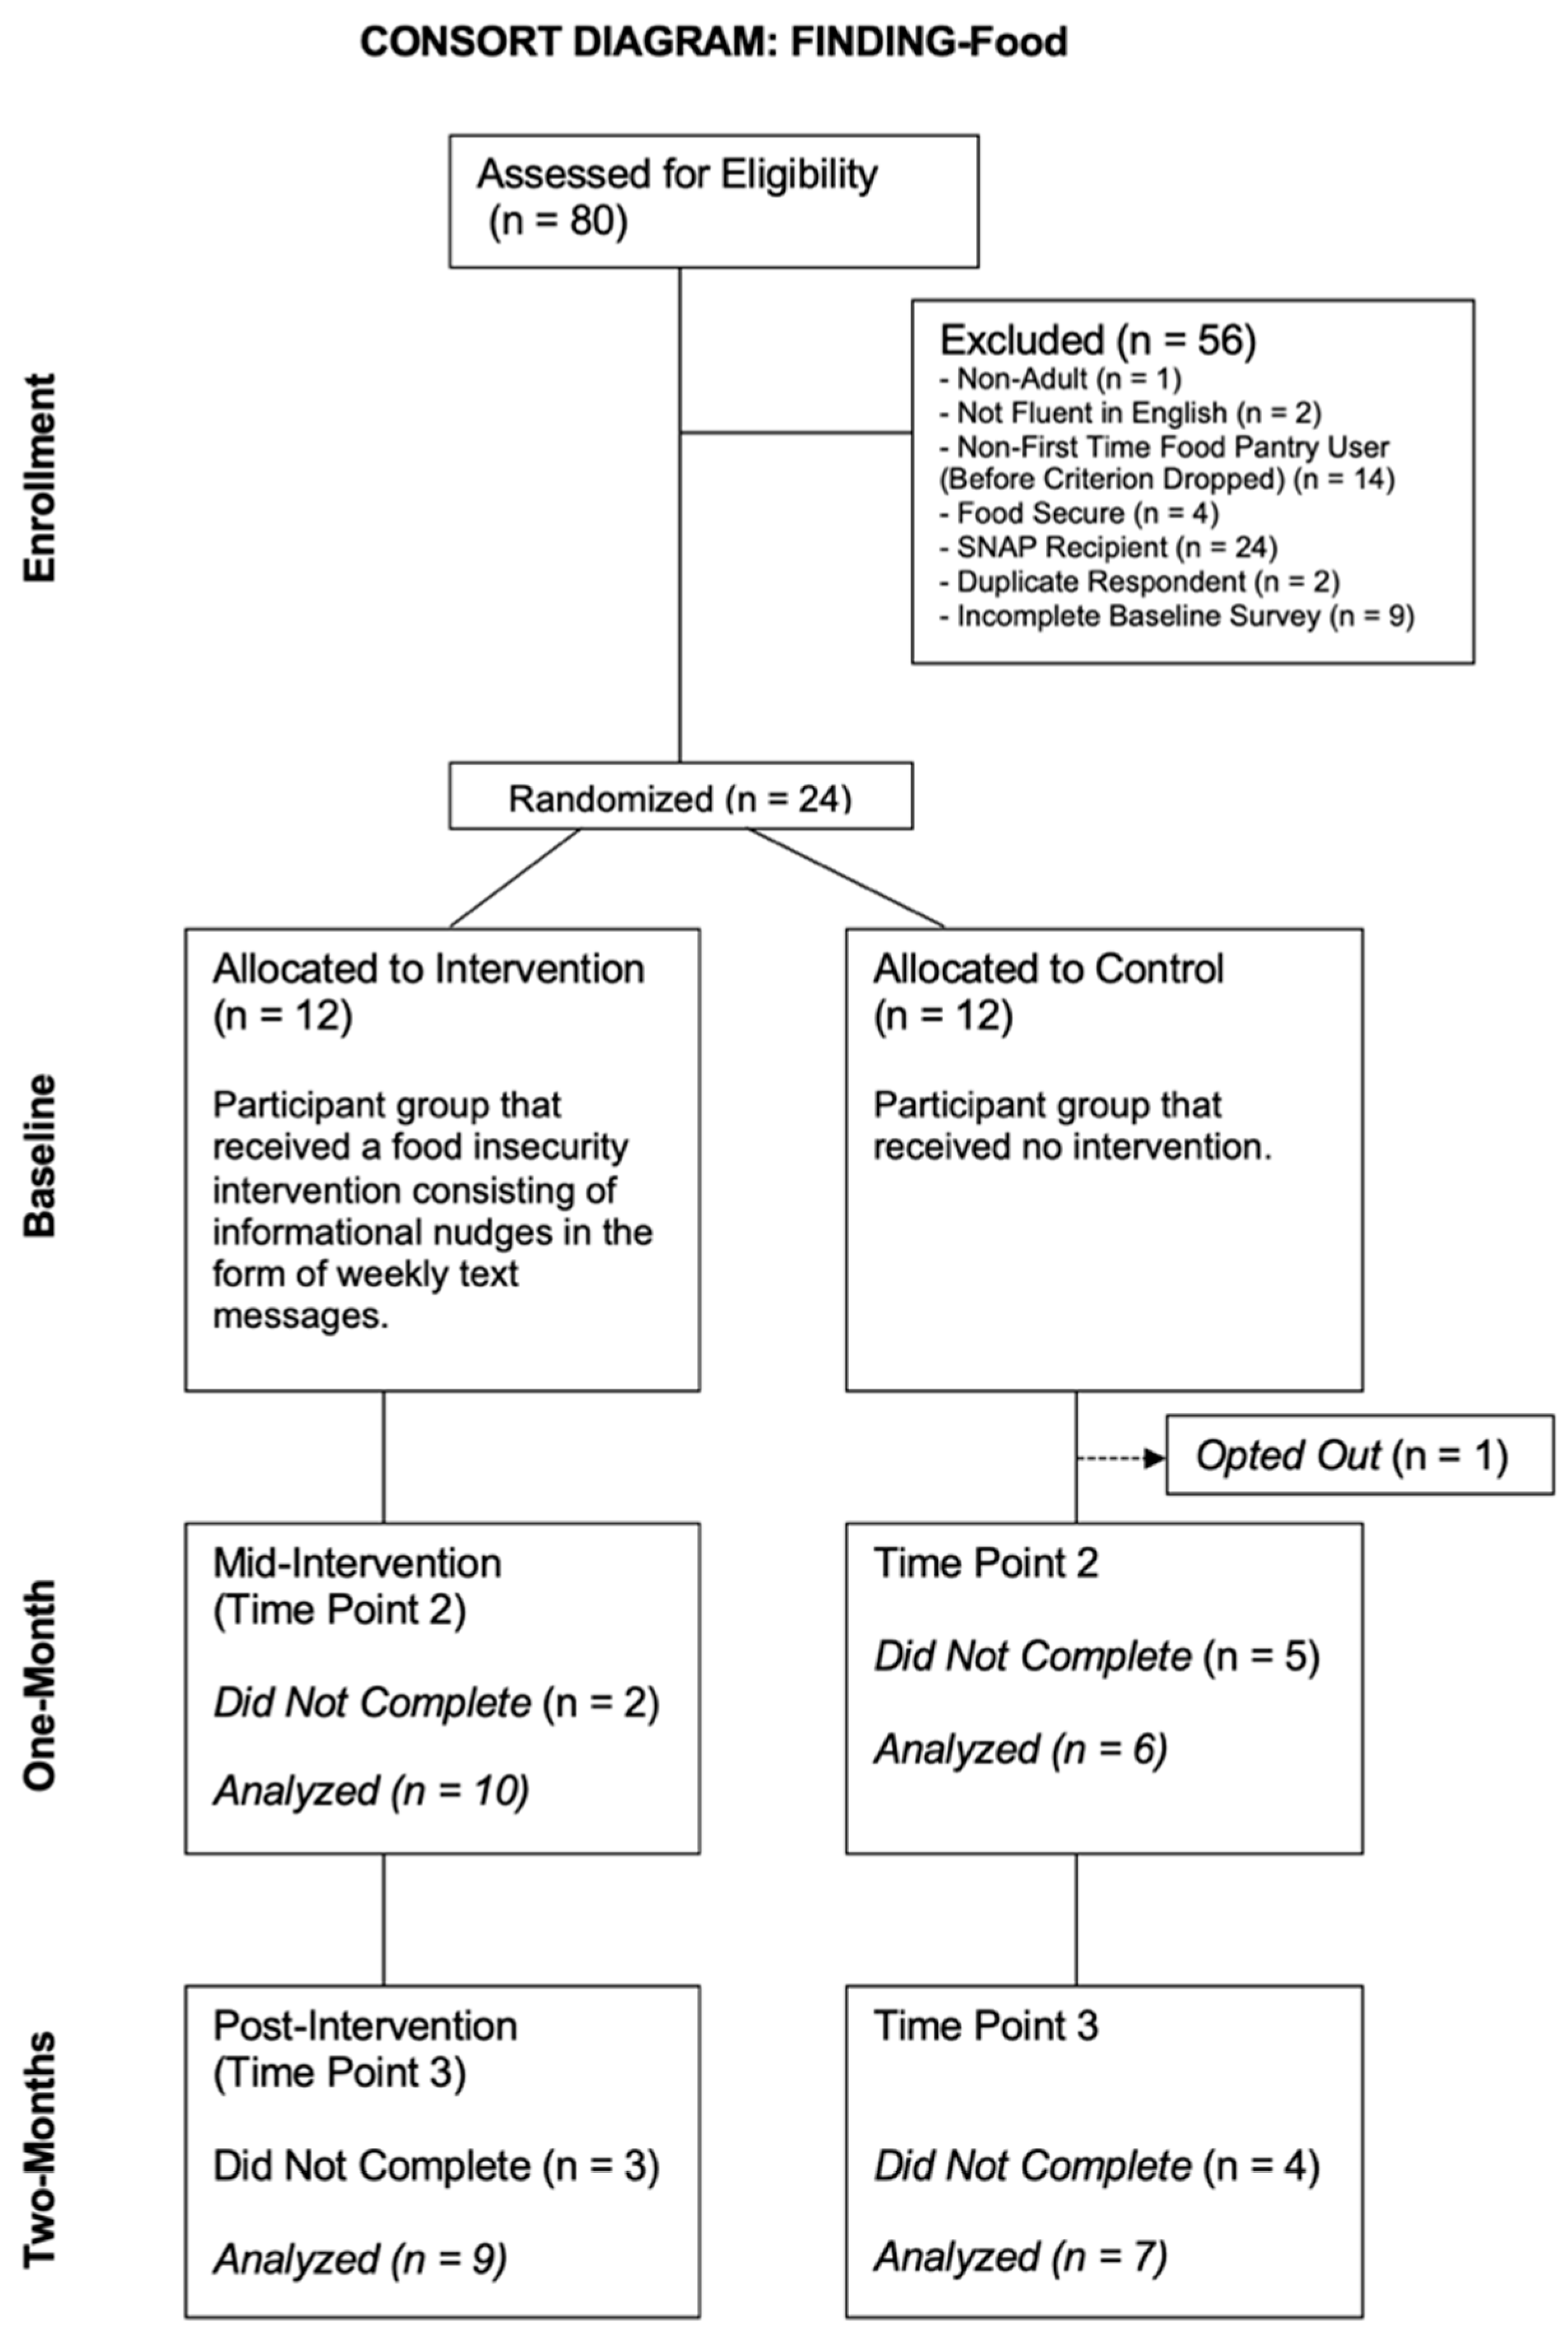
Data collections were spaced out by four weeks throughout the intervention. Participants needed two full months to complete all three data collections. Approximately 6750 study recruitment flyers were distributed into food boxes. A total of 80 individuals responded to the screener survey, which yielded a 1% response rate (Figure 1).
At baseline, 24 eligible respondents became research participants. After completing the baseline survey, participants were then assigned to either the intervention group (n = 12) or the control group (n = 12). By the data collection at one month following the baseline survey, eight participants were lost to follow-up (intervention n = 2; control n = 6), and 16 participants remained present in the study (intervention n = 10; control n = 6). At the final data collection at two months after the baseline survey, an additional intervention group participant was lost to follow-up and one control group participant rejoined and began participating again, while 16 participants remained (intervention n = 9; control n = 7).
Data collections for all three study time points were conducted online via Qualtrics. The primary outcome variables for which quantitative data were collected during all three timepoints included food security, SNAP enrollment, and food pantry utilization. Quantitative covariate data that were collected at baseline involved participant characteristics including age, biological sex, race/ethnicity, education, and income. Mixed-methods data that described whether the participants were accepting of the study intervention were collected at post-intervention and then organized and coded as quantitative or qualitative data.
2.8. Statistical Analysis
Study data were analyzed using SPSS 28.0 [49]. Descriptive statistics were calculated to determine the mean averages, standard deviations, and percentages of the primary outcome variables between the intervention group and the control group across the three study time points. Bivariate regression analyses determined whether participants with missing data differed from participants with no missing data on group status and baseline values of food pantry utilization and food security scores. The impact of missing data on study outcomes was assessed using bivariate regression to test the significance of the relationship between missing data and primary outcomes at baseline [50].
Effect sizes were determined using Cohen’s d for mean differences or Cohen’s h for proportion differences to estimate the effect size of the intervention on food pantry utilization, SNAP registration, and food security at mid-intervention and post-intervention. Findings from similar intervention studies were used to estimate the effect size of informational nudges on food pantry utilization, SNAP enrollment, and food security. The expected effect size of the intervention is approximately 0.27, which is a small-to-medium-sized effect [51]. This effect size was partially determined by a meta-analysis of 16 food insecurity intervention studies which estimated that, on average, using food assistance to promote food security was associated with a 0.53 (95% CI = 0.36, 0.77) reduced odds in food insecurity [52]. Calculating the log of odds ratio of 0.53 produced an estimated effect size coefficient of −0.28. Results from a separate meta-analysis of 35 intervention studies using text message-based informational nudges also influenced the expected effect size, as it was estimated that the average effect of the informational nudges on various behavioral health outcomes was 0.24 (95% CI = 0.16, 0.32) [37].
Cohen’s d was calculated to determine the effect size of the intervention for primary study aim 3 by comparing mean differences in food security scores (aim 3) at one month and two months [51]. Cohen’s h was calculated to estimate the effect size of the intervention for primary aim 1, primary aim 2, and primary aim 3 by comparing between-group differences in the proportion of participants who had recently utilized a food pantry prior to one month and two months (aim 1), those who recently enrolled in SNAP before one month and two months (aim 2), and those who were food insecure at one month and two months (aim 3) [51]. Cohen’s parameter values were followed to determine whether the size of the effect is small (0.14), medium (0.39), or large (0.59) [51].
Independent samples t-tests and pairwise comparisons of mean average and proportion differences were calculated to compare outcomes in food pantry utilization, SNAP registration, and food security between the intervention group and control group at one month and two months. The initial independent t-tests and pairwise comparisons were performed with bivariate regression to assess between-groups differences in outcomes at one month and two months without statistically adjusting for covariates. Adjusted independent t-tests were then conducted with multivariable regression models that statistically adjusted for covariates including baseline values of the primary outcome covariates and the participant characteristics of age, sex, race/ethnicity, education, and income.
3. Results
3.1. Limited Efficacy Testing
Descriptive statistics (Table 1) from baseline showed that food pantry clients (n = 24) enrolled in the study were an average age of 35.9 (SD = 15.1) years old, and a majority of participants were female (66.7%), Hispanic/Latino (41.7%), had an annual income of less than USD 25,000 (75%), and reported high school being their highest completed education (50%).
Results from the bivariate logistic regression and linear regression analyses that assessed the impact of participant attrition on primary study outcomes revealed a non-significant relationship between attrition and study group status (B = −0.267, SE = 0.21; p = 0.22), food pantry utilization (B = 0.11, SE = 0.21; p = 0.61), and food security scores (B = 1.33, SE = 1.05; p = 0.22). No significant differences were detected between participants with full data (n = 15) and participants with missing data (n = 9) concerning study group status, food pantry utilization, and food security scores. Similar bivariate regression analyses were not conducted for the primary study outcomes of SNAP registration and food security status, as all participants at baseline were food insecure and not enrolled in SNAP.
Effect size estimates and mean differences (Table 2) using Cohen’s d for mean differences or Cohen’s h for proportion differences display the primary study outcomes of food pantry utilization, SNAP enrollment, and food security at one month (mid-intervention time point 2) and at two months (post-intervention time point 3).
At baseline, 33% of the intervention group (n = 12) and 44% of the control group (n = 12) had previously utilized a food pantry. Then, at one month, participants who reported no visits to the food pantry comprised 10% of the intervention group and 16.7% of the control group, participants who reported one visit to a food pantry comprised 30% of the intervention group and 16.7% of the control group, and participants who reported two visits to a food pantry comprised 60% of the intervention group and 66.6% of the control group. It was determined that the intervention had a small effect on food pantry utilization from baseline to time point two (h = 0.21). At two months, participants who reported no visits to the food pantry comprised 22.2% of the intervention group and 14.7% of the control group, participants who reported one visit to a food pantry comprised 11.1% of the intervention group and 14.7% of the control group, and participants who reported two visits to a food pantry comprised 66.7% of the intervention group and 70.6% of the control group. It was estimated that the intervention maintained a small effect on food pantry utilization from baseline to two months (h = 0.18).
Since no participants were registered for SNAP at baseline, effect size calculations to estimate the effect of the intervention on SNAP registration were only conducted for outcomes at time points 2 and 3. At one month, no intervention group participants were registered for SNAP, while 17% of the control group was registered for SNAP. A large intervention effect on SNAP registration at one month was estimated (Cohen’s h = 0.85), but the effect was in the opposite direction of what was intended, as SNAP registration was greater in the control group than the intervention group. The SNAP registration rate at two months remained at zero for the intervention group and increased to 29% of the control group. A very large intervention effect on SNAP registration was estimated at two months (Cohen’s h = 1.14), which remained in the unintended direction of fewer intervention group participants registering for SNAP than control group participants.
Mean food security scores (Figure 2) at baseline were 7.92 (SD = 2.43) for the intervention group (n = 12) and 8.42 (SD = 2.71) for the control group (n = 12). At one month, mean food security scores were 6.60 (SD = 3.17) for the intervention group (n = 10) and 7.67 (SD = 2.86) for the control group (n = 6). A medium intervention effect on food security scores was estimated at one month (Cohen’s d = 0.35). At two months, the mean food security score was 5.56 (SD = 3.97) for the intervention group (n = 9) and 8.00 (SD = 2.77) for the control group (n = 7). A large intervention effect on food security scores was estimated at two months (Cohen’s d = 0.71). Since all participants were classified as food insecure at baseline, bivariate analyses to determine between-group differences in food security status were only conducted for time points 2 and 3. At one month, 80% of the intervention group was food insecure, and 100% of the control group was food insecure. A very large intervention effect on food security status was estimated at one month (Cohen’s h = 0.93). At two months, 56% of the intervention group was food insecure, while 100% of the control group was food insecure. Similarly, a very large intervention effect on food security status was estimated again at two months (Cohen’s h = 1.45).
Independent samples t-scores and group differences in study outcome means or proportions were estimated with bivariate and multivariable regression models (Table 3), which compared results for food pantry utilization, SNAP registration, and food security between the intervention group and control group at one month and two months. Food pantry utilization results suggested that no significant between-groups differences existed for food pantry utilization at one month (t = 0, p = 1; D = 0, SE = 0.39, 95% CI = −0.84, 0.84), and these findings stayed consistent after adjusting for covariates (t = −0.32, p = 0.76; D = 0.24, SE = 0.32, 95% CI = −0.49, 0.97). Further food pantry utilization findings indicated that no significant differences existed between study groups at two months (t = −0.29, p = 0.77; D = 0.13, SE = 0.43, 95% CI = −1.04, 0.78), which continued after adjusting for covariates (t = −0.40, p = 0.70; D = 0.11, SE = 0.54, 95% CI = −1.12, 1.35). Therefore, study aim 1 was not achieved, as no significant increases in food pantry utilization were achieved.
SNAP registration outcomes implied that no significant differences were present between study groups at one month (t = −1.00, p = 0.36; D = −0.17, SE = 0.17, 95% CI = −0.56, 0.26). After adjusting for covariates, a significant difference in SNAP registration was detected between the intervention group and the control group (t = −2.63, p = 0.02; D = −0.34, SE = 0.15, 95% CI = −0.66, −0.10), which underscored how a greater proportion of control group participants registered for SNAP than intervention participants. Additional SNAP registration results suggested no significant between-groups differences in SNAP registration at two months (t = −1.56, p = 0.17; D = −0.29, SE = 0.18, 95% CI = −0.74, 0.17), and these non-significant findings persisted after adjusting for covariates (t = −2.12, p = 0.05; D = −0.41, SE = 0.22, 95% CI = −0.91, 0.09). Therefore, study aim 2 was not achieved since no significant increases in SNAP registration were accomplished.
Food security score findings indicated that no significant differences existed between study groups at one month (t = −0.67, p = 0.51; D = −1.07, SE = 1.58, 95% CI = −4.46, 2.33), and non-significant outcomes remained after adjusting for covariates (t = −0.40, p = 0.69; D = −1.50, SE = 0.96, 95% CI = −3.71, 0.70). Further food security score outcomes revealed no significant between-groups differences at two months (t = −1.45, p = 0.17; D = −2.44, SE = 1.69, 95% CI = −6.07, 1.18), which continued to be non-significant after adjusting for covariates (t = −0.81, p = 0.43; D = −1.21, SE = 1.32, 95% CI = −4.25, 1.84).
Results for food security status specified no significant differences between study groups at one month (t = −1.15, p = 0.27; D = −0.20, SE = 0.18, 95% CI = 0.57, −0.17), which stayed consistent after adjusting for covariates (t = −0.71, p = 0.48; D = −0.18, SE = 0.29, 95% CI = −0.48, 0.84). Further findings highlighted a significant difference in food security status between the intervention group and the control group at two months (t = −2.21, p = 0.04; D = −0.44, SE = 0.20, 95% CI = −0.85, −0.01). Non-significant between-groups differences in food security status at two months were then detected after adjusting for covariates (t = −1.28, p = 0.21; D = −0.19, SE = 0.26, 95% CI = −0.77, 0.40). Given these results for food security score and food security status, study aim 3 was achieved since food security was improved in the intervention group when compared with the control group.
3.2. Intervention Acceptability
Of the initial 12 participants who were randomly assigned to the intervention group, nine participants (n = 9) completed the study and answered four questions about the perceived acceptability of the text messages used as informational nudges for the food insecurity intervention. The first question asked participants, “Did you read the text messages that you had received during the Food Assistance Information Study?” Eight participants indicated “Yes” to this question, while one participant responded with “No”. The second question asked, “Were the text messages that you had received during the Food Assistance Information Study easy to understand?” Similarly, eight participants reported “Yes” to this question, and the same one participant responded with “No”. The third question then asked, “Were the text messages that you had received during the Food Assistance Information Study helpful?” Again, eight participants indicated “Yes” to this question, and the same one participant responded with “No”. The fourth and final question that intervention group participants responded to involving the perceived acceptability of the intervention was an open-ended query that asked, “In a few words, what do you think of the text messages that you had received during the Food Assistance Information Study?” Four themes emerged as a result of participant responses. The qualitative themes derived from responses to the open-ended question were the following: (1) Unread, (2) Friendly, (3) Helpful, and (4) Informative.
The Unread theme was established from a single response by Participant 4. The response by Participant 4 stated, “I did not read any texts regarding the food study. I didn’t have time. Sorry”. Likewise, the Friendly theme was informed by a single response by Participant 3. The response by Participant 3 stated, “UX (user experience) friendly”. The Helpful theme was produced by responses from the three following participants: Participant 6, Participant 8, and Participant 23. In reference to the perception of the intervention text messages, Participant 6 concisely stated, “Very helpful”. Participant 8 added by commenting, “It was very helpful to help me understand everything I need to know for for (sic) this program”. Participant 23 simply remarked, “Helpful”. The Informative theme was constructed from responses provided by the four following participants: Participant 12, Participant 13, Participant 15, and Participant 17. Regarding the perception of the intervention text messages, Participant 12 stated, “I think they were very informative”. Similar responses were provided by participants 15 and 17, as Participant 15 remarked, “It is very informative”, while Participant 17 commented, “Very informative”. The most frequent theme that occurred throughout the qualitative data collection process was the Informative theme (n = 4), which was closely followed by the Helpful them (n = 3). The Unread (n = 1) and Friendly (n = 1) themes were established as outlier themes with no other comparable qualitative data to group them with.
4. Discussion
This research involved a feasibility study that included assessments of the limited efficacy and acceptability of using informational nudges (e.g., text messages) as a novel food insecurity intervention geared toward raising food pantry utilization, increasing SNAP registration, and promoting food security among food pantry clients who were food insecure. Testing of the text message used as an informational nudge occurred in research phase 1 [38], which produced the text message that was used in the food insecurity intervention in this research phase 2. The intervention showed no effect on food pantry utilization and it was found that, surprisingly, the intervention group had lower rates of SNAP registration compared to the control group. There were encouraging study outcomes for food security, as mean food security scores in the intervention group decreased over time, which suggested improved food security throughout the study. This finding was supported by the reduced prevalence of food insecurity in the intervention group over the two-month research process. Overall, the informational nudges used as a food insecurity intervention showed potential in alleviating food insecurity.
This research added to the growing collection of food pantry-based intervention studies that were designed with the intention of promoting food security among individuals experiencing food insecurity [26]. Outcomes from this research study help to reinforce previous findings from previous intervention studies that were successful in alleviating food insecurity among food pantry clients [53]. This study also made a meaningful contribution to the collection of scientific literature on informational nudges, as successful outcomes from previous intervention studies using informational nudges were supported by this study having been successful in improving food security [37]. Moreover, a novel contribution was made to the field of food insecurity research through an innovative application of informational nudges that were developed with the intention of promoting food security by targeting and removing information barriers that could have been preventing individuals who were food insecure from knowing how to access healthy food.
Another potential explanation for the small intervention effect on food pantry utilization is a history effect, which is a threat to the internal validity of the estimated intervention effect that results from unmeasured changes in the circumstances of participants [41]. There was not a study feature that tracked emerging barriers or sources of support among participants in both study groups throughout the duration of the study. Accessing food pantries lowers the odds of severe food insecurity [53], so it is still necessary to determine how to best nudge individuals experiencing food insecurity to make the most of the food assistance that local food pantries offer. Given the limited number of monthly visits that individuals are allotted to food assistance entities within the Arizona Food Bank Network, a food insecurity intervention like the one used in this study may be best suited for individuals who are food insecure and have never obtained food from a food pantry and/or do not know of any food pantries in their community where they can access food.
The non-existent impact that the intervention had on SNAP registration among participants in the intervention group produced a seemingly negative relationship between the intervention and registering for SNAP. Throughout the study, no individuals assigned to the intervention group registered for SNAP, while two individuals in the control group registered for SNAP. These outcomes were especially unanticipated since an inclusion criterion to join this study required that participants were not registered for SNAP at baseline.
A reason why none of the intervention group participants registered for SNAP throughout the study could have been due to participants being able-bodied adults without dependents (ABAWDs). According to the Arizona Department of Economic Security, ABAWDs between the ages of 18 and 49 years old are limited to three months of SNAP benefits in a three-year period if they are not working at least 80 h a month or an average of 20 h per week [54]. Four intervention group participants were exempt from the ABAWD work requirement due to being 50 years of age or older, so there could have been other explanations for them not registering for SNAP, including earning too high of a gross or net annual income, possessing assets that combine to be worth a high value, being a non-citizen of the United States, or some other unknown reasons [55]. Because food insecurity is related to chronic disease [56] and can be alleviated through SNAP benefits [34], it is important to discover ways to identify individuals who are food insecure and eligible for SNAP but are not yet enrolled in SNAP, while also determining how to best nudge these individuals to access the food assistance that is readily available to them.
Promoting food security among individuals who were food insecure was the ultimate goal of this research. All participants were food insecure upon joining the study, and just over half of the participants in the intervention group were still food insecure at two months into the study while the entire control group remained food insecure throughout the duration of the research. A potential reason for the precipitous decline in food insecurity prevalence among the intervention group could that the informational nudges helped address an information barrier that had previously prevented participants from consistently knowing how to access food [25,57,58].
Food security-related outcomes from this study support the notion that information related to food assistance is critical for preventing or alleviating food insecurity. Results derived from the limited efficacy testing process in this study highlighted how the food security status of intervention group participants improved over time despite food pantry utilization and SNAP registration remaining unchanged. These findings also add to the growing field of literature that elucidates how informational nudges can be leveraged to improve health behaviors [37,59,60] and health outcomes [61,62,63].
The marked decrease in food insecurity prevalence in the intervention group warrants further testing of this intervention so that it may be applied among a larger sample of individuals who are food insecure. Food security scores and food insecurity prevalence were both reduced over time, but the small sample size that was recruited for this feasibility study produced large standard deviations in the food security outcomes, which may have been responsible for the non-significant food security score findings despite food insecurity scores having been lower in the intervention group for both within-groups and between-groups comparisons at each consecutive time point [64].
The food insecurity intervention used in this study was deemed to be acceptable for the research sample, as a large majority of intervention group participants read the text messages, reported that the text messages were easy to understand, and found the text messages to be helpful. The high frequency at which responses aligned with the intervention being perceived as helpful and informative provided reassurance that the informational nudge testing that occurred at phase one of the study produced an acceptable informational nudge that was ultimately well-received by the intervention group. Having “informative” be the most common theme to arise in participant responses was a good sign that the text message carried out part of its intended purpose of informing individuals experiencing food insecurity about how they can access food. Overall, the high level of intervention acceptability communicated by participants suggested that it would be appropriate to reapply this informational nudge intervention among a similar target population with a larger sample size.
Strengths and Limitations
This study contained many strengths in its design and implementation. First, this research addressed a critical knowledge gap through feasibility research methods that allowed for an initial understanding to be gained concerning the extent to which a novel food insecurity intervention using informational nudges in the form of text messages improved food security over time. Second, a majority non-White sample was recruited for this study that allowed for a diverse array of perspectives to be communicated concerning whether participants perceived the intervention to be acceptable, as having a variety of races and ethnicities represented in the participant sample was critical for determining whether perceptions of the intervention differed across participants. Third, the random assignment of the participants to study groups strengthened the validity of the study findings by randomly distributing confounding variables that impair the accuracy of the intervention effect between the intervention group and the control group. Fourth, the longitudinal design of this study was equipped to track changes in the primary study outcomes of food pantry utilization, SNAP enrollment, and food security status over time so that alterations in these outcomes could be examined from before the intervention was implemented throughout the duration of the two-month intervention period. Fifth, the large effect size of the intervention on food security provided noteworthy findings worthy of replication in future research studies that have adequate statistical power to detect a significant intervention effect without sample size being an issue.
There were also several limitations in this study. First, the participant recruitment approach of placing flyers into boxes of donated food was a useful yet insufficient means of recruiting participants, as the response rate for this approach was just above 1%. In hindsight, a multifaceted approach to participant recruitment should have been executed that was not limited to placing flyers into food boxes. Second, the inclusion criteria that required participants to be able to speak and read English prevented a large contingent of food pantry clients from joining the study, as many individuals who visited the food pantry to obtain food only spoke Spanish. For equity purposes, a Spanish version of the flyer advertisement and study surveys were needed to promote food security among non-English speaking individuals who otherwise would have been eligible to join the study. Third, outcomes that resulted from the limited efficacy testing of the intervention effects on the primary study outcomes must be interpreted with caution, as this study did not have adequate statistical power for the quantitative study findings for the intervention to be translated as accurate effect size estimates due to the small sample size of research participants. Although the recruitment of a small sample was intentional in this feasibility study so as to not potentially waste resources while conducting a research intervention for which there was no certainty of a beneficial outcome [39], the statistical power drawbacks of recruiting a small sample still foster warranted skepticism about the legitimacy of any statistically significant study findings. Fourth, the inclusion criterion that required study participants to have regular access to a mobile phone that can receive text messages undoubtedly prevented some of the most vulnerable individuals experiencing the most severe cases of food insecurity from joining the study. Those suffering from the most extreme forms of economic hardship and food insecurity are unlikely to be able to afford a mobile phone let alone a monthly cellphone plan that includes text messaging. Fifth, the survey-based nature of this research study consisted entirely of self-report approaches to data collection. Relying wholly on self-report data collection approaches potentially introduced biases that involve answering questions according to perceived researcher expectancies or social desirability [41]. Sixth, participant attrition throughout the duration of the study resulted in missing data that could have helped provide research findings of greater accuracy. Despite that all available data were analyzed regardless of missingness, the disadvantageous incidences of missing data that arose from participants dropping out of the study caused an unanticipated absence of important information.
5. Conclusions
This feasibility study was a valuable research endeavor that successfully examined the limited efficacy and acceptability of a novel food insecurity intervention that used text messages as informational nudges to communicate critical food assistance information to individuals experiencing food insecurity. Evidence derived from the study indicated that a food insecurity intervention using informational nudges in the form of text messages showed signs of success in promoting food security among food pantry clients who were food insecure. Despite the small sample size recruited for this research, findings provided evidence to justify scaling this food insecurity intervention to test whether the effect of the intervention on food security can be replicated in a study with a larger sample size of individuals experiencing food insecurity. It is critical that a greater priority be placed on preventing the problem of food insecurity, and eliminating barriers to food access is essential for mitigating this problem. Successful promotion of food security will enhance public health through the prevention of chronic diseases that result from poor diet, nutritional deficiencies, and hunger.
Author Contributions
Conceptualization, M.F.R. and C.W.; Methodology, M.F.R. and C.W.; Resources, M.F.R. and C.W.; Project Administration, M.F.R.; Supervision, C.W.; Investigation, M.F.R.; Data Curation, M.F.R.; Formal Analysis, M.F.R.; Writing—Original Draft Preparation, M.F.R.; Writing—Review and Editing, M.F.R. and C.W. All authors have read and agreed to the published version of the manuscript.
Funding
This research received no external funding.
Data Availability Statement
The data presented in this study are available on request from the corresponding author.
Acknowledgments
We thank the entire NourishPHX organization for their collaboration with us on this project.
Conflicts of Interest
The authors declare no conflict of interest.
References
- United States Department of Agriculture (USDA). Food Security in the U.S. Available online: https://www.ers.usda.gov/topics/food-nutrition-assistance/food-security-in-the-u-s/#:~:text=Food%20security%20means%20access%20by,in%20U.S.%20households%20and%20communities (accessed on 4 September 2023).
- Coleman-Jensen, A.; Rabbitt, M.P.; Hashad, R.M.; Hales, L.; Gregory, C.A. Definitions of Food Security: Ranges of Food Security and Food Insecurity. United States Department of Agriculture, Economic Research Service. 2022. Available online: https://www.ers.usda.gov/topics/food-nutrition-assistance/food-security-in-the-us/definitions-of-food-security.aspx (accessed on 4 September 2023).
- Coleman-Jensen, A.; Hales, L.; Food Security in the United States: Trends in U.S. Food Security. Economic Research Report—United States Department of Agriculture, Economic Research Service. 2022. Available online: https://www.ers.usda.gov/topics/food-nutrition-assistance/food-security-in-the-u-s/interactive-charts-and-highlights/#trends (accessed on 4 September 2023).
- Sharareh, N.; Adesoba, T.P.; Wallace, A.S.; Bybee, S.; Potter, L.N.; Seligman, H.; Wilson, F.A. Associations between food insecurity and other social risk factors among US adults. J. Gen. Intern. Med. 2023, 1–9. [Google Scholar]
- United Nations—Department of Economic and Social Affairs. Sustainable Development: The 17 Goals. Available online: https://sdgs.un.org/goals (accessed on 4 September 2023).
- Bhattacharya, J.; Currie, J.; Haider, S. Poverty, food insecurity, and nutritional outcomes in children and adults. J. Health Econ. 2004, 23, 839–862. [Google Scholar] [CrossRef] [PubMed]
- Weigel, M.M.; Armijos, R.X. Food insecurity, Cardiometabolic health, and health care in US-Mexico border immigrant adults: An exploratory study. J. Immigr. Minor. Health 2019, 21, 1085–1094. [Google Scholar] [CrossRef] [PubMed]
- Gowda, C.; Hadley, C.; Aiello, A.E. The association between food insecurity and inflammation in the US adult population. Am. J. Public Health 2012, 102, 1579–1586. [Google Scholar] [CrossRef] [PubMed]
- Pan, L.; Sherry, B.; Njai, R.; Blanck, H.M. Food insecurity is associated with obesity among US adults in 12 states. J. Acad. Nutr. Diet. 2012, 112, 1403–1409. [Google Scholar] [CrossRef] [PubMed]
- Strings, S.; Ranchod, Y.K.; Laraia, B.; Nuru-Jeter, A. Race and sex differences in the association between food insecurity and type 2 diabetes. Ethn. Dis. 2016, 26, 427. [Google Scholar] [CrossRef] [PubMed]
- Sun, Y.; Liu, B.; Rong, S.; Du, Y.; Xu, G.; Snetselaar, L.G.; Wallace, R.B.; Bao, W. Food insecurity is associated with cardiovascular and all-cause mortality among adults in the United States. J. Am. Heart Assoc. 2020, 9, e014629. [Google Scholar] [CrossRef]
- Gany, F.; Lee, T.; Ramirez, J.; Massie, D.; Moran, A.; Crist, M.; McNish, T.; Winkel, G.; Leng, J.C. Do our patients have enough to eat? Food insecurity among urban low-income cancer patients. J. Health Care Poor Underserved 2014, 25, 1153. [Google Scholar] [CrossRef]
- Martin, M.S.; Maddocks, E.; Chen, Y.; Gilman, S.E.; Colman, I. Food insecurity and mental illness: Disproportionate impacts in the context of perceived stress and social isolation. Public Health 2016, 132, 86–91. [Google Scholar] [CrossRef]
- Wolfson, J.A.; Garcia, T.; Leung, C.W. Food insecurity is associated with depression, anxiety, and stress: Evidence from the early days of the COVID-19 pandemic in the United States. Health Equity 2021, 5, 64–71. [Google Scholar] [CrossRef]
- Leung, C.W.; Epel, E.S.; Willett, W.C.; Rimm, E.B.; Laraia, B.A. Household food insecurity is positively associated with depression among low-income supplemental nutrition assistance program participants and income-eligible nonparticipants. J. Nutr. 2015, 145, 622–627. [Google Scholar] [CrossRef]
- Martinez, S.M.; Frongillo, E.A.; Leung, C.; Ritchie, L. No food for thought: Food insecurity is related to poor mental health and lower academic performance among students in California’s public university system. J. Health Psychol. 2020, 25, 1930–1939. [Google Scholar] [CrossRef] [PubMed]
- Pryor, L.; Lioret, S.; Van Der Waerden, J.; Fombonne, É.; Falissard, B.; Melchior, M. Food insecurity and mental health problems among a community sample of young adults. Soc. Psychiatry Psychiatr. Epidemiol. 2016, 51, 1073–1081. [Google Scholar] [CrossRef] [PubMed]
- Royer, M.F.; Ojinnaka, C.O.; Bruening, M. Food insecurity is related to disordered eating behaviors among college students. J. Nutr. Educ. Behav. 2021, 53, 951–956. [Google Scholar] [CrossRef]
- To, Q.G.; Frongillo, E.A.; Gallegos, D.; Moore, J.B. Household food insecurity is associated with less physical activity among children and adults in the US population. J. Nutr. 2014, 144, 1797–1802. [Google Scholar] [CrossRef]
- Bergmans, R.S.; Coughlin, L.; Wilson, T.; Malecki, K. Cross-sectional associations of food insecurity with smoking cigarettes and heavy alcohol use in a population-based sample of adults. Drug Alcohol Depend. 2019, 205, 107646. [Google Scholar] [CrossRef] [PubMed]
- Nagata, J.M.; Palar, K.; Gooding, H.C.; Garber, A.K.; Tabler, J.L.; Whittle, H.J.; Bibbins-Domingo, K.; Weiser, S.D. Food insecurity, sexual risk, and substance use in young adults. J. Adolesc. Health 2021, 68, 169–177. [Google Scholar] [CrossRef] [PubMed]
- Gundersen, C. Food insecurity is an ongoing national concern. Adv. Nutr. 2013, 4, 36–41. [Google Scholar] [CrossRef] [PubMed]
- Strome, S.; Johns, T.; Scicchitano, M.J.; Shelnutt, K. Elements of access: The effects of food outlet proximity, transportation, and realized access on fresh fruit and vegetable consumption in food deserts. Int. Q. Community Health Educ. 2016, 37, 61–70. [Google Scholar] [CrossRef] [PubMed]
- Begley, A.; Paynter, E.; Butcher, L.M.; Dhaliwal, S.S. Examining the association between food literacy and food insecurity. Nutrients 2019, 11, 445. [Google Scholar] [CrossRef]
- Fong, K.; Wright, R.A.; Wimer, C. The cost of free assistance: Why low-income individuals do not access food pantries. J. Soc. Soc. Welf. 2016, 43, 71. [Google Scholar] [CrossRef]
- An, R.; Wang, J.; Liu, J.; Shen, J.; Loehmer, E.; McCaffrey, J. A systematic review of food pantry-based interventions in the USA. Public Health Nutr. 2019, 22, 1704–1716. [Google Scholar] [CrossRef] [PubMed]
- Rivera, R.L.; Maulding, M.K.; Abbott, A.R.; Craig, B.A.; Eicher-Miller, H.A. SNAP-Ed (Supplemental Nutrition Assistance Program–Education) increases long-term food security among Indiana households with children in a randomized controlled study. J. Nutr. 2016, 146, 2375–2382. [Google Scholar] [CrossRef]
- Lee, J.S.; Johnson, M.A.; Brown, A. Older Americans act nutrition program improves participants’ food security in Georgia. J. Nutr. Gerontol. Geriatr. 2011, 30, 122–139. [Google Scholar] [CrossRef] [PubMed]
- Durward, C.M.; Savoie-Roskos, M.; Atoloye, A.; Isabella, P.; Jewkes, M.D.; Ralls, B.; Riggs, K.; LeBlanc, H. Double Up Food Bucks participation is associated with increased fruit and vegetable consumption and food security among low-income adults. J. Nutr. Educ. Behav. 2019, 51, 342–347. [Google Scholar] [CrossRef] [PubMed]
- Aiyer, J.N.; Raber, M.; Bello, R.S.; Brewster, A.; Caballero, E.; Chennisi, C.; Durand, C.; Galindez, M.; Oestman, K.; Saifuddin, M. A pilot food prescription program promotes produce intake and decreases food insecurity. Transl. Behav. Med. 2019, 9, 922–930. [Google Scholar] [CrossRef]
- Himmelstein, G. Effect of the Affordable Care Act’s Medicaid expansions on food security, 2010–2016. Am. J. Public Health 2019, 109, 1243–1248. [Google Scholar] [CrossRef]
- Ratcliffe, C.; McKernan, S.-M.; Zhang, S. How much does the Supplemental Nutrition Assistance Program reduce food insecurity? Am. J. Agric. Econ. 2011, 93, 1082–1098. [Google Scholar] [CrossRef]
- Richardson, A.S.; Ghosh-Dastidar, M.; Beckman, R.; Flórez, K.R.; DeSantis, A.; Collins, R.L.; Dubowitz, T. Can the introduction of a full-service supermarket in a food desert improve residents’ economic status and health? Ann. Epidemiol. 2017, 27, 771–776. [Google Scholar] [CrossRef]
- Nord, M. How much does the Supplemental Nutrition Assistance Program alleviate food insecurity? Evidence from recent programme leavers. Public Health Nutr. 2012, 15, 811–817. [Google Scholar] [CrossRef]
- Ledderer, L.; Kjær, M.; Madsen, E.K.; Busch, J.; Fage-Butler, A. Nudging in public health lifestyle interventions: A systematic literature review and metasynthesis. Health Educ. Behav. 2020, 47, 749–764. [Google Scholar] [CrossRef]
- Fjeldsoe, B.S.; Marshall, A.L.; Miller, Y.D. Behavior change interventions delivered by mobile telephone short-message service. Am. J. Prev. Med. 2009, 36, 165–173. [Google Scholar] [CrossRef]
- Armanasco, A.A.; Miller, Y.D.; Fjeldsoe, B.S.; Marshall, A.L. Preventive health behavior change text message interventions: A meta-analysis. Am. J. Prev. Med. 2017, 52, 391–402. [Google Scholar] [CrossRef] [PubMed]
- Royer, M.F.; Wharton, C. The Design and Testing of a Text Message for Use as an Informational Nudge in a Novel Food Insecurity Intervention. Challenges 2023, 14, 40. [Google Scholar] [CrossRef]
- Bowen, D.J.; Kreuter, M.; Spring, B.; Cofta-Woerpel, L.; Linnan, L.; Weiner, D.; Bakken, S.; Kaplan, C.P.; Squiers, L.; Fabrizio, C. How we design feasibility studies. Am. J. Prev. Med. 2009, 36, 452–457. [Google Scholar] [CrossRef]
- Ajzen, I. Perceived behavioral control, self-efficacy, locus of control, and the theory of planned behavior 1. J. Appl. Soc. Psychol. 2002, 32, 665–683. [Google Scholar] [CrossRef]
- Shadish, W.R.; Cook, T.D.; Campbell, D.T. Experimental and Quasi-Experimental Designs for Generalized Causal Inference; Mifflin and Company: Houghton, MI, USA, 2002. [Google Scholar]
- Goldrick-Rab, S.; Clark, K.; Baker-Smith, C.; Witherspoon, C. Supporting the Whole Community College Student: The Impact of Nudging for Basic Needs Security; Hope Center for College, Community, and Justice: Philadelphia, PA, USA, 2021. [Google Scholar]
- Freedland, K.E.; King, A.C.; Ambrosius, W.T.; Mayo-Wilson, E.; Mohr, D.C.; Czajkowski, S.M.; Thabane, L.; Collins, L.M.; Rebok, G.W.; Treweek, S.P. The selection of comparators for randomized controlled trials of health-related behavioral interventions: Recommendations of an NIH expert panel. J. Clin. Epidemiol. 2019, 110, 74–81. [Google Scholar] [CrossRef] [PubMed]
- Hall, A.K.; Cole-Lewis, H.; Bernhardt, J.M. Mobile text messaging for health: A systematic review of reviews. Annu. Rev. Public Health 2015, 36, 393. [Google Scholar] [CrossRef]
- Spohr, S.A.; Nandy, R.; Gandhiraj, D.; Vemulapalli, A.; Anne, S.; Walters, S.T. Efficacy of SMS text message interventions for smoking cessation: A meta-analysis. J. Subst. Abus. Treat. 2015, 56, 1–10. [Google Scholar] [CrossRef]
- Economic Research Service (ERS). U.S. Household Food Security Survey Module. United States Dep. Agric. (USDA). 2012. Available online: https://www.ers.usda.gov/media/8271/hh2012.pdf (accessed on 4 September 2023).
- Makelarski, J.A.; Abramsohn, E.; Benjamin, J.H.; Du, S.; Lindau, S.T. Diagnostic accuracy of two food insecurity screeners recommended for use in health care settings. Am. J. Public Health 2017, 107, 1812–1817. [Google Scholar] [CrossRef]
- Centers for Disease Control and Prevention (CDC). National Health and Nutrition Examination Survey (2021–2022). In Natl. Cent. Health Stat.; 2022. Available online: https://www.cdc.gov/nchs/nhanes/index.htm (accessed on 27 October 2023).
- IBM Corp. IBM SPSS Statistics for Macintosh, 28.0; IBM Corp: Armonk, NY, USA, 2021. [Google Scholar]
- Baraldi, A.N.; Enders, C.K. An introduction to modern missing data analyses. J. Sch. Psychol. 2010, 48, 5–37. [Google Scholar] [CrossRef]
- Cohen, J. Statistical Power Analysis for the Behavioral Sciences; Academic Press: Cambridge, MA, USA, 2013. [Google Scholar]
- Oronce, C.I.A.; Miake-Lye, I.M.; Begashaw, M.M.; Booth, M.; Shrank, W.H.; Shekelle, P.G. Interventions to Address Food Insecurity among Adults in Canada and the US: A Systematic Review and Meta-Analysis; American Medical Association: Chicago, IL, USA, 2021; p. e212001.
- Roncarolo, F.; Bisset, S.; Potvin, L. Short-term effects of traditional and alternative community interventions to address food insecurity. PLoS ONE 2016, 11, e0150250. [Google Scholar] [CrossRef]
- Arizona Department of Economic Security. How to Apply for Nutrition Assistance. Available online: https://des.az.gov/how-to-apply-snap#:~:text=Able%2Dbodied%20adults%20without%20dependents%20(ABAWDs)%20are%20only%20eligible,in%20the%20SNA%20E%26T%20program (accessed on 4 September 2023).
- Center on Budget and Policy Priorities. A Quick Guide to SNAP Eligibility and Benefits. Available online: https://www.cbpp.org/research/food-assistance/a-quick-guide-to-snap-eligibility-and-benefits (accessed on 4 September 2023).
- Gregory, C.A.; Coleman-Jensen, A. Food Insecurity, Chronic Disease, and Health among Working-Age Adults; Economic Research Service, United States Department of Agriculture: Washington, DC, USA, 2017.
- Ramadurai, V.; Sharf, B.F.; Sharkey, J.R. Rural food insecurity in the United States as an overlooked site of struggle in health communication. Health Commun. 2012, 27, 794–805. [Google Scholar] [CrossRef]
- El Zein, A.; Mathews, A.E.; House, L.; Shelnutt, K.P. Why are hungry college students not seeking help? Predictors of and barriers to using an on-campus food pantry. Nutrients 2018, 10, 1163. [Google Scholar] [CrossRef] [PubMed]
- Arno, A.; Thomas, S. The efficacy of nudge theory strategies in influencing adult dietary behaviour: A systematic review and meta-analysis. BMC Public Health 2016, 16, 1–11. [Google Scholar] [CrossRef]
- Head, K.J.; Noar, S.M.; Iannarino, N.T.; Harrington, N.G. Efficacy of text messaging-based interventions for health promotion: A meta-analysis. Soc. Sci. Med. 2013, 97, 41–48. [Google Scholar] [CrossRef]
- Hurling, R.; Catt, M.; De Boni, M.; Fairley, B.; Hurst, T.; Murray, P.; Richardson, A.; Sodhi, J. Using internet and mobile phone technology to deliver an automated physical activity program: Randomized controlled trial. J. Med. Internet Res. 2007, 9, e633. [Google Scholar] [CrossRef] [PubMed]
- Siopis, G.; Chey, T.; Allman-Farinelli, M. A systematic review and meta-analysis of interventions for weight management using text messaging. J. Hum. Nutr. Diet. 2015, 28, 1–15. [Google Scholar] [CrossRef] [PubMed]
- Donaldson, E.; Fallows, S.; Morris, M. A text message based weight management intervention for overweight adults. J. Hum. Nutr. Diet. 2014, 27, 90–97. [Google Scholar] [CrossRef]
- Altman, D.G.; Bland, J.M. Standard deviations and standard errors. BMJ 2005, 331, 903. [Google Scholar] [CrossRef]
Figure 1.
Consort Diagram.

Figure 2.
Between-Groups Mean Differences for Food Security Score Over Time. a Baseline n = 24 (12 Intervention and 12 Control); One Month n = 16 (10 Intervention and 6 Control); Two Months n = 16 (9 Intervention and 7 Control).
Figure 2.
Between-Groups Mean Differences for Food Security Score Over Time. a Baseline n = 24 (12 Intervention and 12 Control); One Month n = 16 (10 Intervention and 6 Control); Two Months n = 16 (9 Intervention and 7 Control).


Table 1.
Participant Characteristics of Food Pantry Clients across Three Time Points.
| Characteristics | T1 Total (%) | T2 Total (%) | T3 Total (%) |
|---|---|---|---|
| Sample size | 24 | 16 | 16 |
| Age (Years) | M = 35.9 SD = 15.1 | M = 39.9 SD = 16.1 | M = 37.8 SD = 15.2 |
| Sex | |||
| Female | 16 (66.7) | 12 (80) | 11 (73.3) |
| Male | 8 (33.3) | 4 (20) | 5 (26.7) |
| Race/Ethnicity | |||
| Black | 6 (25) | 3 (18.75) | 4 (25) |
| Hispanic/Latino | 10 (41.7) | 5 (31.25) | 5 (31.25) |
| White | 5 (20.8) | 5 (31.25) | 4 (25) |
| More Than One Race | 3 (12.5) | 3 (18.75) | 1 (18.75) |
| Income | |||
| <USD 25,000 | 18 (75) | 12 (75) | 11 (68.75) |
| ≥USD 25,000 | 6 (25) | 4 (25) | 5 (31.25) |
| Education | |||
| Less Than High School | 3 (12.5) | 1 (6.25) | 1 (6.25) |
| High School Graduate | 12 (50) | 6 (37.5) | 6 (37.5) |
| Some College | 8 (33.3) | 8 (50) | 8 (50) |
| College Graduate | 1 (4.2) | 1 (6.25) | 1 (6.25) |
| Group Status | |||
| Intervention | 12 (50) | 10 (62.5) | 9 (56.25) |
| Control | 12 (50 | 6 (37.5) | 7 (43.75) |
| Food Security Score | M = 8.2, SD = 2.5 | ||
| Past Food Pantry Use | |||
| No | 15 (62.5) | ||
| Yes | 9 (37.5) |
M = Mean; SD = Standard Deviation; T1 = Time Point 1 at Baseline; T2 = Time Point 2 at One Month; T3 = Time Point 3 at Two Months.
Table 2.
Descriptive Statistics and Effect Size Estimates of the Intervention on Food Pantry Utilization, SNAP Registration, and Food Security.
Table 2.
Descriptive Statistics and Effect Size Estimates of the Intervention on Food Pantry Utilization, SNAP Registration, and Food Security.
| Outcome | Time Point | Intervention | Control | Effect |
|---|---|---|---|---|
| Food Pantry | ||||
| Baseline | 33% Past Use | 44% Past Use | ||
| One Month | h = 0.21 | |||
| 10% No Visits | 16.7% No Visits | |||
| 30% One Visit | 16.7% One Visit | |||
| 60% Two Visits | 66.6% Two Visits | |||
| Two Months | h = 0.18 | |||
| 22.2% No Visits | 14.7% No Visits | |||
| 11.1% One Visit | 14.7% One Visit | |||
| 66.7% Two Visits | 70.6% Two Visits | |||
| SNAP | ||||
| Baseline | 0% Registered | 0% Registered | - | |
| One Month | 0% Registered | 17% Registered | h = 0.85 | |
| Two Months | 0% Registered | 29% Registered | h = 1.14 | |
| FS Score | ||||
| Baseline | M = 7.9 SD = 2.4 | M = 8.4 SD = 2.7 | ||
| One Month | M = 6.6 SD = 3.2 | M = 7.7 SD = 2.9 | d = 0.35 | |
| Two Months | M = 5.6 SD = 4.0 | M = 8.0 SD = 2.8 | d = 0.71 | |
| FS Status | ||||
| Baseline | 100% Food Insecure | 100% Food Insecure | - | |
| One Month | 80% Food Insecure | 100% Food Insecure | h = 0.93 | |
| Two Months | 56% Food Insecure | 100% Food Insecure | h = 1.45 |
Baseline n = 24 (12 Intervention and 12 Control); One Month n = 16 (10 Intervention and 6 Control); Two Months n = 16 (9 Intervention and 7 Control); d = Cohen’s d Effect Size; h = Cohen’s h Effect Size; FS = Food Security; M = Mean; SD = Standard Deviation; At baseline, eligible participants could not be registered for SNAP and had to be food insecure.
Table 3.
Independent Samples t-Tests and Mean Difference Comparisons for the Intervention Effect on Food Pantry Utilization, SNAP Registration, and Food Security.
Table 3.
Independent Samples t-Tests and Mean Difference Comparisons for the Intervention Effect on Food Pantry Utilization, SNAP Registration, and Food Security.
| Outcome | Mean Difference (SE) | 95% CI | t-Score | p-Value |
|---|---|---|---|---|
| Food Pantry | ||||
| Unadjusted | ||||
| One Month | D = 0.00, SE = 0.39 | −0.84, 0.84 | t = 0.0 | p = 1 |
| Two Months | D = −0.13, SE = 0.43 | −1.04, 0.78 | t = −0.29 | p = 0.77 |
| Adjusted | ||||
| One Month | D = −0.24, SE = 0.32 | −0.97, 0.49 | t = −0.32 | p = 0.76 |
| Two Months | D = −0.11, SE = 0.54 | −1.35, 1.12 | t = −0.40 | p = 0.70 |
| SNAP | ||||
| Unadjusted | ||||
| One Month | D = −0.17, SE = 0.17 | −0.56, 0.26 | t = −1.00 | p = 0.36 |
| Two Months | D = −0.29, SE = 0.18 | −0.74, 0.17 | t = −1.56 | p = 0.17 |
| Adjusted | ||||
| One Month | D = −0.34, SE = 0.15 | −0.66, −0.10 | t = −2.63 | p = 0.02 |
| Two Months | D = −0.41, SE = 0.22 | −0.91, 0.09 | t = −2.12 | p = 0.05 |
| FS Score | ||||
| Unadjusted | ||||
| One Month | D = −1.07, SE = 1.58 | −4.46, 2.33 | t = −0.67 | p = 0.51 |
| Two Months | D = −2.44, SE = 1.69 | −6.07, 1.18 | t = −1.45 | p = 0.17 |
| Adjusted | ||||
| One Month | D = −1.50, SE = 0.96 | −3.71, 0.70 | t = −0.40 | p = 0.69 |
| Two Months | D = −1.21, SE = 1.32 | −4.25, 1.84 | t = −0.81 | p = 0.43 |
| FS Status | ||||
| Unadjusted | ||||
| One Month | D = −0.20, SE = 0.18 | 0.57, −0.17 | t = −1.15 | p = 0.27 |
| Two Months | D = −0.44, SE = 0.20 | −0.85, −0.01 | t = −2.21 | p = 0.04 |
| Adjusted | ||||
| One Month | D = −0.18, SE = 0.29 | −0.48, 0.84 | t = −0.71 | p = 0.48 |
| Two Months | D = −0.19, SE = 0.26 | −0.77, 0.40 | t = −1.28 | p = 0.21 |
Baseline n = 24 (12 Intervention and 12 Control); One Month n = 16 (10 Intervention and 6 Control); Two Months n = 16 (9 Intervention and 7 Control); CI = Confidence Interval; D = Mean Difference; SE = Standard Error; Unadjusted models analyzed between-groups mean differences in primary outcomes. Adjusted models analyzed between-groups mean differences in the primary outcomes adjusted for covariates including baseline primary outcome values and the participant characteristics of sex, race/ethnicity, income, and education.
Disclaimer/Publisher’s Note: The statements, opinions and data contained in all publications are solely those of the individual author(s) and contributor(s) and not of MDPI and/or the editor(s). MDPI and/or the editor(s) disclaim responsibility for any injury to people or property resulting from any ideas, methods, instructions or products referred to in the content. |
© 2023 by the authors. Licensee MDPI, Basel, Switzerland. This article is an open access article distributed under the terms and conditions of the Creative Commons Attribution (CC BY) license (https://creativecommons.org/licenses/by/4.0/).
Share and Cite
MDPI and ACS Style
Royer, M.F.; Wharton, C. The FINDING-Food Intervention: A Mixed-Methods Feasibility Study Addressing Food Insecurity. Challenges 2023, 14, 43. https://doi.org/10.3390/challe14040043
AMA Style
Royer MF, Wharton C. The FINDING-Food Intervention: A Mixed-Methods Feasibility Study Addressing Food Insecurity. Challenges. 2023; 14(4):43. https://doi.org/10.3390/challe14040043
Chicago/Turabian StyleRoyer, Michael F., and Christopher Wharton. 2023. "The FINDING-Food Intervention: A Mixed-Methods Feasibility Study Addressing Food Insecurity" Challenges 14, no. 4: 43. https://doi.org/10.3390/challe14040043
Note that from the first issue of 2016, this journal uses article numbers instead of page numbers. See further details here.