1. Introduction
The majority of modern motorized transportation options are: (a) not energy efficient; (b) claim too much space in cities; and (c) emit large amounts of greenhouse gases. Modern transportation requires various possibilities, where users can combine various commute options. By allowing users to intelligently and consciously make combinations, energy efficiency can be increased, and travel expenses as well as exhaustion of greenhouse gases reduced.
A new era in city transportation is needed, whereby designing, developing and optimizing technologies for the promotion of EVs will make them attractive for citizens to buy and use also far from the city. This new era must bring in new EV technology and prove their advantages in everyday life.
1.1. Obstacles to Overcome
While the rollout of EVs and charging infrastructure is still in its early uptake, a window of opportunity is available to influence the choice of technologies that will be used in the years to come and which should unleash the full potential of EVs. A number of studies have already demonstrated that the EV has a potential that goes beyond the function of transportation. The numerous European EV projects that have been carried out through recent years can roughly be divided into those that focus on field tests and infrastructure rollout and those which have been focused relatively more on the grid side, backend systems and simplified market aspect. Some of the problems that need to be solved are:
- •
Light weight and high cost of the battery storage system
The battery for all types of electric vehicles is in the range of about 20%–30% of the vehicle weight and about 30%–40% of the vehicle costs. The technology development of next generation battery technologies is slow and has seen a couple of drawbacks within the last years, especially Lithium-Sulphur batteries and lithium-air batteries. On the other hand, most users drive only about 20% of the possible range per day and therefore the battery is oversized in this case (cost weight). With a flexible and modular battery design, the daily usage of the storage can be significantly increased. However, if a longer trip is necessary, additional modules can be rented or bought at the suggested charging stations. The plug and play light weight concept would allow a fast and simple adaptation in the future.
- •
Massive battery integration and system response
Currently, transportation, since it is almost solely based on internal combustion engines, cannot be integrated within the electric power grid. The system today in most of the countries has little or no flexibility and no practical response in integrating a vehicle to grid (V2G) or the other way around grid to vehicle (G2V) applications. Furthermore, infrastructure is limited and significant efforts will be needed to create an important network. A flexible and modular battery design will enable totally new business concepts for transportation and will give the opportunity to establish services to support this concept.
1.2. Concept and Approach
It is estimated that 80 million cars were produced in 2012 alone, while in 1997 the car production was approximately 50 million units. Considering that a citizen keeps a car approximately for 7 to 10 years, it is evident that the number of vehicles will keep expanding exponentially to satisfy the consumers’ needs. Numerous methods have been employed in cities worldwide in order to reduce the use of private car traffic. An example is limited and expensive parking. Another example is a congestion fee, where drivers are charged for driving through city centers at the most heavy flowing traffic times. The promotion of EVs that could also cover greater distances seems a good solution not only to cover larger distances inside the city but to leave the urban environment without the range restriction.
Several concepts have been tried in the past following this route but have not been successful as the new vehicles contained modifications related only to their powertrain and battery usage. The idea of mass development and construction of wind based EV charging stations shall create space for the greater evolution of EVs. The basic concept of the paper is based on the identification of windy areas, via wind resource assessment, in regional highways and the proposal—According to EV range criteria and highway usage—For the optimum number of wind based EV charging stations.
2. Literature Review
The transport sector in Europe employs around 10 million people and generates nearly 5% of the total GDP [
1]. Urban mobility has gained importance in the past few years. By 2050, nearly 70% of the global population is projected to live in urban areas, exacerbating the effects of air pollution, congestion, noise and greenhouse gas emissions [
2].
European transport is mostly dependent on oil and oil products for almost 94% of its energy needs, 84% of which is imported [
3]—In 2010 alone the oil import bill was around €210 billion for the EU [
4]. Oil reserves are becoming gradually scarcer and consequently its price increases. If production continues at the same rate, the proved oil reserves of Europe will last for about 23 years and taking into account the global reserves, for about 50 [
5]. Moreover, transportation is the second largest contributor to greenhouse gas emissions and urban air pollution, posing severe threats to human health and well-being [
6]. In spite of continuous improvements in the fuel efficiency, transport-related CO
2 emissions have increased by 32% during a 15 year period, 1990–2005 [
7]. If no action is taken, the transport sector will continue to be dependent on oil for 90% of its fleet, with renewable energy sources only at 10% and CO
2 emissions from transport would remain 1/3 higher than 1990 levels by 2050 [
1].
From the above-mentioned facts it is clear that European transport needs to diversify its energy sources in order to remain competitive and sustainable. The European Commission has focused its efforts in that direction, but a lot still needs to be done.
However, following the proposed policy for the evolvement of wind based EV charging stations, we could tackle the aforementioned problems by developing an integrated framework that could solve some of these problems or work—At least—Towards that direction. At the same time it should develop a concrete plan for (i) higher amount of renewables integration and (ii) EV growth.
A few more researchers have dealt with the planning of EV stations. Rahman
et al. [
8] presented different computational approaches and techniques used for the optimization of charging infrastructure for EVs, while Sadeghi-Barzani
et al. [
9] worked on urban roads for determining optimal location of charging stations. Schneider
et al. [
10] introduced the EV routing problem with the option of recharging at any of the available stations using an appropriate recharging scheme. Colmenar-Santos
et al. [
11] worked on the planning minimum interurban fast charging infrastructure for electric vehicles and Dashora
et al. [
12] presented a mixed integer mathematical programming tool to solve the hybrid EV charging infrastructure sitting problem in organizations with specific parking lots and charging station installations.
However, we have not seen much in the literature related to EV charging stations and much less on wind based stations. We also have not seen much on the increasing of wind integration percentage via the EV charging stations, which are grid connected. For example: how could the curtailed wind energy be more efficiently used in order to be utilized and not wasted and at the same time increase renewable energy sources integration? This study covers this scientific gap and analyses in depth.
3. Data Analysis and Calculation Methods
The need to identify the areas of high wind resources in the northeast of the Peloponnese, in Corinthia region, Greece, taking into account all environmental constraints, and at the same time roads and highways in the wider area, revealed that GIS tools were necessary. However, most importantly, before moving on with an in depth GIS analysis one must have a wind mast in the area to have an idea of wind direction and wind speed. The aim of this work is to follow the results of the analysis and to be able to propose sites for EV charging stations supported by the wind farm(s). For that reason, a wind statistical analysis of the wider area is implemented below.
3.1. Wind Site Statistical Analysis
Wind resource assessment is essential in order to identify sites with high wind speed and therefore, significant power density. For the evaluation of the winds in the north-northeast of the Peloponnese, in Corinthia, Greece, Geographic Information Systems (GIS) tools, such as the QGIS tool and its applications [
13], the Wind Atlas Analysis and Application Program (WAsP) [
14], and WindRose [
15] tools were used as wind data assessment tools, and a wind map was developed representing the wind speed at a height of 80 m above ground level in the area around the installed mast. The mast was used to carry out yearly profile wind speed and wind direction measurements. The primal outcome is a wind assessment of the wider area. Mast coordinates (coordinates in the Hellenic Geodetic Reference System 1987 (EGSA’87)), height in meters above ground level, data analysis period, and average speed, are shown in
Table 1.
Table 1.
Main measured characteristics of the wind mast.
Table 1.
Main measured characteristics of the wind mast.
| X Coordinate (EGSA’87) | Y Coordinate (EGSA’87) | Mean Speed (m·s−1) | Period of Data Analysis | Height (M.A.G.L.) | Turbulence Intensity (T.I.) at 10 m |
|---|
| 368476.0 | 4215371.0 | 5.8 at 30 m | 4 June 2008 to 4 June 2009 | 1136 | 10.1% |
The mean power density was estimated at approx. 240 W/m2 and the average wind speed at 5.8 m/s. WindRose and WAsP tools were used for processing the experiments (yearly measurements) and generate estimates of speed/energy output. Vector Hellenic Wind Farms S.A. operated a certified wind measurements laboratory and the installed mast was under the lab’s supervision. The wind was studied for one year with a tubular mast made out of steel kept in vertical position using wires. Anemometers and vanes were placed at 20 m and 30 m. A data logger connected to the available sensors on the mast stored and sent the data to Vector Hellenic Wind Farms S.A. laboratory. The uncertainty of the measured wind speed for the mast was calculated using WindRose software and found to be rather low, at 0.1121 m/s. The maximum 10-min average speed observed was 28.2 m/s and the maximum gust 55.9 m/s. The used data array was made up of the average (one value per second—600 values in 10 min) and maximum 10-min wind speed values in the site.
A preliminary statistical analysis of the measurements was useful for identifying the relationships among the examined variables. Weibull and Rayleigh probability density function analyses, which have an acceptable accuracy level of many wind resource studies in different locations [
16,
17,
18,
19,
20,
21], were used to identify the representation of the wind speed frequency curve. In the Weibull distribution, the probability density function and the cumulative distribution indicate the variation in wind velocity. The probability density function
fWei(v) is given from the following Equation:
where
k is the (dimensionless) shape parameter showing how peaked the wind distribution is, and
c is the windy (dimensionless) scale parameter. Using the Weibull probability plotting paper method,
k and
c are calculated. The distribution function is transformed into a linear pattern using logarithmic scale and since the wind velocity is equal or lower than
v, there is:
If we plot the axes ln(
v) for
x and ln{−ln[1 −
fWei(
v)]} for
y, then the Weibull distribution is a straight line, with a slope of
k and intersection −
k·ln
c. The real values of
k and
c can be found by producing the regression equation for the plotted line. It is known that for most wind conditions,
k ranges from 1.5 to 3, while
c ranges from 3 to 8 [
22]. In this case, Weibull shape is 1.65 and Weibull scale is 5.07. The results from the data and the Weibull distribution are shown in
Table 2, the Weibull shape and scale, the data distribution, the mean wind speed and the Turbulence Intensity (T.I.) at 10 m/s are shown for each direction. The total number of valid data used was 48,578 (missing data 7.8%) and the included number of calm measurements (<2 m/s) was 4925.
Based on the analysis, what can be extracted is the wind speed average variation during the day (
Figure 1) which is required for the optimum sizing of the charging stations.
3.2. Wind Resource Assessment Results
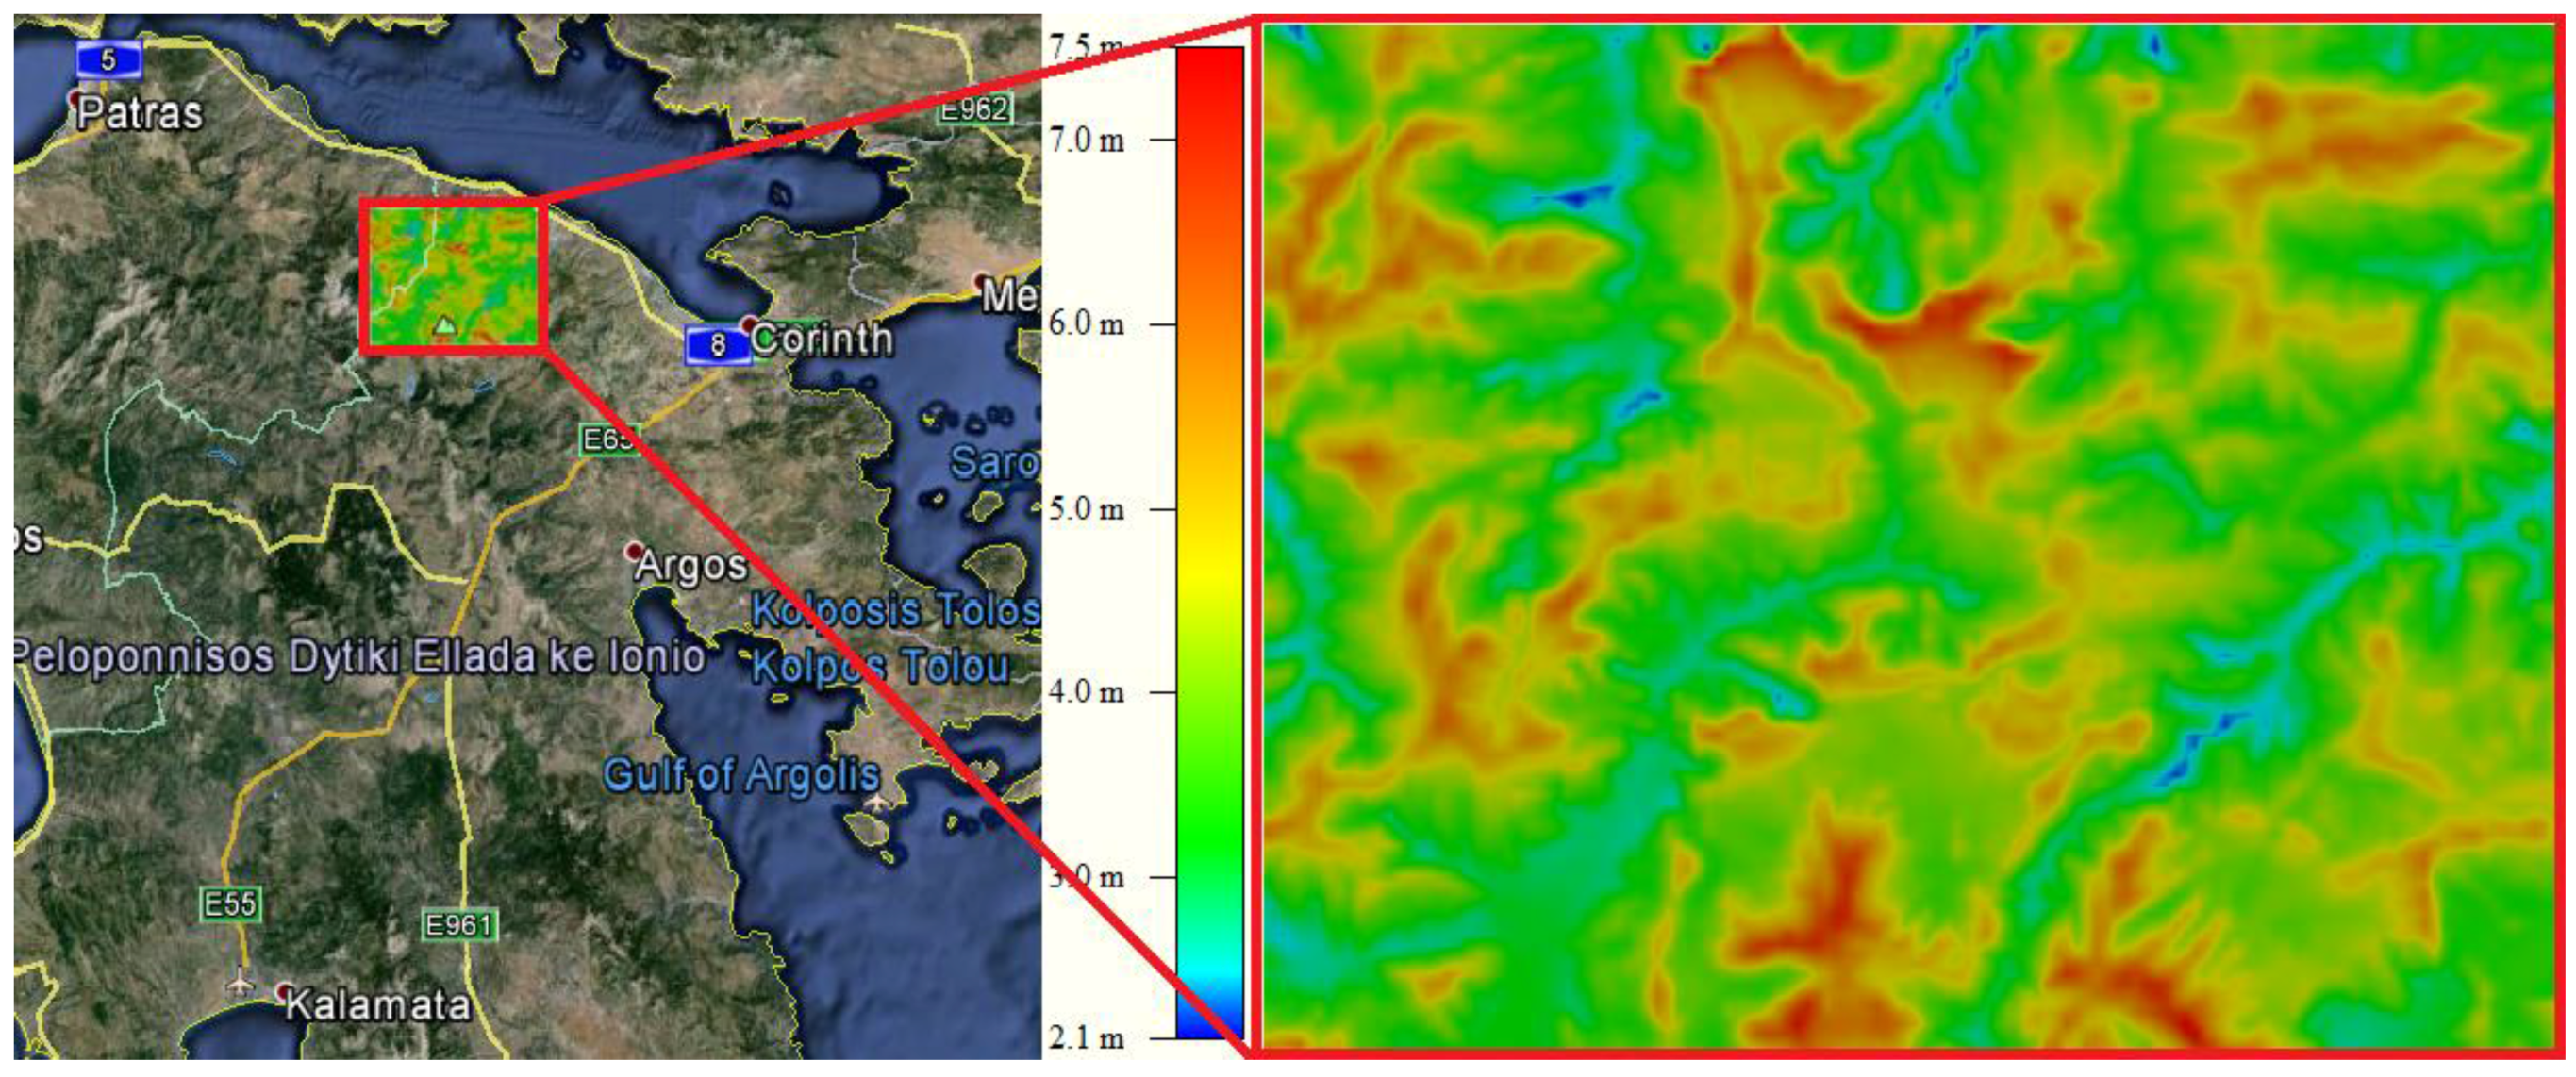
WAsP software was used to produce a wind map of the area; the estimated wind speed is visualized and different sites for wind turbines (WT) can be selected and proposed to be installed (
Figure 2).
Table 2.
Weibull distribution analysis of the mast.
Table 2.
Weibull distribution analysis of the mast.
| Direction | Angle (°) | Weibull Shape | Weibull Scale | Data Distrib. | Mean Wind Speed (m/s) | T.I. at 10 m/s |
|---|
| NNE | 11.25–33.75 | 1.98 | 6.05 | 5.76% | 5.4 | 11.4 |
| NE | 33.75–56.25 | 1.47 | 3.47 | 2.24% | 3.6 | 14.4 |
| ENE | 56.25–78.75 | 1.52 | 2.02 | 1.05% | 2.5 | |
| E | 78.75–101.25 | 2.49 | 2.69 | 1.32% | 2.5 | |
| ESE | 101.25–123.75 | 1.95 | 3.95 | 3.57% | 3.6 | 10.6 |
| SE | 123.75–146.25 | 1.44 | 5.88 | 19.81% | 5.6 | 7.9 |
| SSE | 146.25–168.75 | 0.94 | 3.66 | 6.30% | 4.4 | 9.2 |
| S | 168.75–191.25 | 1.12 | 4.12 | 2.42% | 4.2 | 14.5 |
| SSW | 191.25–213.75 | 1.31 | 5.71 | 2.47% | 5.4 | 16.6 |
| SW | 213.75–236.25 | 1.44 | 5.18 | 2.11% | 4.9 | 17.4 |
| WSW | 236.25–258.75 | 1.08 | 4.53 | 1.77% | 4.7 | 18.8 |
| W | 258.75–281.25 | 1.43 | 6.01 | 5.64% | 5.7 | 14.6 |
| WNW | 281.25–303.75 | 2.19 | 9.10 | 22.25% | 8.0 | 9.2 |
| NW | 303.75–326.25 | 2.06 | 7.00 | 9.14% | 6.2 | 11.0 |
| NNW | 326.25–348.75 | 1.88 | 5.58 | 6.66% | 5.0 | 10.4 |
| N | 348.75–11.25 | 2.02 | 6.15 | 7.49% | 5.4 | 11.6 |
Figure 1.
Wind Speed Average Variation per hour.
Figure 1.
Wind Speed Average Variation per hour.
It can be seen that there are several sites that their wind resource is at exploitable levels (e.g., wind speed > 6.0 m/s). The light blue and green areas have wind speed smaller than 4.0 m/s, yellow and light orange colored areas are 4.0–6.0 m/s, while intense orange and red are in the range of 6.0–7.5 m/s and these are the sites that attract the investors’ interest more.
Figure 2.
Wind Resource Analysis in a significant part of Corinthia region, Greece.
Figure 2.
Wind Resource Analysis in a significant part of Corinthia region, Greece.
4. Case Study Results and Discussion
4.1. Wind Energy Innovation and Promotion of EVs
Depending on each country’s EV development plan there is a certain need of promoting EVs and at the same time achieving higher amounts of wind energy integrated. Therefore, innovations and prototypes in both directions (meaning wind and EVs) are crucial. For instance, bladeless wind turbines [
23] confronts significant issues, such as the turbines increasing weight and height, the materials costs, as well as the cost of maintaining components. It seems that such cylinders (of the bladeless turbines) will not need much space, and could be installed more frequently around cities. Another significant innovation will be the large WT which will be “filled” with helium and will hover over the city of Fairbanks, Alaska, in order to produce electricity for more than 12 families living far from the grid [
24]. Micro combined heat and power (mCHPs) are also important for balancing wind energy in the modern grid systems and gain more and more interest lately in residential level [
25]. There has also been an intense interest lately about the incorporation of higher amounts of wind energy via innovative wind turbine concepts [
26], via residential storage [
27], or via wind energy that could be utilized in a way that wind turbine waste heat could be recovered [
28]. On the EV side, there is also a significant need for innovation, EVs promotion, and, moving towards this direction, in the premises of Piraeus University of Applied Sciences, the lab of Soft Energy Applications and Environmental Protection installed a solar carport with an EV charging station with the assistance and cooperation of private companies [
29].
4.2. GIS and Wind Resource Assessment Methodology Results
The crucial aim, though, is to mark out interesting sites based on all relevant criteria such as environmental and construction constraints. Therefore, an in depth GIS analysis using QGIS tool was implemented and used to gather all information in one map evaluating the specific sites. All constraints and geographical information are included on a map illustrating with different colours the villages (green triangles), main roads (purple), Natura 2000 sites (yellow areas), and on top the wind resource assessment raster, resulting to a comprehensive map (
Figure 3).
The population that resides in each village in the wider area is illustrated in numbers of inhabitants next to each village in
Figure 4. Exactly as in
Figure 3 the roads of the wider area are shown that the EV charging stations developer could take into account. The population map gives the developer a clear relation of the population and movement of cars in the area. This map could also assist developers to “gather” the roads into road branches/clusters since most of these roads end up the coastal road, which happens also to be the national road.
Figure 3.
A comprehensive map of the area including constraints and geographical info.
Figure 3.
A comprehensive map of the area including constraints and geographical info.
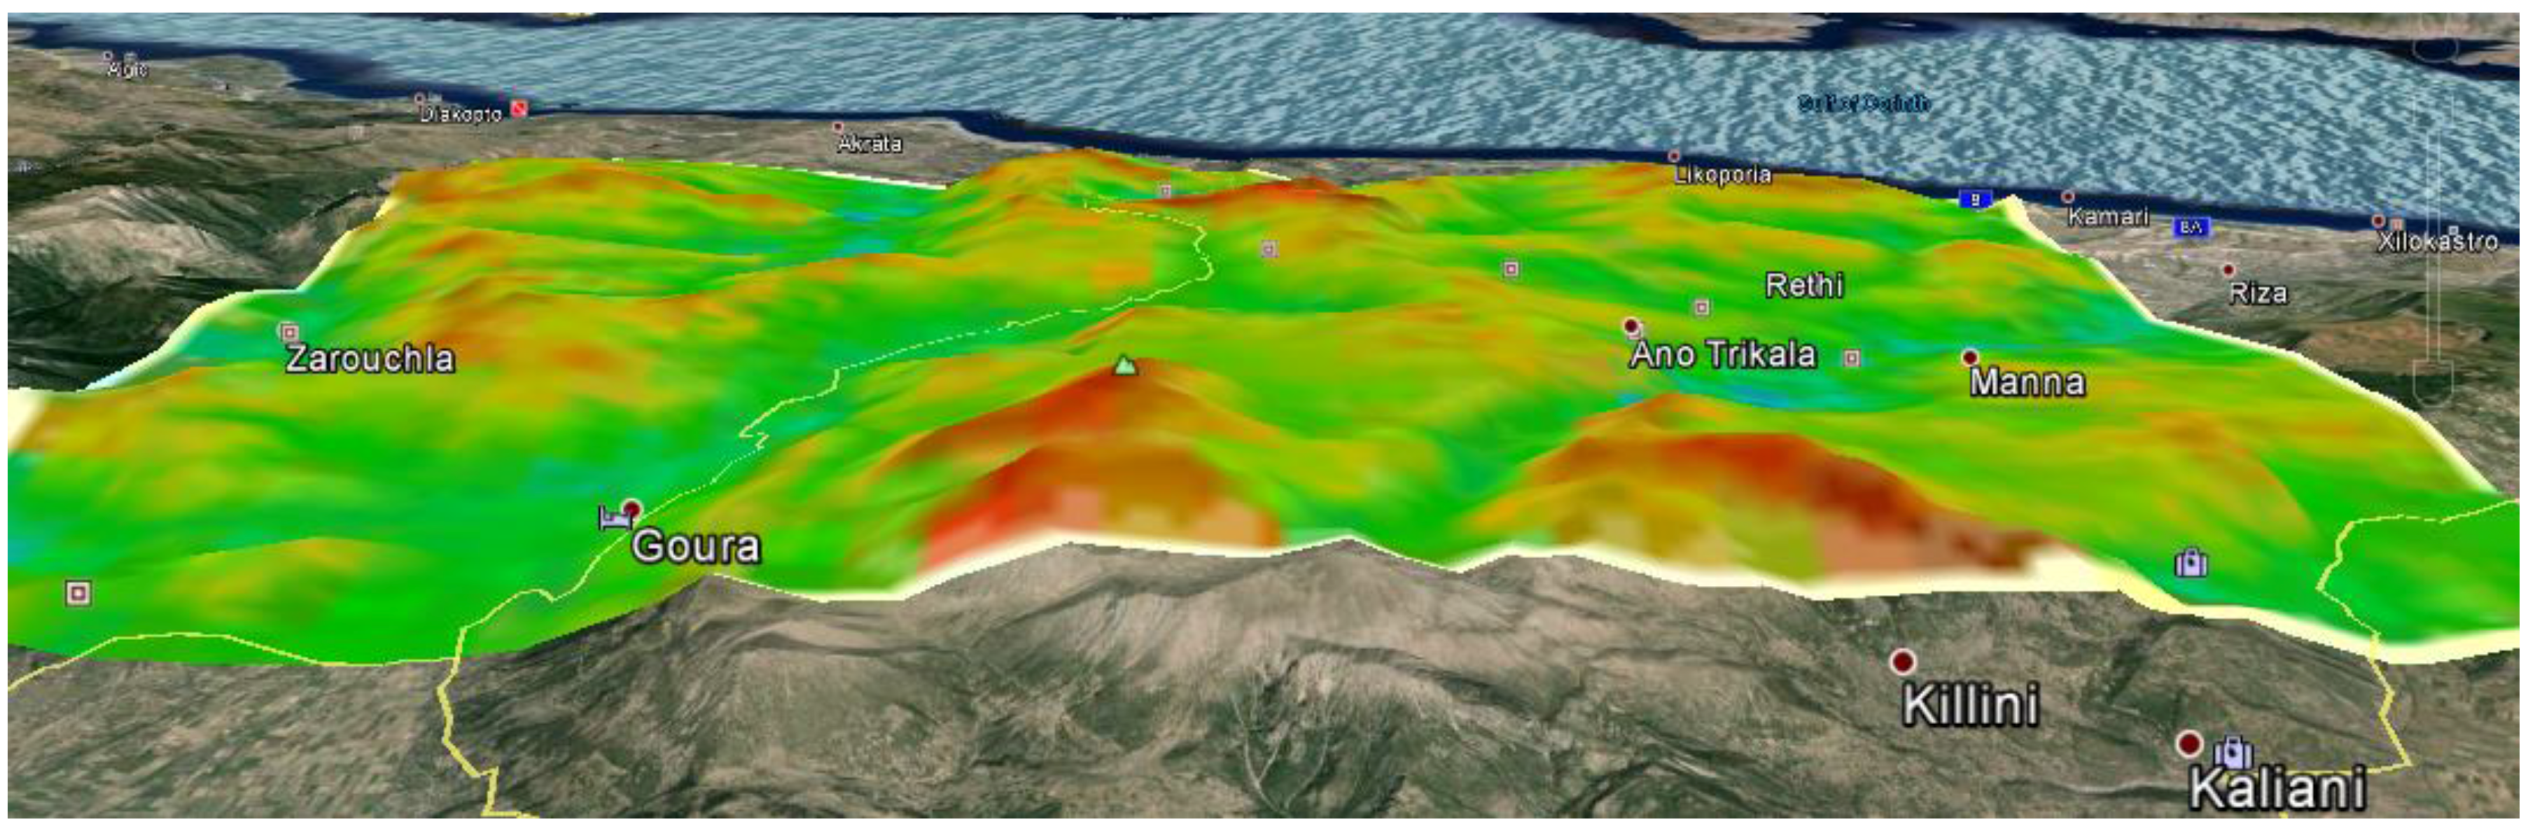
Figure 4 shows the area’s terrain in the 3D view that Google Earth offers illustrating the intense complex terrain of the area. The two mountains on the south have altitude of more than 2000 meters. The area under examination is 20 × 27 km
2. Therefore, they are inside a Natura 2000 site, despite the fact that their wind resources are clearly exploitable. This makes it difficult for these sites to be chosen for wind based EV charging stations sitting.
Figure 4.
An orographic map of the area.
Figure 4.
An orographic map of the area.
Figure 5.
A population map of the area and road clustering.
Figure 5.
A population map of the area and road clustering.
Regarding road clustering, it can be seen that there are four large road branches (
Figure 5). It is clear that the cluster that serves the largest amount of cars is the last one (number 4). However, based on the wind resource assessment results it would be hard and unsustainable to plan and proceed with the installation of the wind turbines in an area where the installation would be either difficult from a construction point of view or not viable due to low wind speeds. Therefore, clusters 1, 2, and 3 are only suitable for sitting the charging stations, though in the branches 2 and 3 there are the two areas (areas A, B,
Figure 3) of significant wind resource that can support the development of such efforts. Due to the fact that in the northern side of the area there is access to the national road where EV charging stations should be more easily available, the difficult task was to identify the obvious (or not) solution for the EV charging station in the mountainous area taking into account all the necessary parameters and constraints in the area. It seems that, since the area under examination is 20 × 27 km
2, and since the range of the EVs are more than 100 km in modern EVs, it is considered a viable solution to place one there. In
Figure 6, the ideal sitting of wind turbines that shall generate electricity and at the same time support the EV charging station is shown. It is important that the wind turbines be placed at the minimum allowed distance from the road(s) in order for the interconnection costs and the losses to be minimized.
Figure 6.
A population map of the area and road clustering.
Figure 6.
A population map of the area and road clustering.
Detailed micrositting in the A and B areas after the analysis show that at the wind turbine in the B area, as shown in
Figure 6, at the closest point from the road (approx. 800 m.), the wind speed is at 6.9 m/s, while the at the wind turbine in the A area, as shown in
Figure 6, at the closest point from the road (approx. 950 m.), the wind speed is at 6.3 m/s. Therefore, if one site ought to be selected this would have been the site in area B.
5. Conclusions
Sitting of EV charging stations in highways, avenues or roads in urban areas seems to be an easy task, compared to what the planners should do in isolated or not so densely populated areas. This work proposed a planning methodology that should be followed in the case of wind energy based EV charging stations in all sparsely populated areas. Along with the wind farm development all over the country and due to the expedient ground for mass market EV deployment everywhere in the world, developmental practices and methodologies should be in place in order to support the societal needs towards this direction. In this case, a complex mountainous area was studied and its wind resource assessment together with existing area constraints (landscape, existing roads, sites of environmental interest, etc.) could assist a developer in the identification of the most appropriate area. In particular, after the exclusion of a number of possible sites that had the capacity to be chosen but the wind resource potential of which was rather low, a specific one was chosen as the first option to build a wind energy based EV charging station.


