1. Introduction
In arid and semi-arid regions, the search for water which are under increasing stress from the growing human population, poses a great challenge due to its scarcity [
1]. Groundwater, as a dynamic system, is located beneath the Earth surface and moves under the control of many factors, which are influenced by forces that are dependent on hydrogeology, hydrology, and climatology [
2]. Recharge, as one of the factors controlling the situation and fluctuation of groundwater, is an important parameter that needs to be assessed more fully. Recharge occurring in small and large scales, spatially and temporally, is influenced by several factors, such as meteorology, soil characteristics, geology, surface cover, slope, and depth of the groundwater level [
3,
4,
5]. Groundwater recharge estimation from precipitation is an integral part of hydrology and hydrogeology [
6].
Although, precipitation is the most important source of groundwater recharge [
7] the accuracy of currently attainable techniques for measuring recharge are not completely acceptable.
Comparative analysis of empirical formulae to estimate recharge which is a prerequisite for groundwater resource management was carried out [
8]. Estimation of groundwater recharge was derived from rainfall data obtained from Ogun-Oshun River Basin Development Authority (OORBDA) using three empirical formulae, which include the empirical methods of [
7,
9,
10]. The result revealed that the three formulae used gave comparable results, hence their conclusion that any of the formulae can be used for groundwater estimation. Additionally, in order to validate the formulae, the groundwater recharge and capacity of aquifers in Malaysia was estimated using empirical formulae [
9] and obtained a recharge of 326.39 mm was obtained for the area [
11].
In measuring groundwater recharge, indirect methods are employed since there are no universally accepted standard methods. However, methods for determining the groundwater recharges have been classified into three groups namely: Physical Model method, obtained when the recharge is calculated from the base flow; Chemical model method, which is used when the measurements of water soluble substances are considered; and Numerical model methods, such as HELP, RORA, PART, WEAP, WTF, PUISE, HYSEP and so on, which can be used in the estimation of groundwater recharges for various climates such as in arid, semiarid, and tropical regions albeit each with its own advantages and disadvantages [
12].
2. The Study Area
Odeda Local Government Area is located on the outskirts of Abeokuta, an ancient city in the southwestern part of Nigeria, extending from longitude 3.3899E to 3.47950E and latitude 7.1745N to 7.2300N. Abeokuta is located in Ogun State, Southwestern Nigeria, as shown in
Figure 1.
The study area is characterized by a tropical climate with distinct wet and dry seasons. The wet season is associated with the relative prevalence of the Moist Maritime Southerly Monsoon from the Atlantic Ocean, while the dry season is predicated by the Continental North Easterly harmattan winds from the Sahara desert. The area is located within a region characterized by a bimodal rainfall pattern (commencing in March; plentiful in July and September, with a short dry spell in August). The long dry season extends from November to March. Annual rainfall ranges between 1400 and 1500 mm in Abeokuta and environs. The region is characterized by relatively high temperature with a mean annual air temperature being about 30 °C. The greatest variation in temperature is experienced in July (25.7 °C) and in February (30.2 °C). Humidity is lowest (37%–54%) at the peak of dry season in February and highest at the peak of the rainy season between June and September (78%–85%).
The study area is underlain by basement complex, and the basement complex rocks of Nigeria are well-represented in the selected study area of Ogun State. These rocks are of Precambrian to early Palaeozoic age and they extend from the northeastern part of Ogun State running southwest and dipping towards the coast [
13].
The basement complex metamorphic rocks are characterized by various folds, structures of various degrees of complexity, faults and foliation. These structural features have a predominant North-South or North-North-East-South-South-West (NNE-SSW) orientation which is particularly strong within the low grade metamorphic. The common metamorphic rocks encountered are gneiss, schist, quartzite and amphiboles. The study area is characterized by various rock types ranging from, granite granitic gneiss and pegmatite. The individual rocks have various hydro-geologic characteristics and belongs to the stable plate which was not subjected to intense tectonics in the past. Therefore, the underground faulting system is minimal and this has contributed to the problem of underground water occurrence in this area.
Figure 1.
Location Map showing the study area.
Figure 1.
Location Map showing the study area.
3. Methodology
Owing to the non-availability of meteorological stations in the study area, Ogun Oshun River Basin Development Authority (OORBDA) meteorological station was used; parameters collected from OORBDA weather station were; minimum and maximum temperature, sunshine hour, relative humidity wind speed, and rainfall data.
Thirty-two (32) years of weather parameters were collected from OORBDA weather station. These were used to calculate the recharge, evapotranspiration, recharge coefficient and run-off using empirical formulae.
The potential evapotranspiration (PE) was determined using CROPWAT version 8.0 based on FAO Penman-Moteithe formula.
3.1. Evapotranspiration
Evapotranspiration is regarded as to the sum of evaporation and transpiration. It is a climatic index integrating the effect of air temperature, humidity, wind speed, and solar radiation. CROPWAT software version 8.0 was used to estimate evapotranspiration. The software is based on the FAO Penman-Monteith formula [
14].
3.2. Estimation of Groundwater Recharge
Estimation of groundwater recharge of the study area was conducted using a modified version of [
9] for tropical regions based on water level fluctuation and rainfall depth [
14,
15]. The equation is given as:
where
R is the net recharge due to precipitation in inches, and
P is the precipitation in inches. These can be converted to millimeters (mm).
3.3. Recharge Coefficients
The value of the recharge coefficient is defined as the ratio of recharge to effective rainfall; it is expressed in percentage [
15] as:
where
R is the recharge and
Pe is the effective rainfall.
3.4. Estimating Direct Runoff
Estimated runoff for water budget was developed by [
16], and is given as:
where
Roff is the direct runoff and
P is the precipitation.
3.5. Co-Integration Analysis
The climatic data was analyzed using co-integration analysis. The analysis involves a unit root test performed on levels, the first difference and the second difference were used to determine whether the individual input series are stationary and exhibit similar statistical properties. It must be noted that regressing a non-stationary time series data over another non-stationary time series data gives a spurious or unreliable regression. To correct for this, a unit root test is performed [
17].
A time series is stationary when
X(
t1),
X(
t2),…,
X(
tn) is the same as the joint distribution of any set of
X(
t1+k),
X(
t2+k),…,
X(
tn+k), for all
n and
k.
where
p ≤ 1 and
U is the white noise error.
If the estimated p is statistically equal to 1 when Yt is regressed on Yt−1, then Yt is non-stationary; that is, has no unit root (I (0)).
The Augmented Dickey–Fuller (ADF) test was used to test for the stationarity of the data. The test consists of the following regression:
where:
The Johansen procedure was used to test for the number of co-integration vectors in the model. The Johansen technique was used not only because it is vector auto-regressive-based but because it performs better in multivariate models [
18]. If
Xt and
Yt are then co-integrated, their short-run dynamics can be described by an error correction model (ECM). The theory states that if two variables,
Y and
X, are co-integrated, then the relationship between them can be expressed as an ECM [
18]. The co-integration model is given as:
3.6. Correlation and Regression Analyses
Pearson correlation coefficient was used to evaluate the strength of the relationship between meteorological factors. The impact of independent variables (i.e., humidity, temperature, rainfall, wind speed, and duration of daily solar radiation) on estimated recharge was evaluated using linear regression.
4. Results
The methods discussed were used to estimate all parameters from January 1983 to December 2014. This covers a period of thirty-two (32) years.
Table 1 shows the amount of calculated groundwater recharge, evapotranspiration, the recharge coefficient, and surface runoff. The ratio of recharge to total precipitation is 11%, which according to [
16], is classified as a low rate of recharge. It is proved that aside from precipitation (with the high rate), other parameters (such as surface cover) also have a key role [
4,
5] in recharge.
Table 1 shows the hydrological data of the study area for 32 years, for 1983 to 2014.
Table 1.
Hydrological data of the study area for 32 years (1983 to 2014).
Table 1.
Hydrological data of the study area for 32 years (1983 to 2014).
| Year | P (mm) | R (mm) | Min. Temp. (°C) | Max. Temp. (°C) | ET (mm/yr) | Run Off | Rcoeff (%) |
|---|
| 1983 | 901.6 | 159.0 | 22.3 | 32.1 | 1284.8 | 763.8 | 23 |
| 1984 | 1032.4 | 177.0 | 20.0 | 31.9 | 1252.0 | 874.9 | 20 |
| 1985 | 1185.7 | 196.0 | 21.5 | 31.9 | 1116.9 | 1005.2 | 21 |
| 1986 | 1210.7 | 199.0 | 24.8 | 31.9 | 1394.3 | 1026.5 | 20 |
| 1987 | 1224.5 | 199.4 | 26.4 | 37.7 | 1525.7 | 1038.2 | 21 |
| 1988 | 1576.1 | 237.8 | 20.9 | 36.3 | 1219.1 | 1337.0 | 19 |
| 1989 | 1222.6 | 200.3 | 19.4 | 37.1 | 2000.2 | 1036.6 | 20 |
| 1990 | 1336.1 | 213.0 | 20.4 | 37.6 | 2029.4 | 1133.1 | 20 |
| 1991 | 1185.0 | 195.9 | 20.1 | 36.5 | 1328.6 | 1004.7 | 20 |
| 1992 | 1445.6 | 191.2 | 18.5 | 37.4 | 1332.3 | 1226.2 | 20 |
| 1993 | 941.2 | 164.8 | 23.4 | 37.2 | 1357.8 | 797.4 | 22 |
| 1994 | 1009.6 | 174.2 | 31.4 | 37.3 | 1434.5 | 855.5 | 21 |
| 1995 | 1244.7 | 202.9 | 30.8 | 37.3 | 1401.6 | 1055.4 | 20 |
| 1996 | 1254.6 | 204.0 | 21.8 | 37.4 | 978.2 | 1063.8 | 20 |
| 1997 | 1233.5 | 201.7 | 29.9 | 37.4 | 1237.4 | 1045.9 | 20 |
| 1998 | 895.4 | 158.3 | 22.0 | 34.8 | 1076.8 | 758.5 | 22 |
| 1999 | 1037.5 | 177.9 | 13.8 | 31.9 | 981.9 | 879.2 | 23 |
| 2000 | 948.5 | 165.5 | 16.7 | 33.1 | 960.0 | 803.2 | 22 |
| 2001 | 950.0 | 165.5 | 15.3 | 33.3 | 1043.9 | 805.6 | 21 |
| 2002 | 1736.5 | 252.9 | 10.2 | 33.0 | 1284.9 | 1473.4 | 18 |
| 2003 | 1449.7 | 225.1 | 12.8 | 34.3 | 1325.0 | 1229.7 | 20 |
| 2004 | 1112.7 | 187.2 | 22.8 | 31.1 | 1262.9 | 943.2 | 20 |
| 2005 | 1112.7 | 187.2 | 13.4 | 33.0 | 1200.9 | 943.2 | 20 |
| 2006 | 1236.2 | 202.0 | 23.7 | 31.1 | 949.0 | 1048.2 | 21 |
| 2007 | 1943.9 | 273.1 | 26.0 | 32.2 | 1189.9 | 1651.4 | 18 |
| 2008 | 848.9 | 151.0 | 25.9 | 26.7 | 1215.5 | 719.0 | 22 |
| 2009 | 1189.9 | 197.8 | 26.0 | 30.5 | 1376.1 | 1008.7 | 20 |
| 2010 | 1233.9 | 201.7 | 25.8 | 36.4 | 1398.0 | 1046.2 | 21 |
| 2011 | 1497.7 | 223.5 | 25.4 | 36.6 | 1248.3 | 1245.0 | 15 |
| 2012 | 1241.5 | 204.2 | 25.0 | 36.8 | 1255.6 | 1052.7 | 15 |
| 2013 | 929.2 | 163.0 | 24.9 | 35.5 | 1379.7 | 787.2 | 22 |
| 2014 | 1058.0 | 180.3 | 22.9 | 32.2 | 1474.6 | 896.7 | 21 |
In
Table 1,
P is the annual precipitation,
R is the annual groundwater recharge (mm),
ET is the evapotranspiration (mm/year),
Min. T is the minimum temperature (°C),
Max. T is the maximum temperature (°C), and
Rcoeff. is the recharge coefficient (%).
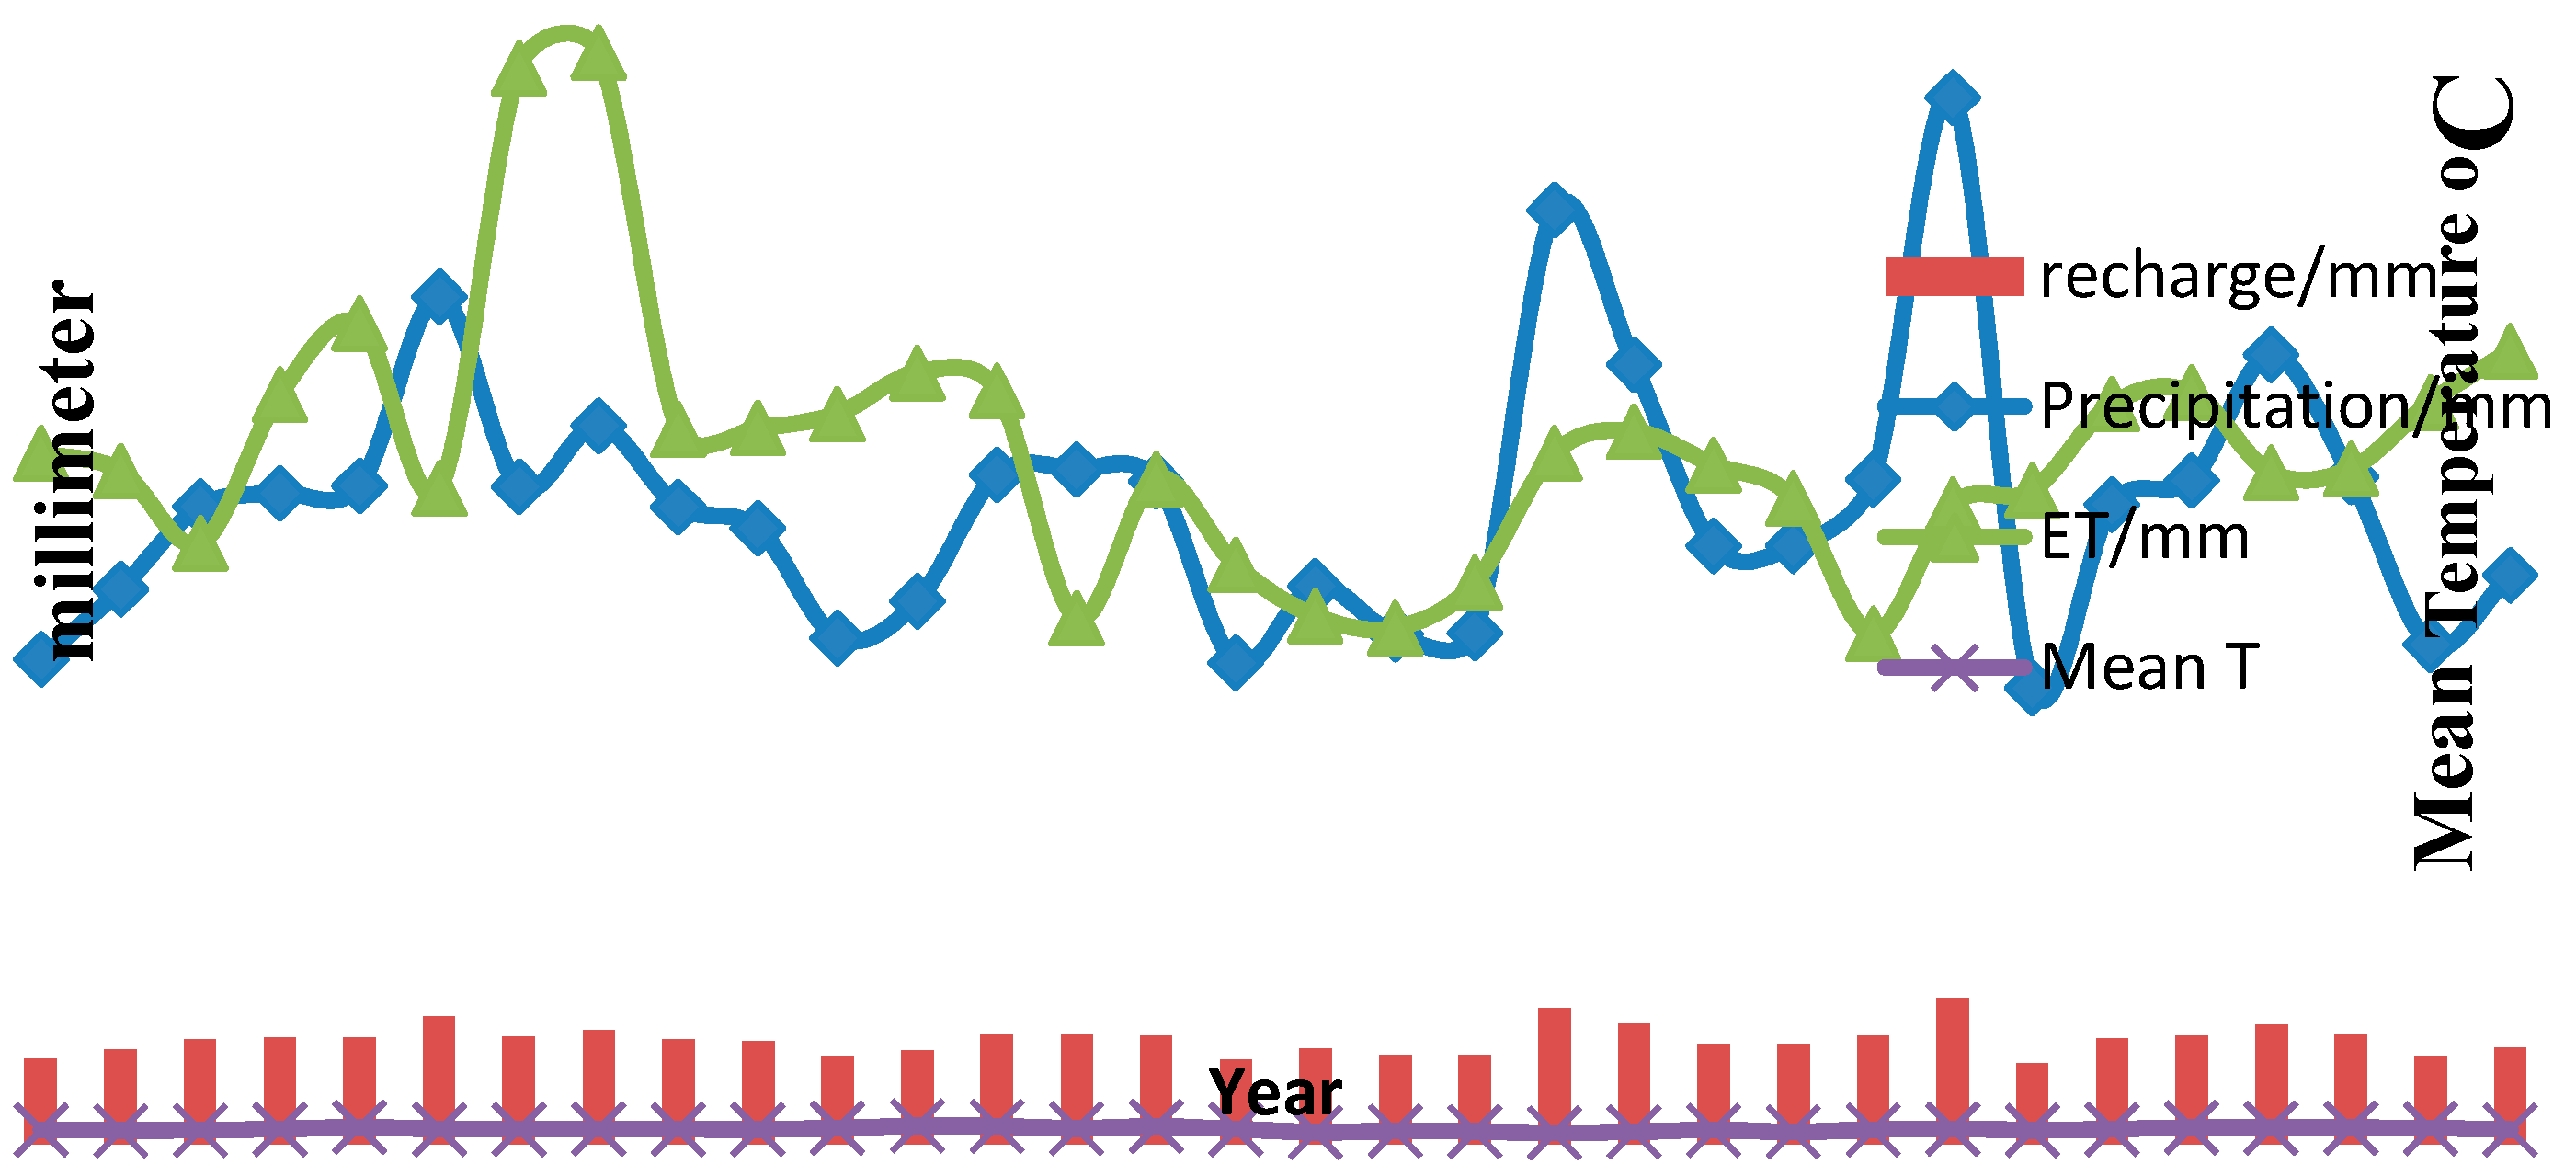
Figure 2 shows the annual rainfall, recharge, evapotranspiration, and temperature from 1983–2014. Groundwater recharge increases with precipitation and shows the same trend throughout the years. However, evapotranspiration shows variation in trend throughout the study area. This is expected because evapotranspiration is a function of temperature, which showed a remarkable change throughout the years, in the study area. Typically, low rainfall causes low groundwater recharge infiltrating into the aquifer, this is due to increase in temperature and evapotranspiration and
vice versa.
Figure 2.
Total annual precipitation, groundwater recharge, evapotranspiration, and temperature.
Figure 2.
Total annual precipitation, groundwater recharge, evapotranspiration, and temperature.
There are objections to the use of either of these data since the data from the greater area is more useful for national decision-makers; the present method would be of great help to the local authority for future sustainable development of the region. The percentage of evapotranspiration, runoff, and recharge in the study area are 73%, 16%, and 11%, respectively. Typically low recharge causes high runoff over the surface.
4.1. Co-Integration
Table 2 represents the result of the ADF test. It is evident that recharge is non-stationary and likewise, the annual rainfall, but are stationary after the second differencing. Other climatic parameters are non-stationary. It has been ascertained that the variables exhibit unit root I (1) (non-stationary) at their levels, but stationarity after differencing, hence there exists a long run relationship between the climate parameters.
Table 2.
Result of stationary test from the Augmented Dickey-Fuller Test.
Table 2.
Result of stationary test from the Augmented Dickey-Fuller Test.
| Climate Parameters | Level | 1st Difference | 2nd Difference | Decision |
|---|
| Precipitation | −4.364246 | −5.394125 | −3.565695 | Stationary |
| Recharge | −4.224929 | −5.074373 | −3.699143 | Stationary |
| Min Temperature | −2.302965 | −5.385516 | −9.299585 | Non-stationary |
| Max Temperature | −2.174135 | −4.069986 | −4.069986 | Non-stationary |
| Evapotranspiration | −2.761985 | −5.987190 | −8.289337 | Non-stationary |
| Relative Humidity | −2.604266 | −4.506285 | −6.032715 | Non-stationary |
| Solar Radiation | −3.820166 | −6.558539 | −8.069424 | Non-stationary |
Table 3.
Johansen co-integration result.
Table 3.
Johansen co-integration result.
| Eigen Value | Likelihood | 5% Critical | 1% Critical | Hypothesized No. of CE(s) |
|---|
| 0.751784 | 105.2439 | 94.15 | 103.18 | None ** |
| 0.594706 | 64.83369 | 68.52 | 76.07 | At most 1 |
| 0.481656 | 38.64253 | 47.21 | 54.46 | At most 2 |
| 0.264670 | 19.58617 | 29.68 | 35.65 | At most 3 |
| 0.223683 | 10.67054 | 15.41 | 20.04 | At most 4 |
| 0.108415 | 3.327882 | 3.76 | 6.65 | At most 5 |
Table 3 shows the Johansen co-integration results. The likelihood ratio shows that there is only one co-integrating (CI) equation in the analysis. The CI equation was based on the conformity of the coefficients with economic theory and its statistical significance. From the equation, the precipitation variable was considered to have a significant effect on estimated recharge in the study area during the period studied.
The adjusted R2 shows that about 98% of the variation in recharge is explained by the effects of precipitation (
Table 4). This shows that an increase in rainfall value will cause the recharge value to increase and
vice versa.
Table 4.
Results from the Error Correction Model.
Table 4.
Results from the Error Correction Model.
| Variable | Coefficient | Standard. Error | t-Statistics | Probability |
|---|
| Recharge | 11.13899 | 0.356742 | 31.22419 | 0.0000 |
| Solar Radiation | −6.177148 | 7.792169 | −0.792738 | 0.4354 |
| Min Temperature | 0.890065 | 3.595027 | 0.247582 | 0.8065 |
| Max Temperature | 2.818525 | 7.302545 | 0.385965 | 0.7028 |
| Evapotranspiration | −12.55190 | 37.99302 | −0.330374 | 0.7439 |
| Constant | −935.5960 | 229.9052 | −4.069486 | 0.0004 |
4.2. Correlation and Regression Analysis
This was to study the correlation between estimated recharge and climate parameters.
Table 5 shows the Pearson correlation coefficient for meteorological parameters (1983–2014) on estimated recharge. The results showed that evapotranspiration was correlated with solar radiation at the 0.01 significance level, with
R2 = 0.647. Additionally, estimated recharge was correlated with precipitation at the 0.01 level (
R2 = 0.943). There is no significance at any level among the other parameters with regression analysis, which was conducted to evaluate the effect of climate parameters on estimated recharge. It was observed from
Table 4 that all parameters showed minimal relationships to estimated recharge, except precipitation, which showed a dominant role of rainfall percolation of water into the ground in the study area.
Table 5 and
Table 6 show the Pearson correlation coefficient for meteorological parameters, and regression analysis of weather parameters on the estimated recharge in the study area.
Table 5.
Pearson correlation coefficient for meteorological parameters.
Table 5.
Pearson correlation coefficient for meteorological parameters.
| | Precipitation
(mm) | Recharge
(mm) | Min Temp.
(°C) | Max Temp
(°C) | ET
(mm) | Rel. Hum.
(%) |
|---|
| Precipitation (mm) | 1 | 0.943 | 0.279 | 0.258 | 0.059 | −0.050 |
| Recharge (mm) | 0.943 | 1 | 0.433 | 0.231 | 0.064 | 0.051 |
| Min. Temp. (°C) | 0.104 | 0.085 | 1 | 0.261 | 0.327 | −0.036 |
| Max Temp. (°C) | 0.244 | 0.263 | 0.205 | 1 | 0.019 | 0.303 |
| ET (mm) | 0.016 | 0.046 | 0.165 | 0.413 | 1 | 0.019 |
| Rel. Hum. (%) | 0.119 | 0.092 | −0.118 | 0.389 | −0.003 | 1 |
| Solar Rad. | −0.013 | 0.023 | −0.047 | 0.205 | 0.647 | −0.017 |
Table 6.
Regression analysis of weather parameters on estimated recharge.
Table 6.
Regression analysis of weather parameters on estimated recharge.
| Weathered Parameter / Recharge | Determination Coefficient (r 2) | Regression Equation |
|---|
| Precipitation (mm) | 0.983 | Y = −962.462 + 11.2228X |
| Min. Temperature (°C) | 0.007 | Y = 20.2466 + 8.42E − 03X |
| Max. Temperature (°C) | 0.069 | Y = 31.5017 + 1.42E − 02X |
| Relative Humidity (%) | 0.008 | Y = 78.5326 + 1.22E − 0.2X |
| Solar Radiation | 0.001 | Y = 15.0630 + 1.39E − 0.3X |
5. Conclusions
The estimation of groundwater recharges have been carried out in Odeda Local Government Area, Ogun State, Nigeria. The methods used have greatly helped in estimating the groundwater recharges in the area. The annual mean groundwater recharge for 32 years (1983–2014) has been estimated to be 194.7 mm per annum. The mean of the recharge coefficient is 20.2%, the rate of evapotranspiration is about 73%, and groundwater recharge is about 11%. Therefore, 16% of rainfall water makes some allowance for runoff (and/or interflow) in the study area. The study shows that there is variability in climate parameters. The study also shows that the climate has a significant effect on groundwater resources. This is clearly revealed in the rainfall variable; however, evapotranspiration and solar radiation have a relationship with each other. The study also shows that the change in climate has a significant effect on recharge. This is clearly revealed in the rainfall variable; however, temperature seems to be an unimportant variable of climate in the determination of recharge in the study area. The correlation between parameters showed the highest positive correlation between recharge and rainfall. In addition, correlation between temperature and humidity, solar radiation, and et are at the 0.01 level. Results of linear regressions proved precipitation has a significant effect (with R2 = 0.983) on the estimation of recharge.
Author Contributions
Victor Makinde conceived the research, Oluseyi Adeleke carried out the research which was thoroughly supervised by Victor Makinde and Ayobami Eruola. Oluwaseun Dada helped in acquiring the data. Oluseyi Adeleke, Akintayo Ojo and Taiwo Aluko analysed the data. Oluseyi Adeleke wrote the manuscript, Akintayo Ojo reviewed and adapted the manuscript to fit the style of the journal.
Conflicts of Interest
The authors declare no conflicts of interest.
References
- Kishan, S.R.; Anil, K.M.; George, P.; Rakesh, K. Estimation of ground water recharge in Shankergarh block of Allahabad (India) using remote sensing and statistical approach. Glob. J. Sci. Eng. Technol. 2012, 1, 34–48. [Google Scholar]
- Kumar, C.P. Estimation of natural ground water recharge. ISH J. Hydraulic Eng. 1977, 3, 61–74. [Google Scholar] [CrossRef]
- Bouwer, H. Groundwater Hydrology; McGraw-Hill Book Company: New York, NY, USA, 1978. [Google Scholar]
- Shukla, S.; Jaber, F.H. Groundwater Recharge from Agricultural Areas in the Flatwoods Regionof South Florida. Available online: http://ufdcimages.uflib.ufl.edu/IR/00/00/15/42/00001/AE39900.pdf (accessed on 7 May 2015).
- Sumioka, S.S.; Bauer, H.H. Estimating ground-water recharge from precipitation on Whidbey and Camano Islands, Island County, Washington, water years 1998 and 1999. In Water-Resources Investigations Report, 03-4101; Tacoma, W.A., Ed.; U.S. Geological Survey: Pembroke, MA, USA, 2003. [Google Scholar]
- Xi, C.; Zhang, Z.; Zhang, X.; Chen, Y.; Qian, M.; Peng, S. Estimation of groundwater recharge from precipitation and evapotranspiration by Lysimeter measurement and soil moisture model. J. Hydrol. Eng. 2008, 13, 333–340. [Google Scholar]
- Kumar, C.P.; Seethapathi, P.V. Assessment of natural ground water recharge in upper Ganga Canal command area. J. Appl. Hydrol. 2002, 15, 13–20. [Google Scholar]
- Oke, M.O.; Martins, O.; Idowu, O.; Aiyelokun, O. Comparative analysis of empirical formulae used in groundwater recharge in Ogun-Oshun River Basins. J. Sci. Res. Repo. 2013, 2, 692–710. [Google Scholar] [CrossRef] [PubMed]
- Chaturvedi, R.S. A note on the investigation of ground water resources in western districts of Uttar Pradesh. In Annual Report; U.P. Irrigation Research Institute: Bahadrabad, India, 1973; pp. 86–122. [Google Scholar]
- Kumar, C.P. Groundwater Assessment methodology; National Institute of Hydrology: Roorkee, India, 2009. [Google Scholar]
- Saghravani, S.R.; Ismail, Y.; Sa’ari, M.; Saghravani, S.F. Estimating groundwater recharge using empirical method: A case study in the tropical zone. Sains Malaysiana 2013, 42, 553–560. [Google Scholar]
- Risser, D.W.; Gburek, W.J.; Folmar, G.J. Comparison of recharge estimates at a small watershed in east-central Pennsylvania, USA. Hydrogeol. J. 2008, 2008, 17, 287–298. [Google Scholar] [CrossRef]
- Ako, B.D. Geophysical prospecting for groundwater in parts of south-western Nigeria. Ph.D. Thesis, Department of Geology, University of Ife, Ile-Ife, Nigeria, 1979. [Google Scholar]
- Allen, R.; Pereira, L.A.; Raes, D.; Smith, M. Crop evapotranspiration. In FAO Irrigation and Drainage Paper No. 56; FAO: Rome, Italy, 1998. [Google Scholar]
- Misstear, B.D.R.; Brown, L.; Daly, D. A methodology for making initial estimates of groundwater recharge from groundwater vulnerability mapping. Hydrogeol. J. 2009, 17, 275–285. [Google Scholar] [CrossRef]
- Muteraja, K.N. Applied Hydrology; Tata MGraw-Hill: New Delhi, India, 1986. [Google Scholar]
- Ayinde, E.O.; Muchie, M.; Olatunji, G.B. Effect of climate change on Agricultural productivity in Nigeria: A co-integration model approach. J. Hum. Ecol. 2011, 35, 189–194. [Google Scholar]
- Maddala, G.S. Introduction to Econometrics, 3rd Ed. ed; John Wiley and Sons Ltd: New York, NY, USA, 2001. [Google Scholar]
© 2015 by the authors; licensee MDPI, Basel, Switzerland. This article is an open access article distributed under the terms and conditions of the Creative Commons Attribution license (http://creativecommons.org/licenses/by/4.0/).


