Effects of Contingency versus Constraints on the Body-Mass Scaling of Metabolic Rate


Abstract
:
1. Introduction
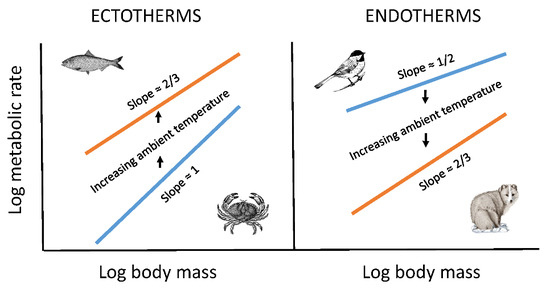
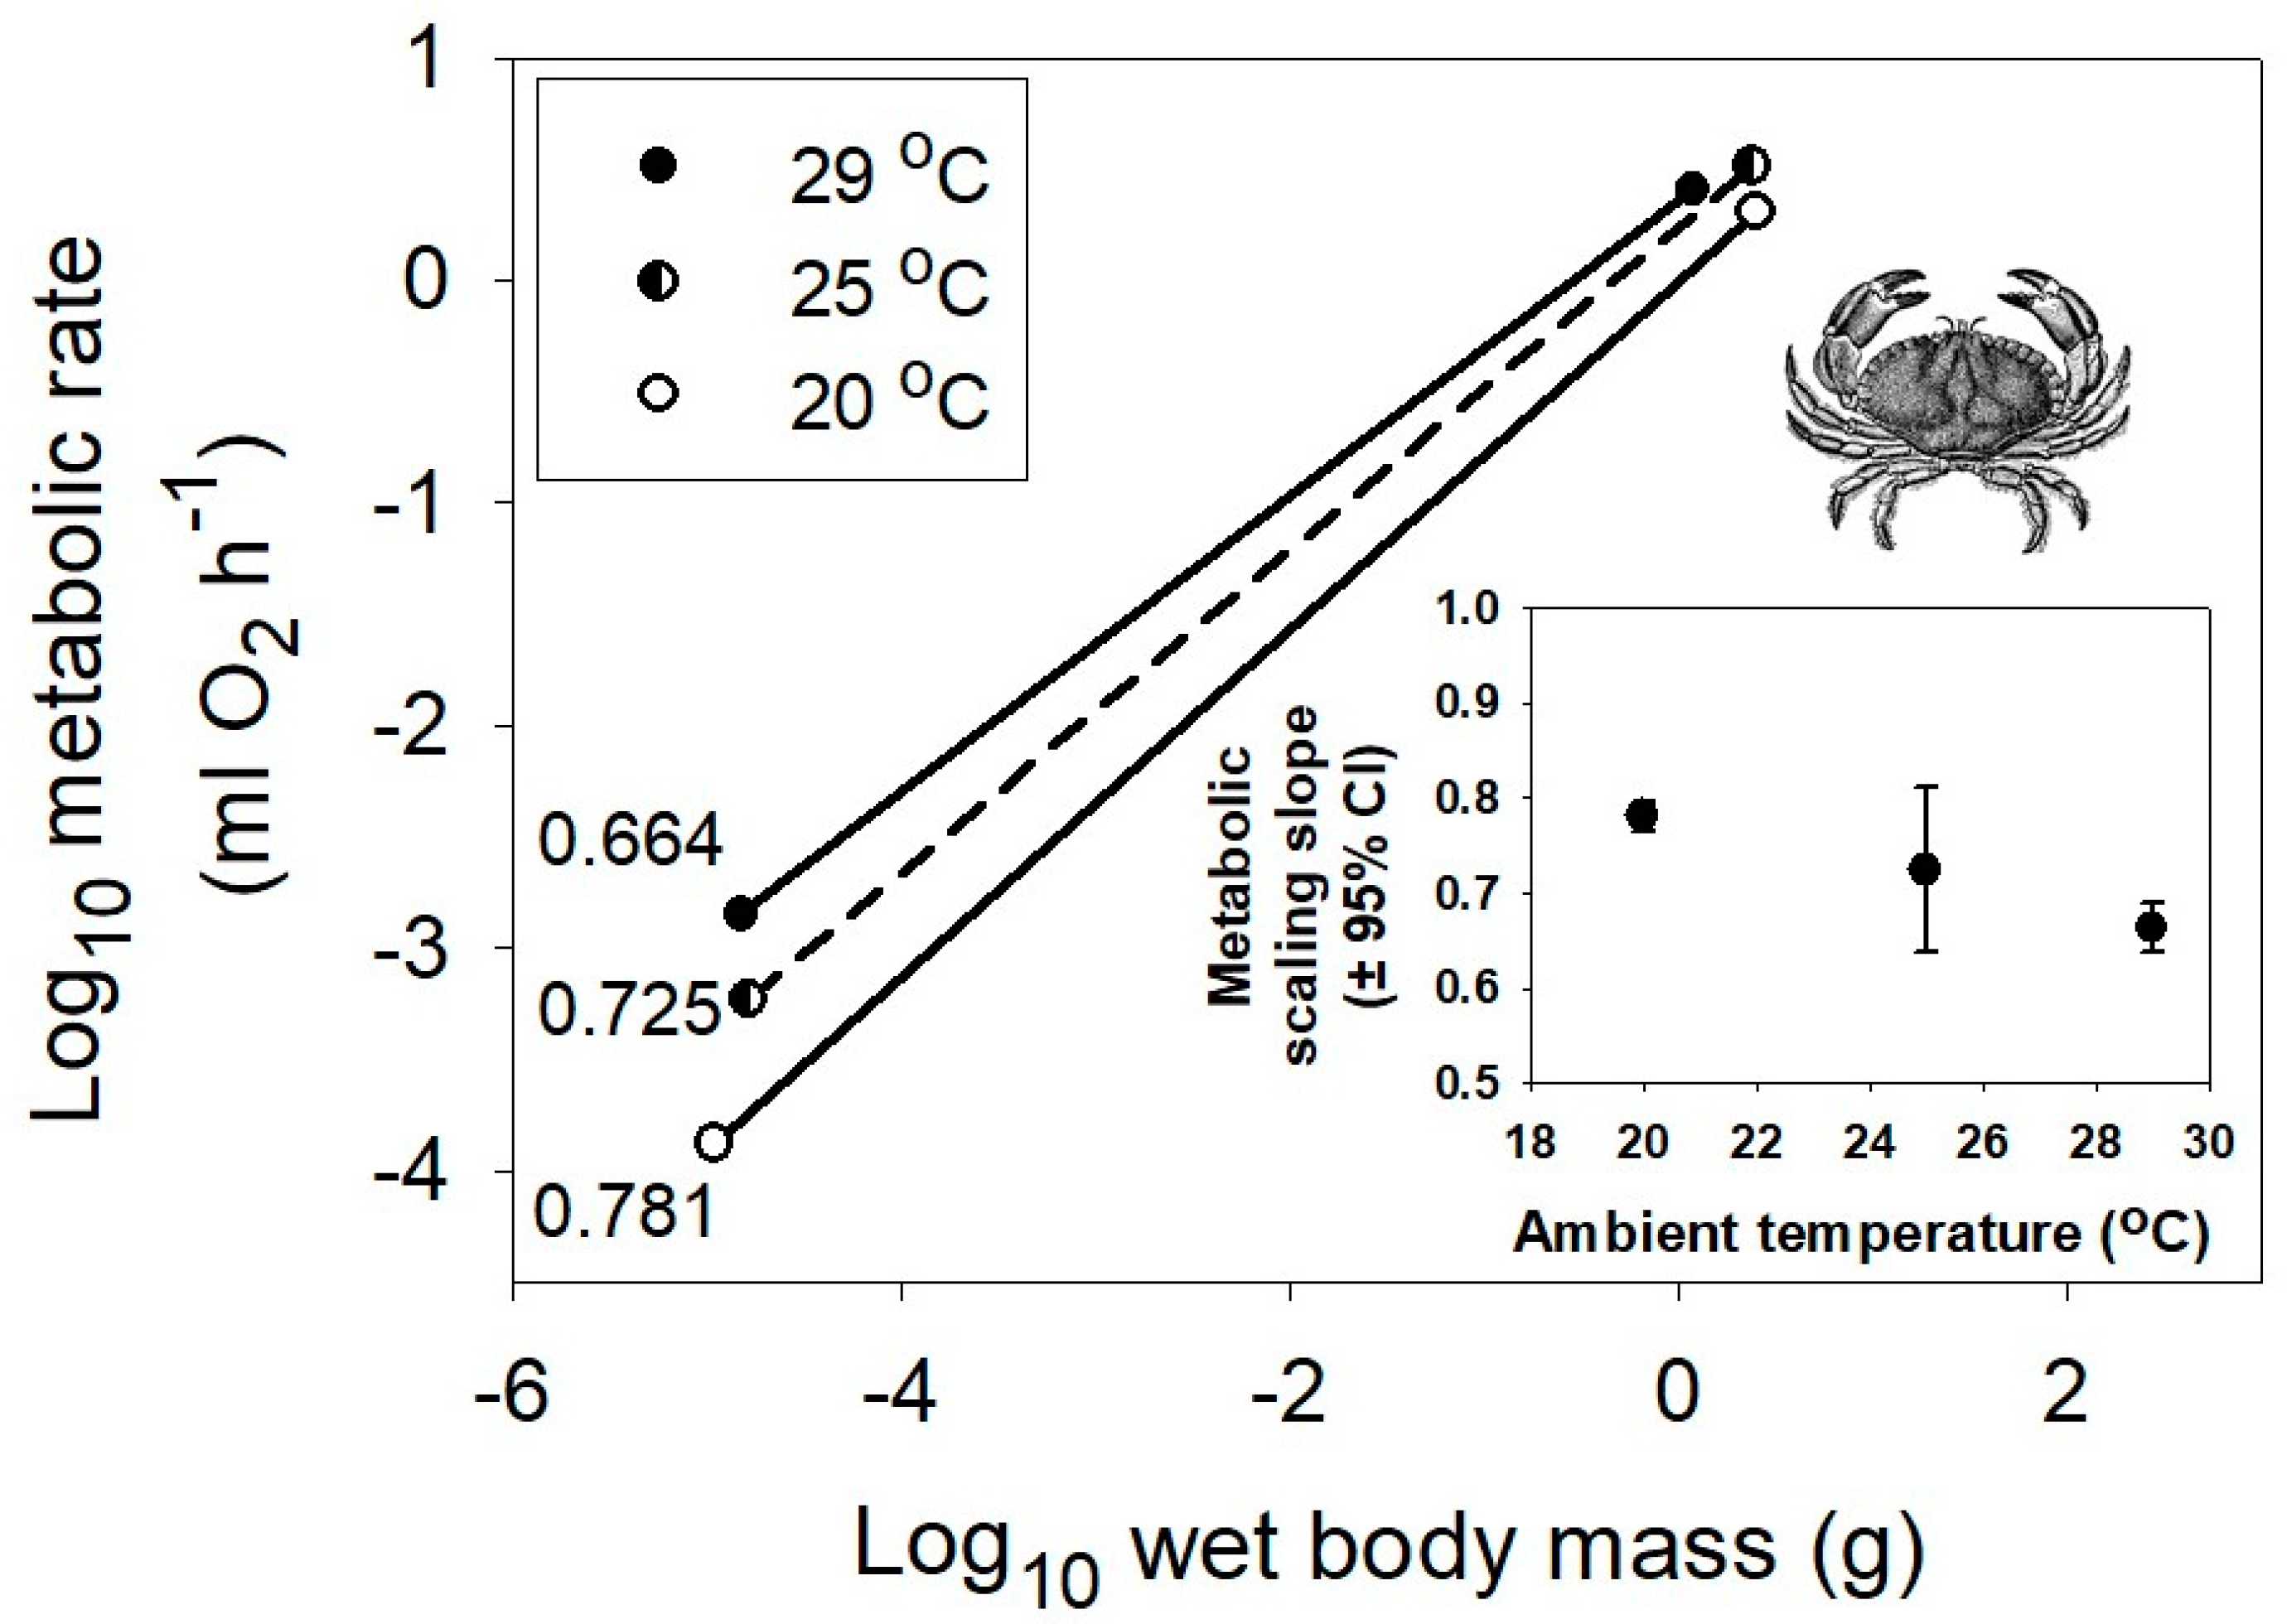
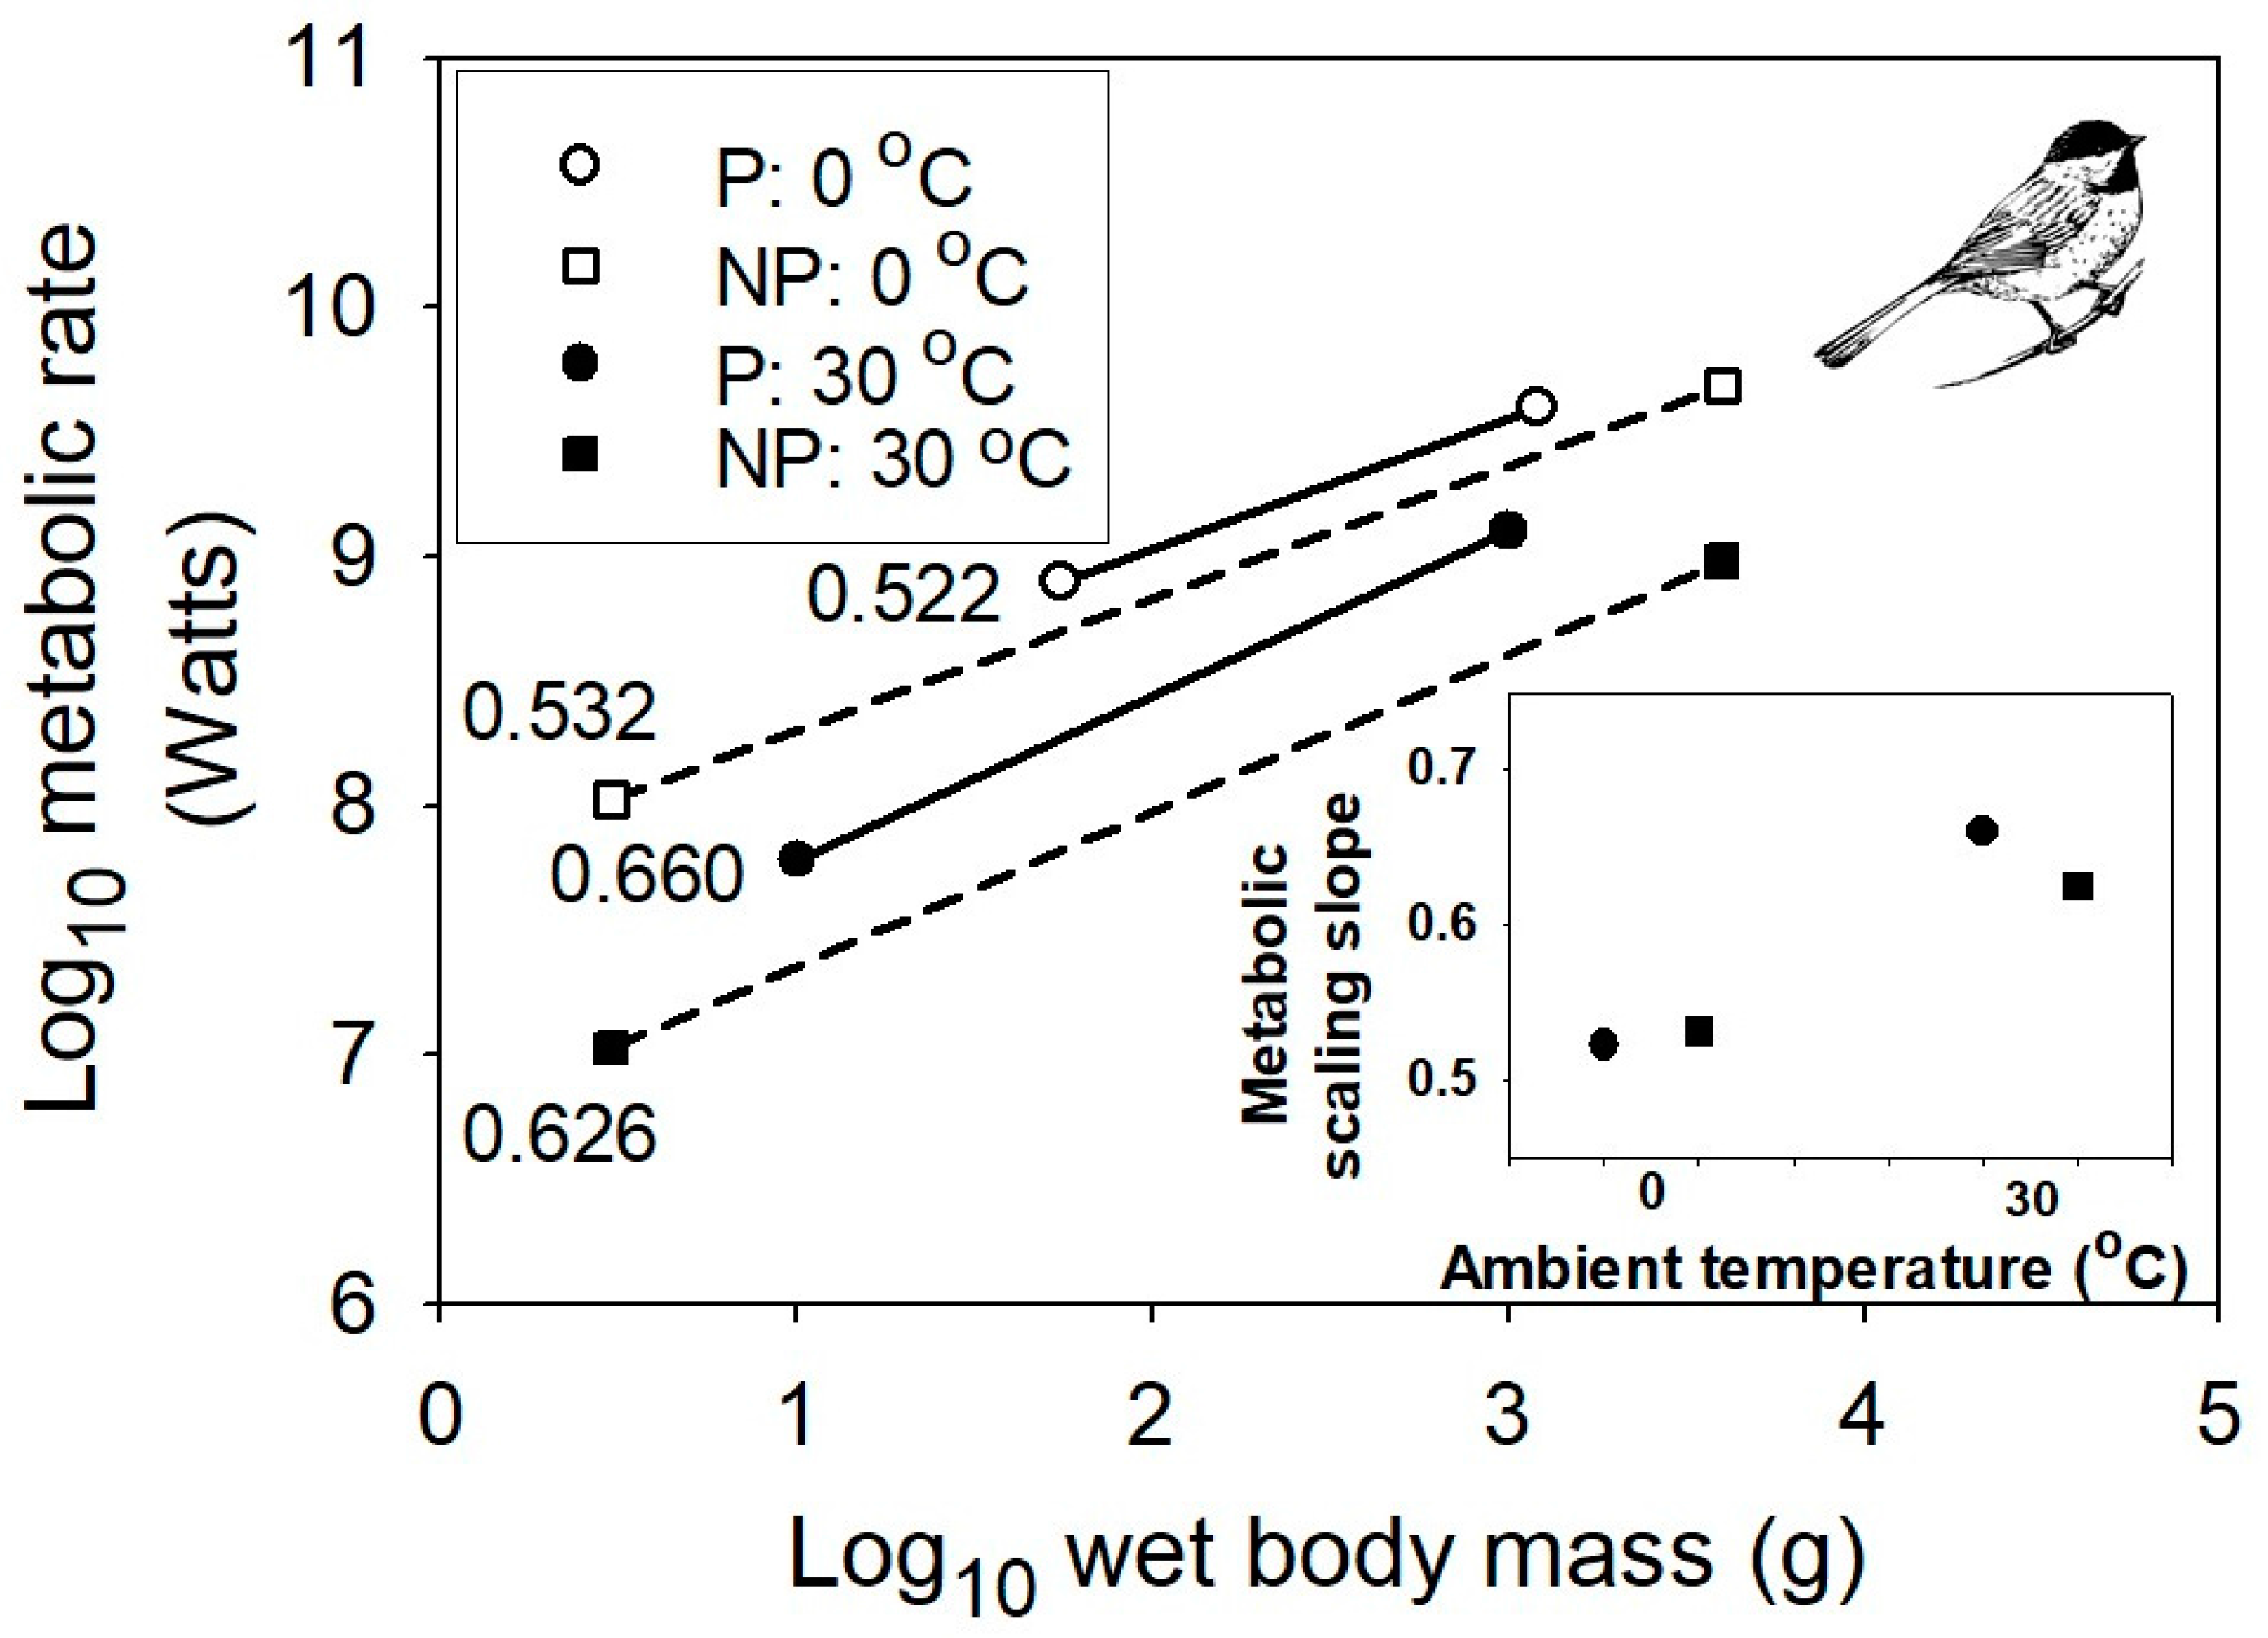
2. Results
3. Discussion
3.1. Implications of Results for Theory
3.2. Challenges for Future Research
3.2.1. General Perspective
3.2.2. Suggestions for Future Research
4. Materials and Methods
5. Conclusions
Acknowledgments
Conflicts of Interest
References
- Huxley, J.S. Problems of Relative Growth; Dover Publications: New York, NY, USA, 1932. [Google Scholar]
- Gould, S.J. Allometry and size in ontogeny and phylogeny. Biol. Rev. 1966, 41, 587–638. [Google Scholar] [CrossRef] [PubMed]
- McMahon, T.A.; Bonner, J.T. On Size and Life; Scientific American Library: New York, NY, USA, 1983. [Google Scholar]
- Peters, R.H. The Ecological Implications of Body Size; Cambridge University Press: Cambridge, UK, 1983. [Google Scholar]
- Calder, W.A. Size, Function and Life History; Harvard University Press: Cambridge, MA, USA, 1984. [Google Scholar]
- Schmidt-Nielsen, K. Scaling: Why Is Animal Size So Important? Cambridge University Press: New York, NY, USA, 1984. [Google Scholar]
- Brown, J.H.; West, G.B. (Eds.) Scaling in Biology; Oxford University Press: Oxford, UK, 2000. [Google Scholar]
- Sibly, R.M.; Brown, J.H.; Kodric-Brown, A. (Eds.) Metabolic Ecology: A Scaling Approach; Wiley-Blackwell: Oxford, UK, 2012. [Google Scholar]
- West, G.B.; Brown, J.H. The origin of allometric scaling laws in biology from genomes to ecosystems: Towards a quantitative unifying theory of biological structure and organization. J. Exp. Biol. 2005, 208, 1575–1592. [Google Scholar] [CrossRef] [PubMed]
- Glazier, D.S. Metabolic scaling in complex systems. Systems 2014, 2, 451–540. [Google Scholar] [CrossRef]
- Sarrus, F.; Rameaux, J.F. Application des sciences accessoires et principalement des mathématiques à la physiologie générale (Rapport sur une mémoire adressé à l’Académic royale de Médecine, séance du 23 juillet 1839). Bull. Acad. R. Méd. 1839, 3, 1094–1100. [Google Scholar]
- Rubner, M. Über den Einfluss der Körpergrösse auf Stoff- und Kraftwechsel. Z. Biol. 1883, 19, 535–562. [Google Scholar]
- Richet, C.R. La Chaleur Animale; Bibliothèque Scientifique Internationale, Felix Alcan: Paris, France, 1889. [Google Scholar]
- Voit, E. Über die Grösse des Energiebedarfs der Tiere in Hungerzustande. Z. Biol. 1901, 41, 113–154. [Google Scholar]
- Heusner, A.A. Energy metabolism and body size I. Is the 0.75 mass exponent of Kleiber’s equation a statistical artifact? Respir. Physiol. 1982, 48, 1–12. [Google Scholar] [CrossRef]
- Glazier, D.S. Beyond the “3/4-power law”: Variation in the intra- and interspecific scaling of metabolic rate in animals. Biol. Rev. 2005, 80, 611–662. [Google Scholar] [CrossRef] [PubMed]
- Kleiber, M. Body size and metabolism. Hilgardia 1932, 6, 315–353. [Google Scholar] [CrossRef]
- Brody, S.; Procter, R.C. Relation between basal metabolism and mature body weight in different species of mammals and birds. Relat. Basal Metab. Bodyweight Man 1932, 116, 89–101. [Google Scholar]
- Hemmingsen, A.M. Energy metabolism as related to body size and respiratory surfaces, and its evolution. Rep. Steno Mem. Hosp. Nord. Insulin Lab. 1960, 9, 1–110. [Google Scholar]
- Kleiber, M. The Fire of Life; Wiley: New York, NY, USA, 1961. [Google Scholar]
- Savage, V.M.; Gillooly, J.F.; Woodruff, W.H.; West, G.B.; Allen, A.P.; Enquist, B.J.; Brown, J.H. The predominance of quarter-power scaling in biology. Funct. Ecol. 2004, 18, 257–282. [Google Scholar] [CrossRef]
- White, C.R.; Kearney, M.R. Metabolic scaling in animals: Methods, empirical results, and theoretical explanations. Compr. Physiol. 2014, 4, 231–256. [Google Scholar] [CrossRef] [PubMed]
- Glazier, D.S. A unifying explanation for diverse metabolic scaling in animals and plants. Biol. Rev. 2010, 85, 111–138. [Google Scholar] [CrossRef] [PubMed]
- Roberts, M.F.; Lightfoot, E.N.; Porter, W.P. A new model for the body size–metabolism relationship. Physiol. Biochem. Zool. 2010, 83, 395–405. [Google Scholar] [CrossRef] [PubMed]
- Speakman, J.R.; Król, E. Maximal heat dissipation capacity and hyperthermia risk: Neglected key factors in the ecology of endotherms. J. Anim. Ecol. 2010, 79, 726–746. [Google Scholar] [CrossRef] [PubMed]
- Glazier, D.S. The scaling of metabolic scaling within physical limits. Systems 2014, 2, 425–450. [Google Scholar] [CrossRef]
- Glazier, D.S. Body-mass scaling of metabolic rate: What are the relative roles of cellular versus systemic effects? Biology 2015, 4, 187–199. [Google Scholar] [CrossRef] [PubMed]
- Kwak, H.S.; Im, H.G.; Shim, E.B. A model for allometric scaling of mammalian metabolism with ambient heat loss. Integr. Med. Res. 2016, 5, 30–36. [Google Scholar] [CrossRef] [PubMed]
- Norris, S. Of mice and mammoths: New approaches to understanding the biological implications of body size. BioScience 1998, 48, 887–892. [Google Scholar] [CrossRef]
- Agutter, P.S.; Wheatley, D.N. Metabolic scaling: Consensus or controversy? Theor. Biol. Med. Model. 2004, 1. [Google Scholar] [CrossRef] [PubMed] [Green Version]
- Agutter, P.S.; Tuszynski, J.A. Analytic theories of metabolic scaling. J. Exp. Biol. 2011, 214, 1055–1062. [Google Scholar] [CrossRef] [PubMed]
- Glazier, D.S. Rediscovering and reviving old observations and explanations of metabolic scaling in living systems. Systems 2018, in press. [Google Scholar]
- West, G.B.; Brown, J.H.; Enquist, B.J. A general model for the origin of allometric scaling laws in biology. Science 1997, 276, 122–126. [Google Scholar] [CrossRef] [PubMed]
- Banavar, J.R.; Maritan, A.; Rinaldo, A. Size and form in efficient transportation networks. Nature 1999, 399, 130–132. [Google Scholar] [CrossRef] [PubMed]
- Banavar, J.R.; Moses, M.E.; Brown, J.H.; Damuth, J.; Rinaldo, A.; Sibly, R.M.; Maritan, A. A general basis for quarter-power scaling in animals. Proc. Natl. Acad. Sci. USA 2010, 107, 15816–15820. [Google Scholar] [CrossRef] [PubMed]
- Dodds, P.S. On the optimal form of branching supply and collection networks. Phys. Rev. Lett. 2010, 104. [Google Scholar] [CrossRef] [PubMed]
- Banavar, J.R.; Cooke, T.J.; Rinaldo, A.; Maritan, A. Form, function, and evolution of living organisms. Proc. Natl. Acad. Sci. USA 2014, 111, 3332–3337. [Google Scholar] [CrossRef] [PubMed]
- Harrison, J.F. Do performance–safety tradeoffs cause hypometric metabolic scaling in animals? Trends Ecol. Evol. 2017, 32, 653–664. [Google Scholar] [CrossRef] [PubMed]
- Hirst, A.G.; Glazier, D.S.; Atkinson, D. Body shape-shifting during growth permits tests that distinguish between competing geometric theories of metabolic scaling. Ecol. Lett. 2014, 17, 1274–1281. [Google Scholar] [CrossRef] [PubMed]
- Glazier, D.S.; Hirst, A.G.; Atkinson, D. Shape shifting predicts ontogenetic changes in metabolic scaling in diverse aquatic invertebrates. Proc. R. Soc. B Biol. Sci. 2015, 282, 20142302. [Google Scholar] [CrossRef] [PubMed]
- Vaca, H.F.; White, C.R. Environmental modulation of metabolic allometry in ornate rainbowfish Rhadinocentrus ornatus. Biol. Lett. 2010, 6, 136–138. [Google Scholar] [CrossRef] [PubMed]
- Teissier, G. Recherches Morphologiques et Physiologiques sur la Croissance des Insectes: Thèses Presentées a la Faculté des Sciences de L’Université de Paris Pour Obtenir le Grade de Docteur ès Sciences Naturelles; Les Presses Universitaires de France: Paris, France, 1931. [Google Scholar]
- Duerr, F.G. Changes in the size-metabolic rate relationship of Lymnaea stagnalis appressa Say produced by digenetic trematode parasitism. Comp. Biochem. Physiol. 1967, 20, 391–398. [Google Scholar] [CrossRef]
- Glazier, D.S.; Butler, E.M.; Lombardi, S.A.; Deptola, T.J.; Reese, A.J.; Satterthwaite, E.V. Ecological effects on metabolic scaling: Amphipod responses to fish predators in freshwater springs. Ecol. Monogr. 2011, 81, 599–618. [Google Scholar] [CrossRef]
- McFeeters, B.J.; Xenopoulos, M.A.; Spooner, D.E.; Wagner, N.D.; Frost, P.C. Intraspecific mass-scaling of field metabolic rates of a freshwater crayfish varies with stream land cover. Ecosphere 2011, 2, 1–10. [Google Scholar] [CrossRef]
- Glazier, D.S. The 3/4-power law is not universal: Evolution of isometric, ontogenetic metabolic scaling in pelagic animals. BioScience 2006, 56, 325–332. [Google Scholar] [CrossRef]
- Killen, S.S.; Costa, I.; Brown, J.A.; Gamperl, A.K. Little left in the tank: Metabolic scaling in marine teleosts and its implications for aerobic scope. Proc. R. Soc. Lond. B 2007, 274, 431–438. [Google Scholar] [CrossRef] [PubMed]
- Killen, S.S.; Atkinson, D.; Glazier, D.S. The intraspecific scaling of metabolic rate with body mass in fishes depends on lifestyle and temperature. Ecol. Lett. 2010, 13, 184–193. [Google Scholar] [CrossRef] [PubMed]
- Brown, J.H.; Gillooly, J.F.; Allen, A.P.; Savage, V.M.; West, G.B. Toward a metabolic theory of ecology. Ecology 2004, 85, 1771–1789. [Google Scholar] [CrossRef]
- McNab, B.K. An analysis of the factors that influence the level and scaling of mammalian BMR. Comp. Biochem. Physiol. A Mol. Integr. Physiol. 2008, 151, 5–28. [Google Scholar] [CrossRef] [PubMed]
- McNab, B.K. Ecological factors affect the level and scaling of avian BMR. Comp. Biochem. Physiol. A Mol. Integr. Physiol. 2009, 152, 22–45. [Google Scholar] [CrossRef] [PubMed]
- Hulbert, A.J. A sceptics view: “Kleiber’s Law” or the “3/4 Rule” is neither a law nor a rule but rather an empirical approximation. Systems 2014, 2, 186–202. [Google Scholar] [CrossRef]
- Ivleva, I.V. The dependence of crustacean respiration rate on body mass and habitat temperature. Int. Rev. Gesamten Hydrobiol. Hydrogr. 1980, 65, 1–47. [Google Scholar] [CrossRef]
- Crab Cliparts Black #2812105. Available online: http://clipart-library.com/clipart/947704.htm (accessed on 24 January 2018).
- Drawing Fish #1416367. Available online: http://clipart-library.com/clipart/piode7j6T.htm (accessed on 24 January 2018).
- Kendeigh, S.C.; Dol’nik, V.R.; Gavrilov, V.M. Avian energetics. In Granivorous Birds in Ecosystems; Pinowski, J., Kendeigh, S.C., Eds.; Cambridge University Press: Cambridge, UK, 1977; pp. 127–204. [Google Scholar]
- Chickadee. Available online: https://pixabay.com/en/chickadee-bird-animal-wildlife-48019/ (accessed on 24 January 2018).
- Withers, P.C.; Casey, T.M.; Casey, K.K. Allometry of respiratory and haematological parameters of arctic mammals. Comp. Biochem. Physiol. A Physiol. 1979, 64, 343–350. [Google Scholar] [CrossRef]
- Fox Clipart Arctic Fox #1906. Available online: http://moziru.com/explore/Fox%20clipart%20arctic%20fox/#go_post_2942_polar-fox-clipart-19.jpg (accessed on 24 January 2018).
- Gillooly, J.F.; Brown, J.H.; West, G.B.; Savage, V.M.; Charnov, E.L. Effects of size and temperature on metabolic rate. Science 2001, 293, 2248–2251. [Google Scholar] [CrossRef] [PubMed]
- Arendt, J. Ecological correlates of body size in relation to cell size and cell number: Patterns in flies, fish, fruits and foliage. Biol. Rev. 2007, 82, 241–256. [Google Scholar] [CrossRef] [PubMed]
- Hessen, D.O.; Daufresne, M.; Leinaas, H.P. Temperature-size relations from the cellular-genomic perspective. Biol. Rev. 2013, 88, 476–489. [Google Scholar] [CrossRef] [PubMed]
- Czarnoleski, M.; Cooper, B.S.; Kierat, J.; Angilletta, M.J. Flies developed small bodies and small cells in warm and in thermally fluctuating environments. J. Exp. Biol. 2013, 216, 2896–2901. [Google Scholar] [CrossRef] [PubMed]
- Jalal, M.; Andersen, T.; Hessen, D.O. Temperature and developmental responses of body and cell size in Drosophila; effects of polyploidy and genome configuration. J. Therm. Biol. 2015, 51, 1–14. [Google Scholar] [CrossRef] [PubMed]
- Adrian, G.J.; Czarnoleski, M.; Angilletta, M.J. Flies evolved small bodies and cells at high or fluctuating temperatures. Ecol. Evol. 2016, 6, 7991–7996. [Google Scholar] [CrossRef] [PubMed]
- Hermaniuk, A.; Rybacki, M.; Taylor, J.R. Low temperature and polyploidy result in larger cell and body size in an ectothermic vertebrate. Physiol. Biochem. Zool. 2016, 89, 118–129. [Google Scholar] [CrossRef] [PubMed]
- Czarnoleski, M.; Labecka, A.M.; Starostová, Z.; Sikorska, A.; Bonda-Ostaszewska, E.; Woch, K.; Kubička, L.; Kratochvíl, L.; Kozlowski, J. Not all cells are equal: Effects of temperature and sex on the size of different cell types in the Madagascar ground gecko Paroedura picta. Biol. Open 2017, 6, 1149–1154. [Google Scholar] [CrossRef] [PubMed]
- Kierat, J.; Szentgyörgyi, H.; Czarnoleski, M.; Woyciechowski, M. The thermal environment of the nest affects body and cell size in the solitary red mason bee (Osmia bicornis L.). J. Therm. Biol. 2017, 68, 39–44. [Google Scholar] [CrossRef] [PubMed]
- Davison, J. An analysis of cell growth and metabolism in the crayfish (Procambarus alleni). Biol. Bull. 1956, 110, 264–273. [Google Scholar] [CrossRef]
- Szarski, H. Cell size and the concept of wasteful and frugal evolutionary strategies. J. Theor. Biol. 1983, 105, 201–209. [Google Scholar] [CrossRef]
- Gregory, T.R. A bird’s-eye view of the C-value enigma: Genome size, cell size, and metabolic rate in the class Aves. Evolution 2002, 56, 121–130. [Google Scholar] [CrossRef] [PubMed]
- Starostová, Z.; Kubička, L.; Kozłowski, J.; Konarzewski, M.; Kratochvíl, L. Cell size but not genome size affects scaling of metabolic rate in eyelid geckos. Am. Nat. 2009, 174, E100–E105. [Google Scholar] [CrossRef] [PubMed]
- Maciak, S.; Janko, K.; Kotusz, J.; Choleva, L.; Boroń, A.; Juchno, D.; Kujawa, R.; Kozlowski, J.; Konarzewski, M. Standard metabolic rate (SMR) is inversely related to erythrocyte and genome size in allopolyploid fish of the Cobitis taenia hybrid complex. Funct. Ecol. 2011, 25, 1072–1078. [Google Scholar] [CrossRef]
- Huang, Q.; Zhang, Y.; Liu, S.; Wang, W.; Luo, Y. Intraspecific scaling of the resting and maximum metabolic rates of the crucian carp (Carassius auratus). PLoS ONE 2013, 8, e82837. [Google Scholar] [CrossRef] [PubMed]
- Maciak, S.; Bonda-Ostaszewska, E.; Czarnoleski, M.; Konarzewski, M.; Kozlowski, J. Mice divergently selected for high and low basal metabolic rates evolved different cell size and organ mass. J. Evol. Biol. 2014, 27, 478–487. [Google Scholar] [CrossRef] [PubMed]
- Zhang, Y.; Huang, Q.; Liu, S.; He, D.; Wei, G.; Luo, Y. Intraspecific mass scaling of metabolic rates in grass carp (Ctenopharyngodon idellus). J. Comp. Physiol. B 2014, 184, 347–354. [Google Scholar] [CrossRef] [PubMed]
- Hermaniuk, A.; Rybacki, M.; Taylor, J.R. Metabolic rate of diploid and triploid Edible Frog Pelophylax esculentus correlates inversely with cell size in tadpoles but not in frogs. Physiol. Biochem. Zool. 2017, 90, 230–239. [Google Scholar] [CrossRef] [PubMed]
- Crispin, T.S.; White, C.R. Effect of thermal acclimation on organ mass, tissue respiration, and allometry in Leichhardtian River prawns Macrobrachium tolmerum (Riek, 1951). Physiol. Biochem. Zool. 2013, 86, 470–481. [Google Scholar] [CrossRef] [PubMed] [Green Version]
- Herreid, C.F.; Kessel, B. Thermal conductance in birds and mammals. Comp. Biochem. Physiol. 1967, 21, 405–414. [Google Scholar] [CrossRef]
- Lasiewski, R.C.; Weathers, W.W.; Bernstein, M.H. Physiological responses of the giant hummingbird, Patagona gigas. Comp. Biochem. Physiol. 1967, 23, 797–813. [Google Scholar] [CrossRef]
- Bradley, S.R.; Deavers, D.R. A re-examination of the relationship between thermal conductance and body weight in mammals. Comp. Biochem. Physiol. A Physiol. 1980, 65, 465–476. [Google Scholar] [CrossRef]
- Aschoff, J. Thermal conductance in mammals and birds: Its dependence on body size and circadian phase. Comp. Biochem. Physiol. A Physiol. 1981, 69, 611–619. [Google Scholar] [CrossRef]
- Schleucher, E.; Withers, P.C. Re-evaluation of the allometry of wet thermal conductance for birds. Comp. Biochem. Physiol. A Mol. Integr. Physiol. 2001, 129, 821–827. [Google Scholar] [CrossRef]
- Withers, P.C.; Cooper, C.E.; Larcombe, A.N. Environmental correlates of physiological variables in marsupials. Physiol. Biochem. Zool. 2006, 79, 437–453. [Google Scholar] [CrossRef] [PubMed]
- Fristoe, T.S.; Burger, J.R.; Balk, M.A.; Khaliq, I.; Hof, C.; Brown, J.H. Metabolic heat production and thermal conductance are mass-independent adaptations to thermal environment in birds and mammals. Proc. Nat. Acad. Sci. USA 2015, 112, 15934–15939. [Google Scholar] [CrossRef] [PubMed]
- Rezende, E.L.; Bacigalupe, L.D. Thermoregulation in endotherms: Physiological principles and ecological consequences. J. Comp. Physiol. B 2015, 185, 709–727. [Google Scholar] [CrossRef] [PubMed]
- Kooijman, S.A.L.M. Dynamic Energy and Mass Budgets in Biological Systems; Cambridge University Press: Cambridge, UK, 2000. [Google Scholar]
- Kleiber, M. Body size, conductance for animal heat flow and Newton’s law of cooling. J. Theor. Biol. 1972, 37, 139–150. [Google Scholar] [CrossRef]
- Porter, W.P.; Kearney, M. Size, shape, and the thermal niche of endotherms. Proc. Nat. Acad. Sci. USA 2009, 106 (Suppl. 2), 19666–19672. [Google Scholar] [CrossRef] [PubMed]
- Heldmaier, G. Cold-adaptive changes of heat production in mammals. In Proceedings of the International Symposium on Environmental Physiology: Bioenergetics; Smith, R.E., Hannon, J.P., Shields, J.L., Horwitz, B.A., Eds.; Federation of American Societies for Experimental Biology: Bathesda, MD, USA, 1972; pp. 79–82. [Google Scholar]
- Rezende, E.L.; Swanson, D.L.; Novoa, F.F.; Bozinovic, F. Passerines versus nonpasserines: So far, no statistical differences in the scaling of avian energetics. J. Exp. Biol. 2002, 205, 101–107. [Google Scholar] [PubMed]
- White, C.R.; Seymour, R.S. Allometric scaling of mammalian metabolism. J. Exp. Biol. 2005, 208, 1611–1619. [Google Scholar] [CrossRef] [PubMed] [Green Version]
- Glazier, D.S. Effects of metabolic level on the body size scaling of metabolic rate in birds and mammals. Proc. R. Soc. B 2008, 275, 1405–1410. [Google Scholar] [CrossRef] [PubMed]
- White, C.R.; Kearney, M.R.; Matthews, P.G.; Kooijman, S.A.; Marshall, D.J. A manipulative test of competing theories for metabolic scaling. Am. Nat. 2011, 178, 746–754. [Google Scholar] [CrossRef] [PubMed] [Green Version]
- Kearney, M.R.; White, C.R. Testing metabolic theories. Am. Nat. 2012, 180, 546–565. [Google Scholar] [CrossRef] [PubMed] [Green Version]
- Glazier, D.S. Is metabolic rate a universal “pacemaker” for biological processes? Biol. Rev. 2015, 90, 377–407. [Google Scholar] [CrossRef] [PubMed]
- Verberk, W.C.; Atkinson, D. Why polar gigantism and Palaeozoic gigantism are not equivalent: Effects of oxygen and temperature on the body size of ectotherms. Funct. Ecol. 2013, 27, 1275–1285. [Google Scholar] [CrossRef] [Green Version]
- Hoque, A.T.M.R.; Sharma, S.; Suwa, R.; Mori, S.; Hagihara, A. Seasonal variation in the size-dependent respiration of mangroves Kandelia obovata. Mar. Ecol. Prog. Ser. 2010, 404, 31–37. [Google Scholar] [CrossRef]
- Roy, A. Analyse des facteurs du taux de metabolism chez la limace Arion circumscriptus. Rev. Can. Biol. 1969, 28, 33–43. [Google Scholar] [PubMed]
- Al-Sadoon, M.K.; Abdo, N.M. Temperature and body mass effects on the metabolic rate of Acanthodactylus schmidti Weigmann (Reptilia: Lacertidae). J. Arid Environ. 1991, 21, 351–361. [Google Scholar]
- Weldon, C.W.; Daniels, S.R.; Clusella-Trullas, S.; Chown, S.L. Metabolic and water loss rates of two cryptic species in the African velvet worm genus Opisthopatus (Onychophora). J. Comp. Physiol. B 2013, 183, 323–332. [Google Scholar] [CrossRef] [PubMed]
- Glazier, D.S. Ontogenetic body-mass scaling of resting metabolic rate covaries with species-specific metabolic level and body size in spiders and snakes. Comp. Biochem. Physiol. A Mol. Integr. Physiol. 2009, 153, 403–407. [Google Scholar] [CrossRef] [PubMed]
- Glazier, D.S. Activity affects intraspecific body-size scaling of metabolic rate in ectothermic animals. J. Comp. Physiol. B 2009, 179, 821–828. [Google Scholar] [CrossRef] [PubMed]
- Carey, N.; Sigwart, J.D.; Richards, J.G. Economies of scaling: More evidence that allometry of metabolism is linked to activity, metabolic rate and habitat. J. Exp. Mar. Biol. Ecol. 2013, 439, 7–14. [Google Scholar] [CrossRef]
- Patterson, M.R. A mass transfer explanation of metabolic scaling relationships in some aquatic invertebrates and algae. Science 1992, 255, 1421–1423. [Google Scholar] [CrossRef] [PubMed]
- Von Bertalanffy, L. Basic concepts in quantitative biology of metabolism. Helgol. Wiss. Meeresunters. 1964, 9, 5–37. [Google Scholar] [CrossRef]
- Hart, J.S. Rodents. In Comparative Physiology of Thermoregulation: Volume II Mammals; Whittow, G.C., Ed.; Academic Press: New York, NY, USA, 1971; pp. 1–149. [Google Scholar]
- Ikeda, T. Relationship between respiration rate and body size in marine plankton animals as a function of the temperature of habitat. Bull. Fac. Fish. Hokkaido Univ. 1970, 21, 91–112. [Google Scholar]
- Uye, S.I.; Yashiro, M. Respiration rates of planktonic crustaceans from the Inland Sea of Japan with special reference to the effects of body weight and temperature. J. Oceanogr. 1988, 44, 47–51. [Google Scholar] [CrossRef]
- Carey, N.; Sigwart, J.D. Size matters: Plasticity in metabolic scaling shows body-size may modulate responses to climate change. Biol. Lett. 2014, 10, 20140408. [Google Scholar] [CrossRef] [PubMed]
- Dame, R.F. The ecological energies of growth, respiration and assimilation in the intertidal American oyster Crassostrea virginica. Mar. Biol. 1972, 17, 243–250. [Google Scholar] [CrossRef]
- Read, K.R.H. Respiration of the bivalved molluscs Mytilus edulis L. and Brachidontes demissus plicatulus Lamarck as a function of size and temperature. Comp. Biochem. Physiol. 1962, 7, 89–101. [Google Scholar] [CrossRef] [PubMed]
- Haure, J.; Penisson, C.; Bougrier, S.; Baud, J.P. Influence of temperature on clearance and oxygen consumption rates of the flat oyster Ostrea edulis: Determination of allometric coefficients. Aquaculture 1998, 169, 211–224. [Google Scholar] [CrossRef]
- Jiang, A.; Guo, J.; Cai, W.; Wang, C. Oxygen consumption of the ascidian Styela clava in relation to body mass, temperature and salinity. Aquac. Res. 2008, 39, 1562–1568. [Google Scholar] [CrossRef]
- Ohlberger, J.; Staaks, G.; Hölker, F. Effects of temperature, swimming speed and body mass on standard and active metabolic rate in vendace (Coregonus albula). J. Comp. Physiol. B 2007, 177, 905–916. [Google Scholar] [CrossRef] [PubMed]
- Heusner, A.A. Energy metabolism and body size II. Dimensional analysis and energetic non-similarity. Respir. Physiol. 1982, 48, 13–25. [Google Scholar] [CrossRef]
- Da Silva, J.K.L.; Garcia, G.J.; Barbosa, L.A. Allometric scaling laws of metabolism. Phys. Life Rev. 2006, 3, 229–261. [Google Scholar] [CrossRef]
- Lovegrove, B.G. The zoogeography of mammalian basal metabolic rate. Am. Nat. 2000, 156, 201–219. [Google Scholar] [CrossRef] [PubMed]
- Clarke, A.; Rothery, P.; Isaac, N.J.B. Scaling of basal metabolic rate with body mass and temperature in mammals. J. Anim. Ecol. 2010, 79, 610–619. [Google Scholar] [CrossRef] [PubMed]
- Kozłowski, J.; Konarzewski, M. West, Brown and Enquist’s model of allometric scaling again: The same questions remain. Funct. Ecol. 2005, 19, 739–743. [Google Scholar] [CrossRef]
- Makarieva, A.M.; Gorshkov, V.G.; Li, B.-L. A note on metabolic rate dependence on body size in plants and animals. J. Theor. Biol. 2003, 221, 301–307. [Google Scholar] [CrossRef] [PubMed]
- Von Bertalanffy, L.; Pirozynski, W.J. Tissue respiration, growth, and basal metabolism. Biol. Bull. 1953, 105, 240–256. [Google Scholar] [CrossRef]
- Chaui-Berlinck, J.G.; Navas, C.A.; Monteiro, L.H.A.; Bicudo, J.E.P.W. Control of metabolic rate is a hidden variable in the allometric scaling of homeotherms. J. Exp. Biol. 2005, 208, 1709–1716. [Google Scholar] [CrossRef] [PubMed]
- Suarez, R.K. Energy and metabolism. Compr. Physiol. 2012, 2, 2527–2539. [Google Scholar] [CrossRef] [PubMed]
- Jastroch, M.; Giroud, S.; Barrett, P.; Geiser, F.; Heldmaier, G.; Herwig, A. Seasonal control of mammalian energy balance: Recent advances in the understanding of daily torpor and hibernation. J. Neuroendocrinol. 2016, 28. [Google Scholar] [CrossRef] [PubMed]
- Chamberlin, T.C. The method of multiple working hypotheses. Science 1965, 148, 754–759. [Google Scholar] [CrossRef] [PubMed]
- Van der Meer, J. Metabolic theories in ecology. Trends Ecol. Evol. 2006, 21, 136–140. [Google Scholar] [CrossRef] [PubMed]
- Isaac, N.J.; Carbone, C. Why are metabolic scaling exponents so controversial? Quantifying variance and testing hypotheses. Ecol. Lett. 2010, 13, 728–735. [Google Scholar] [CrossRef] [PubMed]
- Luo, Y.; He, D.; Li, G.; Xie, H.; Zhang, Y.; Huang, Q. Intraspecific metabolic scaling exponent depends on red blood cell size in fishes. J. Exp. Biol. 2015, 218, 1496–1503. [Google Scholar] [CrossRef] [PubMed]


© 2018 by the author. Licensee MDPI, Basel, Switzerland. This article is an open access article distributed under the terms and conditions of the Creative Commons Attribution (CC BY) license (http://creativecommons.org/licenses/by/4.0/).
Share and Cite
Glazier, D.S. Effects of Contingency versus Constraints on the Body-Mass Scaling of Metabolic Rate. Challenges 2018, 9, 4. https://doi.org/10.3390/challe9010004
Glazier DS. Effects of Contingency versus Constraints on the Body-Mass Scaling of Metabolic Rate. Challenges. 2018; 9(1):4. https://doi.org/10.3390/challe9010004
Chicago/Turabian StyleGlazier, Douglas S. 2018. "Effects of Contingency versus Constraints on the Body-Mass Scaling of Metabolic Rate" Challenges 9, no. 1: 4. https://doi.org/10.3390/challe9010004
APA StyleGlazier, D. S. (2018). Effects of Contingency versus Constraints on the Body-Mass Scaling of Metabolic Rate. Challenges, 9(1), 4. https://doi.org/10.3390/challe9010004