
Polarizing Topics on Twitter in the 2022 United States Elections


Department of Information and Communication Sciences, Faculty of Humanities and Social Sciences, University of Zagreb, 10000 Zagreb, Croatia
*
Author to whom correspondence should be addressed.
Information 2023, 14(11), 609; https://doi.org/10.3390/info14110609
Submission received: 5 September 2023
/
Revised: 15 October 2023
/
Accepted: 18 October 2023
/
Published: 10 November 2023
(This article belongs to the Special Issue 2nd Edition of Information Retrieval and Social Media Mining)
Abstract
:Politically polarizing issues are a growing concern around the world, creating divisions along ideological lines, which was also confirmed during the 2022 United States midterm elections. The purpose of this study was to explore the relationship between the results of the 2022 U.S. midterm elections and the topics that were covered during the campaign. A dataset consisting of 52,688 tweets in total was created by collecting tweets of senators, representatives and governors who participated in the elections one month before the start of the elections. Using unsupervised machine learning, topic modeling is built on the collected data and visualized to represent topics. Furthermore, supervised machine learning is used to classify tweets to the corresponding political party, whereas sentiment analysis is carried out in order to detect polarity and subjectivity. Tweets from participating politicians, U.S. states and involved parties were found to correlate with polarizing topics. This study hereby explored the relationship between the topics that were creating a divide between Democrats and Republicans during their campaign and the 2022 U.S. midterm election outcomes. This research found that polarizing topics permeated the Twitter (today known as X) campaign, and that all elections were classified as highly subjective. In the Senate and House elections, this classification analysis showed significant misclassification rates of 21.37% and 24.15%, respectively, indicating that Republican tweets often aligned with traditional Democratic narratives.
1. Introduction
In today’s rapidly evolving digital age, social media platforms, particularly X (previously known as Twitter), have become formidable forces in shaping public opinion and influencing electoral outcomes [1]. The sheer immediacy and virality of X messages have transformed political communication, making it more direct, candid, and often confrontational. But along with its potential for democratizing political discourse, X has inadvertently provided a breeding ground for echo chambers and polarization. Challenges such as the spread of misinformation, the blurring lines between facts and opinions, and the difficulty in discerning genuine sentiments from orchestrated campaigns make this a critical area of study. It is against this backdrop that this research becomes particularly relevant. By understanding these dynamics, the authors of this paper aim to shed light on the interplay between social media discourse and real-world political outcomes, potentially offering insights for future electoral strategies and counter-polarization efforts.
According to Wakefield and Wakefield [2], social media platforms support the gathering of like-minded users, and polarization in this context occurs when users prefer to interact with like-minded users, which reinforces one group’s prevailing ideas and beliefs, creating so-called echo chambers. Polarization within American politics is intensifying over a wide range of issues. While traditional battles over the size and role of the government remain, sociocultural battles over religious freedom, gun control, immigration, gay marriage and abortion have increased. Polarization is not a new phenomenon, nor is it unique to the American political landscape; however, it is increasingly prevalent in the U.S. context [3]. X posts also have an impact on other media outlets, as Shapiro and Hemphill [4] note in their research, where they demonstrated that X is a legitimate political communication platform for elected officials that journalists consider in their media coverage. This approach can amplify media reporting based on X posts reaching far beyond their organic scope within the X platform, where they would otherwise only be shown to followers associated with the X (Twitter) accounts sharing a particular tweet.
In this paper, the focus was on the 2022 United States midterm elections that were held on November 8 with three separate elections—United States Senate elections (shorter: Senate), United States House of Representatives elections (shorter: House) and United States Gubernatorial elections (shorter: Gubernatorial). In the race during the Senate elections, there was a change by one seat in favor of Democrats in Pennsylvania. Out of a total of 435 seats, the Republican Party did take control of the House, earning a slim majority of 222 seats, whereas the Democratic Party took 213 seats. In the race for governors, Democrats picked up three seats—in Arizona, Maryland and Massachusetts—while losing one seat in Nevada [5]. The vast majority of candidates from the Republican and Democratic Party actively used the X platform to post announcements and to state political views during their campaigns, covering various topics in their political communication to the potential electorate. Tweets from Democratic and Republican candidates that were part of these elections were collected and processed for this research.
The aim of this research was to detect and identify the polarizing topics on X (formerly known as Twitter) based on a collected dataset, and by using various machine learning (ML) and natural language processing (NLP) techniques, such as topic modeling, sentiment analysis and text classification.
This paper is structured as follows. The introductory section highlights the motivation for this research and provides initial information regarding the 2022 United States elections. Related work that focuses on polarization in politics is presented in Section 2. This research is discussed in Section 3, whereas the research methodology is described in Section 3.1. The process of data collection together with an analysis of the collected tweets is presented in Section 3.2. Party affiliation classification is explored in Section 3.3, whereas sentiment analysis for each of the elections is presented and visualized by displaying the states in Section 3.4. Topic modeling, along with the detection of polarizing topics, is analyzed in Section 3.5, while elections topics for flipped seats are presented in Section 3.6. This study’s findings are presented and discussed in detail in Section 4, and the conclusions are given in Section 5, along with ideas for future research.
2. Related Work
Conover et al. [6] state that the content of political discourse on X remains highly partisan, with many messages containing sentiments more extreme than expected in face-to-face interactions, while the content frequently disparages identities and views associated with users across the partisan divide.
Hong and Kim [7] note in their research the evidence of greater political polarization on social media. They argue that this can have implications for the practice of governments’ social media use for informing citizens. Political polarization on X appears to increase with the intensive clustering of the same content among the supporters of the parties.
The fact that politicians and political groups from many political philosophies use X appears to exacerbate divisiveness, which was shown by Yegen et al. [8].
Osmundsen et al. [9] suggest in their findings that sharing fake news relates to the increasingly polarized political debates in the United States, and that fake news are shaped by offline realities. On the other hand, they also point out that reputational concerns explain the low prevalence of fake news because of the risk associated with reputation when sharing information from non-credible sources.
Masroor et al. [10] explored positive self-presentation in the context of creating polarization between “us” and “them” as an invitation “to join us”. They have carried out a frequency distribution analysis of pronouns on X, such as “I”, “me”, “we”, “us”, “our”, “them”, and “they”, along with the corresponding context analysis. The pronouns that seem to reflect positive self-presentation are observed to be “we”, “us”, and “our”. In these tweets, they found polarization strategies of using the words “us” and “them” in order to legitimize their in-group ideologies in comparison with the out-group and for serving their political interests.
Research by Du and Gregory [11] shows that when similarity is based on interests or opinions, users tend to be more strongly connected to others with similar interests, and isolated from those with different interests or opposing viewpoints. Because of that, contrary to previously mentioned research, they note that it may be argued that even if X communities become more polarized over time, this might not be caused by the platform itself. The X network may be converging over time to an underlying real-world network which is already highly polarized. Even so, X provides mechanisms to reflect and enhance this polarization, unlike traditional media and communication methods, which might tend to reduce it.
Grover et al. [12] have proposed a comprehensive framework that underscores the importance of data tracking, monitoring, and analytics in the realm of political discourse on social media platforms, particularly X. Their methodology emphasizes the identification and extraction of data streams that are rich in relevant content, ensuring that the collected data have the potential for meaningful insights. The approach that they propose ensures that researchers move from targeted data collection to deep content and sentiment analysis, transforming vast X data into actionable and insightful information.
Flamino et al. [13] have analyzed the 2016 and 2020 U.S. presidential elections and have stated that X users increasingly align with and share information from sources that reflect their own beliefs while distancing themselves from opposing views. Over time, this leads to distinct echo chambers in which users are primarily exposed to information that reinforces their pre-existing beliefs. As this separation intensifies, it can diminish the possibility of constructive dialogue between opposing ideological groups, further entrenching divides in the broader society.
A similar study was carried out by Bor et al. [14], where the authors gathered tweets from members of the U.S. House of Representatives and the Senate over a defined period (from January 2021 to December 2022). The data included the textual content of tweets, the posting date, and interactions such as likes and retweets. The researchers employed an n-gram feature extraction technique to decipher the prevalent topics in the dataset. Using sentiment analysis tools, the authors classified tweets into key policy-related terms and examined statistical differences in sentiment across political groupings.
Perhaps the research closest to this very paper was carried out by Ausubel [15], who analyzed X posts from House candidates in the 2018 U.S. midterm elections. The author went over major issues during the campaigns of both parties (Republicans and Democrats) where topics such as economy, healthcare and immigration were covered. His results provide overwhelming evidence of political polarization, where hardly any significant overlap of Democratic and Republican candidates was observed when covering previously mentioned topics. In addition to polarization, the author states that even their word choices are revealing. Namely, Democrats and Republicans oftentimes used very different terms to refer to the same issues (e.g., Affordable Care Act (ACA) vs. Obamacare).
3. Research
This entire section presents the research, whereas the research methodology is explained along with the usage of Python libraries in Section 3.1. The processes of data collection and analysis of the collected tweets are described with the corresponding rules imposed on the candidates in Section 3.2. Classification of the tweets based on party affiliation is presented in Section 3.3. Sentiment analysis for each election with visualization is carried out in Section 3.4. The results of topic modeling are analyzed in Section 3.5., whereas the detected topics for the flipped seats are discussed in Section 3.6.
3.1. Methodology
The inherent structure of the 2022 United States midterm elections held on November 8 with three separate elections (Senate, House and Gubernatorial) required coverage and methodologies that were repeatable across all elections. Data collection was carried out on the X social network (formerly known as Twitter) by using the Python Tweepy library for accessing the X API. The tweets of senators, representatives and governors who participated in the elections were collected one month before the start of the elections, i.e., from 8 October to 8 November 2022. Access to historical data was achieved through Academic Research access provided by X. Party election classification was used to create a binary classification, where each tweet was classified as Democrat or Republican by classifying its tweet content. Multinomial Naïve Bayes (MNB) was selected as a model for training and testing. MNB belongs to the set of Naïve Bayes (NB) classification algorithms and, as such, is a specialized version of Naïve Bayes. “Multinomial” in the context of MNB allows features to follow a multinomial distribution, with multiple features/words for text classification.
One of the advantages of MNB is that it gives good results when there are not enough data [16]. By using the TextBlob Python library, whose implementation of sentiment analysis shows an accuracy of 89.32% according to Suanpang et al. [17], sentiment was extracted for each election, as well as for Democrats and Republicans within those elections. The focus of sentiment analysis was to reveal polarity and subjectivity. The polarity and subjectivity values, as extracted using the TextBlob Python library, are standardized measures used in sentiment analysis.
The polarity scale ranges between −1 and 1, where −1 represents an extremely negative sentiment that would include words such as “terrible”, “disgusting” and “distressing”, whereas 1 represents an extremely positive sentiment with words such as “superb”, “excellent” and “greatest”. These values are not arbitrarily chosen but are grounded in the way TextBlob and underlying libraries measure sentiment.
Subjectivity lies between 0 and 1, where 0 means objective, and is expressed with words such as “house”, “work” and “community”, whereas 1 reflects extremely subjective words, such as “shocking”, “extreme” and “pleased”. As in polarity, subjectivity values are grounded in the way TextBlob and its underlying libraries measure sentiment.
These values are not associated with any categorical variable but rather provide a continuous measure, allowing for finer granularity and detail in sentiment analysis. The thresholds defined are a convention in sentiment analysis using TextBlob, ensuring consistency and comparability across the studies that utilize this tool.
To compare the results with TextBlob, the VADER Python library was selected, as it also utilizes a polarity scale ranging from −1 to 1. According to Bonta et al. [18], VADER is a lexicon- and rule-based sentiment analysis tool. It uses a combination of a sentiment lexicon, a list of lexical features which are generally labeled according to their semantic orientation as either positive or negative. TextBlob is, according to Fadhli [19], a rule-based sentiment analysis library that focuses on lexical content and integrates the WordNet corpus for sentiment analysis.
Research carried out by Min and Zulkarnain [20], where experts in psychology and human development were involved for setting up the ground truth on tweets, concluded that VADER has a higher accuracy of 0.79% as compared to TextBlob, which has an accuracy of 0.73%. Since VADER does not offer a subjectivity score [21], it was utilized solely for polarity comparison purposes. Data manipulation and analysis was carried out by using the Python Pandas open-source library. The visualization of sentiment analysis data was carried out using the Plotly Express Python visualization library, which allows the data for each state that was part of the election to display their corresponding value. Topic modeling was carried out using the Gensim open-source Python library with their implementation of Latent Dirichlet Allocation (LDA), creating a three-step process that involved the loading of the dataset, preprocessing and topic modeling. As reported by Anwar et al. [22], the LDA implementation via the Gensim library achieved an accuracy of 93.17%. The topic clusters were visualized using a lollipop chart with the help of the Matplotlib Python visualization library. During preprocessing, the removal of stop words was achieved using the NLTK Python library, while the general schema of this paper was visualized using the NetworkX Python library.
According to Jelodar et al. [23], LDA is a prominent technique in topic modeling, crucial for text mining, latent data discovery, and analyzing relationships in text documents. It assumes that documents are generated by picking a distribution over topics and then selecting specific words from those topics. The primary function of LDA is to identify hidden topics in large text collections, making it a valuable tool across various fields, including software engineering, political science, and medical research [24].
In the methodology for topic modeling, the authors of this very paper were inspired by previous studies that have successfully leveraged LDA for analyzing large-scale social network data and natural language processing. One particularly relevant example is a comprehensive study on the Japanese X political field, which combined social network analysis with LDA to decipher patterns of political polarization and community behaviors [25]. Such applications of LDA in the domain of political science and social media research underscore its effectiveness in capturing latent topics and revealing underlying community dynamics.
A comparable study exploring exchanges on X related to Brexit events—the UK referendum of 2016 and the 2017 UK snap election [26]—utilized metrics such as the Gini coefficient, retweet ratio, favorite ratio, and cross-group interactions to assess user influence and the spread of polarizing content. Notably, their findings underscored that during times of polarized discourse, content from influential ‘top tier’ users or ‘influencers’ received disproportionately increased attention, possibly shaping the narrative that way. Similar dynamics might be observable in the U.S. context, where polarizing topics during the midterm elections may have been driven or amplified by influential voices on X.
In comparison to the study of affective polarization following the Brexit referendum [27], this very research uses Latent Dirichlet Allocation (LDA) for topic modeling that is aimed at detecting topics and potential polarization in text-based data, while the referenced study analyzes survey-based data focusing on people’s attitudes, perceived identities, and biases related to Brexit. The Python library pyLDAvis was used to visualize LDA topic models to gain relevant insights into topics. The output of this process was topic clusters sorted by size and analyzed for all three elections. From the 10 largest topic clusters based on each individual election, the corresponding topics were extracted and analyzed. When observing the election outcomes, only the three largest topic clusters from flipped states were extracted due to the small number of tweets for that particular race.
To provide a clearer and more organized overview of the Python libraries employed for various tasks in this research, the authors have summarized them in Table 1. This table highlights the primary function of each library and the specific task it was used for.
This paper’s methodology for analyzing the tweets surrounding the 2022 United States midterm elections comprises processes that encapsulate several stages, each associated with specific tasks and algorithms. The central goal is to understand the sentiment, to classify the political leaning, and to visualize topics discussed during the period of elections. In order to provide a visual grasp of the entire process, Figure 1 illustrates a flowchart diagram for each stage, its associated tasks, and their interconnections.
3.2. Data Collection and Analysis of Collected Tweets
While collecting tweets through the Python Tweepy library, some rules were imposed on the candidates in the elections:
- Party affiliation—only Democrats and Republicans were selected; any other party and their tweets were excluded if they were not part of one of the two;
- X profile—if there was no X profile, or the profile could not be verified as valid, the candidate was excluded from the search;
- Number of tweets—if there were no tweets in the period of one month before the start of the elections, the profile was excluded;
- Candidate presence—all candidates (Republicans and Democrats) had to be present for the state or district to be included in the search; therefore, some of the states/districts are not present in the collected dataset.
After imposing rules on candidates to compile valid profiles, retweets and replies were also excluded from data collection. Retweets were excluded so that only tweets that are created by the author were collected and stored in the dataset. In addition, replies were excluded so as not to create a large volume of tweets that are potentially unrelated to the original tweet topic.
After the initial data collection, the next step was data preprocessing and cleaning to ensure the quality and relevance of the tweets for subsequent analyses. Steps that were employed included the following:
- Text cleaning: given the nature of social media language, tweets were processed in order to remove any URLs, hashtags, mentions, and non-alphanumeric characters. This step ensures that the text data are readable and devoid of unnecessary distractions.
- Lowercasing: all tweets were converted to lowercase to maintain consistency and avoid duplication based on case differences.
- Stop words removal: commonly used words (e.g., “and”, “the”, “is”) that do not carry significant meaning for text analyses were removed from the dataset.
- Removal of duplicates: all duplicate tweets, which can skew analysis results, were identified and removed to maintain the uniqueness of the dataset.
For the purpose of classifying the tweets of Democrats and Republicans, the annotated dataset “Democrat Vs. Republican Tweets” [28] accessed through Kaggle was used to train and to test the classifier.
The tweets were collected into three separate categories relating to senators, representatives and governors with a total of 52,688 tweets. The number of tweets collected for each election (Table 2) corresponds as expected to the size of the election, with the House election being the largest of the three.
Each tweet posted by a candidate in the election was also associated with the political party affiliation (Democrats or Republicans). When comparing the number of tweets by election (Table 3), it is observable that Democrats were more active on X within all elections.
Retweets, replies, likes and quotes were also collected for all tweets, with Table 4 showing a large number of Twitter interactions for each election.
For classifier training and testing, the dataset “Democrat Vs. Republican Tweets” was used, which contains 433 unique X profiles, and each profile is associated with a party affiliation along with the corresponding tweets. The dataset contains a total of 86,460 tweets, with the most recent tweets collected on 17 May 2018 from these X users. As shown in Table 5, the corresponding dataset is well balanced between Democrats and Republicans, which is desirable in classification tasks.
3.3. Party Election Classification
Text classification is one of the most important and typical tasks in supervised machine learning [29]. According to Dogra et al. [30], text classification is defined as assigning one or more categories (also known as labels) to text documents according to their content and semantics. Automation of text classification models is part of everyday life nowadays, as it is commonly used in, e.g., spam detection, language recognition or movie review classification [31,32].
For party election classification, MNB was chosen. MNB is especially suitable for datasets where features have discrete frequency counts. Given that, in this context, tweets often contain recurring words or phrases aligned with political affiliations, the frequency-based nature of MNB makes it a suitable choice [33].
While other advanced algorithms like Support Vector Machines (SVM) or deep learning methods like Convolutional Neural Networks (CNN) have gained traction in text classification tasks, they often require more computational resources and intricate tuning [34,35]. Moreover, deep learning methods especially necessitate larger datasets to effectively generalize and avoid overfitting.
Given the dataset and the objectives of this study, selecting MNB provided an efficient method for party election classification. The utilization of more intricate algorithms was considered but ultimately deemed unnecessary due to the adequacy and reliability of MNB in addressing the research objectives while maintaining computational efficiency and simplicity.
Training and testing of the MNB model were carried out by using the data shown in Table 4; preprocessing was performed by removing special characters and stop words and by tokenizing each tweet. Table 6 presents the results for the MNB, where the accuracy of the MNB model was 83.05%, precision was 90.74%, and recall was 79.87%, while the F1 score was 84.94%.
When comparing the MNB model to the SVM model (as shown in Table 7), it is evident that the SVM model performed slightly better in terms of accuracy and F1 score. The accuracy of the SVM model was 86.75%, its precision was 88.60%, and the recall stood at 84.70%. The F1 score for the SVM model was 86.61%. Even with these metrics leaning towards SVM, the MNB model is computationally less intensive compared to SVM, leading to quicker training and prediction times. SVM model decisions are based on the likelihoods derived from the training data, making these relatively interpretable. This enables us to easily inspect which features (words, in the case of tweets) are most influential in driving predictions.
When classifying Senate election tweets, Table 8 shows a 16.81% increase when classifying Democrat tweets, and a 21.37% decrease when classifying Republican tweets. These results imply that in the Senate elections, a substantial number of tweets from Republicans were classified as tweets from Democrats.
Based on the trained MNB classifier, for the Gubernatorial election (Table 9), an increase of 14.06% in Republicans tweets can be observed, while Democrats have a 6.67% decrease in the number of their tweets. This was in contrast to the Senate elections, where there was a decrease for Republicans, while Democrats saw an increase in their number.
For the House elections, the classification of tweets based on the MNB classifier shows an increase in the number of tweets for the Democrats of 17.48%, while the tweets of the Republicans recorded a decrease of 24.15% (as shown in Table 10). This was also the largest percentage increase and decrease compared to other elections.
3.4. Sentiment Analysis of Elections
Sarlan et al. [36] state that sentiment analysis refers to a general method of extracting polarity and subjectivity from semantic orientation, which refers to the strength of words and polarity of text or phrases. In the context of sentiment analysis of elections, Chaudhry et al. [37] note the limitations of detecting sarcasm.
In some cases, negative sentiments are classified as positive due to specific writing styles. To address contextualized sarcasm detection on X, Bamman and Smith [38] recommend the application of tweet features to increase baseline accuracy by using word unigrams and bigrams to create the most indicative word unigrams and bigrams for sarcasm. They have also shown that author features, such as historical salient terms and historical topics, can increase the accuracy of sarcasm detection. Here, it is observable that both approaches, based on tweet or author features, require manual work with a binary indicator, and are not appropriate for larger datasets.
Seljan et al. [32] point out the role of n-grams, word lists and terminology extraction in order to obtain an insight into the semantic content. Ebrahimi et al. [39] state that dealing with sarcasm in a sentiment analysis task is an open research issue that requires more work, especially on how to deal with sarcastic tweets in the context of training and prediction phases. Even with all the challenges, sentiment analysis is an important part of providing useful insights into how political conversations during major events are conducted on a social platform like X [40].
Table 11 provides details on the conducted sentiment analysis on X for all three elections, with an average of 0.16341 for polarity and 0.37933 for subjectivity. Sentiment analysis has also been applied to Democrats and Republicans for the Senate (Table 12), Gubernatorial (Table 13) and House (Table 14) elections.
For all elections, it is observable that subjectivity is well balanced, i.e., there are only slight differences (Table 11). The only significant difference for subjectivity was observed in the context of Gubernatorial elections, where the subjectivity score was the highest for all elections. Comparing the results of party subjectivity by election, the Democrats showed the highest subjectivity in the elections for the Senate (Table 12), while the Republicans, on the other hand, showed the highest subjectivity in the Gubernational elections (Table 13).
The highest polarity when analyzing the differences between Democrats and Republicans was observed in the Gubernational elections (Table 13). The House elections (Table 14) showed the most balanced subjectivity between Democrats and Republicans. In contrast to subjectivity, Gubernational elections (Table 13) showed the most balanced polarity between Democrats and Republicans.
For comparison with the TextBlob sentiment analysis results, VADER was used to calculate the polarity score, as shown in Table 15 and Table 16. It is worth noting that while both tools aim to measure sentiment accurately, nuances like sarcasm, which are prevalent in social media content, can be a challenge. As Bamman and Smith [38] highlight, sarcasm can often be misinterpreted by sentiment analysis tools. According to Al-Shabi [41], VADER is designed with a lexicon that accounts for certain modern colloquialisms and internet slang terms, which might offer a slight advantage in such contexts. While there is an evident discrepancy in the exact polarity scores between TextBlob and VADER, the general sentiment trend remains consistent. This consistency in trends, despite the numerical differences, reinforces the reliability of the sentiment analysis’ overarching conclusions.
From these results, it can be concluded that all three elections on X were communicated with highly subjective tweets that were slightly positive in their sentiment.
3.4.1. Sentiment Analysis for the Senate Elections
Figure 2 provides a visual representation of average sentiment analysis values for each U.S. state in relation to the Senate elections. The figure is bifurcated into two distinct sections: (a) represents subjectivity scores, and (b) depicts polarity scores. Each state is color-coded based on its respective value, with darker shades symbolizing higher averages.
In section (a), subjectivity scores across states range between 0.27 and 0.48. Washington and North Dakota are distinctly marked with the darkest shades, indicating the highest levels of subjectivity. In contrast, Oklahoma and Indiana have noticeably lighter shades, pointing to the lowest subjectivity values.
Section (b) portrays the polarity values, which fluctuate between 0.04 and 0.23. Here, Washington and Alabama stand out with the most intense coloration, suggesting they have the highest polarity scores. On the opposite end of the spectrum, Louisiana and Connecticut appear with more muted shades, indicating the lowest polarity. This means that the overlap of the highest subjectivity and polarity has been observed in Washington and can be attributed to the tense election race between Patty Murray (Democrat) and Tiffany Smiley (Republican). Murray’s tweets focus mostly on criticizing Smiley’s views on abortion and painting her as an extremist [42]. Republican candidate Tiffany Smiley, a political newcomer, has focused her campaign on quality-of-life issues, urban crime, homelessness and inflation to tarnish Murray [43].
Because of the election race that has tightened, both sides were increasing polarization, which is observable from the results and rise in subjectivity and polarity, as shown in Figure 2.
3.4.2. Sentiment Analysis for the Gubernatorial Elections
When analyzing Figure 3, one can observe a dual-sectioned representation that conveys the average sentiment analysis, both in terms of subjectivity in section (a) and polarity in section (b), for candidates in different states during the Gubernatorial elections. Every state is represented with varying color intensities, where darker colors symbolize higher values of either subjectivity or polarity.
For section (a), the graph provides visual data on subjectivity across states, with Alabama and Illinois emerging with darker color intensities, indicating the highest subjectivity. This section elucidates the personal opinions, feelings, or emotions expressed in the tweets by the candidates, revealing states where campaign narratives might be more subjective and personal.
Section (b) represents the polarity values of the states, and, here, Illinois and Connecticut are highlighted with the most intense colors, signifying high levels of polarity. This section manifests the extent of opinionated or biased statements, reflecting the states where campaign messages are likely more charged or polarized, potentially due to contentious issues or competitive races. Overlapping of the highest subjectivity and polarity for the election race in Alabama is seen between Kay Ivey (Republican) and Yolanda Flowers (Democrat). Kay Ivey raised USD 6.6 million for the elections in 2022, with large sums going toward media buys owned by Ohio-based Flexpoint Media, amounting to USD 936,294 during the month of March alone [44].
Kay Ivey’s subjectivity and high polarity can be seen from her tweets, in which she sided with Donald Trump in denying the legitimacy of the 2020 presidential election. Elliott [45] quotes a political ad on X where Kay Ivey says: “The fake news, big tech and blue-state liberals stole the election from President Trump. But here in Alabama, we’re making sure that never happens”. On the other hand, Yolanda Flowers attacked her rival over gun control, telling her that she is not acting like a responsible leader, in response to Kay Ivey stating that she carries a cellphone and lipstick in her purse, as well as her revolver.
On her campaign platform, Flowers advocated raising the legal age for gun purchases from 18 to 21, and improving background checks for gun buyers [46]. According to Padala and Conrad [47] gun control when used within a political debate exhibits a unique ability to be divisive compared to other issues, making it central to understanding how polarized political opinions operate in the Trump era.
3.4.3. Sentiment Analysis for the House Elections
Figure 4 represents a graphical illustration of the average sentiment analysis values for the House elections, where each state is depicted with variable color shades correlating to the subjectivity and polarity values within the tweets collected. Section (a) portrays the average subjectivity, while section (b) portrays the average polarity, with darker shades corresponding to higher values in each.
In section (a), the visualization denotes that New Mexico and Maryland manifest the highest subjectivity, symbolized by intensified coloration. This part of the figure allows for an analytical observation of where the discussion is mainly reflective of personal feelings, viewpoints, or emotions, indicative of the personalized and emotionally charged nature of the campaigns in these states.
Section (b) provides a visual insight into the states’ polarity levels, with Idaho and Illinois exhibiting the darkest shades, denoting the highest polarity values. Polarity gives insight into the nature of the content—whether it leans more towards a positive or negative sentiment. States with higher polarity indicate strong opinions and potentially divisive content in the candidates’ tweets. The high subjectivity for New Mexico can most probably be attributed to the tight race between Gabe Vasquez (Democrat) and Yvette Herrell (Republican) in the 2nd congressional district election, where Democrats won by a margin of 1224 votes [48]. During this campaign, the Republican candidate used political ads outside X attacking Gabe Vasquez with a 30 s spot that said: “Vasquez would kill 62,000 New Mexico oil and gas jobs.” [49].
This ad was designed not only to damage Vasquez’s public image, but also to create polarization by implying that his past as a conservationist with a track record of working with Senator Martin Heinrich, who is a big proponent of renewable energy, could hurt New Mexico’s future business and economy in the long run [50].
3.5. Topic Modeling for the Elections
For topic modeling, the Gensim open-source Python library was used, more specifically the LdaModel class, in order to extract topics from a large dataset of collected tweets. Topic modeling is a popular text mining technique used to extract topics for a given corpus, and is applicable to various domains. The Latent Dirichlet Allocation (LDA) algorithm considers each tweet as a collection of topics, and each topic as a collection of keywords. In this context, topics are a collection of prominent words with the highest probability for a given topic. LDA is nowadays implemented in various domains, such as for semantic topic analysis of patents [51], for scientific content analysis of citations [52], for stock market impact detection [53], for job sentiment analysis [54], financial industry [55], etc.
Before extracting the topics, three steps (see Figure 5) were introduced to increase the relevance of the detected topics.
The topic modeling process included the following three steps:
- Loading of the dataset:
- Loading of the corresponding election and party: this was achieved by loading the collected tweets into a Pandas DataFrame.
- Columns corresponding to individual election and party tweets were selected from the DataFrame;
import pandas as pd
df = pd.read_excel(“house_tweets.xlsx”, usecols = [“author_id”, “state”,
“party”, “tweet_text”]) - Loading of tweets as a list of strings: this step is an auxiliary step for more efficient preprocessing because manipulating a native Python list is much easier than manipulating a Pandas DataFrame object. This can be achieved by iterating over a DataFrame object, selecting the column with the tweet text and appending it to a Python list;
tweets_list = []
def append_tweets(tweet):
global tweets_list
tweets_list.append(tweet)
return tweet
df[“tweets”] = np.vectorize(append_tweets)(df[“tweet_text”])
- Preprocessing:
- Stop words removal: the removal of very common words is achieved by downloading a list of 179 words via NLTK. Some of the stop words are “I”, “me”, “my”, “so”, “and”, “the”, she”, “in”, etc. Also, since tweets can have a link in them, the links were removed by removing every word starting with http;
stop_words = set(stopwords.words(“english”))
def remove_stopwords(data):
output_array=[]
for sentence in data:
temp_list=[]
for word in sentence.split():
if not word.startswith(“http”) and word not in stop_words:
temp_list.append(word)
output_array.append(‘ ‘.join(temp_list))
return output_array - Lemmatization: is achieved by using the spacy.load() function,. The function itself also allowed for the filtering of POS tags, where only “NOUN”, “ADJ”, “VERB” and “ADV” were specified to be used in lemmatization;
def lemmatization(texts, allowed_postags=[“NOUN”, “ADJ”, “VERB”, “ADV”]):
nlp = spacy.load(“en_core_web_sm”, disable=[“parser”, “ner”])
texts_out = []
for text in texts:
doc = nlp(text)
new_text = []
for token in doc:
if token.pos_ in allowed_postags:
new_text.append(token.lemma_)
final = “ “.join(new_text)
texts_out.append(final)
return (texts_out) - Creation of unigrams, bigrams and trigrams: this step was achieved by using the gensim.models.Phrases class. Creating n-grams of up to three words is an important part of topic modeling, as topics can be expected to span across multiple words, e.g., words such as “New York”, “political campaign”, “Department of Labor”, etc.;
bigram_phrases = gensim.models.Phrases(data_words, min_count=5, threshold=50)
trigram_phrases = gensim.models.Phrases(bigram_phrases[data_words], threshold=50)
data_bigrams = make_bigrams(data_words)
data_bigrams_trigrams = make_trigrams(data_bigrams) - Lowercasing: converting the text of tweets to lowercase was achieved by using the Python method lower();
text = text.lower()
- Topic modeling
- Creation of the LDA model: the LdaModel class from the Gensim library was used to create the model. Unigrams, bigrams and trigrams were passed to the class, with the number of topics being 10. This number was based on the coherence score and model interpretability. To maintain the comprehensibility of this paper, the authors of this paper used 10 topics as it provided a balance between granularity and clarity;
id2word = corpora.Dictionary(data_bigrams_trigrams)
texts = data_bigrams_trigrams
corpus = [id2word.doc2bow(text) for text in texts]
def get_lda_model(corpus, id2word):
return LdaModel(corpus=corpus, id2word=id2word, num_topics=10,
random_state=100, update_every=1, chunksize=100,
passes=10, alpha=“auto”) - Visualization of the LDA model: for visualization of the LDA model, the pyLDAvis library was used, where the previously created LDA model was passed as a parameter. The output of the pyLDAvis library is an html page that is saved to a disk and can be opened with a web browser locally.
def visualise_model(lda_model, corpus, id2word, mds, R):
vis = pyLDAvis.gensim_models.prepare(lda_model, corpus, id2word, mds=mds, R=R)
pyLDAvis.save_html(vis, ‘lda.html’) - The LDA topic modeling results were collected from each election by selecting 10 extracted topics and retrieving the three most relevant words related to that cluster by interacting with the pyLDAvis html output. All results are ordered by importance (size) with related words, which can be observed in the later sections of this paper.
3.5.1. Polarizing Topics
Abramowitz and McCoy [56] state that one of the most important developments in public opinion over the past 30 years has been the rise in affective polarization. Democrats and Republicans are increasingly divided, not only in their policy preferences, but also in their feelings about the parties and their leaders. Baker et al. [57] note that based on the Nominal Three-Step Estimation (NOMINATE) scaling method, which assesses ideological locations of voting behavior, the ideological gap between Democrats and Republicans has been widening since the 1960s.
Gentzkow [58] shows a dramatic increase in the polarization debate since the mid-twentieth century (Figure 6). Social media and political campaigns [59] amplify polarization not only in the context of elections, but also through an easy reach to potentially millions of people who can access real-time tweets or video interviews of any politician posting such content. Esteve et al. [60] state that social platforms might cause radicalization and polarization by limiting exposure to the opinions of like-minded people. In doing so, they can seriously threaten an essential prerequisite for democracy in which one’s ideas are not challenged with the ideas of those who think differently.
Figure 6 presents data from the Google Books Ngram Viewer on the total number of books containing polarization-related phrases divided by the total number of books containing one of the following phrases: “Republican(s)” or “Democrat(s)”. Some of the polarization-related phrases chosen by Gentzkow are “ideological polarization”, “political polarization”, “polarized congress”, “polarized house”, “polarized senate”, etc. The normalized count of books containing a polarization-related phrase shows a dramatic increase in the discussion of polarization from 1960 to 1990.
3.5.2. Topics in the Senate Elections
Theriault and Rohde [61] state that the growth of party polarization in the Senate can be also explained through a process started by previous Republican senators who were in the House after 1978 (also known as “Gingrich Senators”). The overall growth in party polarization in the Senate since the early 1970s can be explained by these Republican senators. Party polarization as a process can undermine democratic processes by entrenching the electorate in its bloc through the use of polarizing topics. Detecting such topics on X in this context becomes fundamental to understanding the polarization within the Senate elections race.
By extrapolating the subjectivity score of topics imposed by Republicans and Democrats (Table 12) using TextBlob, it can be seen that subjectivity is higher for Republican tweets (0.7 compared to 0.55), implying that Republicans tend to use topics that are more subjective compared to the topics of Democrats. Polarization within the Senate is particularly problematic because the Senate is not subject to redistricting. Specifically, states are increasingly more likely than ever to elect two senators from the same party [62].
When analyzing the topics from the Senate elections (Table 12), it can be seen that the most important clusters of topics for election as a whole are the same as for the Republican Senate topics with the exception of the order of community and family, where in the Republican topics, family has a greater importance. For Democrats, the most important topics are related to challenging the Republican majority in the Senate, with topics such as fight, state and help, while Republicans present conservative values with topics such as work, family and community. Party polarization in the Senate is also related to economic factors, where the third largest topic cluster on the Republicans’ side is related to gas, inflation and skyrocket, while on the Democrats’ side, the third largest topic cluster is related to want, stand, believe. The economic factors that Republicans are so highly concerned with in the Senate elections show that economic insecurities are a prominent focus, with topics such as gas, inflation and skyrocket, which are related to income and living standards.
According to Garand [63], changes in the average state income are significantly related to the polarization of parties in the Senate. Abramowitz [64] states that there is a mutually reinforcing relationship between polarization in the Senate and polarization in the electorate. At the same time, increasing polarization within the electorate served to deepen the division between Democrats and Republicans in the Senate. When analyzing Figure 7, it can be observed that Democrats and Republicans have large differences in their priorities when covering topics such as economy and security.
Economy is the eighth largest topic cluster for the Democrats, while it is ranked third for the Republicans, as stated earlier. Security is the fifth and seventh largest topic cluster for the Democrats, and eighth for the Republicans. Even when talking about the same topic of security, there are differences, with Democrats being more focused on law and community security, which can be interpreted in local (private) terms, while Republicans are more focused on state security related to drugs and crime.
Democrats’ emphasis on law and community security could be a reflection of their focus on community cohesion, while Republicans stressing state security related to drugs and crime might accentuate their stand on stricter law enforcement and border controls. It is plausible that the term “security” has been parsed into multiple subtopics, each treated separately, leading to its varied representation. A more granular linguistic analysis could clarify the subtle shifts in the semantic usage of “security” and its related terms across different electoral contexts and party lines.
Both Democrats and Republicans employ specific narratives that resonate most with their respective electorates. For instance, while Republicans, as evidenced by their higher subjectivity scores, may employ more emotive or evocative language, Democrats seem to concentrate on more policy-driven discourses. This differential approach highlights distinct communication strategies, aiming to influence their base and sway undecided voters. As a result, while each side has its influential narratives, the degree of influence often depends on the receptivity of the community.
3.5.3. Topics in the Gubernatorial Elections
Party polarization in the context of the Gubernatorial elections is not necessarily easy to measure, as when governors operate in the federal arena, they do not have the opportunity to demonstrate their position in these ways. They are partners in the government, yet observers in the federal legislative process itself [65].
The level of polarization in the legislature is also negatively correlated with Gubernatorial success, because as polarization increases, legislation becomes more difficult to pass. If the state legislature belongs to a different party than the governor’s party, then there is little reason to support the executive’s political agenda [66]. While the extent of Gubernatorial authority varies from state to state, governors generally have authority over the budget, including the line–item veto power that plays a significant role in determining how resources are allocated. Additionally, governors have the opportunity to mobilize public opinion, and can propose political initiatives [67].
In Figure 8, it can be seen that the topic clusters for the Gubernatorial elections are mostly related to the state (local) level of government, where topics such as investment, business, tax, education, security, etc., permeate the campaigns of both parties. In contrast to topics related to party affiliation, general topics from the Gubernatorial elections are focused on the elections themselves with topics such as vote, election, candidate, which was the largest general topic cluster. The most prevalent topic among Democrats is investment, while, among Republicans, the focus is on leadership. Democrats also have a greater focus on women’s reproductive rights and healthcare; on the other hand, Republicans have a greater focus on education and the cost of energy.
Security is the lowest rated topic in both parties; Democrats focus on general security related to protection and health, while Republicans use more polarizing topics such as victims, rape, prison, etc., to cover security topics. According to Carpenter et al. [68], governors overwhelmingly defined education according to its economic purpose more than any other, both overall and in annual comparisons.
3.5.4. Topics in the House Elections
Unlike Senate and Gubernational elections, House elections are held within electoral districts drawn through redistricting. This is an important issue because as districts become more polarized and the probability of defeating an incumbent approaches zero, there are serious consequences for democracy and representation [69].
Redistricting is not equally spread with respect to the population of the states; for example, each of Alabama’s seven congressional districts after the 2010 United States census had a population of either 682,819 or 682,820, while all Massachusetts districts had a population of 727,514 or 727,515 [70]. During the 1990 redistricting cycle, the U.S. Department of Justice adopted an interpretation of Section 5 that required covered jurisdictions to draw the largest number of majority–minority districts possible. To protect Section 5, the Supreme Court created an “exit strategy” that allowed mapmakers to argue that when race and party are strongly correlated, it was party, not race, that was the predominant motive in the creation of a majority–minority district [71].
When covering the results in Figure 9, the largest cluster of topics from both parties relates to general voting topics such as voter, change, election and win. The largest general topic clusters from the House elections, taken as a whole regardless of party affiliation, were related to family and community values, followed by economy.
For Republicans, the second largest topic cluster is related to family values with topics such as family, home and kid, while for Democrats, the second largest topic cluster is related to community values such as gratitude, friendship and sharing. Other important topic clusters for Republicans are related to national security, with a focus on border, nation, safety, war, drug and cartel-related topics. Democrats, on the other hand, are more focused in their topic clusters on internal problems such as policy, community, women, healthcare, students, schools and bills.
3.5.5. Topic Analysis and Mitigation of Political Polarization
The Senate elections revealed clear priorities and focal points for Republicans and Democrats. For instance, economic concerns were more pronounced for Republicans, while security topics had different angles for both parties. Emotionally engaging topics such as drug and abortion where primarily used by Republicans. This understanding underlines the importance of how emotions and sentiments are intertwined with polarization.
The Gubernatorial elections exhibited a focus on state or local issues, whereas the House elections, especially on the Republican side, leaned into national topics such as border security. This suggests that polarization may manifest differently depending on the scale of politics (local vs. national). A deeper understanding of how local issues influence polarization could offer strategies for bridging divides at different political levels.
The House elections highlighted the impact of redistricting. This practice shapes electoral outcomes and influences the sort of topics and issues politicians focus on. The manipulation of electoral boundaries could be exacerbating polarization. Understanding this relationship can lead to reforms in redistricting practices to ensure better representation and reduce polarizing tactics.
The emphasis on different topics within each party can inform researchers about the intensity and nature of polarization on those specific issues. Knowledge of topics important to the electorate could help in formulating policies that reflect a balanced view, potentially reducing the sharpness of political divisions. By identifying overlapping concerns or shared values between the parties, strategies for bipartisan cooperation and dialogue can be formulated and encouraged.
3.6. Election Topics from Flipped Seats
For the relationship between topics and elections outcomes, flipped seats were analyzed, meaning that a seat within Senate, Gubernatorial or House elections should change party from Republican to Democratic and vice versa. When observing the outcomes of the elections, only the three largest topic clusters based on LDA were considered due to the volume and information value of individual tweets that were posted during the campaign.
3.6.1. Outcomes of the Senate and Gubernatorial Elections
For the Senate election, Pennsylvania was the only state to switch parties, with Democratic candidate John Fetterman defeating Republican candidate Mehmet Oz. The general topic clusters from this election race (sorted by size) focused on community values (help, work and protect), affordability (policy, energy, afford), and family values (community, family, job). The Democratic candidate was more focused on topics of community values, while on the Republican side, the focus was on affordability, especially inflation and potential crisis. The Democratic candidate also showed a heavy focus on veterans, while the Republican candidate focused on drug-related topics.
In the Gubernatorial elections, four seats were flipped, with one Republican gain in Nevada and three Democratic gains in Arizona, Maryland and Massachusetts. Arizona and Nevada were not included in this research because their respective candidates had no tweets in the month before the election on their X profile. Gubernatorial topics in Maryland were related to community values (together, community, gratitude), family values (partner, support, child) and general campaigning (vote, join, win). The Republican candidate and Democratic candidate were equally focused on community values, with the Democratic candidate focusing more on general campaigning, while the Republican candidate focused more on family values. Topic clusters for Massachusetts show topics related to general campaigning (debate, campaign, vote), personal finance (salary, raise, receive) and economics (job, bankrupt, business). Democrats and Republicans were equally focused on campaigning topics, with Democrat showing greater interest in the economy and Republicans in personal finance.
The topic modeling approach that the authors of this paper adopted enabled us to discern the salient themes in the candidates’ discourse, which effectively acted as proxies for their campaign priorities. Analyzing these topics provides a holistic understanding of the political currents at play during the election cycle.
The Senate election in Pennsylvania offers an illustrative example of the broader electoral dynamics at play in 2022. The Democratic candidate’s focus on community values, particularly highlighting the significance of veterans, reflects a strategic decision to anchor the campaign in societal foundations and the sacrifices of service members. Conversely, the Republican’s emphasis on affordability and the looming specter of inflation aligns with the national mood of economic anxiety, capitalizing on prevalent concerns about rising costs.
In the Gubernatorial races, the dynamics were even more multifaceted. The convergence of both parties on community values in Maryland, for instance, underscores a shared understanding of voters’ priorities in the state. Yet, the Democratic candidate’s accentuation of campaign themes and the Republican’s tilt towards family issues hints at subtle differences in their outreach strategies and voter targeting.
3.6.2. Outcomes of the House Elections
When observing the outcomes of the House elections, due to the large number of congressional seats (435 in total), there were 24 flipped competitive seats: 16 were flipped by Republicans, and 8 by Democrats [72]. Full election statistics are published and maintained by the clerk of the United States House of Representatives, and are available online: https://history.house.gov/Institution/Election-Statistics/ (accessed on 3 June 2023). Within this research, two flipped seats from Democrats and two from Republicans based on their geographical distance with intent to cover different parts of U.S. were selected to show the differences in topic clusters in each party. New York’s 3rd and Arizona’s 2nd congressional district were selected for the Republican flip. Democratic flips were observed in Ohio’s 1st and Washington’s 3rd congressional district. In New York’s 3rd congressional district, the largest topic clusters were related to community values (community, friend, family), law enforcement (criminal, convict, illegal) and the cost of living (cost, energy, support). The Democrat’s topics were more related to community values, while the cost of living was the focus of the Republican candidate. In both cases, law enforcement had a lower priority, with the Republicans giving it more importance than the Democrats. Arizona’s 2nd congressional district resulted in topic clusters that were related to community values (community, support, gratitude), general campaigning (debate, discuss, question) and healthcare (funding, staff, health). Democratic topic clusters were more related to community values and healthcare, while the Republicans were focused on general campaigning with mentions of inflation and crime. Ohio’s 1st congressional district shows the largest topic clusters related to general campaigning (vote, support, ballot), the cost of living (inflation, cost, support) and law enforcement (police, judge, crime). The republicans were mostly focused on the cost of living and law enforcement, while the Democrats were focused on general campaigning topics. Washington’s 3rd congressional district shows the largest topic cluster related to general campaigning (vote, ballot, political), time urgency (tomorrow, today, tonight) and family values (family, work, support). The Democrats focused on general campaigning topics, while the Republicans focused more on the urgency of the moment. Topics related to family values had the lowest priority for both parties in this race.
Each selected district illustrates the diversification in thematic priorities and strategic focus between the parties, manifesting through distinct emphases on community values, economic concerns, law enforcement, and campaign-centric discourses. The distinctive representation of these thematic clusters delineates the contrasting narrative structures and strategic alignments of the candidates within their respective party ideologies.
New York’s 3rd district’s emphasis on community values reveals a constituency seeking unity and collective identity. This was perhaps a response to a larger narrative of division and discord that dominated national politics. The focus on law enforcement and the cost of living, albeit to varying degrees between the two parties, underscores the local challenges and concerns that the electorate deemed paramount.
In contrast, the prominence of community values and healthcare in the discourse from Arizona’s 2nd district mirrors a constituency more concerned with well-being and community welfare. The emphasis on general campaigning by Republicans might be indicative of a more grassroots-oriented campaign approach, attempting to engage a wider demographic.
The analysis of the Ohio and Washington districts further accentuates the diverse thematic preferences across different regions. It provides invaluable insights into the local challenges, priorities, and the specific sociopolitical dynamics that influenced the campaigns and possibly the election outcomes in these regions.
4. Research Results and Discussion
Democrats were more active in all elections with significantly more tweets, 31,272 compared to 21,416. While there was a notable difference in tweet activity between Democrats and Republicans, it is essential to consider the broader socio-political context during the 2022 elections. Factors such as party strategies, key events, and campaign focal points might have influenced the X activity and should be explored further. The biggest difference was observed in the Gubernatorial elections, during which Democrats published 6000 tweets compared to 2852 Republican tweets. The evident disparity in tweet volumes during the Gubernatorial elections prompts questions about campaign strategies. Were Democrats actively leveraging X as a platform to engage with a younger audience, or did Republicans shift their attention to other communication channels? All in all, the elections were slightly positive with an average polarity of 0.16341 and highly subjective with an average score of 0.37944. The sentiment scores provide a snapshot of the prevailing emotions and attitudes during the election cycle. Delving deeper, one can analyze whether external events, policy announcements, or significant campaign milestones influenced these sentiment scores. Classification of tweets based on their content showed that within the Senate and House elections, over 20% of Republican tweets were classified as Democrat tweets, while for the Gubernatorial elections, 6.67% of Democrat tweets were classified as Republican tweets. The classification discrepancies, where a significant portion of Republican tweets were classified as Democrat and vice versa, highlight the complexities of political narratives. This blurring of party lines suggests that topics and narratives, while rooted in party ideology, often transcend party boundaries due to the dynamic nature of the political landscape. The Senate elections showed polarization based on major conflicting topics where Democrats’ call to action for the Senate revolved around topics such as fight, state and help, while Republicans were represented with conservative values, such as work, family and community. Priorities in economy and security for the Senate elections show a wide difference where the economy is the third biggest topic cluster for Republicans, compared to eighth for Democrats, and security is the fifth and seventh largest topic cluster for Democrats and eighth for Republicans. Within the Gubernatorial elections, the main topic clusters of both parties were mostly related to local topics including investments, tax and education. Differences in the Gubernatorial elections were observed for women’s reproductive rights, where Democrats had a greater focus, while Republicans, on the other hand, had a greater focus on the cost of energy. For the House elections, general campaigning topics made up the largest topic cluster with topics such as voter, change, election and win. When observing other topics, there was a sharp divide with the second largest topic cluster for Republicans, which was related to family values (family, home, kid), while for Democrats, the second largest topic cluster was related to community values (gratitude, friendship and sharing). In other topic clusters, Democrats were focused on national security (border, nation and cartel), while Democrats were much more focused on internal problems (policy, healthcare, schools). The authors’ observation of polarized topics illuminates the ever-evolving strategy of political campaigns. The shifting priorities based on regional concerns, national narratives, and global contexts underscore the multifaceted nature of political discourse. Across these interactions, it is evident that while both sides occasionally touched on similar broad topics, their framing, emphasis, and proposed solutions often diverged significantly. The ongoing engagement and counter-engagement in these tweets not only highlight the depth of current party polarization, but also underscore how each side’s narrative is shaped, in part, by its interactions with the other.
Evans et al. [73], in their research on House candidates on X in the two months before the 2012 elections, also show results that reflect a higher number of tweets for Democrats than Republicans in House elections. Comparing their research to this one, it is observable that in the 10 years after the 2012 elections, the gap has widened significantly, with Democrats publishing 27.62% more tweets in the 2022 House elections compared to just 3.57% in 2012. The high subjectivity that was observed through sentiment analysis in all elections can be attributed, as noted by Just [74], to people’s political orientations and behavior, which are more strongly shaped by their subjective rather than objective political environment.
5. Conclusions and Future Work
The aim of this paper was to uncover polarizing topics between Democrats and Republicans during their X campaign for the 2022 United States midterm elections. This research was based on 52,688 tweets sent by Republican and Democratic candidates. Using sentiment analysis, classification and topic modeling, the authors presented clear polarizing topics that permeated the elections. The results of the sentiment analysis show that communication during the X campaign was conducted with high subjectivity with an average score of 0.37944 and in a slightly positive way with an average polarity of 0.16341. Democrats displayed greater polarity and subjectivity in the Senate and House elections, while, on the other hand, Republicans showed greater polarity and subjectivity in the Gubernational elections. The Gubernatorial elections were also the elections with the highest subjectivity and polarity compared to other elections. This trend can be observed for the Senate election race between Patty Murray (Democrat) and Tiffany Smiley (Republican) in Washington, which had the highest overlap of subjectivity and polarity in the Senate elections, where the Democratic candidate won the election. For the Gubernatorial election race, the highest overlap of subjectivity and polarity was scored between Kay Ivey (Republican) and Yolanda Flowers (Democrat) in Alabama, where the Republican candidate won the election. For the House elections, there was no overlap of subjectivity and polarity. The highest subjectivity for the House elections was observed between Gabe Vasquez (Democrat) and Yvette Herrell (Republican) in the 2nd congressional district election in New Mexico, where the Democratic candidate won the election. The only place where a general sentiment trend of the corresponding party was not observed was for the House elections, with the highest polarity in Idaho, where the Republican candidates won both seats.
The results of the party classification analysis show that for the Senate and House elections, over 20% of tweets from Republicans were classified as tweets from Democrats. Within the Gubernational elections, there was a slight increase in Republicans tweets, by 6.67%. These results show that within the elections for the Senate and the House, Republicans tend to take over the narrative of Democrats, while in the Gubernational elections, Democrats take over statements from Republicans. Adopting the opposing party’s narrative reflects the competitive nature of elections and the constant efforts of parties to position themselves favorably in the eyes of voters.
The results of topic modeling show that, for each election, Democrats and Republicans focused their priorities on different topics, which, combined with high subjectivity, can create an election environment conducive to polarization. Within the Senate elections, the biggest topics for Republicans were local topics related to family and community, while for Democrats, the most important topics were related to a call to action related to fight and help. The largest Gubernatorial topics were related to the state (local) level, with major difference between Democrats, who were focused on investment, while Republicans were focused on leadership. Within the House elections, the largest topics for both Democrats and Republicans were related to general topics of voting and elections, while other topics such as national security were more of a focus for Democrats, while Republicans focused more on community topics.
The topics of the Senate elections that flipped Pennsylvania to Democrats were related to community values, as opposed to the Republican candidate, who was more focused on the cost of living. The Gubernatorial election topics in Maryland, which switched to the Democratic side, were related to general campaigning (Democrats) and family values (Republicans). For Massachusetts, the flip to Democrats in the Gubernatorial elections showed a focus on the economy (Democrats) and personal finances (Republicans). Topics of the House elections in New York’s 3rd congressional district, where a flip was observed, showed that the Republicans focused on topics related to the cost of living, while the Democrats were more focused on community values. The swing to Democrats in the House elections was observed in Ohio’s 1st congressional district, where the Democrats focused on general campaigning topics, while the Republicans focused on the cost of living.
High subjectivity was observed for all elections where polarizing topics were created. Topics such as elections, the cost of living, jobs, gas, future, etc., are used by candidates as a platform to promote their agenda and to create a polarized voting bloc based on these topics. This trend has been particularly evident with the questioning of the legitimacy of the 2020 presidential election in the Alabama Gubernatorial election race. Fears of potential job losses by transitioning to renewable energy were also used as a polarizing topic for the House election in New Mexico. Party lines are blurred in all three elections, with each party taking over the narrative for the other, and this is especially evident on the Republican side, where a significant number of tweets were classified as Democratic within the Senate and House elections. Topics that have been part of the campaign and their prioritization show a deep entrenchment within the political dialog in the U.S., where common topics are rare, and when they occur, they tend to have a vastly different priority during campaigning.
On the basis of this work, it is possible to apply the methodology of this research to previous U.S. elections, as well as to future U.S. elections, so that polarizing topics can be observed over a longer period of time. Time series for sentiment analysis and party classification, as well as for emerging and trending topics, can be plotted for each day leading up to election day to show campaign dynamics. Future research could, for instance, explore other social platforms and not just X because some of the candidates did not have an X account or were not active on X during the 2022 United States elections. Transcribing the political video advertising of each candidate, as well as those of their respective party, should also be considered. Such research could contribute to a better understanding of candidates’ topics and communication due to potentially longer messages, as these are limited to 280 characters on X.
In light of the advancements with multi-level granulation embeddings for text information extraction [75], further research could explore the integration of deep learning models to enhance extraction precision. Exploring its scalability and efficacy in areas with vast textual content, like social media platforms, might uncover new potential uses. Further studies are needed to find polarizing topics from historical data based on previous elections to establish causal relationships over a longer time span.
Author Contributions
Conceptualization, J.K., S.S. and I.D.; methodology, J.K.; software, J.K.; validation, S.S. and I.D.; formal analysis, J.K., S.S. and I.D.; investigation, J.K.; resources, J.K.; data curation, J.K.; writing—original draft preparation, J.K.; writing—review and editing, I.D.; visualization, J.K.; supervision, I.D.; funding acquisition, I.D. All authors have read and agreed to the published version of the manuscript.
Funding
This research received no external funding.
Data Availability Statement
Data are contained within the article.
Conflicts of Interest
The authors declare no conflict of interest.
References
- Keller, F.B.; Schoch, D.; Stier, S.; Yang, J. Political astroturfing on twitter: How to coordinate a disinformation campaign. Political Commun. 2020, 37, 256–270. [Google Scholar] [CrossRef]
- Younker, M.N. The Impact of Racial Politics on Black Gubernatorial Candidates. In Proceedings of a Multidisciplinary Colloquium on Impact; Keyes IV, W.A., Ed.; The Institute for Responsible Citizenship: Washington, DC, USA, 2020; pp. 57–67. Available online: https://www.theinstitute.net/wp-content/uploads/2020/09/Complete-Colloquium-on-Impact-1.pdf#page=64 (accessed on 15 June 2023).
- Cook, A. Religious Republicans and Diverse Democrats: Asymmetric Polarisation and the Politics of Abortion in the United States. Master’s Thesis, Macquarie University, Sydney, Australia, 2021; pp. 1–4. [Google Scholar] [CrossRef]
- Shapiro, M.A.; Hemphill, L. Politicians and the policy agenda: Does use of Twitter by the US Congress direct New York Times content? Policy Internet 2017, 9, 109–132. [Google Scholar] [CrossRef]
- Franz, M.M.; Ridout, T.N.; Fowler, E.F. Television Advertising in the 2022 Midterms. Forum 2023, 21, 27–51. [Google Scholar] [CrossRef]
- Conover, M.; Ratkiewicz, J.; Francisco, M.; Gonçalves, B.; Menczer, F.; Flammini, A. Political polarization on twitter. In Proceedings of the International AAAI Conference on Web and Social Media, Barcelona, Spain, 21 July 2021; Volume 5, pp. 89–96. [Google Scholar] [CrossRef]
- Hong, S.; Kim, S.H. Political polarization on twitter: Implications for the use of social media in digital governments. Gov. Inf. Q. 2016, 33, 777–782. [Google Scholar] [CrossRef]
- Yegen, C.; Ayhan, B.; Demir, Y. Twitter’s role in digital democracy, post-truth, and political polarization. Rom. J. Commun. Public Relat. 2022, 24, 45–65. [Google Scholar] [CrossRef]
- Osmundsen, M.; Bor, A.; Vahlstrup, P.B.; Bechmann, A.; Petersen, M.B. Partisan polarization is the primary psychological motivation behind political fake news sharing on Twitter. Am. Political Sci. Rev. 2021, 115, 999–1015. [Google Scholar] [CrossRef]
- Masroor, F.; Khan, Q.N.; Aib, I.; Ali, Z. Polarization and ideological weaving in Twitter discourse of politicians. Soc. Media Soc. 2019, 5, 1–14. [Google Scholar] [CrossRef]
- Du, S.; Gregory, S. The Echo Chamber Effect in Twitter: Does community polarization increase? In Proceedings of the 5th International Workshop on Complex Networks and their Applications, Milan, Italy, 30 November–2 December 2016; pp. 373–378. [Google Scholar] [CrossRef]
- Grover, P.; Kar, A.K.; Dwivedi, Y.K.; Janssen, M. Polarization acculturation in US Election 2016 outcomes–Can twitter analytics predict changes in voting preferences. Technol. Forecast. Soc. Chang. 2019, 145, 441–449. [Google Scholar] [CrossRef]
- Flamino, J.; Galeazzi, A.; Feldman, S.; Macy, M.W.; Cross, B.; Zhou, Z.; Serafino, M.; Bovet, A.; Makse, H.A.; Szymanski, B.K. Political polarization of news media and influencers on Twitter in the 2016 and 2020 US presidential elections. Nat. Hum. Behav. 2023, 7, 904–910. [Google Scholar] [CrossRef]
- Bor, D.; Lee, B.S.; Oughton, E.J. Quantifying polarization across political groups on key policy issues using sentiment analysis. arXiv 2023, arXiv:2302.07775. [Google Scholar]
- Ausubel, J.R. Social Media and the 2018 Midterms: An Analysis of House Candidates’ Twitter Posts. CUREJ–College Undergraduate Research Electronic Journal 2019, p. 89. Available online: https://repository.upenn.edu/curej/229 (accessed on 13 June 2023).
- Cvijetić, B.; Radivojević, Z. Application of machine learning in the process of classification of advertised jobs. Int. J. Electr. Eng. Comput. 2020, 4, 93–100. [Google Scholar] [CrossRef]
- Suanpang, P.; Jamjuntr, P.; Kaewyong, P. Sentiment analysis with a TextBlob package implications for tourism. J. Manag. Inf. Decis. Sci. 2021, 24, 1–9. [Google Scholar]
- Bonta, V.; Kumaresh, N.; Janardhan, N. A comprehensive study on lexicon based approaches for sentiment analysis. Asian J. Comput. Sci. Technol. 2019, 8, 1–6. [Google Scholar] [CrossRef]
- Fadhli, I.; Hlaoua, L.; Omri, M.N. Sentiment Analysis CSAM Model to Discover Pertinent Conversations in Twitter Microblogs. Int. J. Comput. Netw. Inf. Secur. 2022, 5, 24. [Google Scholar] [CrossRef]
- Min, W.N.S.W.; Zulkarnain, N.Z. Comparative evaluation of lexicons in performing sentiment analysis. J. Adv. Comput. Technol. Appl. 2020, 2, 14–20. [Google Scholar]
- Chu, K.E.; Keikhosrokiani, P.; Asl, M.P. A topic modeling and sentiment analysis model for detection and visualization of themes in literary texts. Pertanika J. Sci. Technol. 2022, 30, 2535–2561. [Google Scholar] [CrossRef]
- Anwar, W.; Bajwa, I.S.; Ramzan, S. Research Article Design and Implementation of a Machine Learning-Based Authorship Identification Model. Hindawi Sci. Program. 2019, 2019, 14. [Google Scholar] [CrossRef]
- Jelodar, H.; Wang, Y.; Yuan, C.; Feng, X.; Jiang, X.; Li, Y.; Zhao, L. Latent Dirichlet allocation (LDA) and topic modeling: Models, applications, a survey. Multimed. Tools Appl. 2019, 78, 15171–15276. [Google Scholar] [CrossRef]
- Phan, X.H.; Nguyen, L.M.; Horiguchi, S. Learning to classify short and sparse text & web with hidden topics from large-scale data collections. In Proceedings of the 17th International Conference on World Wide Web, Beijing, China, 21–25 April 2008; pp. 91–100. [Google Scholar] [CrossRef]
- Takikawa, H.; Kikuko, N. Political polarization in social media: Analysis of the “Twitter political field” in Japan. In Proceedings of the 2017 IEEE International Conference on Big Data (Big Data), Boston, MA, USA, 11–14 December 2017; pp. 3143–3150. [Google Scholar] [CrossRef]
- Rajabi, A.; Mantzaris, A.V.; Atwal, K.S.; Garibay, I. Exploring the disparity of influence between users in the discussion of Brexit on Twitter: Twitter influence disparity in Brexit. J. Comput. Soc. Sci. 2021, 4, 903–917. [Google Scholar] [CrossRef]
- Hobolt, S.B.; Leeper, T.J.; Tilley, J. Divided by the vote: Affective polarization in the wake of the Brexit referendum. Br. J. Political Sci. 2021, 51, 1476–1493. [Google Scholar] [CrossRef]
- Pastor, K. Democrat vs. Republican Tweets, Kaggle. 2018. Available online: https://www.kaggle.com/datasets/kapastor/democratvsrepublicantweets (accessed on 24 March 2023).
- Razno, M. Machine learning text classification model with NLP approach. In Proceedings of the 3rd International conference COLINS, Kharkiv, Ukraine, 18–19 April 2019; Volume 2, pp. 71–73. [Google Scholar]
- Dogra, V.; Verma, S.; Chatterjee, P.; Shafi, J.; Choi, J.; Ijaz, M.F. A complete process of text classification system using state-of-the-art NLP models. Comput. Intell. Neurosci. 2022, 2022, 26. [Google Scholar] [CrossRef] [PubMed]
- Kovač, A.; Dunđer, I.; Seljan, S. An overview of machine learning algorithms for detecting phishing attacks on electronic messaging services. In Proceedings of the 45th Jubilee International Convention on Information, Communication and Electronic Technology (MIPRO), Opatija, Croatia, 23–27 May 2022; pp. 954–961. [Google Scholar] [CrossRef]
- Seljan, S.; Tolj, N.; Dunđer, I. Information Extraction from Security-Related Datasets. In Proceedings of the 46th Jubilee International Convention on Information, Communication and Electronic Technology (MIPRO), Opatija, Croatia, 22–26 May 2023; pp. 595–600. [Google Scholar] [CrossRef]
- Song, J.; Kim, K.T.; Lee, B.; Kim, S.; Youn, H.Y. A novel classification approach based on Naïve Bayes for Twitter sentiment analysis. KSII Trans. Internet Inf. Syst. 2017, 11, 16. [Google Scholar] [CrossRef]
- Mantovani, R.G.; Rossi, A.L.; Alcobaça, E.; Vanschoren, J.; de Carvalho, A.C. A meta-learning recommender system for hyperparameter tuning: Predicting when tuning improves SVM classifiers. Inf. Sci. 2019, 501, 198–203. [Google Scholar] [CrossRef]
- Minaee, S.; Kalchbrenner, N.; Cambria, E.; Nikzad, N.; Chenaghlu, M.; Gao, J. Deep Learning Based Text Classification: A Comprehensive Review. ACM Comput. Surv. 2021, 54, 43. [Google Scholar] [CrossRef]
- Sarlan, A.; Nadam, C.; Basri, S. Twitter sentiment analysis. In Proceedings of the 6th International Conference on Information Technology and Multimedia, Putrajaya, Malaysia, 18–20 November 2014; pp. 212–216. [Google Scholar] [CrossRef]
- Chaudhry, H.N.; Javed, Y.; Kulsoom, F.; Mehmood, Z.; Khan, Z.I.; Shoaib, U.; Janjua, S.H. Sentiment analysis of before and after elections: Twitter data of us election 2020. Electronics 2021, 10, 26. [Google Scholar] [CrossRef]
- Bamman, D.; Smith, N. Contextualized sarcasm detection on twitter. In Proceedings of the International AAAI Conference on Web and Social Media, Oxford, UK, 26–29 May 2015; 9, pp. 575–576. [Google Scholar] [CrossRef]
- Ebrahimi, M.; Yazdavar, A.H.; Sheth, A. Challenges of sentiment analysis for dynamic events. IEEE Intell. Syst. 2017, 32, 70–75. [Google Scholar] [CrossRef]
- Ali, R.H.; Pinto, G.; Lawrie, E.; Linstead, E.J. A large-scale sentiment analysis of tweets pertaining to the 2020 US presidential election. J. Big Data 2022, 9, 12. [Google Scholar] [CrossRef]
- Al-Shabi, M. Evaluating the performance of the most important Lexicons used to Sentiment analysis and opinions Mining. Int. J. Comput. Sci. Netw. Secur. 2020, 20, 51–57. [Google Scholar]
- Demkovich, L. Truth-test: U.S. Senate ads from both Campaigns Often Miss Important Context. Here’s a Look at the Mur-ray-Smiley Race, The Spokeman-Review. 2022. Available online: https://www.spokesman.com/stories/2022/oct/28/truth-test-us-senate-ads-from-both-campaigns-often/ (accessed on 20 March 2023).
- Allison, N. Democrats Scramble to Avert Shock Senate Loss in Washington State, Politico. 2022. Available online: https://www.politico.com/news/2022/10/26/democrats-washington-patty-murray-senate-00063447 (accessed on 24 March 2023).
- Burkhalter, E. Gov. Kay Ivey Leads Opponents in Fundraising in Gubernatorial Race, Alabama Political Reporter. 2022. Available online: https://www.alreporter.com/2022/04/18/gov-kay-ivey-leads-opponents-in-fundraising-in-gubernatorial-race/ (accessed on 13 March 2023).
- Elliott, D. Republican Candidates in Alabama Primary are Embracing Big Lie to Align with Trump, National Public Radio. 2022. Available online: https://www.npr.org/2022/05/23/1100828779/republican-candidates-in-alabama-primary-are-embracing-big-lie-to-align-with-tru (accessed on 14 March 2023).
- De Arce, P. Gun Control, the Ever-Present US Problem that’s Rarely Discussed in Campaigns, La Presena Latina Bingual Media. 2022. Available online: https://www.laprensalatina.com/gun-control-the-ever-present-us-problem-thats-rarely-discussed-in-campaigns/ (accessed on 13 March 2023).
- Padala, A.; Conrad, L. Political Polarization during 2017–2021. J. Stud. Res. 2021, 10, 1–12. [Google Scholar] [CrossRef]
- Current-Argus, C. Gabe Vasquez Wins Race for New Mexico’s 2nd Congressional District, Carlsbad Current Argus. 2022. Available online: https://www.currentargus.com/story/news/2022/11/09/vasquez-declares-victory-in-race-for-new-mexicos-2nd-us-house-district/69635638007/ (accessed on 20 March 2023).
- Redfern, J. A Republican Attack Ad Gets Its Facts All Wrong, Source New Mexico. 2022. Available online: https://sourcenm.com/2022/10/26/a-republican-attack-ad-gets-its-facts-all-wrong/ (accessed on 21 March 2023).
- Fordham, A. Republican Group Exaggerates Number of Oil and Gas Jobs, Kunm. 2022. Available online: https://www.kunm.org/local-news/2022–11–01/republican-group-exaggerates-number-of-oil-and-gas-jobs (accessed on 28 March 2023).
- Wang, H.; Li, M.; Wang, Z.; Shan, Z. Research on the R&D Strategies of Iron and Steel Enterprises Based on Semantic Topic Analysis of Patents. Information 2023, 14, 199. [Google Scholar] [CrossRef]
- Malkawi, R.; Daradkeh, M.; El-Hassan, A.; Petrov, P. A Semantic Similarity-Based Identification Method for Implicit Citation Functions and Sentiments Information. Information 2022, 13, 546. [Google Scholar] [CrossRef]
- Li, N.; Chen, K.; He, H. UGC Knowledge Features and Their Influences on the Stock Market: An Empirical Study Based on Topic Modeling. Information 2022, 13, 454. [Google Scholar] [CrossRef]
- Li, M.; Zhu, Y.; Gao, W.; Cao, M.; Wang, S. Joint Sentiment Part Topic Regression Model for Multimodal Analysis. Information 2020, 11, 486. [Google Scholar] [CrossRef]
- Krstić, Ž.; Seljan, S.; Zoroja, J. Visualization of Big Data Text Analytics in Financial Industry: A Case Study of Topic Extraction for Italian Banks. In Proceedings of the ENTerprise REsearch InNOVAtion Conference (Entrenova), Rovinj, Croatia, 12–14 September 2019; pp. 67–75. [Google Scholar] [CrossRef]
- Abramowitz, A.; McCoy, J. United States: Racial resentment, negative partisanship, and polarization in Trump’s America. ANNALS Am. Acad. Political Soc. Sci. 2019, 681, 137–156. [Google Scholar] [CrossRef]
- Baker, S.R.; Bloom, N.; Canes-Wrone, B.; Davis, S.J.; Rodden, J. Why has US policy uncertainty risen since 1960? Am. Econ. Rev. 2014, 104, 56–60. [Google Scholar] [CrossRef]
- Gentzkow, M. Polarization in 2016. Toulouse Network for Information Technology Whitepaper. 2016 p. 23. Available online: https://web.stanford.edu/~gentzkow/research/PolarizationIn2016.pdf (accessed on 12 June 2023).
- Bekafigo, M.A.; Stepanova, E.V.; Eiler, B.A.; Noguchi, K.; Ramsey, K.L. The effect of group polarization on opposition to Donald Trump. Political Psychol. 2019, 40, 1163–1178. [Google Scholar] [CrossRef]
- Esteve Del Valle, M.; Broersma, M.; Ponsioen, A. Political Interaction Beyond Party Lines: Communication Ties and Party Polarization in Parliamentary Twitter Networks. Soc. Sci. Comput. Rev. 2022, 40, 736–755. [Google Scholar] [CrossRef]
- Theriault, S.M.; Rohde, D.W. The Gingrich senators and party polarization in the US Senate. J. Politics 2011, 73, 1011–1024. [Google Scholar] [CrossRef]
- Hetherington, M.J.; Weiler, J.D. Putting polarization in perspective. In Authoritarianism and Polarization in American Politics; Hetherington, M.J., Weiler, J.D., Eds.; Cambridge University Press: Cambridge, UK, 2009; pp. 15–32. [Google Scholar] [CrossRef]
- Garand, J.C. Income inequality, party polarization, and roll-call voting in the US Senate. J. Politics 2010, 72, 1109–1128. [Google Scholar] [CrossRef]
- Abramowitz, A.I. US Senate Elections in a Polarized Era. In The US Senate: From Deliberation to Dysfunction, 1st ed.; Loomis, B.A., Ed.; CQ Press: Washington, DC, USA, 2012; p. 31. [Google Scholar] [CrossRef]
- Jensen, J.M. Governors and partisan polarization in the federal arena. Publius. J. Fed. 2017, 47, 314–341. [Google Scholar] [CrossRef]
- Guthrie, S. This Used to Be My Playground: The Effect of Previous Legislative Experience on Gubernatorial Success. In Midwest Political Science Association Annual Meeting. 2014 p. 10. Available online: http://www.dannyhayes.org/uploads/6/9/8/5/69858539/guthrie_workshop_june2016.pdf (accessed on 15 June 2023).
- Seifter, M. Judging Power Plays in the American States. Texas Law Review. 2019, 97, 1229–1230. [Google Scholar] [CrossRef]
- Carpenter, D.M.; Hughes, H. Gubernatorial Rhetoric and the Purpose of Education in the United States. Int. J. Educ. Policy Leadersh. 2011, 6, 10. [Google Scholar] [CrossRef]
- Carson, J.L.; Crespin, M.H.; Finocchiaro, C.J.; Rohde, D.W. Redistricting and party polarization in the US House of Representatives. Am. Politics Res. 2007, 35, 878–904. [Google Scholar] [CrossRef]
- Cohen, A.; Duchin, M.; Matthews, J.N.; Suwal, B. Private numbers in public policy: Census, differential privacy, and redistricting. Harv. Data Sci. Rev. 2022, 2, 1–51. [Google Scholar] [CrossRef]
- Crum, T. Deregulated Redistricting. Cornell Law Rev. 2022, 107, 86. Available online: https://live-cornell-law-review.pantheonsite.io/wp-content/uploads/2022/04/Crum-final-1.pdf (accessed on 13 June 2023).
- Montanaro, D. Why Republicans Wound Up with a Smaller-Than-Expected House Majority, National Public Radio. 2022. Available online: https://www.npr.org/2022/11/09/1135690671/house-senate-republican-democrat-midterm-election-results (accessed on 19 March 2023).
- Evans, H.K.; Victoria, C.; Savannah, S. Twitter style: An analysis of how house candidates used Twitter in their 2012 campaigns. Political Sci. Politics 2014, 47, 454–462. [Google Scholar] [CrossRef]
- Just, A. Partisanship, Electoral Autocracy, and Citizen Perceptions of Party System Polarization. Political Behaviour. 2022. [Google Scholar] [CrossRef]
- Chen, B.; Chen, X. MAUIL: Multilevel attribute embedding for semisupervised user identity linkage. Inf. Sci. 2022, 593, 527–545. [Google Scholar] [CrossRef]
Figure 1.
Flowchart diagram for each stage, its associated tasks, and their interconnections.

Figure 2.
Average sentiment analysis values for the Senate elections by each state. (a) Average subjectivity; (b) average polarity.
Figure 2.
Average sentiment analysis values for the Senate elections by each state. (a) Average subjectivity; (b) average polarity.

Figure 3.
Average sentiment analysis values for the Gubernatorial elections by each state. (a) Average subjectivity; (b) average polarity.
Figure 3.
Average sentiment analysis values for the Gubernatorial elections by each state. (a) Average subjectivity; (b) average polarity.

Figure 4.
Average sentiment analysis values for the House elections by each state. (a) Average subjectivity; (b) average polarity.
Figure 4.
Average sentiment analysis values for the House elections by each state. (a) Average subjectivity; (b) average polarity.

Figure 5.
Topic modeling process.

Figure 6.
Normalized count of books containing a polarization-related phrase divided by one of the phrases: “Republican(s)” or “Democrat(s)”, according to the Google Books Ngram Viewer.
Figure 6.
Normalized count of books containing a polarization-related phrase divided by one of the phrases: “Republican(s)” or “Democrat(s)”, according to the Google Books Ngram Viewer.

Figure 7.
Overview of the top 10 topic clusters from the Senate elections; importance of 1 denotes the most important topic cluster, while 10 denotes the least important topic cluster.
Figure 7.
Overview of the top 10 topic clusters from the Senate elections; importance of 1 denotes the most important topic cluster, while 10 denotes the least important topic cluster.

Figure 8.
Overview of the top 10 topic clusters from the Gubernatorial elections; importance of 1 denotes the most important topic cluster, while 10 denotes the least important topic cluster.
Figure 8.
Overview of the top 10 topic clusters from the Gubernatorial elections; importance of 1 denotes the most important topic cluster, while 10 denotes the least important topic cluster.

Figure 9.
Overview of the top 10 topic clusters from the House elections; importance of 1 denotes the most important topic cluster, while 10 denotes the least important topic cluster.
Figure 9.
Overview of the top 10 topic clusters from the House elections; importance of 1 denotes the most important topic cluster, while 10 denotes the least important topic cluster.


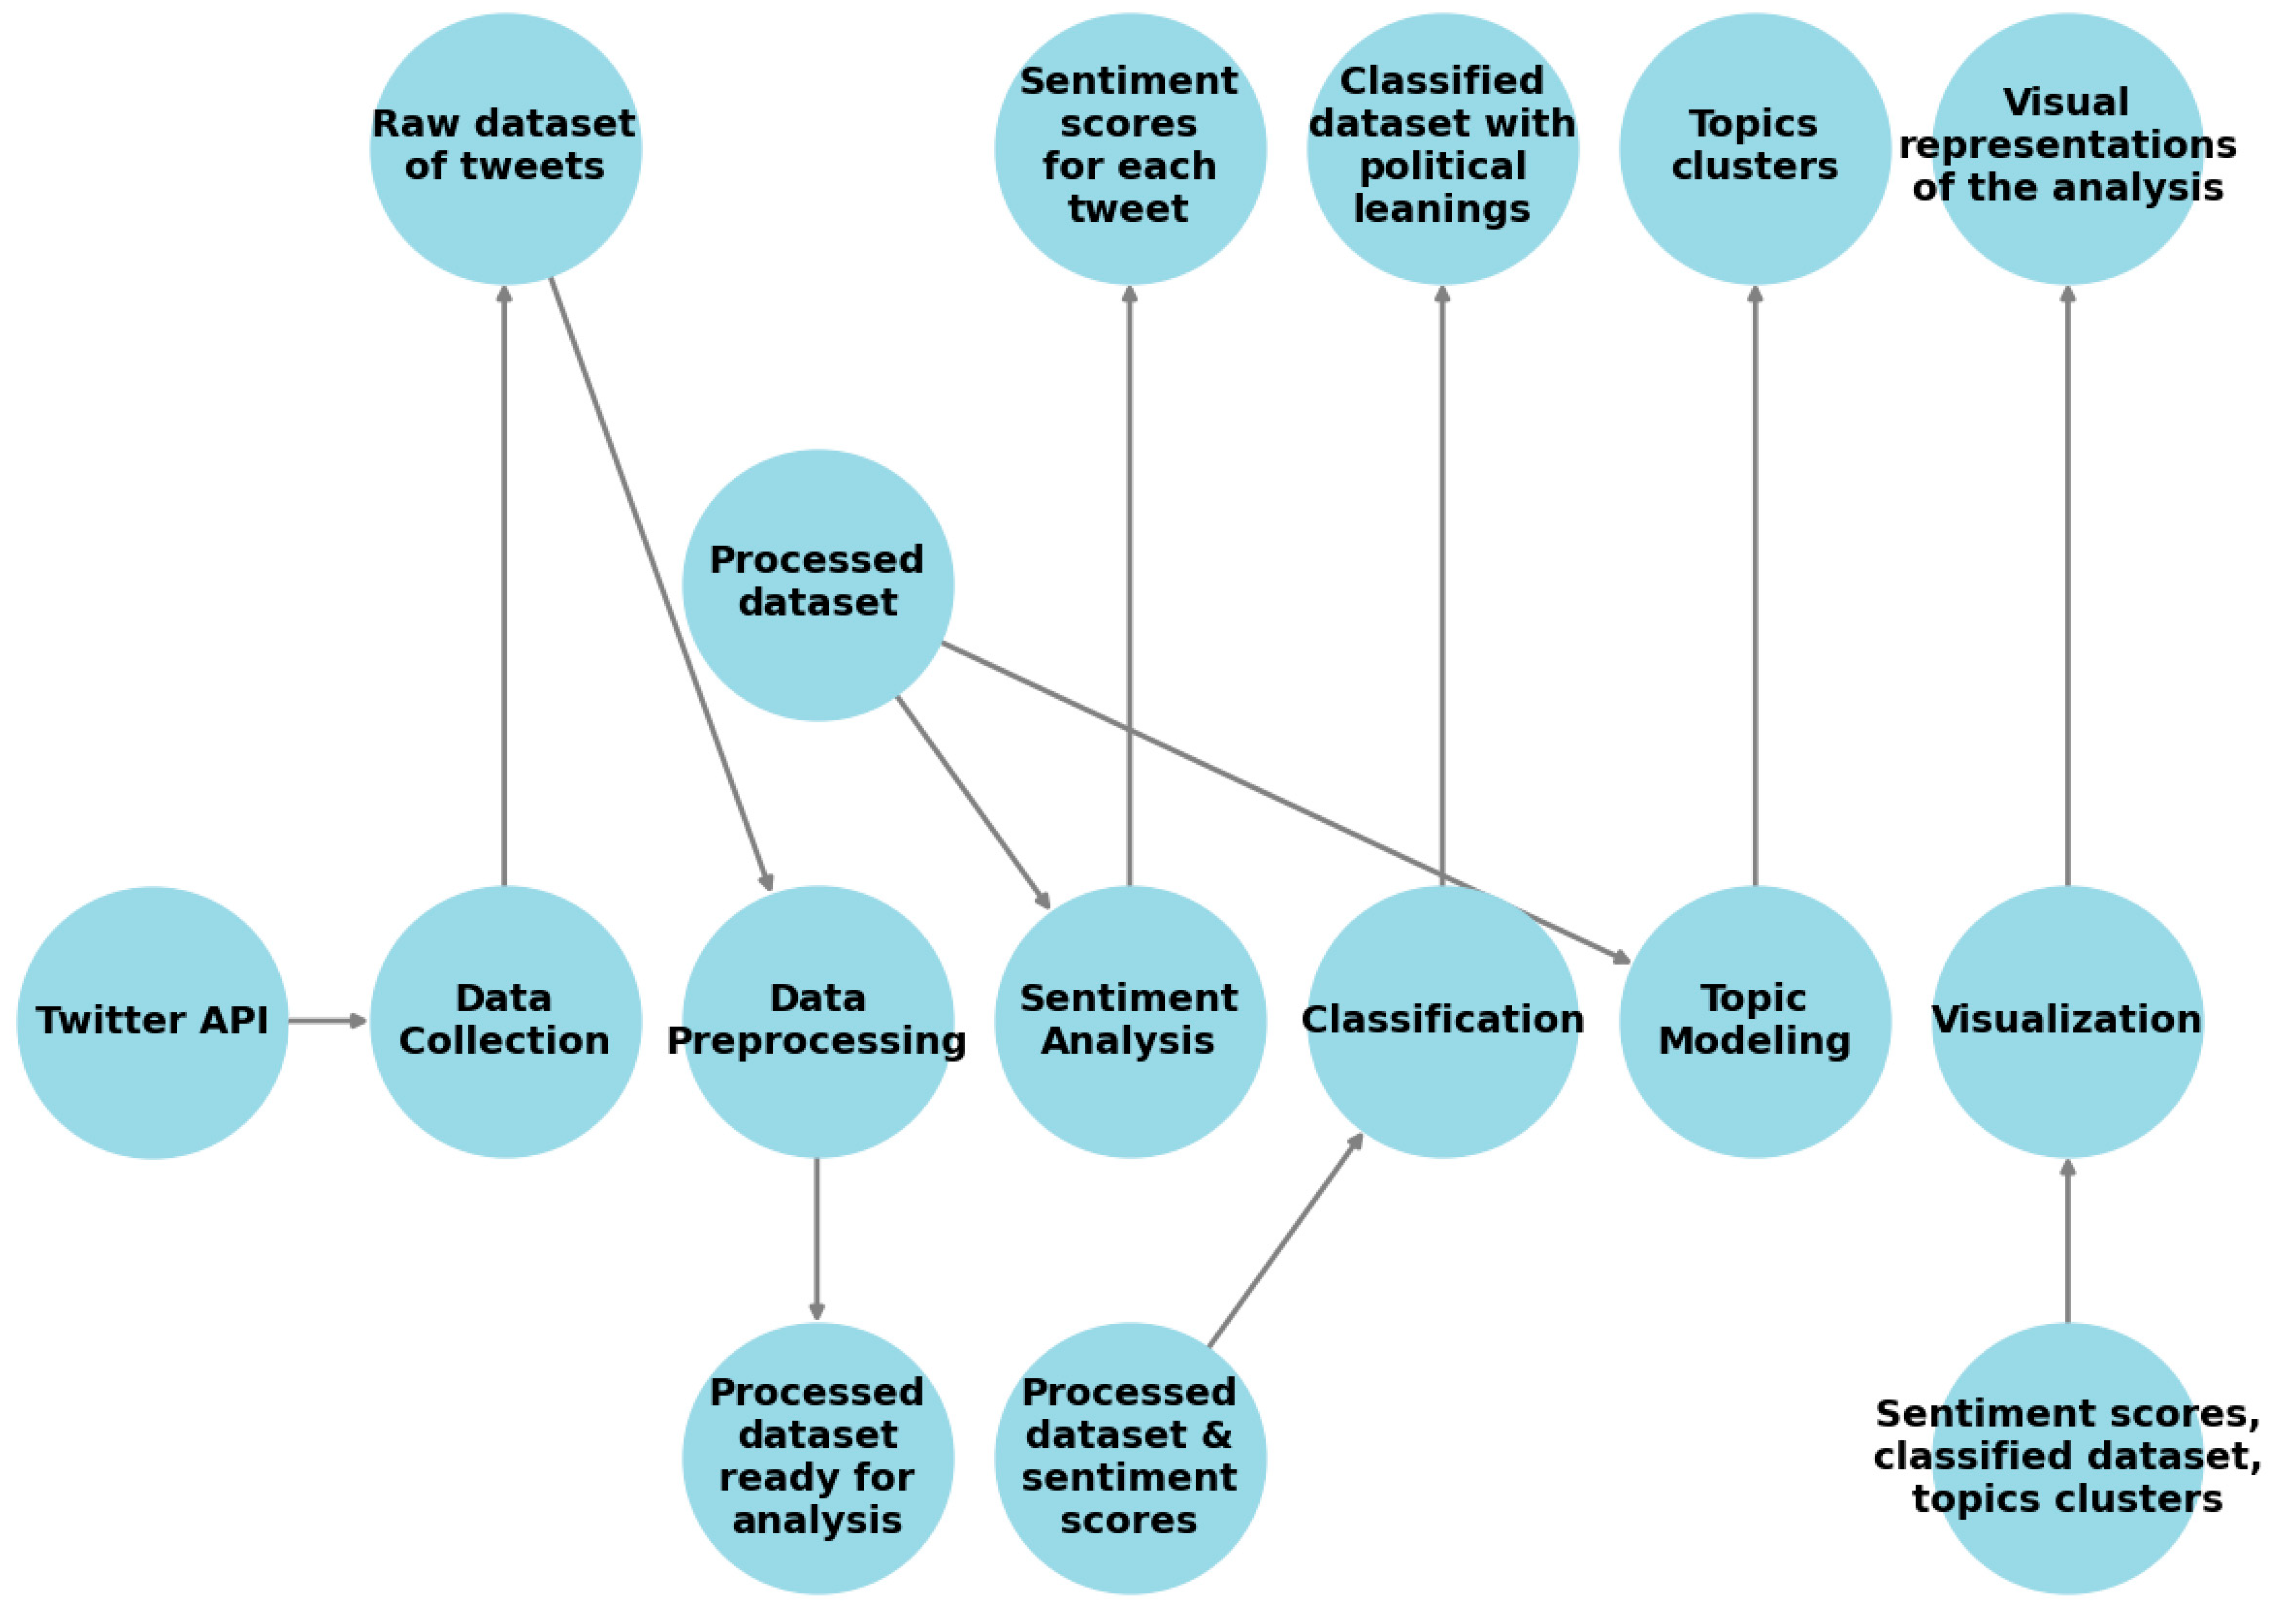
Table 1.
Python libraries and corresponding tasks.
| Python Library | Primary Function | Used for the Following Task |
|---|---|---|
| Tweepy | Accessing the X API | Data collection from X |
| NLTK | Preprocessing | Removal of stop words |
| TextBlob | Sentiment Analysis | Extracting the sentiment for each election |
| NetworkX | Visualization | Visualizing the general schema of the paper |
| Pandas | Data Manipulation and Analysis | Data manipulation and analysis |
| Plotly Express | Visualization | Visualizing the sentiment analysis data |
| Gensim | Topic Modeling | Implementing LDA for topic modeling |
| Matplotlib | Visualization | Visualizing the topic clusters via lollipop charts |
| pyLDAvis | LDA Model Visualization | Visual representation of the LDA topic models |
| VADER | Sentiment Analysis | Extracting the polarity for each election |
Table 2.
Overview of collected tweets.
| Senate | Gubernatorial | House | Total |
|---|---|---|---|
| 7714 | 8852 | 36,122 | 52,688 |
Table 3.
Political party affiliation of the collected tweets.
| Elections | Democrats | Republicans | Total |
|---|---|---|---|
| Senate | 4317 | 3397 | 7714 |
| Gubernatorial | 6000 | 2852 | 8852 |
| House | 20,955 | 15,167 | 36,122 |
| Total | 31,272 | 21,416 | 52,688 |
Table 4.
Overview of the collected X interactions.
| Elections | Retweets | Replies | Likes | Quotes |
|---|---|---|---|---|
| Senate | 3,281,071 | 1,896,366 | 13,684,778 | 203,017 |
| Gubernatorial | 2,939,848 | 1,771,876 | 12,027,667 | 194,594 |
| House | 2,969,406 | 2,204,644 | 14,004,770 | 250,702 |
| Total | 9,190,325 | 5,872,886 | 39,717,215 | 648,313 |
Table 5.
Overview of the “Democrat Vs. Republican Tweets” dataset.
| Democrats | Republicans | Total |
|---|---|---|
| 42,068 | 44,392 | 86,460 |
Table 6.
Performance metrics of the MNB model.
| Metric | Value (%) |
|---|---|
| Accuracy | 83.05 |
| Precision | 90.74 |
| Recall | 79.87 |
| F1 Score | 84.94 |
Table 7.
Performance metrics of the SVM model.
| Metric | Value (%) |
|---|---|
| Accuracy | 86.75 |
| Precision | 88.60 |
| Recall | 84.70 |
| F1 Score | 86.61 |
Table 8.
Overview of the MNB classification of Senate election tweets.
| Classification | Democrat Senate Tweets | Republican Senate Tweets |
|---|---|---|
| MNB classification | 5043 | 2671 |
| Retrieved | 4317 | 3397 |
| Difference | +16.81% | −21.37% |
Table 9.
Overview of the MNB classification of Gubernatorial election tweets.
| Classification | Democrat Gubernatorial Tweets | Republican Gubernatorial Tweets |
|---|---|---|
| MNB classification | 5599 | 3253 |
| Retrieved | 6000 | 2852 |
| Difference | −6.67% | +14.06% |
Table 10.
Overview of the MNB classification of House election tweets.
| Classification | Democrat House Tweets | Republican House Tweets |
|---|---|---|
| MNB classification | 24,618 | 11,504 |
| Retrieved | 20,955 | 15,167 |
| Difference | +17.48% | −24.15% |
Table 11.
Details on the X sentiment analysis conducted (overall).
| Election | Polarity | Subjectivity |
|---|---|---|
| Senate | 0.14462 | 0.37442 |
| Gubernatorial | 0.17660 | 0.38769 |
| House | 0.16901 | 0.37588 |
| Average | 0.16341 | 0.37933 |
Table 12.
Details on the X sentiment analysis conducted for the Senate elections.
| Sentiment | Democrats | Republicans |
|---|---|---|
| Polarity | 0.16819 | 0.13482 |
| Subjectivity | 0.39440 | 0.37827 |
Table 13.
Details on the X sentiment analysis conducted for the Gubernatorial elections.
| Sentiment | Democrats | Republicans |
|---|---|---|
| Polarity | 0.18034 | 0.18211 |
| Subjectivity | 0.38608 | 0.41074 |
Table 14.
Details on the X sentiment analysis conducted for the House elections.
| Sentiment | Democrats | Republicans |
|---|---|---|
| Polarity | 0.18031 | 0.16402 |
| Subjectivity | 0.38513 | 0.37740 |
Table 15.
Details on the X sentiment analysis conducted via VADER for the Gubernatorial elections (polarity scores).
Table 15.
Details on the X sentiment analysis conducted via VADER for the Gubernatorial elections (polarity scores).
| Elections | Polarity |
|---|---|
| House | 0.23899 |
| Gubernatorial | 0.23860 |
| Senate | 0.19819 |
Table 16.
Details on the X sentiment analysis conducted via VADER for the Gubernatorial elections (differences between Democrats and Republicans).
Table 16.
Details on the X sentiment analysis conducted via VADER for the Gubernatorial elections (differences between Democrats and Republicans).
| Elections | Democrats | Republicans |
|---|---|---|
| Gubernatorial | 0.25812 | 0.19752 |
| Senate | 0.20585 | 0.14763 |
| House | 0.23572 | 0.18825 |
Disclaimer/Publisher’s Note: The statements, opinions and data contained in all publications are solely those of the individual author(s) and contributor(s) and not of MDPI and/or the editor(s). MDPI and/or the editor(s) disclaim responsibility for any injury to people or property resulting from any ideas, methods, instructions or products referred to in the content. |
© 2023 by the authors. Licensee MDPI, Basel, Switzerland. This article is an open access article distributed under the terms and conditions of the Creative Commons Attribution (CC BY) license (https://creativecommons.org/licenses/by/4.0/).
Share and Cite
MDPI and ACS Style
Katalinić, J.; Dunđer, I.; Seljan, S. Polarizing Topics on Twitter in the 2022 United States Elections. Information 2023, 14, 609. https://doi.org/10.3390/info14110609
AMA Style
Katalinić J, Dunđer I, Seljan S. Polarizing Topics on Twitter in the 2022 United States Elections. Information. 2023; 14(11):609. https://doi.org/10.3390/info14110609
Chicago/Turabian StyleKatalinić, Josip, Ivan Dunđer, and Sanja Seljan. 2023. "Polarizing Topics on Twitter in the 2022 United States Elections" Information 14, no. 11: 609. https://doi.org/10.3390/info14110609
Note that from the first issue of 2016, this journal uses article numbers instead of page numbers. See further details here.