
Sentiment Analysis in the Age of COVID-19: A Bibliometric Perspective
by
 , ,
, ,
Andra Sandu
1, 
Liviu-Adrian Cotfas
1,* ,
,
Camelia Delcea
1 ,
,
Liliana Crăciun
2 and
Anca Gabriela Molănescu
2 1
Department of Economic Informatics and Cybernetics, Bucharest University of Economic Studies, 0105552 Bucharest, Romania
2
Department of Economics and Economic Policies, Bucharest University of Economic Studies, 0105552 Bucharest, Romania
*
Author to whom correspondence should be addressed.
Information 2023, 14(12), 659; https://doi.org/10.3390/info14120659
Submission received: 31 October 2023
/
Revised: 4 December 2023
/
Accepted: 11 December 2023
/
Published: 13 December 2023
(This article belongs to the Special Issue 2nd Edition of Information Retrieval and Social Media Mining)
Abstract
:The global impact of the COVID-19 pandemic has been profound, placing significant challenges upon healthcare systems and the world economy. The pervasive presence of illness, uncertainty, and fear has markedly diminished overall life satisfaction. Consequently, sentiment analysis has gained substantial traction among scholars seeking to unravel the emotional and attitudinal dimensions of this crisis. This research endeavors to provide a bibliometric perspective, shedding light on the principal contributors to this emerging field. It seeks to spotlight the academic institutions associated with this research domain, along with identifying the most influential publications in terms of both paper volume and h-index metrics. To this end, we have meticulously curated a dataset comprising 646 papers sourced from the ISI Web of Science database, all centering on the theme of sentiment analysis during the COVID-19 pandemic. Our findings underscore a burgeoning interest exhibited by the academic community in this particular domain, evident in an astonishing annual growth rate of 153.49%. Furthermore, our analysis elucidates key keywords and collaborative networks within the authorship, offering valuable insights into the global proliferation of this thematic pursuit. In addition to this, our analysis encompasses an n-gram investigation across keywords, abstracts, titles, and keyword plus, complemented by an examination of the most frequently cited works. The results gleaned from these endeavors offer crucial perspectives, contribute to the identification of pertinent issues, and provide guidance for informed decision-making.
1. Introduction
Natural language processing (NLP) is a key component of modern life as it allows computers to comprehend, analyze, and respond to human language in a meaningful manner, offering thrilling new opportunities. This promises to enhance human–computer interaction and consists of advanced methods, including entity recognition, machine translation, and sentiment analysis, with applications in voice assistance, natural language processing, automated language processing, and much more.
In this context, Zhang et al. [1] and Hirschberg et al. [2] provide essential insights for sentiment analysis by addressing both the challenges and benefits of NLP and offering historical frameworks and possible applications in multiple areas—health, economy, business, and government.
The advanced technique of sentiment analysis is based on the use of high-level algorithms that focus on scanning and extracting texts, with the objective of decoding precious details of human emotions along with comprehending their feelings and opinions and offering an in-depth understanding of individual reactions, impressions, and perceptions in a specific subject.
In today’s technological era, sentiment analysis has expanded into a complex and sophisticated field that has progressed remarkably with the expansion of machine learning technologies, giving increasingly accurate and efficient methods for analyzing human language. Machine learning approaches, such as classification based on language models and neural networks, are currently occupying the forefront of the attention of many researchers who have published notable contributions in the scientific literature. If interested, one can refer to articles belonging to Medhat et al. [3], Jemai et al. [4], Wankhade et al. [5], and Mercha et al. [6] that are useful for understanding the main algorithms used in sentiment analysis (naïve Bayes, logistic regression, support vector machines, lexicon-based methods, transfer learning techniques, convolutional and recurrent neural networks, long short-term memory, and attention-based models), providing valuable insights, covering numerous tasks (sentiment classification, emotion detection, and social media monitoring), and highlighting the most recent trends, strategies, advantages, drawbacks, applications, and challenges (sarcasm detection, grammatical errors, informal writing style, computational cost, and adaptations of language).
The advent of the SARS-CoV-2 virus in December 2019, emerging in the Wuhan province of China, marked an unforeseen disruption to the global status quo. The abrupt onset of the pandemic, the astonishing speed at which the disease disseminated, the exponential surge in cases, the significant loss of life, and the pervasive fear and apprehension surrounding this enigmatic virus collectively wrought a profound upheaval on a global scale. The repercussions of this upheaval were felt across multiple domains, including public health, politics, the economy, education, tourism, events, and entertainment. The ramifications were so severe that many enterprises were compelled to cease operations or transition to remote work where feasible.
In the wake of these profound and far-reaching changes and events, which have had a substantial impact on the quality of life for individuals worldwide, sentiment analysis has garnered the attention of a considerable number of researchers. Their work has yielded valuable insights into people’s emotional responses during these challenging times and has offered actionable plans to enhance decision-making by authorities. Within the scientific literature, one can uncover numerous articles bearing titles that encompass both “sentiment analysis” and “COVID-19”, showing once more the connection between the two selected fields of research. Examples of such contributions can be found in the works of Costola et al. [7], Jalil et al. [8], Ainapure et al. [9], Vijayaraj et al. [10], Chandra and Krishna [11], Dangi et al. [12], and Jain and Kashyap [13]. In perspective with the COVID-19 epidemic, the mentioned research articles provide a substantial contribution to the area of sentiment analysis by offering a wide range of techniques, diverse data sources, and unique analytical approaches. From examining the effects of COVID-19 news on financial markets to employing cutting-edge machine learning and deep learning techniques to assess sentiment on social media sites like Twitter, each scientific paper provides an innovative point of view. As a result of the mentioned research, it has been observed that deep-learning-based language models and lexicon-based techniques are two methodologies that may be included to further enhance one’s comprehension of the feelings conveyed throughout the pandemic. Overall, the above-mentioned publications establish a strong framework that not only reflects the complex nature of sentiment analysis but also serves as a useful starting point for the current study, which aims to provide a thorough bibliometric viewpoint on the intricate dynamics of public opinion in the COVID-19 period.
As the COVID-19 pandemic was a phenomenon that has affected people worldwide, with effects in various domains such as the economy, education, health care, transportation, etc., and with effects on social interactions, the body of the literature associated with the sentiment analysis conducted on datasets extracted during the COVID-19 pandemic is different from the research published on various other topics. The difference is mainly caused by the multifaceted approach in studying a global phenomenon that has affected people and economies differently worldwide. As a result, the sentiment analysis studies have been conducted at the country-related level for better extracting people’s opinions related to the various measures governments were taking for limiting or stopping the spread of the pandemic [14,15,16,17]. Also, as the pandemic has affected people with different health conditions and of different ages, the sentiment dynamics related to the government decisions has boosted the discourse on various social media platforms, enhancing the body of literature related to how the sentiments fluctuate as a response to major events or policy changes [18]. Moreover, as some of the pandemic-limiting measures have imposed lockdowns and social distancing measures, some of the works on sentiment analysis have focused on mental health and well-being [19,20,21]. Furthermore, as the spread of inaccurate information has been detected related to the various measures considered by governments for limiting the spread of COVID-19, the role of misinformation and the infodemic in shaping public sentiment has also been studied [15,22,23]. Nevertheless, as the COVID-19 pandemic has manifested for a longer period of time than other events studied through sentiment analysis (e.g., stock price prediction, general perceptions on vaccinations, and evaluations of hotels, restaurants and other tourist attractions), the studies have included a long-term overview on the sentiments’ evolution, sometimes related to the major general events presented in the media (e.g., the creation of a vaccine, the administration of a second and thirst booster dose, the occurrence of a new COVID-19 variant, etc.) [24].
Given the magnitude of the COVID-19 pandemic and the extensive body of literature it has engendered, this endeavor aims to undertake a thorough bibliometric analysis of the existing corpus pertaining to sentiment analysis within the context of the COVID-19 era.
In order to assess the structure of the works published in the period of the COVID-19 pandemic and related to sentiment analysis and to observe their evolution, a bibliometric analysis has been considered. The rationale behind using this approach relies on the fact that bibliometric analysis [25] offers the needed information for properly identifying the impactful articles, authors, and journals within the sentiment analysis field in the time of COVID-19. Therefore, the aim of this paper is to provide an overview about the structure of publication output during the COVID-19 pandemic in connection with the sentiment analysis papers.
In this context, this paper aims to respond to the following research questions:
- Which are the most impactful articles in the area of sentiment analysis published during the COVID-19 pandemic?
- Who are the most prominent authors in the area of sentiment analysis published during the COVID-19 pandemic?
- Which have been the preferred journals for the papers published in the area of sentiment analysis during the COVID-19 pandemic?
- Which have been the most impactful journals in the area of sentiment analysis during the COVID-19 pandemic?
- Which are the leading universities in the area of sentiment analysis considering the papers published during the COVID-19 pandemic?
- How has the scientific production related to sentiment analysis evolved during the COVID-19 pandemic?
- What are the characteristics of the collaboration network between the authors who have published in the area of sentiment analysis during the COVID-19 pandemic?
The analysis conducted in this paper commences with the extraction of a series of articles through the utilization of specific tools and methodologies, which will be explicated in the forthcoming sections.
The subsequent sections of this paper follow a structured sequence. Section 2 delineates the procedures entailed in dataset extraction and the ensuing bibliometric analysis. In Section 3, we expound upon the findings stemming from the bibliometric analysis of the chosen dataset. Section 4 is dedicated to an exploration of the study’s inherent limitations. Finally, the paper concludes with a set of concluding remarks.
2. Materials and Methods
In order to identify the impactful articles, authors, and journals within the sentiment analysis field in the time of COVID-19, a bibliometric analysis has been considered.
Based on the scientific literature, it was observed that bibliometric analysis has been chosen as an analysis method by works from various fields, encompassing a wide variety of topics, such as, but not being limited to, educational artificial intelligence [26], Twitter-related studies [27], digital era governance [28], eco-innovation and sustainable development [29], terror study [30], education for sustainability [31], grey systems theory [32], and cybernetics [33].
In this paper, we have followed a two-part analysis, which comprises the dataset extraction part and the analysis part.
The first part refers to data extraction through the Clarivate Analytics’ Web of Science Core Collection, formerly known and referred to as the Web of Science (WoS) platform [34]. The choice for using the WoS platform resides on two main reasons related to the extensive coverage of various disciplines [35,36], while being less inclusive in terms of journals, making it generally acknowledged for its reputation among the scientific community [37]. These ideas were further supported by Bakir et al. [38] when justifying the use of the WoS platform for their bibliometric study. Additionally, it shall be mentioned that the WoS platform has been the main choice for the bibliometric studies conducted on various themes/areas/domains [26,27]. While we acknowledge the possibility of using other databases for the dataset extraction, such as Scopus, IEEE, Google Scholar, PubMed, and the Cochrane Library, our primary choice was the WoS platform mainly due to the above-mentioned reasons, doubled by the possibility offered by the used bibliometric analysis tool, Biblioshiny, to directly import the raw data extracted from WoS. It shall be noted that two of the most used platforms for bibliometric analysis, namely VOSviewer and Biblioshiny, offer a limited data reading capacity from the exiting bibliographic database documents. VOSviewer offers the possibility to import raw files extracted from WoS, Scopus, Dimensions, Lens, and PubMed [39], while Biblioshiny is limited to the raw files extracted from WoS, Scopus, Dimensions, Lens, PubMed, and the Cochrane Library [40].
Furthermore, it shall be stated that the WoS platform offers personalized data access based on subscription. As Liu [41] and Liu [42] pointed out, it is mandatory for a paper employing bibliometric analysis to provide the access the authors had to the WoS platform. As a result, we must state that, in our case, the access was a complete one, encompassing all 10 indexes offered by the WoS platform, namely:
- Science Citation Index Expanded (SCIE)—1900–present;
- Social Sciences Citation Index (SSCI)—1975–present;
- Emerging Sources Citation Index (ESCI)—2005–present;
- Arts and Humanities Citation Index (A&HCI)—1975–present;
- Conference Proceedings Citation Index—Social Sciences and Humanities (CPCI-SSH)—1990–present;
- Conference Proceedings Citation Index—Science (CPCI-S)—1990–present;
- Book Citation Index—Science (BKCI-S)—2010–present;
- Book Citation Index—Social Sciences and Humanities (BKCI-SSH)—2010–present;
- Current Chemical Reactions (CCR-Expanded)—2010–present;
- Index Chemicus (IC)—2010–present.
Employing the widely recognized ISI Web of Science platform (WoS) [34], we meticulously retrieved and scrutinized papers intimately related to the COVID-19 pandemic and the realm of sentiment analysis via a comprehensive bibliometric analysis.
Four steps were considered for the data extraction part, as discussed in the following.
The first exploration step was represented by the search action, using the available filters provided by the WoS platform. The initial query returned 16,710 articles that contained the specific keyword “sentiment analysis” in either the title, abstract, or keywords section. The second query had the purpose of extracting only the articles that include one of the keywords related to COVID-19 (“coronavirus” or “COVID-19”), and based on this, we obtained a significative value of 464,584 articles. Since the purpose of this study is to extract articles that address the topic of sentiment analysis in the age of COVID-19, the final query of this step aimed to return only papers that include both sentiment analysis and COVID-19, so after the intersection of the two criteria, 1127 articles resulted. Please consult Table 1 for more details.
The second step was represented by the language criterion. Therefore, out of the 1127 articles resulting from the first step, there remained only 1116 papers written exclusively in English in our area of interest. The English language was chosen for this criterion, taking into consideration the fact that it is among the most well-known languages throughout the world, the majority of researchers and readers being able to read, understand, and write in English. Also, English has been considered as an exclusion criteria for the bibliometric studies conducted in the scientific literature—please consider the following papers as examples: Fatma and Haleem [29], Stefanis et al. [30], and Gorski et al. [31].
The next criterion used was document type, meaning that only publications marked as articles were considered for further analysis. This option was in line with other bibliometric studies from the field [29]. We should mention here that the classification of a paper as being an “article” is, as stated even by Donner [43], a report of original research, which can have any length, which includes meta-analyses. This classification of various types of scientific papers into the “article” category is in line with the approach used by both the WoS and Scopus databases when indexing the research papers. For example, on the WoS website, it is stated that an “article” is “reports of research on new and original works that are considered citable. Includes research papers, brief communications, technical notes, chronologies, full papers, and case reports (presented like full papers) that were published in a journal and/or presented at a symposium or conference” [44]. Also, the WoS website states: “Proceedings papers will have a dual document type: Article; Proceedings paper” [44]. Similar information can be found in a content coverage manual published online by Scopus, where by “article” the following definition is given: “original research or opinion, also includes conference papers” [45]. Therefore, by selecting the document type as “article”, proceedings papers are not excluded from the analysis. As Donner [43] stated, usually in bibliometric analyses, the document type is an important aspect for restricting the publications to the ones containing primary research results. Furthermore, the author highlighted that, in scientometrics, it is important to differentiate across various document types due to their specific purposes and contents, which might cause different citation distributions [43]. After applying this filter, the number of papers was limited to 882.
The last step, namely step 4, consisted of limiting the year of publication for the selected dataset. Since preparing the dataset was undertaken in October 2023, this year was excluded from the analysis because it is still ongoing at this moment, and the results are not considered to be relevant compared to other years. This approach has also been used by Moreno-Guerrero et al. [26]. Thus, the timespan was considered to end in 2022, while for the initial year of the dataset, no restriction has been imposed, being known that this year could be either 2019 (the year in which the COVID-19 pandemic occurred) or any subsequent years (2020, 2021, or 2022). Therefore, the initial year of the dataset depends on the imposed keywords and on the exclusion criteria used, namely the language of the papers (English) and the type of paper (article). This action had the consequence of reducing the final number of articles selected for analysis to 646 papers.
All the steps that were followed to gather the relevant articles for this study are captured in Table 1.
As for the second part of the analysis, the Bibliometrix package was loaded in the RStudio console window through the use of the biblioshiny( ) command [40]. This package was developed by Aria and Cuccurullo [40] and provides a strong ability to analyze data and to create graphs and insightful tables related to the provided articles database.
The central part of the bibliometric analysis was structured into six distinct steps, as illustrated in Figure 1. The first step involved an overview of the dataset, aiming to establish the context and boundaries of the research domain. This entailed extracting and discussing various indicators, including but not limited to the number of sources, the number of authors, the prevalence of single-authored documents, co-authorship patterns, international collaboration rates, authors’ keyword usage, the annual growth rate of papers, the average publication age, the average number of citations per document, and the average citations per year per document. Additionally, the number of references used in the selected papers was examined.
The second step centered on the analysis of sources where the papers were published. This analysis highlights the most significant journals by assessing the number of papers they published within the dataset. The H-index for the most prominent sources is also provided along with their names.
The third step delved into an analysis of the authors. This included identifying authors with the most published papers and the highest number of citations. Details related to their countries, affiliations, and collaborative networks were expounded upon.
The fourth step scrutinized individual papers, offering a list of the top 10 most cited papers. This list provides information regarding their citation counts and the average number of citations per year. Furthermore, a review of the selected top 10 papers is furnished to highlight the primary research interests that have garnered substantial attention within the scientific community. We would like to acknowledge that the total number of citations criterion used for selecting the papers for which the review was performed might be influenced by the publishing date of the paper (offering more chances to be cited to the papers published in the early stages of the COVID-19 occurrence). With all these, as the top 10 most cited papers have obtained the highest number of citations among the papers included in the dataset, we believe there is clear evidence that these papers have succeeded in reaching a broad audience, which found them interesting and used them as a base for further research.
The fifth step involved an n-gram analysis of the words employed in titles, abstracts, and keywords. This analysis aids in better comprehending the main focus and themes elucidated in the papers within the selected database.
The final step, labeled “mixed analysis”, established connections between authors, their respective countries, the sources in which they have published, the keywords they have employed, and their affiliations. This comprehensive approach enhances our understanding of the intricate web of relationships within the research domain.
3. Dataset Analysis
This section provides an in-depth analysis of the ultimate set of papers within the realm of COVID-19 and sentiment analysis, achieved through the application of essential filters. This analysis encompasses a multifaceted examination, considering various aspects such as sources, authors, citations, and the broader literature, following the systematic steps delineated in the preceding section.
3.1. Dataset Overview
The dataset is comprised of 646 papers, which are analyzed in the tables below using a detailed set of indicators. The documents were published in 310 journals during a limited period—more exactly, between 2020 and 2022. The mentioned period was a consequence of the selected keywords, the imposed type of paper (article), the imposed language of the papers (English), and the imposed upper bound (the year 2022). The low value of 1.55 for the average years of publication indicates that the dataset includes recent papers.
Furthermore, based on the information focused on in Table 2, the average citations per document is equal to 14.43, which suggests that the content from the papers triggered the attention of the scientific community, and due to this, there is a significative increased value for the average citations per year per document, namely 4.709.
When it comes to references, the substantial number of 24,445 has been recorded.
Figure 2 indicates that the annual scientific production has exhibited a significant rise in the number of published papers. This increase commenced in 2020 with 54 documents and surged to 347 documents by 2022, yielding a remarkable annual growth rate of 153.49%.
The evolution of the average number of citations per year’s value can definitely be noticed in Figure 3. The information provided in Figure 3 is determined based on the value of the MeanTCperArt (mean total citations per article) indicator. In 2020, the year the pandemic commenced, this metric surged to 16.4. This notable value could signify that the domain of sentiment analysis during the COVID-19 era garnered substantial interest and gained significant visibility within scientific research. Beginning in 2021, the metric gradually began to decline. One of the possible reasons for the declining trend observed in Figure 3 could be related to the fact that the papers written in 2021 and 2022, compared to the ones published in 2020, had little time for being read and cited by the researchers in their work. This observation anticipates the analysis carried out in Section 3.4.1. in which one can observe that in the top 10 most cited papers, 8 papers are published in 2020 and only 2 papers in 2021.
Table 3 presents information concerning the content of the documents. The dataset encompasses a total of 1640 keywords. On average, each document is associated with 2.54 keywords. Additionally, there are 620 index terms, referred to as “keywords plus”, which are automatically generated from the titles of cited articles. On average, there are 0.96 keywords plus per document. Further investigating the provided values, it has been observed that regarding the authors’ keywords, for 38 papers, representing 5.88% of the selected papers, the WoS database has not offered this information. As Liu [46] mentioned, the situation has been observed even in the case of other datasets extracted from the WoS database. Liu [46] underlines that the occurrence of this situation is mostly encountered for the papers published long before our days, when WoS was not retrieving this information from the journals or the journals did not ask for this information from the authors. As the dataset features papers recently published, neither of the two mentioned situations could be the reasons behind the missing data. Thus, we again extracted the dataset, but the problem persisted. As a result, when calculating the authors’ keywords per document, we considered only the 608 papers for which the authors’ keywords were available. As a result, an average value of 2.69 authors’ keywords was obtained per document. Regarding the obtained value, it can be stated that it is within the expected range [47].
Based on the data provided in Table 4, it is evident that there are a total of 2458 authors, with an overall number of appearances amounting to 2779. Comparing the number of authors of single-authored documents, which is 31, to the total number of documents, which is 646, it can be inferred that the field of sentiment analysis during the COVID-19 era is characterized by a dense collaboration network among authors. This observation is further supported by the comparison between 2427, the number of multi-authored documents, and 2458, the total number of authors.
Table 5 highlights that researchers who have authored papers as single authors have an average of 1 document each. This insight is derived from dividing the number of single-authored documents, which is 31, by the number of authors of single-authored documents, which is also 31. Additionally, there is an average of 0.263 documents per author, 3.8 authors per document, and 4.3 co-authors per document. The higher collaboration index, specifically 3.95, suggests that authors often chose to collaborate with their peers during their research endeavors.
3.2. Sources
Figure 4 offers insights into the top 15 most significant sources, categorized according to the number of publications. A cursory examination of the figure reveals that the Journal of Medical Internet Research holds the top position with 45 papers, closely followed by the International Journal of Environmental Research and Public Health, which boasts 38 papers.
Other significant sources that are connected to the public health, psychology, and computer sciences fields include IEEE Access—with 20 papers, Sustainability—with 19 papers, Applied Sciences-Basel and PLOS ONE—each with 15 papers, International Journal of Advanced Computer Science and Applications—with 14 papers, and Frontiers in Public Health and Healthcare—each with 11 papers, followed closely by other journals, as can be observed below.
The application of Bradford’s law serves to underscore the importance of the sources listed previously. From a theoretical point of view, Bradford’s law sorts the extracted journals into three categories based on the number of published papers [48,49]. According to Bradford’s law, if the proportion of the articles in each category is one-third of all articles, then the number of journals in each group would be proportional with [48,49]. In accordance with this principle, these sources can be categorized into three zones. The first zone, known as Zone 1, encompasses a limited number of highly productive periodicals that are frequently cited in the scientific literature. Zone 2 comprises a more extensive set of moderate producers that maintain an average level of citations. Zone 3 encompasses a considerably larger body of sources characterized by continuously declining productivity, and they are only occasionally cited in the scientific literature.
Figure 5 brings into the foreground Bradford’s law on source clustering. In our case, Zone 1, which represents one-third of the journals frequently cited in the scientific literature, consists of 12 sources, namely, Journal of Medical Internet Research, International Journal of Environmental Research and Public Health, IEEE Access, Sustainability, Applied Sciences-Basel, PLOS ONE, International Journal of Advanced Computer Science and Applications, Frontiers in Public Health, Healthcare, Jmir Public Health and Surveillance, Social Network Analysis and Mining, and last but not least, Frontiers in Psychology.
Furthermore, to prove the impact of each journal, an analysis based on an H-index indicator was conducted, beginning with the premise that the H-index is a metric used to determine the number of research articles that were accepted for publication in a certain journal and have each been referenced H times.
Based on the selected journals captured in Figure 6, the Journal of Medical Internet Research has 19 papers with 19 or more citations, presenting the highest value for the H-index and being first placed in top. It can also be noticed that most of the journals categorized previously as belonging to Zone 1 when using Bradford’s law count amongst the highest-ranking journals when considering the H-index.
Figure 7 delineates the growth of journals based on the number of papers published within the chosen timeframe. The top 6 sources are enumerated below, with the Journal of Medical Internet Research securing the top spot with 38 cumulative occurrences, closely trailed by IEEE Access, which boasts 22 cumulative occurrences, as anticipated.
3.3. Authors
The most significant and famous authors are presented in Figure 8, ranked according to the number of published documents in the field of sentiment analysis in the age of COVID-19—when creating Figure 8 we have imposed a minimum number of 4 published papers.
The author who is placed in the top position is Lu X with six documents, comprising 0.92% of the total number of collected articles. With five documents, Shah AM is ranked second, followed closely by 13 other authors, each counting four documents (Ali GGMN, Garcia-Zapirain B, Kumar S, Kumar V, Lee E, Li Y, Mishra S, Rahman MM, Rustam F, Samuel J, Tan X, Wang B, and Wang Y).
According to Figure 9, it can be observed that the most recent papers written by the top 20 most important authors, based on the number of published documents, were written mainly starting in the year 2021. This also suggests that the beginning of the COVID-19 pandemic generated, approximately one year later, the significant interest of several researchers in the area of the analysis of sentiment, from which occurs the increased number of articles written during that period.
The top 20 most relevant affiliations of the authors, based on the number of written articles, are organized in Figure 10. In first position is King Saud University from Saudi Arabia with a remarkable number of 14 papers, followed closely by other famous universities.
Figure 11 captures the top 20 most relevant corresponding authors’ countries. As can be observed, China is ranked first, with a significative number of 105 documents, representing 16.25% from the selected papers. China also registered top values for MPC—multiple-country publications and SCP—single-country publications: respectively, 39 and 66.
Other relevant countries that registered great values include the USA, India, Saudi Arabia, Canada, and the United Kingdom. For the entire list, please see Figure 11.
The scientific production based on country is suggestively presented using colors in Figure 12.
The dark blue color in Figure 12 suggests a significant number of documents written in the area of sentiment analysis in the age of COVID-19, and as expected, the highest number is registered in the USA with 381 documents, followed immediately by China with 308 documents, and India with 175 papers. The more intense the color, the greater number of published documents in that specific country. The top position held by the USA in the distribution of the countries with the highest number of publications in the area of sentiment analysis and COVID-19 is in line with the results obtained by Sarirete [50] on a bibliometric study featuring sentiment analysis and the COVID-19 vaccines. Additionally, by considering other bibliometric studies focusing on sentiment analysis in various areas, the remarkable contributions of both the USA and China have been observed, which in general, held the first positions. The reader can refer to the works of Kamath et al. [51] in the area of investor sentiment, Kale [52] in the bibliometric analysis conducted on sentiment analysis in library and information science, and Yaqub et al. [53] in the tourism industry, who highlight the top position occupied by the USA and the second position held by China, or to the works of Qiang et al. [54] in the area of network public opinion and Nyakurukwa and Seetharam [55] regarding the evolution of social media sentiment in the stock market—who highlight the leader position of China, followed by the USA.
The top 20 countries with the highest number of citations written by their researchers are shown in Figure 13. In the leading position is China, boasting the notable number of 2175 citations, followed by the USA with 1972 citations. India secures the third spot with 827 citations.
China scored 20.70 for average article citations per paper, a higher value compared to the USA’s 19.50 average article citations and India’s 10.30 average article citations.
Other relevant countries are captured below; please see Figure 13.
Figure 14 presents the country collaboration map. By analyzing the picture below, it can be stated that the USA is ranked first based on the number of collaborations, counting 38 associations with other countries, out of a total of 268 collaborations. The top 3 countries with which the USA has collaborated in various research articles are China (32 collaborations), Pakistan (10 collaborations), and Korea (8 collaborations).
The visual representation of the collaboration network including the top 50 authors is captured below in Figure 15. As a result, a number of 13 clusters have been identified, ranging from collaborations between 2 and 5 authors.
3.4. Analysis of Literature
This section concentrates on the top 10 most referenced articles, while also providing insights into various facets such as the number of authors, the authors’ countries of origin, the number of citations, the number of citations per year, and more. Additionally, a succinct summary is presented for each article to aid readers in comprehending the information and ideas discussed in relation to sentiment analysis in the context of COVID-19, using the top 10 most cited papers.
In the latter part of this section, the entire dataset is employed to conduct an exhaustive word analysis. The subjects mentioned above are comprehensively addressed in the subsequent pages, offering detailed explanations and accompanied by graphical representations.
3.4.1. Top 10 Most Cited Papers—Overview
As per the data presented in Table 6, the most globally cited document is attributed to Li et al. [56], published in the International Journal of Environmental Research and Public Health, amassing a total of 888 citations (TC), with an annual average of 222 citations (TCY) and a normalized total citation score (NTC) of 13.55 over the past 3 years since its publication. While the first two indicators, TC and TCY, are easy to define and understand, more information should be provided on NTC. First, it should be stated that the NTC metric gives equal credit of citations to all the authors of the paper while accounting for the average citations per document recorded in the database for the year in which the paper was published [32]. In the case of the paper authored by Li et al. [56], the value for the NTC was obtained by dividing the TC by the average citations per document obtained for the papers in the dataset in the year in which the paper authored by Li et al. [56] was published, namely 2020. Considering the dataset, the average citations per document for the year 2020 was 65.56 citations. As a result, the NTC for the paper of Li et al. [56] is equal to 13.55 citations (888 citations divided by 65.56 citations). Thus, it can be stated that the paper of Li et al. [56] received 13.55 times more attention (in terms of citations) than the average attention received by the papers in the dataset.
The second place in terms of citation numbers was secured by Abd-Alrazaq et al. [57], with an impressive 72.25 total citations per year for their paper published in the Journal of Medical Internet Research. The third place is occupied by a document published in the Information Journal, authored by Samuel et al. [58], with a total citation rate of 43.75 per year.
Furthermore, it is noteworthy that the top 10 most globally cited documents have accrued a substantial number of total citations, ranging from 888 to 120, with total citations per year (TCY) values exceeding 30 and normalized total citation (NTC) scores surpassing 1.83. This underscores the substantial impact these articles have had on sentiment analysis research in the context of the COVID-19 era.
As anticipated from the previous information provided, the number of authors per article is relatively high, indicating extensive collaboration at both national and international levels. Among the top 10 most cited documents globally, the lowest number of authors, namely two researchers, is found in the article authored by Boon-Itt and Skunkan [59]. Conversely, the article written by Liu et al. [45] boasts a significant number of authors, totaling 12 researchers. Upon analyzing the data presented in Table 6, the average number of authors for the top 10 most cited documents is 5.1 authors.
3.4.2. Top 10 Most Cited Papers—Review
In this section, succinct summaries are provided for each of the top 10 papers that have garnered the highest number of citations. These summaries offer insights into the primary goals, methodologies applied, and results achieved in the field of sentiment analysis during the COVID-19 era.
The most highly cited article, authored by Li et al. [56], delves into a study focused on the psychological repercussions stemming from the onset of the COVID-19 pandemic. Sentiment analysis was carried out using the online ecological recognition (OER) methodology, involving the use of a variety of machine-learning predictive models that were meticulously trained to analyze and extract emotional (anxiety, depression, indignation, and happiness) and cognitive (social risk judgment and life satisfaction) indicators from the messages posted by Weibo users. The study employed a dataset that comprised posts from over 17,000 active users on the Weibo platform, spanning a two-week period. The research highlighted that the official announcement of the pandemic had a considerable adverse impact on society, resulting in an upsurge in negative emotions such as anxiety, depression, and indignation, coupled with a decline in life satisfaction. The study presented its findings from various perspectives, including demographics, linguistic differences, and emotional and cognitive indicators, while underscoring the imperative need for timely provision of mental health services and the implementation of effective policies. The substantial number of citations amassed over a span of three years attests to the considerable impact of this article within the realm of scientific literature, as well as the heightened interest it has garnered from researchers in the field.
The second article, authored by Abd-Alrazaq et al. [57], centers on the analysis of discussions related to COVID-19 on Twitter within a six-week period, from 2 February to 15 March 2020. Sentiment analysis was employed in the study to uncover the emotional context of COVID-19 discussions on Twitter by giving tweets numerical values for positive, negative, or neutral tones. The overall emotional tone of each issue was reflected by the mean sentiment scores. Following the examination of 167,073 unique English tweets, the study unveils 12 frequently addressed themes categorized into four major groups. These categories encompass discussions concerning the origin and sources of the virus and its impact on individuals, nations, and the economy, as well as methods to mitigate the risk of infection. The sentiment analysis predominantly reveals positive sentiments on various topics, with the exception of discussions pertaining to deaths and racism, underscoring the emotional toll of the pandemic. The study also underscores the significance of social media in comprehending public perceptions and emotions during health crises, while sounding the alarm about the perils of fake news.
The article by Samuel et al. [58] delves into an analysis of the repercussions of the COVID-19 pandemic, with a particular focus on the emotion of fear as expressed in user messages on the Twitter social platform. The study employs advanced analysis techniques to classify sentiments of fear and negativity, demonstrating the efficacy of classification methods such as naïve Bayes and logistic regression. The research also includes a comparison of textual classification mechanisms and showcases their utility when applied to tweets of varying lengths. The findings indicate a significant upsurge in fear during the pandemic. The authors emphasize the importance of sentiment analysis in furnishing crucial information for decision-makers, aiding in the development of appropriate and timely strategies during challenging societal moments.
The study conducted by Boon-Itt and Skunkan [59] aimed to raise awareness about the trends of the COVID-19 pandemic and identify significant themes of concern expressed by Twitter users. The research delineated six primary topics across three major stages of the pandemic: the initial stage characterized by panic and worry, followed by the global epidemic stage, and, ultimately, the stable stage marked by a shift toward a more positive public awareness. In terms of methodology, the analysis involved the application of natural language processing techniques, sentiment analysis, and topic modeling, including latent Dirichlet allocation (LDA), to extract meaningful patterns from the extensive volume of tweets related to COVID-19. The study reveals that the predominant emotion associated with the pandemic, as observed among Twitter users, is fear. Consequently, this article offers valuable insights into the factors influencing decision-making and strategies, while emphasizing the importance of vigilantly monitoring public sentiment on online platforms and countering the dissemination of fake news.
In their research paper, Chakraborty et al. [60] explored the critical importance of accurately analyzing messages obtained from social media texts, with a specific focus on tweets during the COVID-19 pandemic. Their proposed approach makes use of fuzzy logic to account for the uncertainty and diversity of the emotions expressed in tweets. The procedure entails text preprocessing, labeling with the VADER sentiment lexicon, and sentiment prediction through a rule-based fuzzy system. The fuzzy model employs Gaussian membership functions for input and output sentiments and follows seven fuzzy rules for inference. The research paper also assesses the model’s accuracy on multiple datasets, highlighting its relevance in the context of sentiment analysis during a global pandemic. Furthermore, it underscores the responsibilities of individuals when sharing information on social media, advocating for verified sources and appropriate legal measures to curb the dissemination of fake news. The conclusion underscores the need for further research in related areas and emphasizes the significance of establishing a centralized repository of pandemic-related material for the accessibility of researchers, healthcare professionals, and the general public for study purposes.
The study conducted by Zhao et al. [61] aimed to gain insights into the public’s reactions, emotions, and major concerns associated with the early stages of the COVID-19 outbreak in China. Data were collected from the Sina Microblog hot search list between 31 December 2019 and 20 February 2020. The researchers employed the ROST Content Mining System for word segmentation, frequency analysis, and sentiment analysis. The research identifies shifting patterns of public attention, emotional transitions, diverse hot topics, and key categories of concern related to the COVID-19 epidemic. Furthermore, the study divides the public’s reaction to the epidemic into three distinct stages and carefully examines emotional attitudes. Notably, the top keywords change across these stages, indicating varying public concerns. The data reveal that as the pandemic progressed, public opinion shifted from negative to neutral, with an increase in positive sentiments. Additionally, the study categorizes the primary concerns into five groups, providing insights that can assist authorities in effectively communicating and planning specific measures to control the outbreak.
The comprehensive paper authored by Shorten et al. [62] explores a wide range of deep learning applications within the context of the COVID-19 outbreak. The primary objective is to enhance and refine COVID-19 response techniques by harnessing various data sources, including clinical records, molecular data, medical imaging, and scientific literature. The paper provides a detailed overview of the diverse applications of deep learning spanning natural language processing, computer vision, epidemiology, and life sciences. It highlights both the benefits and drawbacks of incorporating deep learning into these areas. The results of the study indicate significant advancements in COVID-19 diagnosis. However, the authors stress the crucial importance of addressing the inherent challenges within the field of deep learning to pave the way for the responsible and effective application of deep learning in the ongoing battle against COVID-19.
Lyu et al. [63] conducted an analysis of discussions related to COVID-19 vaccination, as well as the sentiments and opinions expressed by the public on this contentious topic. The analysis involved a substantial number of English tweets collected over nearly a full year. R software and natural language processing (NLP) methods were employed, with key topics identified using latent Dirichlet allocation (LDA), a topic modeling technique. Additionally, sentiment and emotion analysis of tweets was conducted using the Emotion Lexicon of the National Research Council of Canada to assess public reactions to vaccination. The study’s findings revealed that discussions were influenced by significant vaccine-development-related events, and overall sentiment shifted toward a more positive perception, particularly following the announcement of the Pfizer vaccine’s efficacy. Trust emerged as the most prevalent emotion, underscoring the significance of vaccination. The results underscore the importance of understanding public discourse and opinions in order to effectively manage vaccination campaigns.
Liu et al. [64] undertook an in-depth and comprehensive analysis of China’s news reports as extracted from the WiseSearch database during the early phase of the COVID-19 pandemic, spanning from 1 January to 20 February 2020. The primary objective of this research was to investigate the methods employed by the media in conveying crucial health-related information, communication patterns, popular topics, and the media’s role in educating the public about the coronavirus, encompassing its transmission, prevention, and broader societal implications. The study processed the 7791 extracted articles using Python software and the Python Jieba package for text segmentation and employed latent Dirichlet allocation (LDA) for topic modeling. The results of the research revealed that the main topics addressed included medical treatment and research, global/local social and economic impacts, preventive measures, and control techniques. Additionally, the study highlighted that media coverage of COVID-19 lagged behind the actual development of the pandemic, underscoring the importance of the media in disseminating critical information during a public health emergency and the necessity of improving the speed and accuracy of reporting.
In the study carried out by Xue et al. [65], an extensive dataset of approximately 1.9 million English tweets spanning from 23 January to 7 March 2020 was analyzed to gain insights into public discourse and the sentiments expressed by Twitter users regarding the COVID-19 pandemic. The investigation involved data preprocessing and the application of unsupervised machine learning, specifically latent Dirichlet allocation (LDA), to identify 11 critical topics related to COVID-19. A qualitative analysis was also conducted to categorize these topics into 10 themes, including confirmed cases, COVID-19-related deaths, preventive measures, and more. The sentiment analysis revealed that the prevailing emotion was fear of contracting the virus. The study offers implications for mental health support during the crisis, provides valuable real-time data on public sentiment, and underscores the importance of utilizing social media data to track trends and identify patterns.
Based on the data presented by Table 7, it can be observed that all the top 10 most cited articles address the topic of sentiment analysis in a critical period of humanity, using different methods and algorithms. Regarding the data used, 6 out of 10 articles used messages collected from the Twitter platform [57,58,59,60,63,65], while others used data from Weibo [56], Sina Microblog [61], and WiseSearch [64], or in the case of the article [62], where a more complex analysis was based on deep learning, the data used were extracted from medical imaging data, text and literature data, health records data, molecular and biological data, and mobility and interaction data. The main purpose of all articles is to analyze how the pandemic affects society and the impacts it has on people, along with developing strategies to improve policy decisions and health services.
3.4.3. Words Analysis
In this section, an analysis is carried out on keywords plus, authors’ keywords, titles, and abstracts in order to identify the most frequent terms used in the selected documents and to gain a more comprehensive understanding of the research conducted, the domains, the topics, and subjects that are being discussed, and the desired methodologies, objectives, area of focus, and trends.
Table 8 highlights the top 10 most frequent works in keywords plus, found in the selected set of documents. Based on the information provided, “social media” is ranked first with 69 occurrences, followed by “sentiment analysis” and “twitter”—each with 49, “impact”—43, “information”—29, “health”—28, “classification”—24, “media”—22, “COVID-19”—21, and “model”—19.
As expected, the extracted keywords plus emphasize that the documents focus on sentiment analysis through social media platforms, especially Twitter, and examine the impact of COVID-19 on health and information, using techniques that include classification and models.
The top 10 most frequent words in authors’ keywords are also related to the sentiment analysis area in social media during the COVID-19 pandemic, including some specific words related to the techniques used for the analysis—machine learning, natural language processing, topic modeling, and deep learning.
Table 9 contains the following results: “sentiment analysis” with 426 occurrences, “COVID-19”—401, “twitter”—159, “social media”—142, “machine learning”—75, “natural language processing”—71, “topic modeling”—53, “deep learning”—46, “coronavirus”—45, and “pandemic”—42.
Figure 16 illustrates the top 50 words from the two categories discussed above, namely keywords plus and authors’ keywords. The use of color has the purpose of creating a visually pleasing representation of the words.
The analysis of the top 10 most frequent bigrams in abstracts and titles results from Table 10. At first glance, it can be observed that the first three bigrams are the same for both the abstracts and titles. The leadership position is held by “sentiment analysis”, followed by “social media” and “COVID-pandemic” but in a different order. This result is indeed expected, considering that sentiment analysis during the COVID-19 pandemic through social media is the main subject being covered, as can be straightforwardly seen from the previous analysis of the first 10 most referenced articles.
In the case of trigrams, only “natural language processing” is found in both abstracts and titles in the first position. For abstracts, the second place is taken by “social media platforms”, followed by “latent Dirichlet allocation”, while for titles, there are “social media data” and “twitter sentiment analysis”. For more details, kindly refer to Table 11.
3.5. Mixed Analysis
A mixed analysis is conducted in this section, using three-field plots for emphasizing the correlation between distinct categories.
Figure 17 highlights the connection between countries, authors, and journals. As expected, the USA has the most famous authors, of which Lu X is ranked first, and Healthcare is the journal with the highest number of published papers.
Furthermore, it is worth noting that among the identified researchers, there are authors who hold affiliations with multiple countries, indicating the presence of international collaborations in the field of sentiment analysis during the COVID-19 era. Another noteworthy observation is that a significant number of researchers opted to publish their articles in various journals rather than concentrating their contributions in a single publication.
The second mixed analysis is presented in Figure 18—this time between affiliations, authors, and keywords.
As can be seen from Figure 18, the top examples of the authors’ most popular keywords include “sentiment analysis”, “COVID-19”, “twitter”, “machine learning”, and “coronavirus”, all closely related to the area of sentiment analysis in the age of COVID-19. The largest majority of the mentioned authors use at least five of the extracted keywords, which is also evident from the titles of the analyzed research articles. In terms of affiliations, the well-known University of Edinburgh is ranked first, followed by nine other prestigious universities in the world. Furthermore, it should also be mentioned here that among the selected authors, there are researchers who were affiliated with universities in foreign countries, from where international collaborations arise, as well as cases of affiliation over their time at various universities in their native countries. At the same time, there are also authors who were not affiliated with any of the top 10 universities selected. For more details, please see Figure 18.
4. Discussions
The bibliometric analysis in this paper, examining the scientific literature on sentiment analysis during the COVID-19 period, revealed a heightened interest in this topic within the research community throughout the analyzed timeframe.
As a result, it has been observed that, in terms of most relevant sources, the Journal of Medical Internet Research and the International Journal of Environmental Research and Public Health differentiate themselves from the rest of the journals, gathering 83 published papers from the total number of 646 papers included in the dataset. Furthermore, analyzing the publishing policies of the top 10 most prominent journals in terms of the number of papers published in the area of sentiment analysis during COVID-19, it was observed that these top 10 publishing journals—namely the Journal of Medical Internet Research, International Journal of Environmental Research and Public Health, IEEE Access, Sustainability, Applied Sciences, PLOS ONE, International Journal of Advanced Computer Science and Applications, Frontiers in Public Health, Healthcare, and JMIR Public Health and Surveillance—are all supporting the open access policy for their published papers. Thus, by analyzing the journals’ local impact based on the H-index, it can be observed that the journals that comprise the top 10 most prominent journals in terms of the number of published papers have also been listed among the journals with the highest impact based on the H-index—e.g., the Journal of Medical Internet Research, International Journal of Environmental Research and Public Health, IEEE Access, Sustainability, Applied Sciences, PLOS ONE, and JMIR Public Health and Surveillance—and the open policy practice can be one of the top positions occupied by these journals, as it enables fast and free access to the published papers for researchers worldwide. Furthermore, by considering other bibliometric works from the field that have approached similar topics, it was observed that some of the above-mentioned journals have proved to be the preferred journals for the authors publishing papers related to sentiment analysis. For example, in the paper authored by Yu and Munoz-Justicia [27], which focuses on the bibliometric analysis of the Twitter-related studies, the authors listed PLOS ONE, Social Network Analysis and Mining, and the Journal of Medical Internet Research among the top 10 most relevant sources. Also, Sanchez-Nunez et al. [66], in a paper featuring a bibliometric analysis on opinion mining, sentiment analysis, and emotion understanding, have identified among the top 10 most relevant journals the following sources, which have also been identified in the present study: Frontiers in Psychology, PLOS ONE, Sustainability, and the International Journal of Advanced Computer Science and Applications. Moreover, IEEE Access has been listed among the top preferred sources in the bibliometric studies conducted by Puteh et al. [67] in the area of sentiment analysis with deep learning and by Sarirete [50] in the area of sentiment analysis in the context of COVID-19 vaccines. As these journals have been mentioned in multiple bibliometric studies from the area of sentiment analysis, this allows us to believe that these journals are representative for this research area, which makes them chosen by the research community.
Considering the most active affiliations, it has been observed that some of the universities listed as top contributors in the area of sentiment analysis in the time of COVID-19 have also been identified as top contributors in the area of sentiment analysis according to other bibliometric studies. For example, King Saud University, which was listed as a top contributing university in our research, can also be identified in the top 3 contributing universities for studies in the area of sentiment analysis associated with the decision models in marketing, as reported by Casas-Valadez et al. [68]. Furthermore, Harvard Medical School was listed in the third position based on the contribution in the current study and was listed as a first contributor by Sarirete [50] in a bibliometric paper in the area of sentiment analysis in the context of COVID-19 vaccines, while Sichuan University—listed in the 16th position in the present study based on the number of published papers—has been listed as the first contributor by Bagane et al. [69] in a bibliometric paper related to stock market prediction using sentiment analysis and long short-term memory (LSTM). Also, Tsinghua University—listed in the 12th position in the current paper based on the number of published papers—has been listed in 4th position by Puteh et al. [67] in a paper featuring the bibliometric analysis of the sentiment analysis with deep learning, while the University of Malaya—listed in the 19th position in the current study—has been listed in 18th position in a bibliometric study in the area of opinion mining, sentiment analysis, and emotion understanding in advertising authored by Sanchez-Nunez et al. [66]. Thus, as some of the top contributing universities have also been identified among the top contributing universities in similar studies, the interest of the top contributing universities for studies in the area of sentiment analysis can be highlighted once more.
By analyzing the most relevant authors’ keywords, in addition to the “sentiment analysis”-related keywords and the keywords associated with the COVID-19 pandemic, which are specific to the current study, it can be observed that in the bibliometric analyses conducted on the sentiment analysis field by various authors from the field, there are a series of authors’ keywords that are similar to the ones extracted in this paper, such as “twitter” [50,54,55], “social media” [27,50,52,54,55], “machine learning” [27,52,55,67], “natural language processing” [50,55,67], “topic modeling” [52], and “deep learning” [52,55,67]. Furthermore, in terms of keywords plus, which are specific to the analyses conducted on the papers extracted from the WoS database, the following keywords plus have been identified in the study conducted by Yu and Munoz-Justicia [27] on Twitter-related studies indexed in WoS: “social media”, “impact”, “media”, and “model”.
Last, regarding the topic of the top 10 most cited papers in the area of sentiment analysis in the time of COVID-19, it has been observed that the papers can be grouped into several general themes, such as:
- Psychological impact and well-being: examining the psychological impact of the COVID-19 pandemic on mental well-being [56], sentiment analysis during the COVID-19 pandemic with a focus on fear [58], analyzing emotional responses and concerns of the public during the early stages of the epidemic [61];
- Social media analysis: identifying common topics on Twitter related to the COVID-19 pandemic [57], raising awareness about pandemic trends and concerns expressed by Twitter users [59], investigating public discourse on social media, including topics, themes, emotional reactions, and sentiment changes [65];
- Media and communication: examining trends in media-driven health communications in the context of the COVID-19 pandemic and gathering media reports to understand media’s role in the pandemic [64];
- Considering the above-mentioned themes, it can be observed, as expected, that all of them are gravitating around the COVID-19-pandemic-generated situation and are trying to address sentiment analysis through a multifaceted approach.
5. Limitations
Notwithstanding the valuable insights gleaned from this research, it is essential to acknowledge and discuss the limitations of this analysis.
First and foremost, it is important to note that the selection of articles for inclusion in this analysis was limited to those available in the Web of Science database. While the database is comprehensive, the exclusion of articles not indexed within it may be perceived as a limitation. Expanding the search to encompass multiple databases, such as Scopus, could have potentially enriched the dataset and provided a more comprehensive view of the field.
Furthermore, the choice of specific keywords used for the selection of articles may have influenced the composition of the final dataset. Employing a broader spectrum of keywords could have yielded a different set of data, potentially affecting the outcomes.
Language presents another constraint in this analysis, as only English-language papers were included. This limitation may result in the exclusion of relevant articles authored by non-English speakers, potentially impacting the overall findings.
Additionally, the analysis was confined to works categorized as “articles” within the Web of Science platform. Expanding the scope to include other document types may have substantially increased the number of articles available for analysis.
In light of these selection constraints, it is important to recognize that some articles may have been omitted, potentially affecting the precision of the results. Bibliometric analysis provides a snapshot of the existing literature at a specific moment, and certain emerging trends, strategies, or findings may not have been fully captured.
6. Conclusions
The objective of this article was to provide a comprehensive bibliometric analysis of sentiment analysis during the COVID-19 pandemic, using a dataset of 646 articles extracted from the Web of Science database published between 2020 and 2022.
Utilizing bibliometrics, the study unveiled various trends and perspectives, yielding valuable insights into this domain. It highlighted influential researchers and significant papers, emphasizing the substantial number of articles in this area. The increased citation counts point to a growing interest among researchers in this field during the analyzed period. Among the topics explored and meticulously examined are the following: the evolution of annual scientific production, changes in annual average article citations per year, the most relevant sources, authors actively engaged in research, their countries of origin and affiliations, scientific production by country, collaborative networks among countries, significant journals, word analysis, and much more. Additionally, the study delved into a review of the top 10 most cited papers in this field, providing insights into their data, methodologies, and the subjects addressed, thus enhancing the understanding of the research landscape.
In conclusion, this study holds relevance for the field of sentiment analysis during the COVID-19 pandemic, offering a valuable bibliometric perspective. It underscores the significance of social networks as a rich source for understanding people’s emotions and viewpoints during challenging times, which, in turn, plays a pivotal role in shaping political and medical decisions and devising strategies to enhance overall well-being.
Looking ahead to future research endeavors, these can focus on reducing the limitations of the current study. For example, extracting papers from additional databases (such as Scopus) can provide a more in-depth understanding of the research on sentiment analysis in the time of COVID-19. Additionally, a comparative analysis between the papers written in the area of sentiment analysis in the time of COVID-19 and in the periods of other epidemics could be of interest for better shaping the research community’s interest in sentiment analysis in such difficult periods. Furthermore, a parallel between the pre-pandemic-period and pandemic-period research interests in the area of sentiment analysis could help in better assessing the extent of the surge in interest in this research area and could provide more information related to the changes in the research focus between the two periods. Additionally, a more specific bibliometric analysis, focusing on the various aspects related to sentiment analysis in the COVID-19 pandemic period generated by the different events that occurred in this period—such as the development of vaccines, the government decisions to establish lockdowns and/or mask-wearing mandates, etc.—could also be of interest for gathering a more holistic view of sentiment analysis in the era of COVID-19.
Author Contributions
Conceptualization, A.S., L.-A.C., C.D., L.C. and A.G.M.; data curation, A.S. and L.C.; formal analysis, A.S., L.-A.C., C.D., L.C. and A.G.M.; investigation, A.S., L.-A.C., C.D., L.C. and A.G.M.; methodology, A.S., L.-A.C. and C.D.; software, A.S., L.-A.C. and C.D.; supervision, L.-A.C.; validation, A.S., L.-A.C., C.D., L.C. and A.G.M.; visualization, A.S., L.-A.C., C.D. and A.G.M.; writing—original draft, A.S., L.-A.C. and C.D.; writing—review and editing, L.C. and A.G.M. All authors have read and agreed to the published version of the manuscript.
Funding
This work is supported by a grant from the Romanian Ministry of Research and Innovation, project CNFIS-FDI-2023-0499. This paper was co-financed by the Bucharest University of Economic Studies during the PhD program.
Data Availability Statement
Data is contained within paper.
Conflicts of Interest
The authors declare no conflict of interest.
References
- Zhang, D.D.; Wang, J.; Sun, M. The Progress That Natural Language Processing Has Made Towards Human-Level AI. J. Artif. Intell. Pract. 2020, 3, 38–47. [Google Scholar]
- Hirschberg, J.; Manning, C.D. Advances in Natural Language Processing. Science 2015, 349, 261–266. [Google Scholar] [CrossRef]
- Medhat, W.; Hassan, A.; Korashy, H. Sentiment Analysis Algorithms and Applications: A Survey. Ain Shams Eng. J. 2014, 5, 1093–1113. [Google Scholar] [CrossRef]
- Jemai, F.; Hayouni, M.; Baccar, S. Sentiment Analysis Using Machine Learning Algorithms. In Proceedings of the 2021 International Wireless Communications and Mobile Computing (IWCMC), Harbin City, China, 28 June 2021–2 July 2021. [Google Scholar] [CrossRef]
- Wankhade, M.; Rao, A.C.S.; Kulkarni, C. A Survey on Sentiment Analysis Methods, Applications, and Challenges. Artif. Intell. Rev. 2022, 55, 5731–5780. [Google Scholar] [CrossRef]
- Mercha, E.M.; Benbrahim, H. Machine Learning and Deep Learning for Sentiment Analysis across Languages: A Survey. Neurocomputing 2023, 531, 195–216. [Google Scholar] [CrossRef]
- Costola, M.; Hinz, O.; Nofer, M.; Pelizzon, L. Machine Learning Sentiment Analysis, COVID-19 News and Stock Market Reactions. Res. Int. Bus. Financ. 2023, 64, 101881. [Google Scholar] [CrossRef] [PubMed]
- Jalil, Z.; Abbasi, A.; Javed, A.R.; Khan, M.B.; Hasanat, M.H.A.; Malik, K.M.; Saudagar, A.K.J. COVID-19 Related Sentiment Analysis Using State-of-the-Art Machine Learning and Deep Learning Techniques. Front. Public Health 2022, 9, 812735. [Google Scholar] [CrossRef] [PubMed]
- Ainapure, B.S.; Pise, R.N.; Reddy, P.; Appasani, B.; Srinivasulu, A.; Khan, M.S.; Bizon, N. Sentiment Analysis of COVID-19 Tweets Using Deep Learning and Lexicon-Based Approaches. Sustainability 2023, 15, 2573. [Google Scholar] [CrossRef]
- Vijayaraj, A.; Bhavana, K.; SreeDurga, S.; Naik, S.L. Twitter Based Sentimental Analysis of COVID-19 Observations. Mater. Today Proc. 2022, 64, 713–719. [Google Scholar] [CrossRef] [PubMed]
- Chandra, R.; Krishna, A. COVID-19 Sentiment Analysis via Deep Learning during the Rise of Novel Cases. PLoS ONE 2021, 16, e0255615. [Google Scholar] [CrossRef] [PubMed]
- Dangi, D.; Dixit, D.K.; Bhagat, A. Sentiment Analysis of COVID-19 Social Media Data through Machine Learning. Multimed. Tools Appl. 2022, 81, 42261–42283. [Google Scholar] [CrossRef]
- Jain, V.; Kashyap, K.L. Analyzing Research Trends of Sentiment Analysis and Its Applications for Coronavirus Disease (COVID-19): A Systematic Review. J. Intell. Fuzzy Syst. 2023, 45, 731–742. [Google Scholar] [CrossRef]
- Erfina, A.; Rosita Ndk, M.D.; Hidayat, R.; Subagja, A.; Ramadhan, H.; Lesmana, C.S.A.T.; Saepudin, S.; Muslih, M. Indonesian Twitter Sentiment Analysis Application on The Covid L9 Vaccine Using Naive Bayes Classifier. In Proceedings of the 2021 IEEE 7th International Conference on Computing, Engineering and Design (ICCED), Sukabumi, Indonesia, 5–6 August 2021; pp. 1–6. [Google Scholar]
- Endo, P.T.; Santos, G.L.; De Lima Xavier, M.E.; Nascimento Campos, G.R.; De Lima, L.C.; Silva, I.; Egli, A.; Lynn, T. Illusion of Truth: Analysing and Classifying COVID-19 Fake News in Brazilian Portuguese Language. Big Data Cogn. Comput. 2022, 6, 36. [Google Scholar] [CrossRef]
- Catelli, R.; Pelosi, S.; Comito, C.; Pizzuti, C.; Esposito, M. Lexicon-Based Sentiment Analysis to Detect Opinions and Attitude towards COVID-19 Vaccines on Twitter in Italy. Comput. Biol. Med. 2023, 158, 106876. [Google Scholar] [CrossRef]
- Ghasiya, P.; Okamura, K. Investigating COVID-19 News Across Four Nations: A Topic Modeling and Sentiment Analysis Approach. IEEE Access 2021, 9, 36645–36656. [Google Scholar] [CrossRef] [PubMed]
- Obiedat, R.; Harfoushi, O.; Qaddoura, R.; Al-Qaisi, L.; Al-Zoubi, A.M. An Evolutionary-Based Sentiment Analysis Approach for Enhancing Government Decisions during COVID-19 Pandemic: The Case of Jordan. Appl. Sci. 2021, 11, 9080. [Google Scholar] [CrossRef]
- Barkur, G.; Vibha; Kamath, G.B. Sentiment Analysis of Nationwide Lockdown Due to COVID-19 Outbreak: Evidence from India. Asian J. Psychiatry 2020, 51, 102089. [Google Scholar] [CrossRef]
- Khasnis, N.S.; Sen, S.; Khasnis, S.S. A Machine Learning Approach for Sentiment Analysis to Nurture Mental Health Amidst COVID-19. In Proceedings of the International Conference on Data Science, Machine Learning and Artificial Intelligence, Windhoek, Namibia, 9 August 2021; pp. 284–289. [Google Scholar]
- Tran, M.; Draeger, C.; Wang, X.; Nikbakht, A. Monitoring the Well-Being of Vulnerable Transit Riders Using Machine Learning Based Sentiment Analysis and Social Media: Lessons from COVID-19. Environ. Plan. B Urban Anal. City Sci. 2023, 50, 60–75. [Google Scholar] [CrossRef]
- Iwendi, C.; Mohan, S.; Khan, S.; Ibeke, E.; Ahmadian, A.; Ciano, T. COVID-19 Fake News Sentiment Analysis. Comput. Electr. Eng. 2022, 101, 107967. [Google Scholar] [CrossRef]
- Naseem, U.; Razzak, I.; Khushi, M.; Eklund, P.W.; Kim, J. COVIDSenti: A Large-Scale Benchmark Twitter Data Set for COVID-19 Sentiment Analysis. IEEE Trans. Comput. Soc. Syst. 2021, 8, 1003–1015. [Google Scholar] [CrossRef]
- Delcea, C.; Cotfas, L.-A.; Crăciun, L.; Molănescu, A.G. New Wave of COVID-19 Vaccine Opinions in the Month the 3rd Booster Dose Arrived. Vaccines 2022, 10, 881. [Google Scholar] [CrossRef]
- Block, J.H.; Fisch, C. Eight Tips and Questions for Your Bibliographic Study in Business and Management Research. Manag. Rev. Q. 2020, 70, 307–312. [Google Scholar] [CrossRef]
- Moreno-Guerrero, A.-J.; López-Belmonte, J.; Marín-Marín, J.-A.; Soler-Costa, R. Scientific Development of Educational Artificial Intelligence in Web of Science. Future Internet 2020, 12, 124. [Google Scholar] [CrossRef]
- Yu, J.; Muñoz-Justicia, J. A Bibliometric Overview of Twitter-Related Studies Indexed in Web of Science. Future Internet 2020, 12, 91. [Google Scholar] [CrossRef]
- Ravšelj, D.; Umek, L.; Todorovski, L.; Aristovnik, A. A Review of Digital Era Governance Research in the First Two Decades: A Bibliometric Study. Future Internet 2022, 14, 126. [Google Scholar] [CrossRef]
- Fatma, N.; Haleem, A. Exploring the Nexus of Eco-Innovation and Sustainable Development: A Bibliometric Review and Analysis. Sustainability 2023, 15, 12281. [Google Scholar] [CrossRef]
- Stefanis, C.; Giorgi, E.; Tselemponis, G.; Voidarou, C.; Skoufos, I.; Tzora, A.; Tsigalou, C.; Kourkoutas, Y.; Constantinidis, T.C.; Bezirtzoglou, E. Terroir in View of Bibliometrics. Stats 2023, 6, 956–979. [Google Scholar] [CrossRef]
- Gorski, A.-T.; Ranf, E.-D.; Badea, D.; Halmaghi, E.-E.; Gorski, H. Education for Sustainability—Some Bibliometric Insights. Sustainability 2023, 15, 14916. [Google Scholar] [CrossRef]
- Delcea, C.; Javed, S.A.; Florescu, M.-S.; Ioanas, C.; Cotfas, L.-A. 35 Years of Grey System Theory in Economics and Education. Kybernetes 2023. [Google Scholar] [CrossRef]
- Cibu, B.; Delcea, C.; Domenteanu, A.; Dumitrescu, G. Mapping the Evolution of Cybernetics: A Bibliometric Perspective. Computers 2023, 12, 237. [Google Scholar] [CrossRef]
- WoS Web of Science. Available online: https://webofknowledge.com (accessed on 9 September 2023).
- Cobo, M.J.; Martínez, M.A.; Gutiérrez-Salcedo, M.; Fujita, H.; Herrera-Viedma, E. 25 Years at Knowledge-Based Systems: A Bibliometric Analysis. Knowl.-Based Syst. 2015, 80, 3–13. [Google Scholar] [CrossRef]
- Modak, N.M.; Merigó, J.M.; Weber, R.; Manzor, F.; Ortúzar, J.D.D. Fifty Years of Transportation Research Journals: A Bibliometric Overview. Transp. Res. Part A Policy Pract. 2019, 120, 188–223. [Google Scholar] [CrossRef]
- Mulet-Forteza, C.; Martorell-Cunill, O.; Merigó, J.M.; Genovart-Balaguer, J.; Mauleon-Mendez, E. Twenty Five Years of the Journal of Travel & Tourism Marketing: A Bibliometric Ranking. J. Travel Tour. Mark. 2018, 35, 1201–1221. [Google Scholar] [CrossRef]
- Bakır, M.; Özdemir, E.; Akan, Ş.; Atalık, Ö. A Bibliometric Analysis of Airport Service Quality. J. Air Transp. Manag. 2022, 104, 102273. [Google Scholar] [CrossRef]
- Tay, A. Using VOSviewer as a Bibliometric Mapping or Analysis Tool in Business, Management & Accounting. Available online: https://library.smu.edu.sg/topics-insights/using-vosviewer-bibliometric-mapping-or-analysis-tool-business-management (accessed on 22 November 2023).
- Aria, M.; Cuccurullo, C. Bibliometrix: An R-Tool for Comprehensive Science Mapping Analysis. J. Informetr. 2017, 11, 959–975. [Google Scholar] [CrossRef]
- Liu, W. The Data Source of This Study Is Web of Science Core Collection? Not Enough. Scientometrics 2019, 121, 1815–1824. [Google Scholar] [CrossRef]
- Liu, F. Retrieval Strategy and Possible Explanations for the Abnormal Growth of Research Publications: Re-Evaluating a Bibliometric Analysis of Climate Change. Scientometrics 2023, 128, 853–859. [Google Scholar] [CrossRef]
- Donner, P. Document Type Assignment Accuracy in the Journal Citation Index Data of Web of Science. Scientometrics 2017, 113, 219–236. [Google Scholar] [CrossRef]
- WoS Document Types. Available online: https://webofscience.help.clarivate.com/en-us/Content/document-types.html (accessed on 3 December 2023).
- Scopus Content Coverage. Available online: https://www.google.com/url?sa=t&rct=j&q=&esrc=s&source=web&cd=&cad=rja&uact=8&ved=2ahUKEwizod31mvOCAxWV2QIHHffEDYwQFnoECA8QAQ&url=http%3A%2F%2Fwww.auric.or.kr%2FUserFiles_news%2FFile%2Fcontent_coverage.pdf&usg=AOvVaw1fa-aDwsxvgc8OoNO6lGNO&opi=89978449 (accessed on 12 March 2023).
- Liu, W. Caveats for the Use of Web of Science Core Collection in Old Literature Retrieval and Historical Bibliometric Analysis. Technol. Forecast. Soc. Chang. 2021, 172, 121023. [Google Scholar] [CrossRef]
- Dahish, Z.; Miah, S.J. A Bibliometric Analysis to Explore Sentiment Analysis in the Domain of Social Media Research. Res. Sq. 2022. [Google Scholar] [CrossRef]
- Wardikar, V. Application of Bradford’s Law of Scattering to the Literature of Library & Information Science: A Study of Doctoral Theses Citations Submitted to the Universities of Maharashtra, India. Libr. Philos. Pract. 2013. Available online: https://www.proquest.com/openview/da430b54ea4de9f3096198d323027642/1?pq-origsite=gscholar&cbl=54903 (accessed on 3 December 2023).
- RDRR Website Bradford: Bradford’s Law in Bibliometrix: Comprehensive Science Mapping Analysis. Available online: https://rdrr.io/cran/bibliometrix/man/bradford.html (accessed on 21 November 2023).
- Sarirete, A. A Bibliometric Analysis of COVID-19 Vaccines and Sentiment Analysis. Procedia Comput. Sci. 2021, 194, 280–287. [Google Scholar] [CrossRef]
- Kamath, A.; Shenoy, S.; Kumar, S. An Overview of Investor Sentiment: Identifying Themes, Trends, and Future Direction through Bibliometric Analysis. Invest. Manag. Financ. Innov. 2022, 19, 229–242. [Google Scholar] [CrossRef]
- Kale, A.S. Sentiment Analysis in Library and Information Science: A Bibliometric Study. Available online: https://www.proquest.com/openview/4413eac1c9486d2492b58929b57cadf3/1?pq-origsite=gscholar&cbl=5170426 (accessed on 3 December 2023).
- Yaqub, A.; Thalib, H.; Brahimi, T.; Sarirete, A. A Bibliometric of Sentiment Analysis in Tourism Industry during COVID-19 Pandemic. In Proceedings of the International Conference on Industrial Engineering and Operations Management, Istanbul, Turkey, 7 March 2022; pp. 2383–2393. [Google Scholar]
- Qiang, Y.; Tao, X.; Gou, X.; Lang, Z.; Liu, H. Towards a Bibliometric Mapping of Network Public Opinion Studies. Information 2022, 13, 17. [Google Scholar] [CrossRef]
- Nyakurukwa, K.; Seetharam, Y. The Evolution of Studies on Social Media Sentiment in the Stock Market: Insights from Bibliometric Analysis. Sci. Afr. 2023, 20, e01596. [Google Scholar] [CrossRef]
- Li, S.; Wang, Y.; Xue, J.; Zhao, N.; Zhu, T. The Impact of COVID-19 Epidemic Declaration on Psychological Consequences: A Study on Active Weibo Users. Int. J. Environ. Res. Public Health 2020, 17, 2032. [Google Scholar] [CrossRef] [PubMed]
- Abd-Alrazaq, A.; Alhuwail, D.; Househ, M.; Hamdi, M.; Shah, Z. Top Concerns of Tweeters During the COVID-19 Pandemic: Infoveillance Study. J. Med. Internet Res. 2020, 22, e19016. [Google Scholar] [CrossRef]
- Samuel, J.; Ali, G.M.N.; Rahman, M.M.; Esawi, E.; Samuel, Y. COVID-19 Public Sentiment Insights and Machine Learning for Tweets Classification. Information 2020, 11, 314. [Google Scholar] [CrossRef]
- Boon-Itt, S.; Skunkan, Y. Public Perception of the COVID-19 Pandemic on Twitter: Sentiment Analysis and Topic Modeling Study. JMIR Public Health Surveill. 2020, 6, e21978. [Google Scholar] [CrossRef]
- Chakraborty, K.; Bhatia, S.; Bhattacharyya, S.; Platos, J.; Bag, R.; Hassanien, A.E. Sentiment Analysis of COVID-19 Tweets by Deep Learning Classifiers—A Study to Show How Popularity Is Affecting Accuracy in Social Media. Appl. Soft Comput. 2020, 97, 106754. [Google Scholar] [CrossRef]
- Zhao, Y.; Cheng, S.; Yu, X.; Xu, H. Chinese Public’s Attention to the COVID-19 Epidemic on Social Media: Observational Descriptive Study. J. Med. Internet Res. 2020, 5, e18825. [Google Scholar] [CrossRef] [PubMed]
- Shorten, C.; Khoshgoftaar, T.M.; Furht, B. Deep Learning Applications for COVID-19. J. Big Data 2021, 8, 18. [Google Scholar] [CrossRef] [PubMed]
- Lyu, J.C.; Han, E.L.; Luli, G.K. COVID-19 Vaccine–Related Discussion on Twitter: Topic Modeling and Sentiment Analysis. J. Med. Internet Res. 2021, 23, e24435. [Google Scholar] [CrossRef] [PubMed]
- Liu, Q.; Zheng, Z.; Zheng, J.; Chen, Q.; Liu, G.; Chen, S.; Chu, B.; Zhu, H.; Akinwunmi, B.; Huang, J.; et al. Health Communication Through News Media During the Early Stage of the COVID-19 Outbreak in China: Digital Topic Modeling Approach Health Communication Through News Media During the Early Stage of the COVID-19 Outbreak in China: Digital Topic Modeling Approach. J. Med. Internet Res. 2020, 22, e19118. [Google Scholar] [CrossRef]
- Xue, J.; Chen, J.; Chen, C.; Zheng, C.; Li, S.; Zhu, T. Public Discourse and Sentiment during the COVID 19 Pandemic: Using Latent Dirichlet Allocation for Topic Modeling on Twitter. PLoS ONE 2020, 15, e0239441. [Google Scholar] [CrossRef]
- Sanchez-Nunez, P.; Cobo, M.J.; Heras-Pedrosa, C.D.L.; Pelaez, J.I.; Herrera-Viedma, E. Opinion Mining, Sentiment Analysis and Emotion Understanding in Advertising: A Bibliometric Analysis. IEEE Access 2020, 8, 134563–134576. [Google Scholar] [CrossRef]
- Puteh, N.; Ali bin Saip, M.; Zabidin Husin, M.; Hussain, A. Sentiment Analysis with Deep Learning: A Bibliometric Review. Turk. J. Comput. Math. Educ. 2021, 12, 1509–1519. [Google Scholar]
- Casas-Valadez, M.A.; Faz-Mendoza, A.; Medina-Rodriguez, C.E.; Castorena-Robles, A.; Gamboa-Rosales, N.K.; Lopez-Robles, J.R. Decision Models in Marketing: The Role of Sentiment Analysis from Bibliometric Analysis. In Proceedings of the 2020 International Conference on Decision Aid Sciences and Application (DASA), Sakheer, Bahrain, 8 November 2020; pp. 561–565. [Google Scholar]
- Bagane, P.; Mehta, N.; Kakde, P.; Bramhbhatt, N.; Sahni, I.; Kotrappa, S. Bibliometric Survey for Stock Market Prediction Using Sentimental Analysis and LSTM. Libr. Philos. Pract. 2021. Available online: https://digitalcommons.unl.edu/libphilprac/5335 (accessed on 3 December 2023).
Figure 1.
The steps considered in the analysis.

Figure 2.
Annual scientific production evolution.

Figure 3.
Annual average article citations per year evolution.

Figure 4.
Top 15 most relevant journals.

Figure 5.
Bradford’s law on source clustering.

Figure 6.
Journals’ impact based on H-index.

Figure 7.
Journals’ growth (cumulative) based on the number of papers.

Figure 8.
Top 15 authors based on number of documents.

Figure 9.
Top 20 authors’ production over time.

Figure 10.
Top 20 most relevant affiliations.

Figure 11.
Top 20 most relevant corresponding authors’ countries.

Figure 12.
Scientific production based on country.

Figure 13.
Top 20 countries with the most citations.

Figure 14.
Country collaboration map.

Figure 15.
Top 50 authors collaboration network.

Figure 16.
Top 50 words based on keywords plus (A) and authors’ keywords (B).

Figure 17.
Three-field plot: countries (left), authors (middle), and journals (right).

Figure 18.
Three-field plot: affiliations (left), authors (middle), and keywords (right).


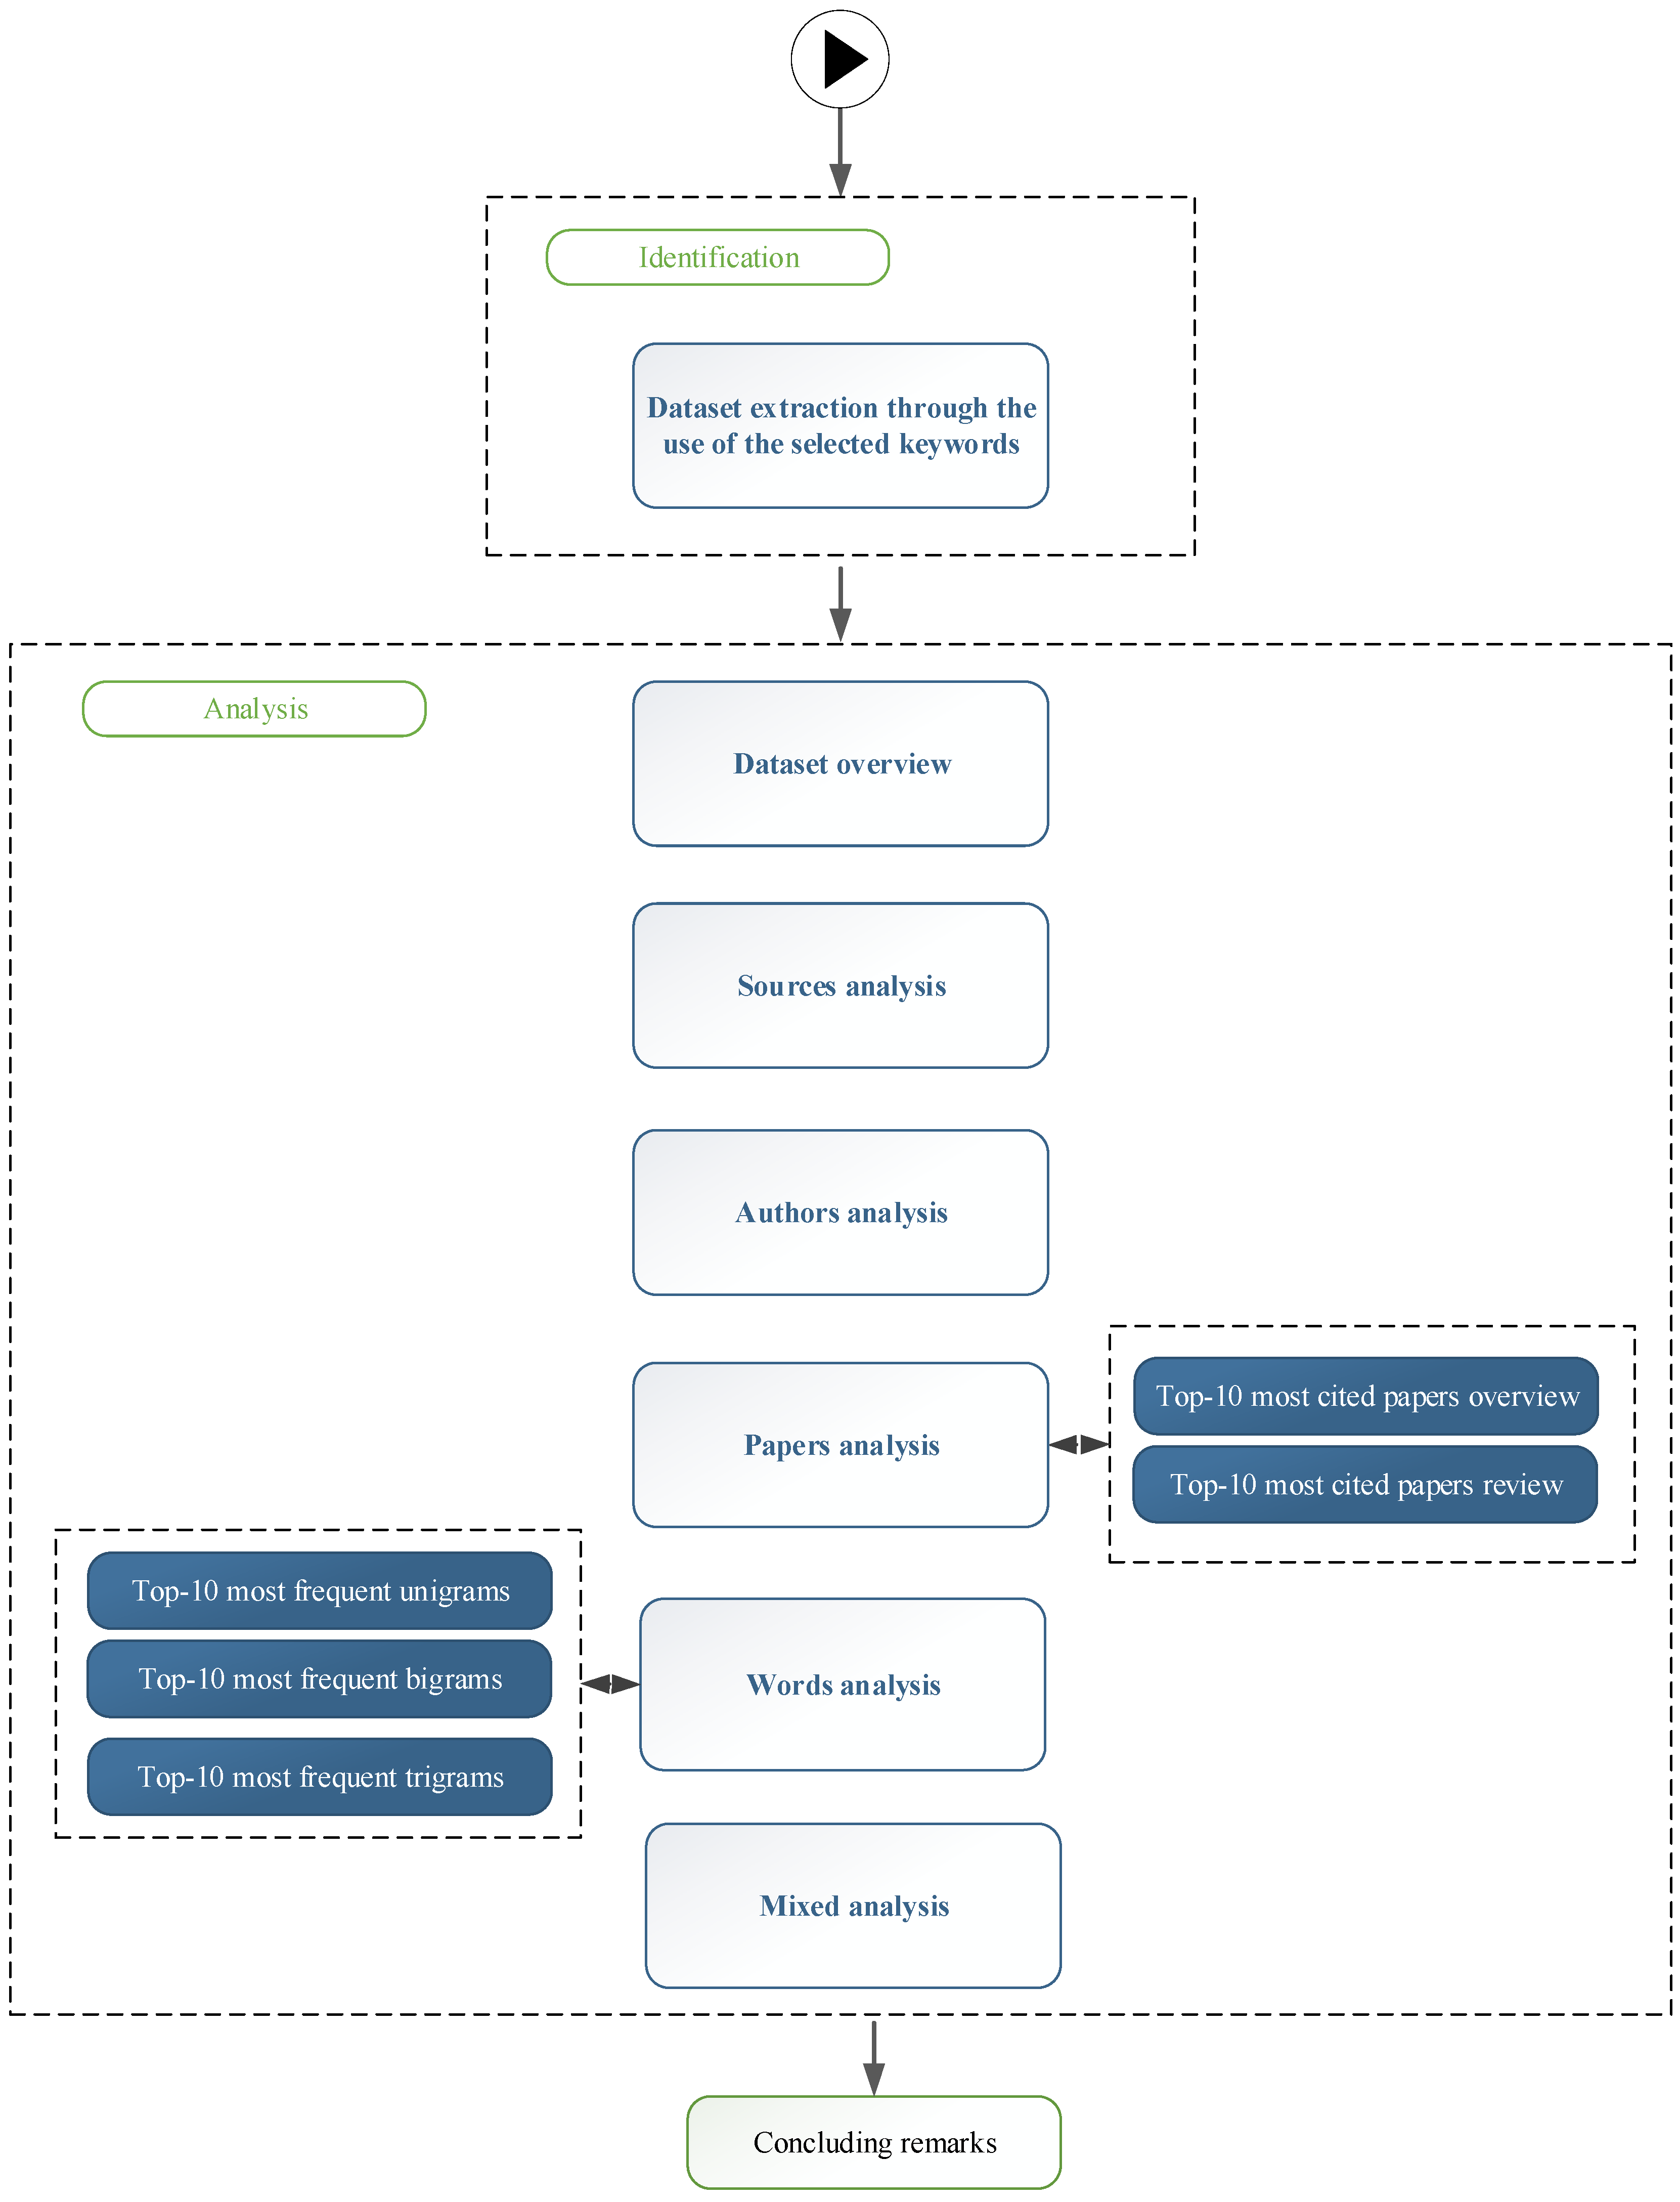
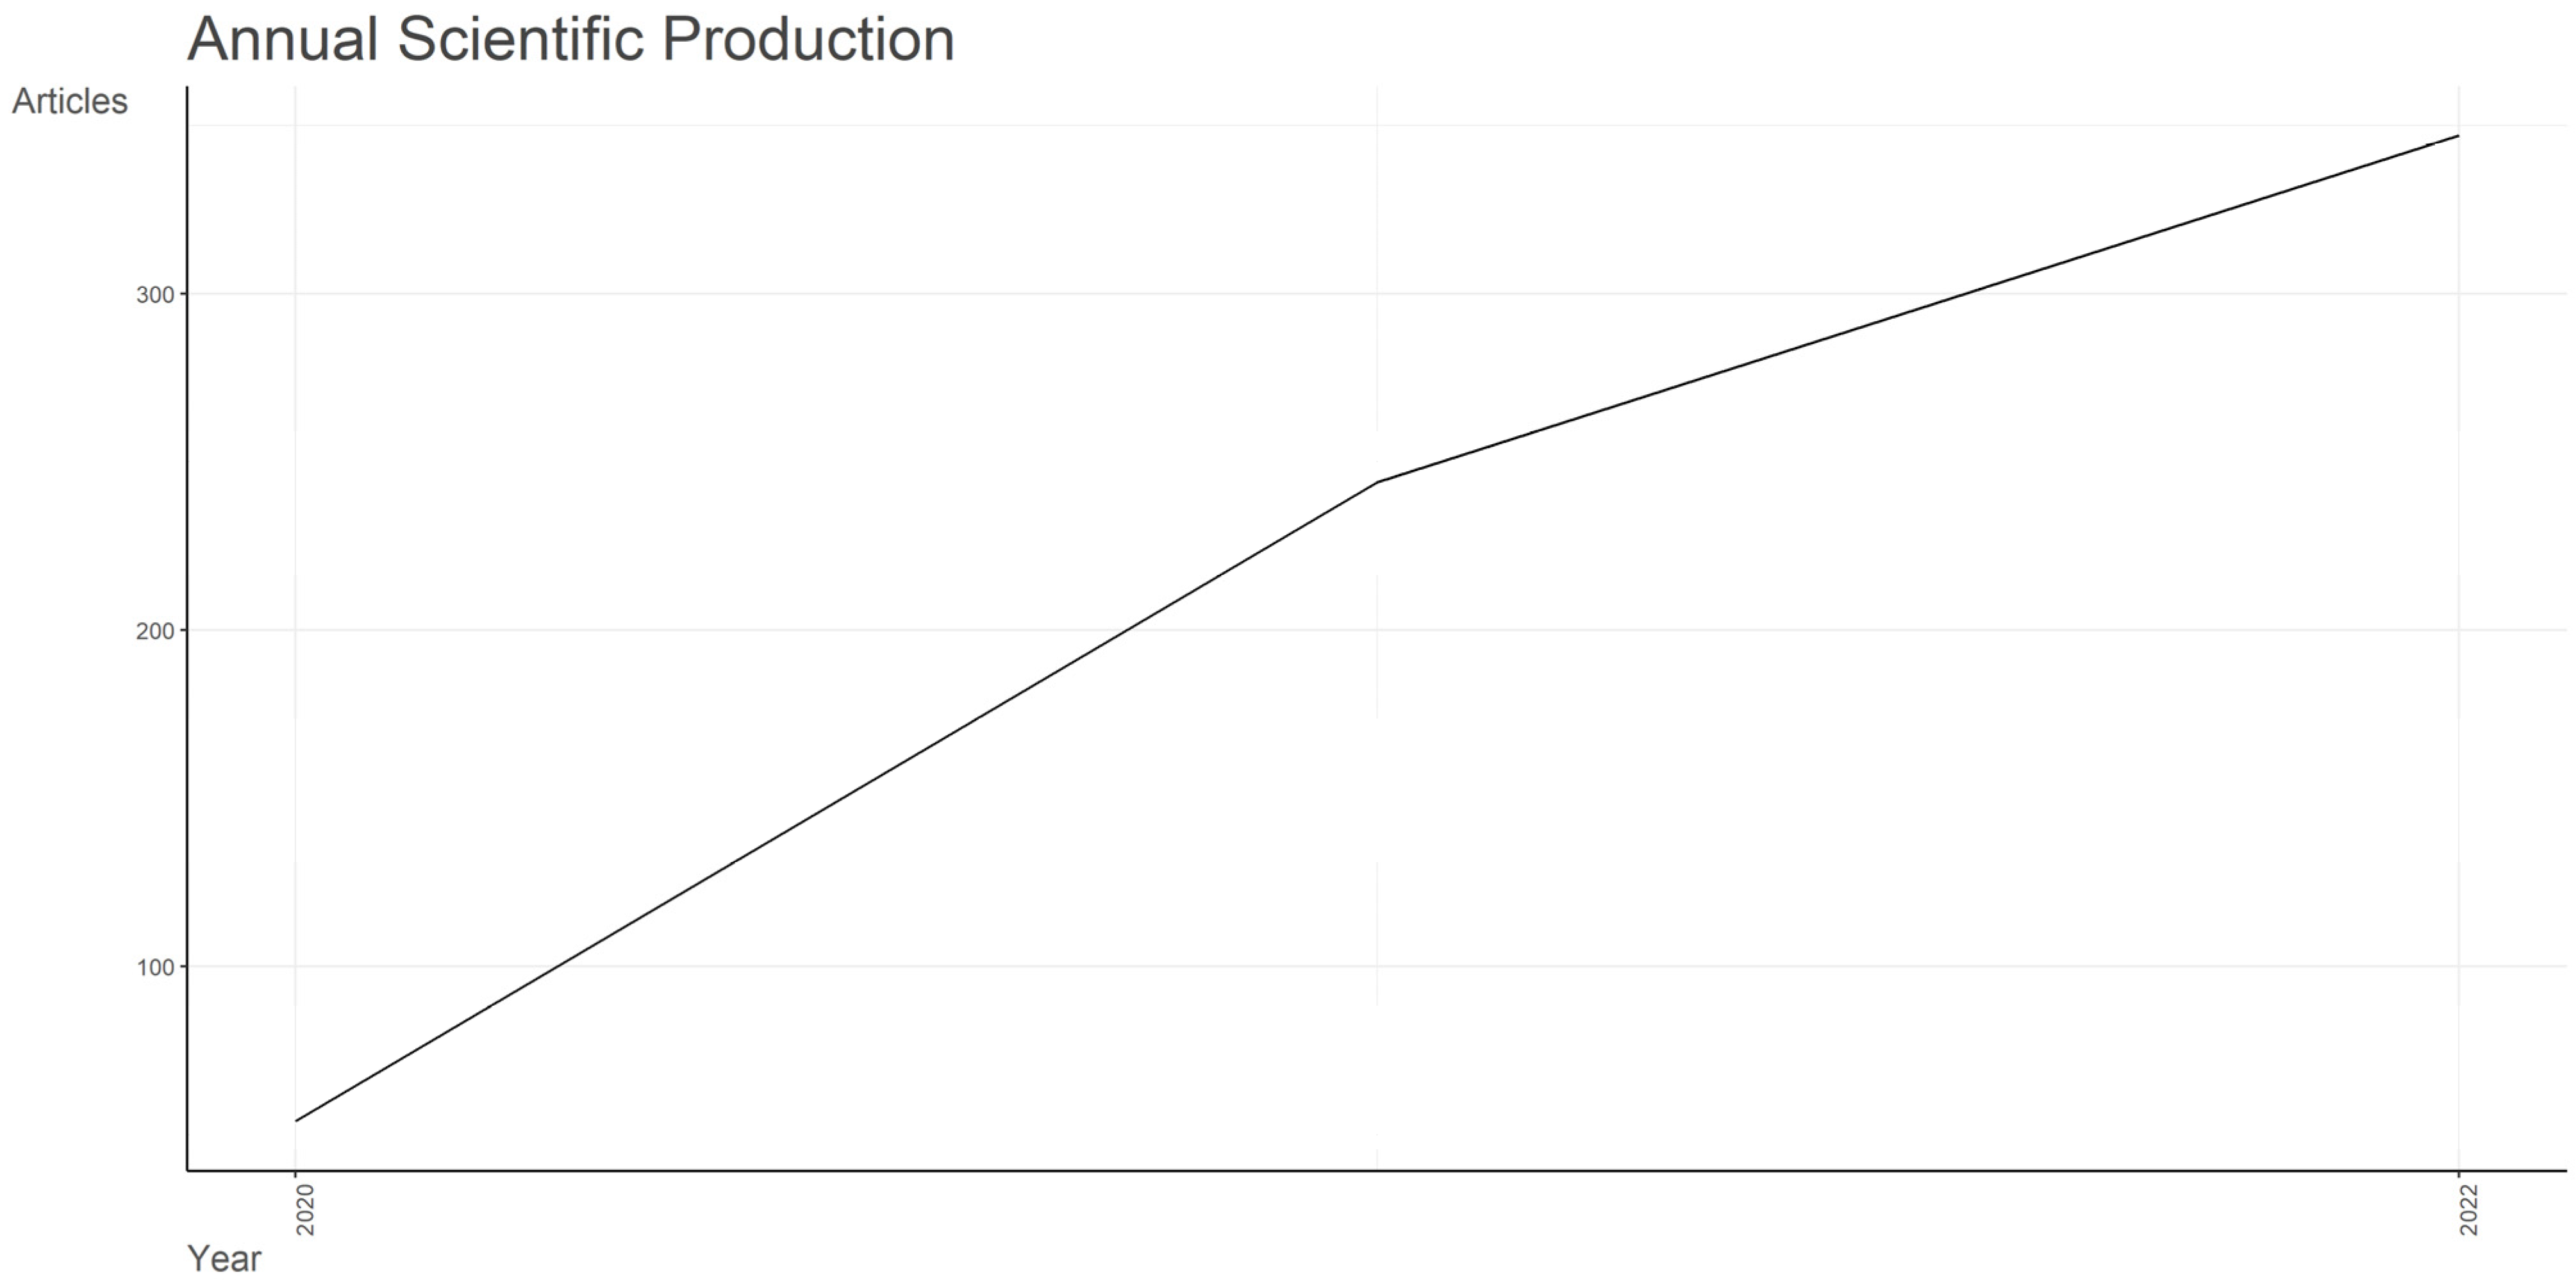
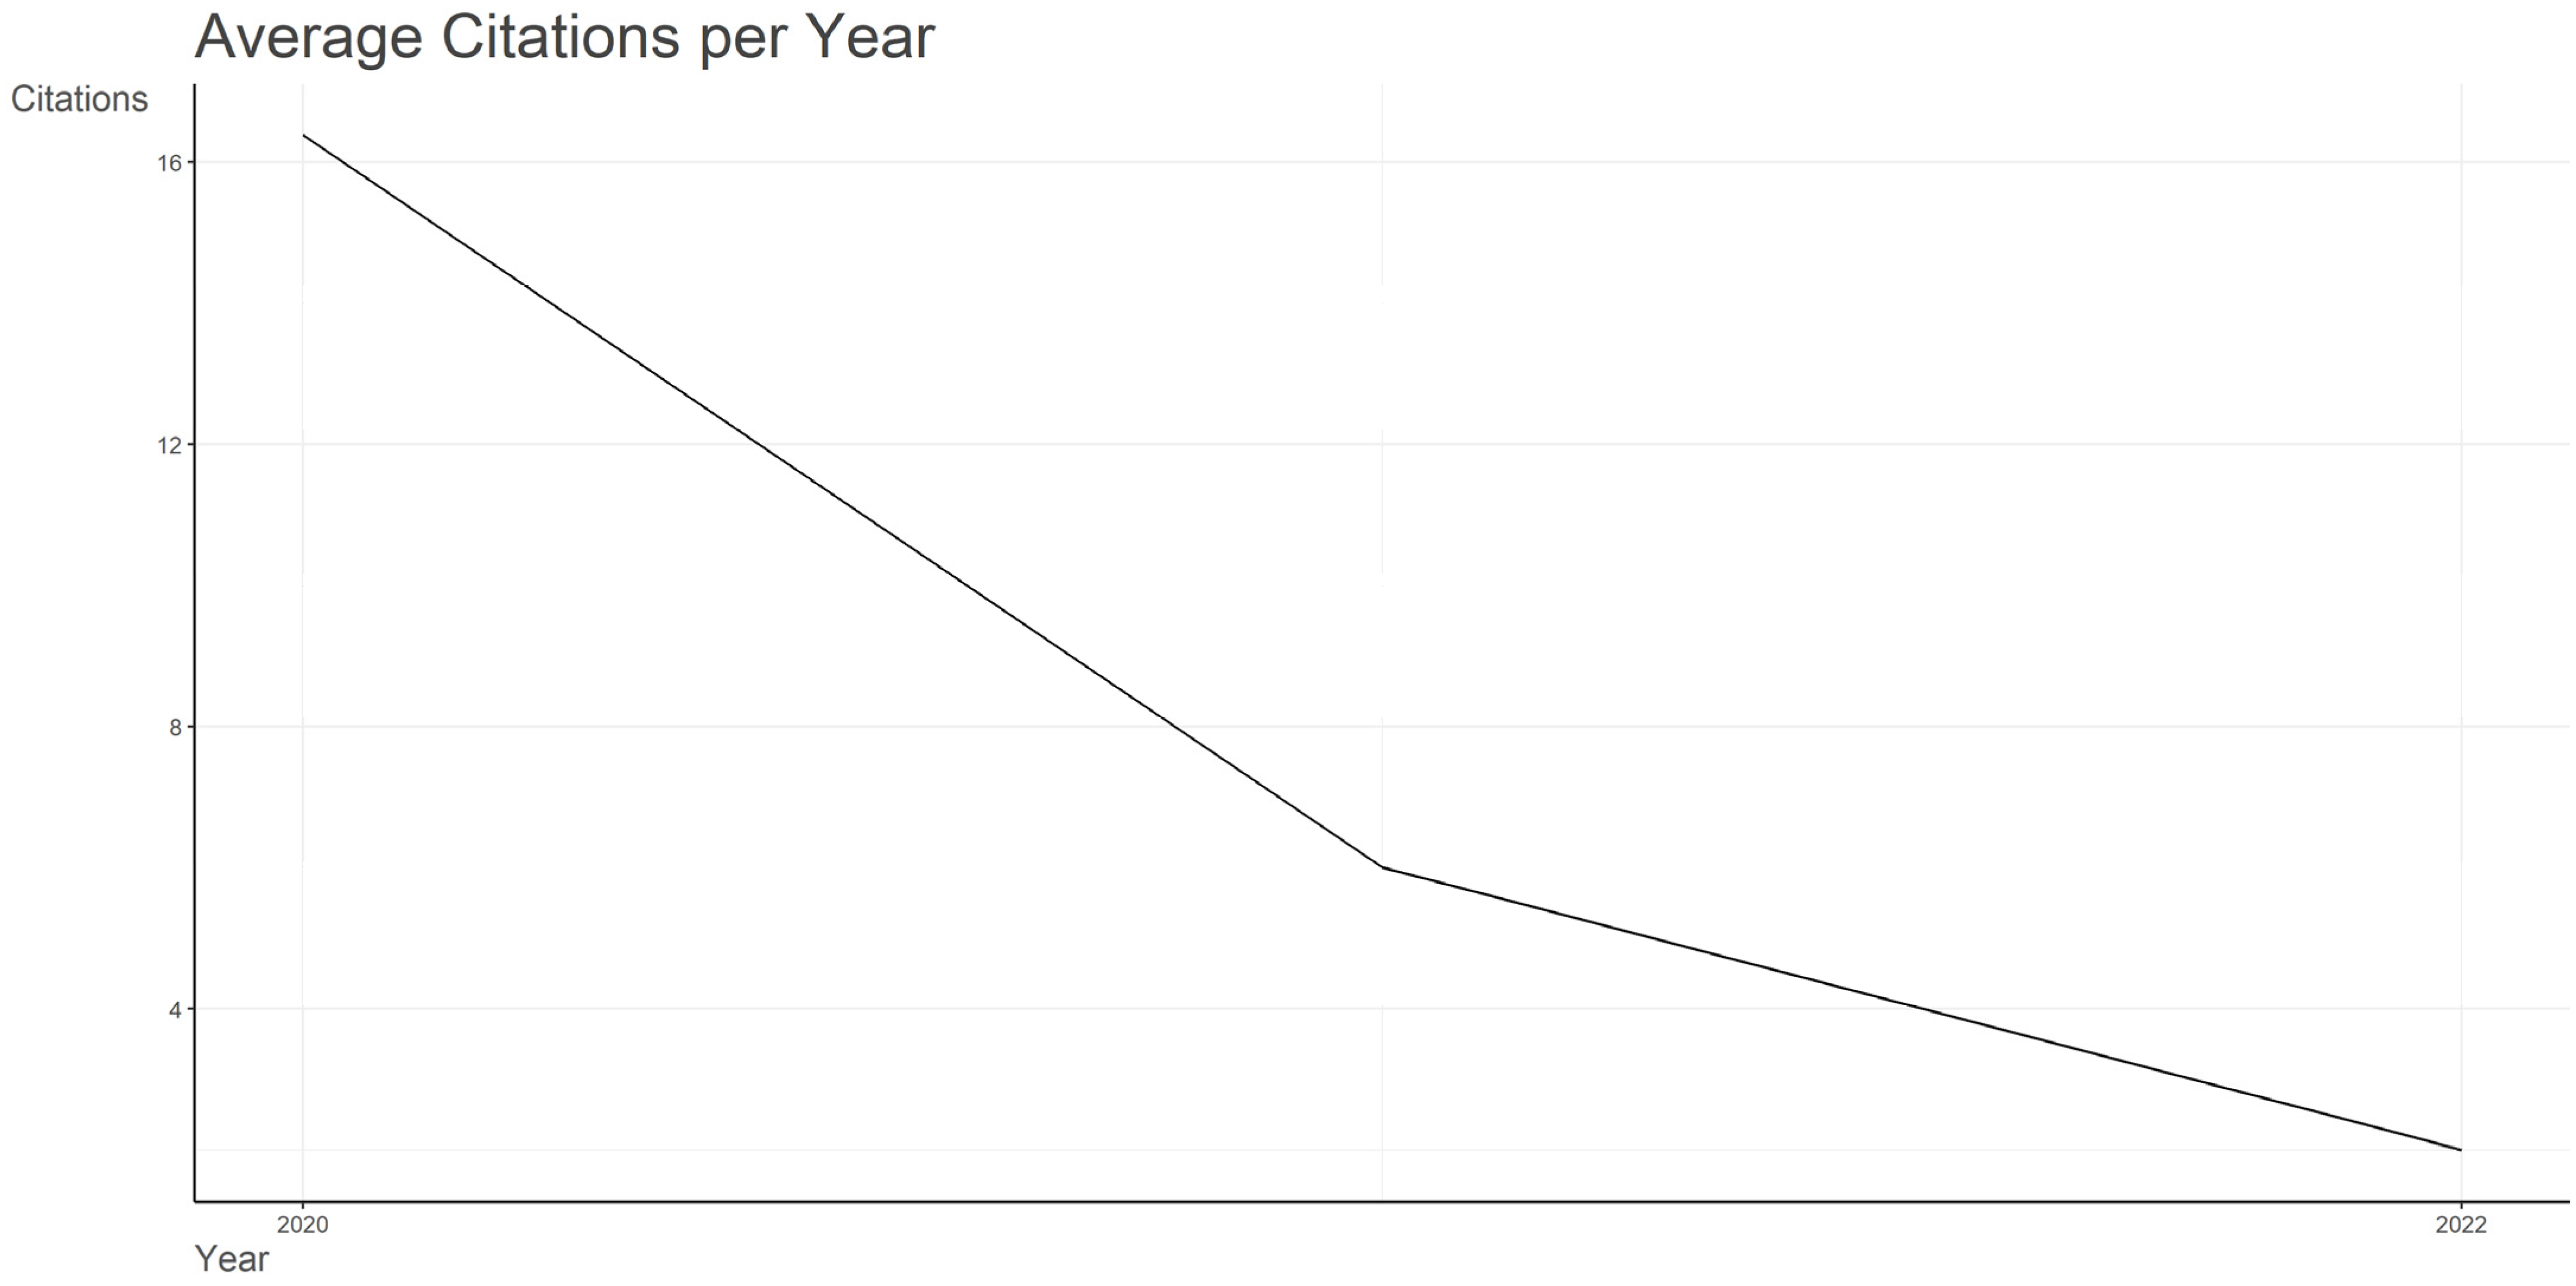
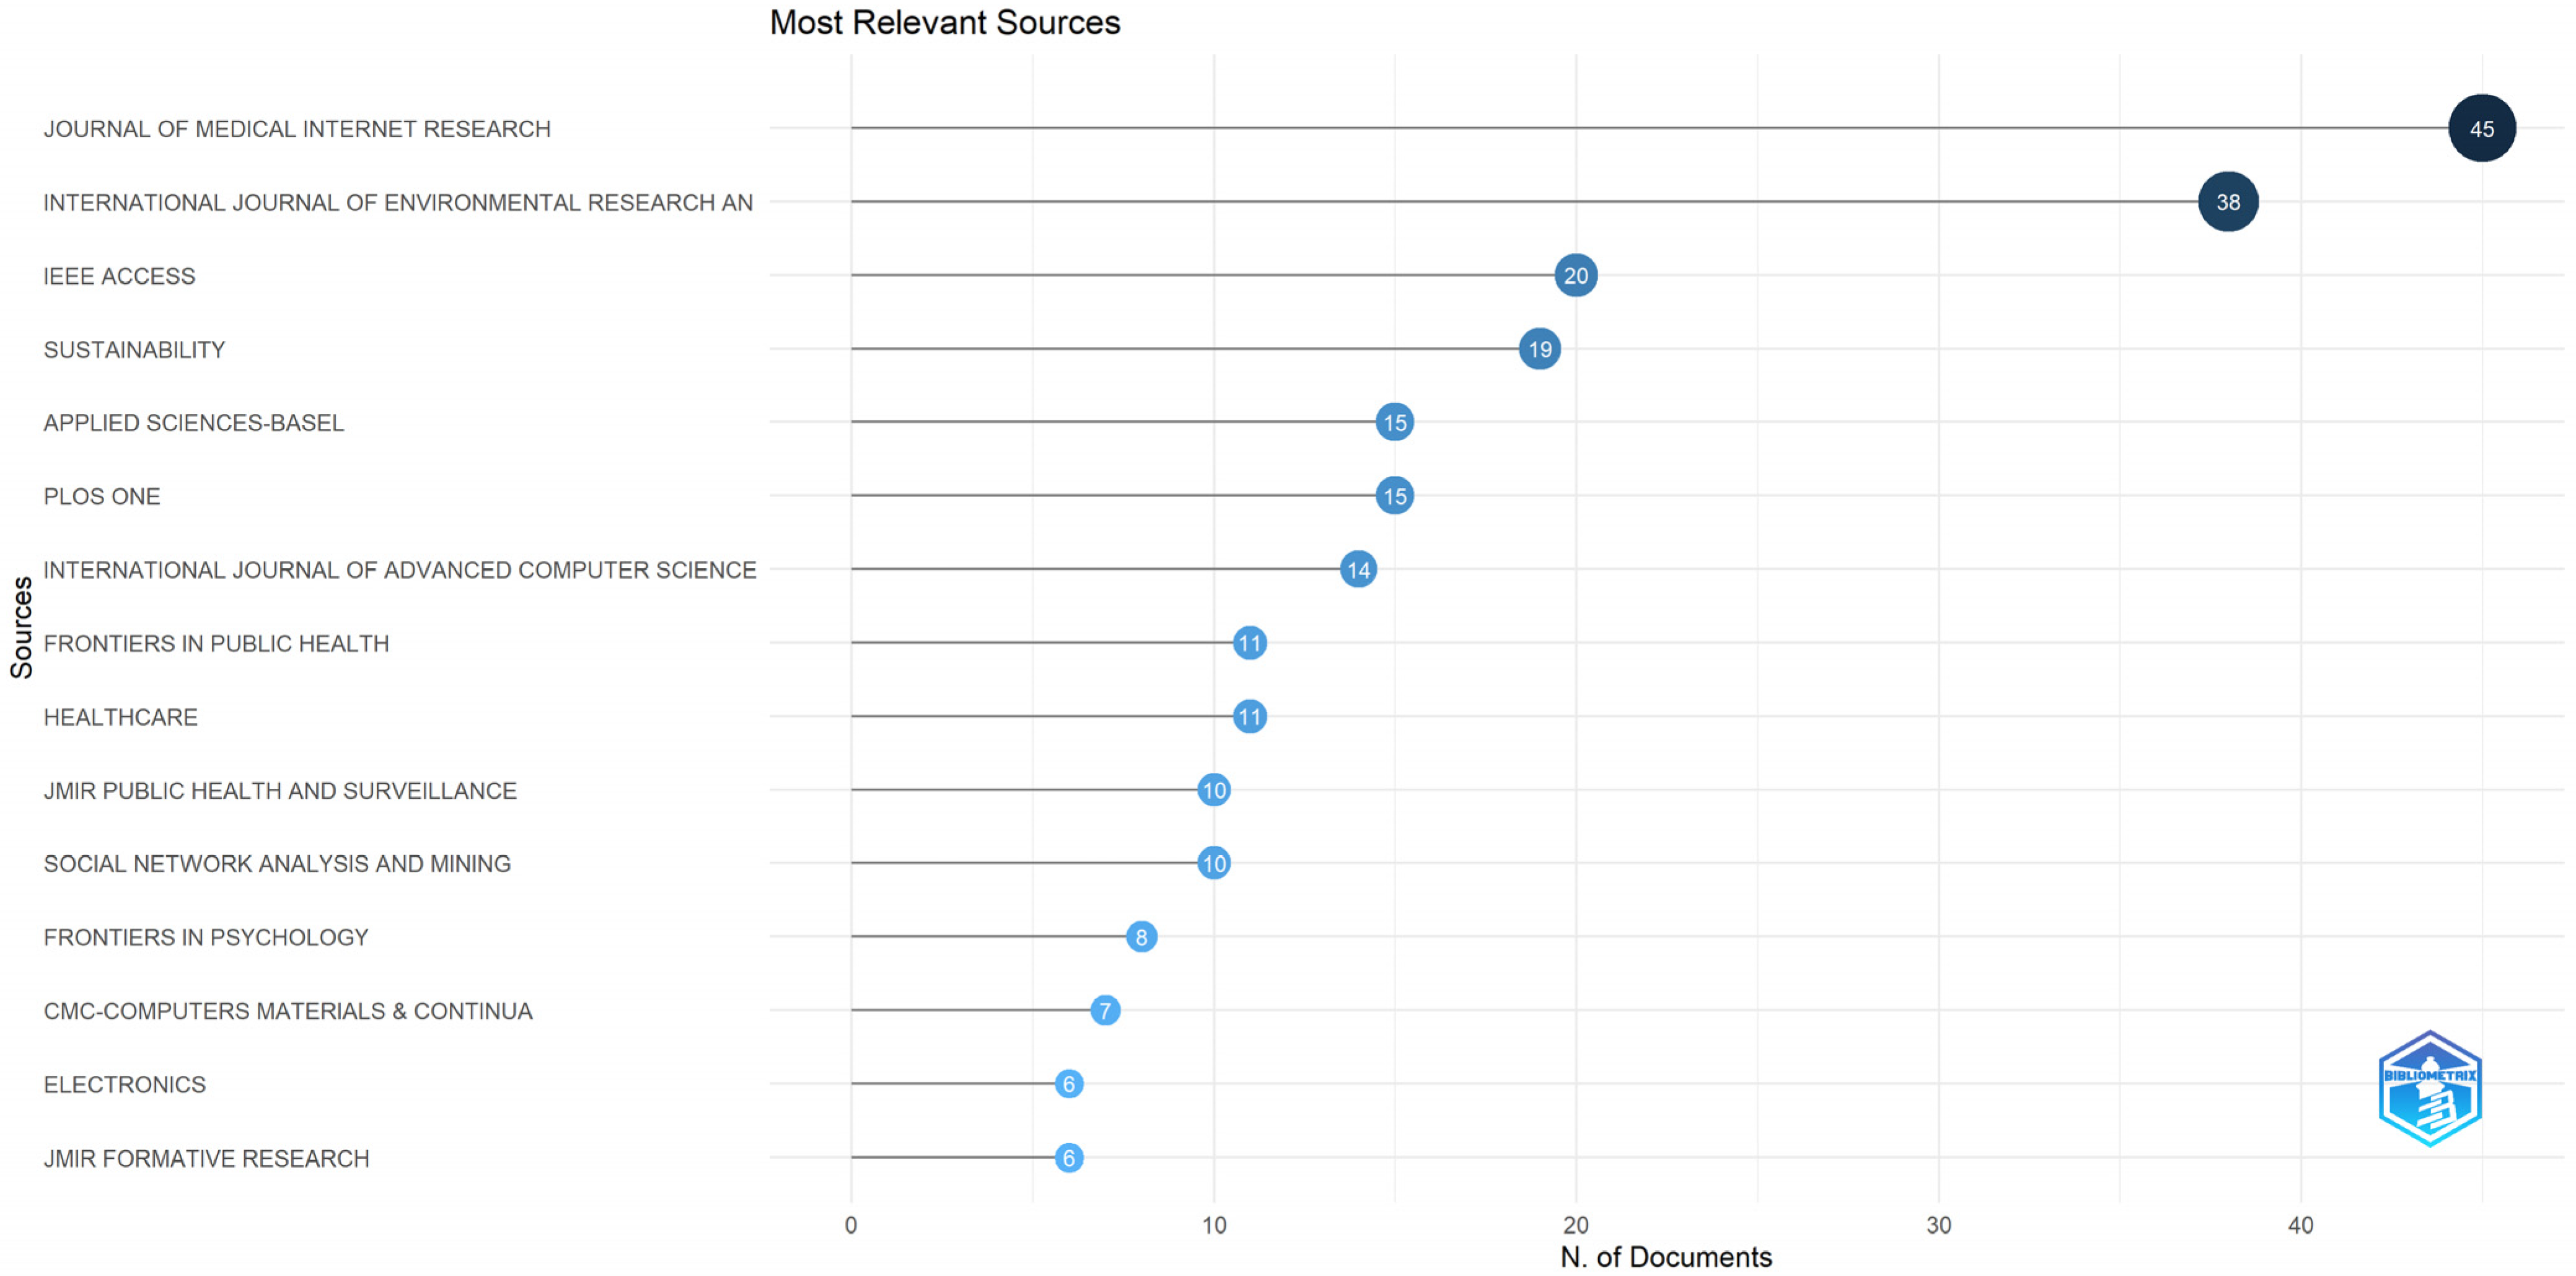
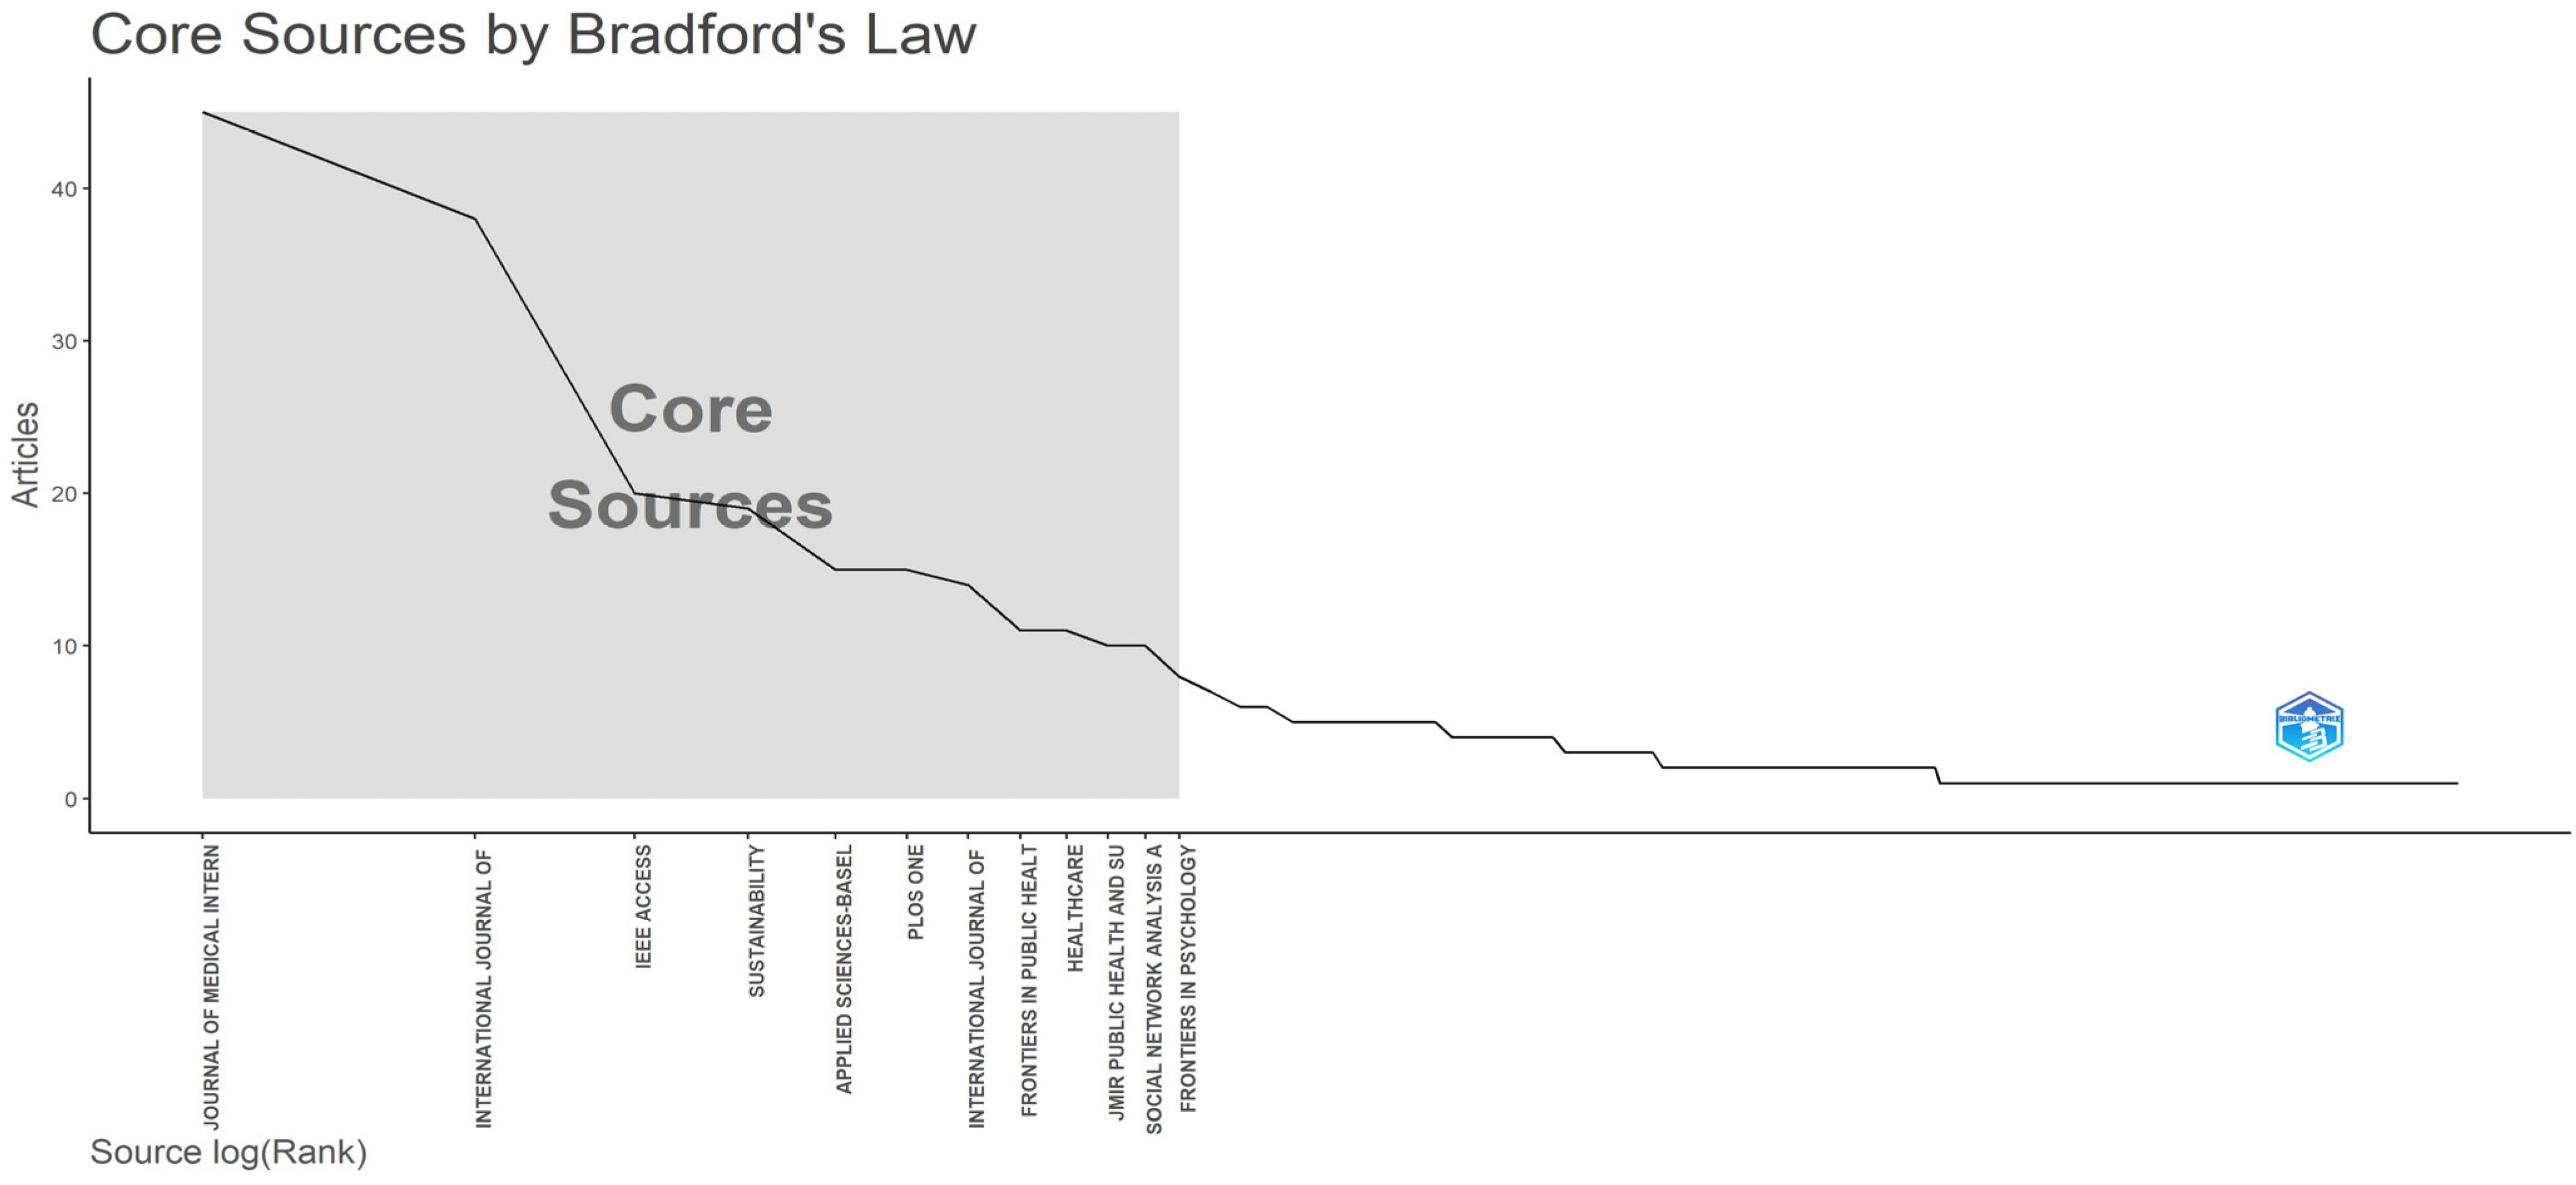
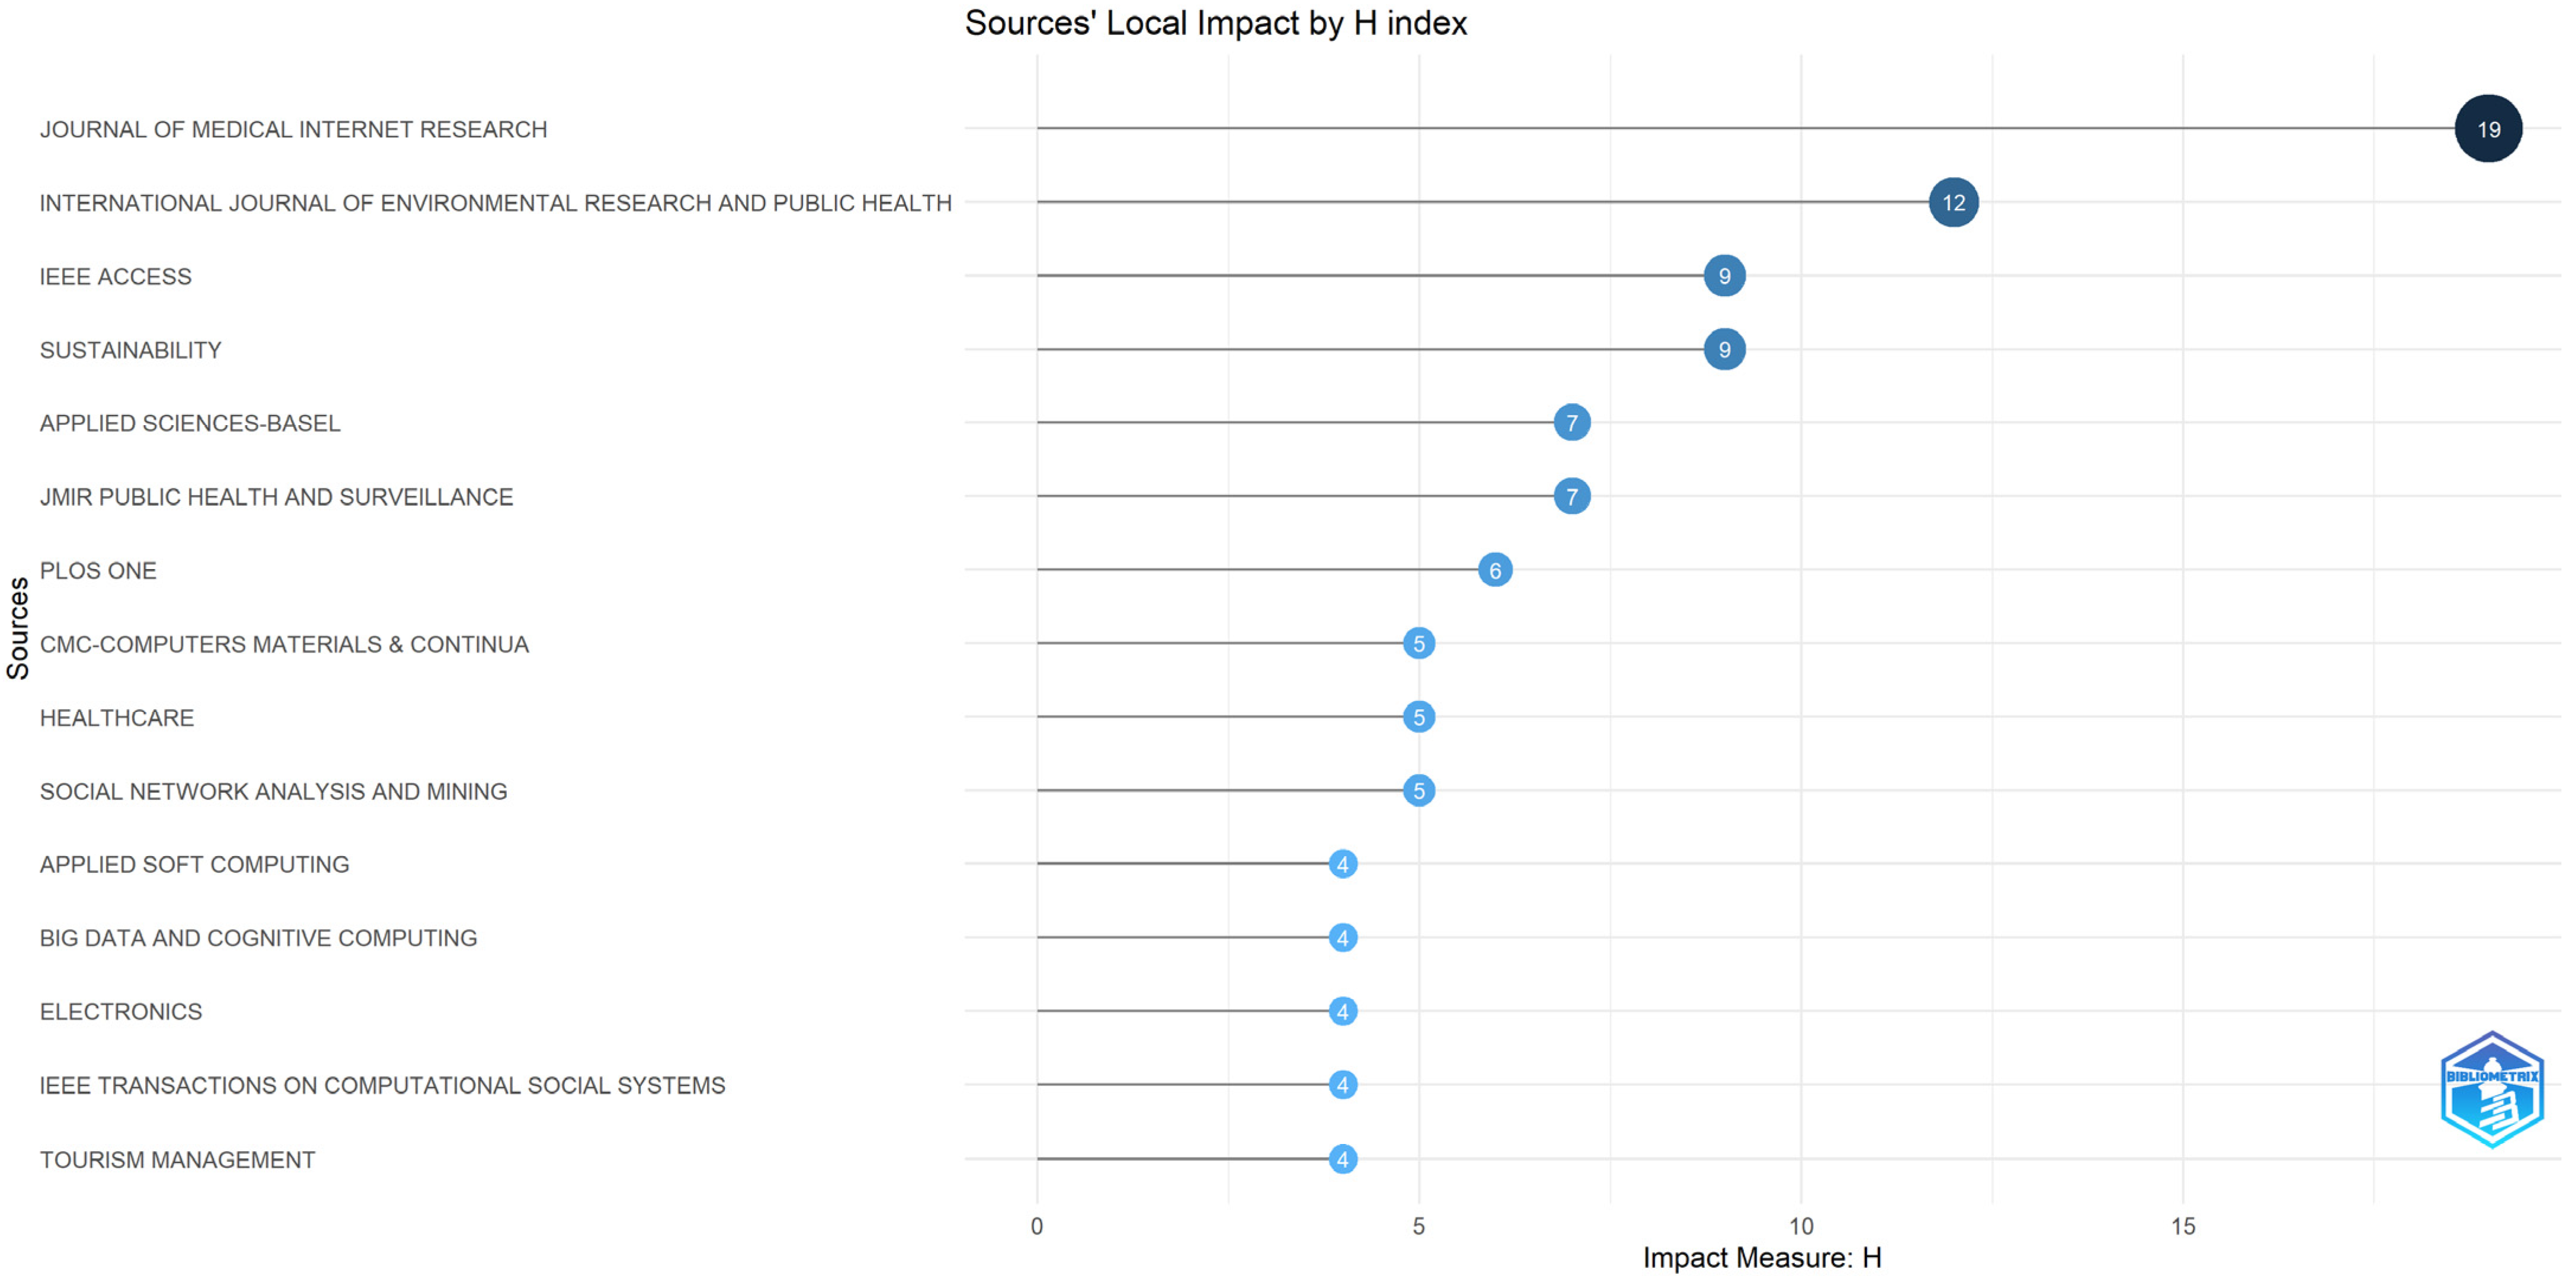
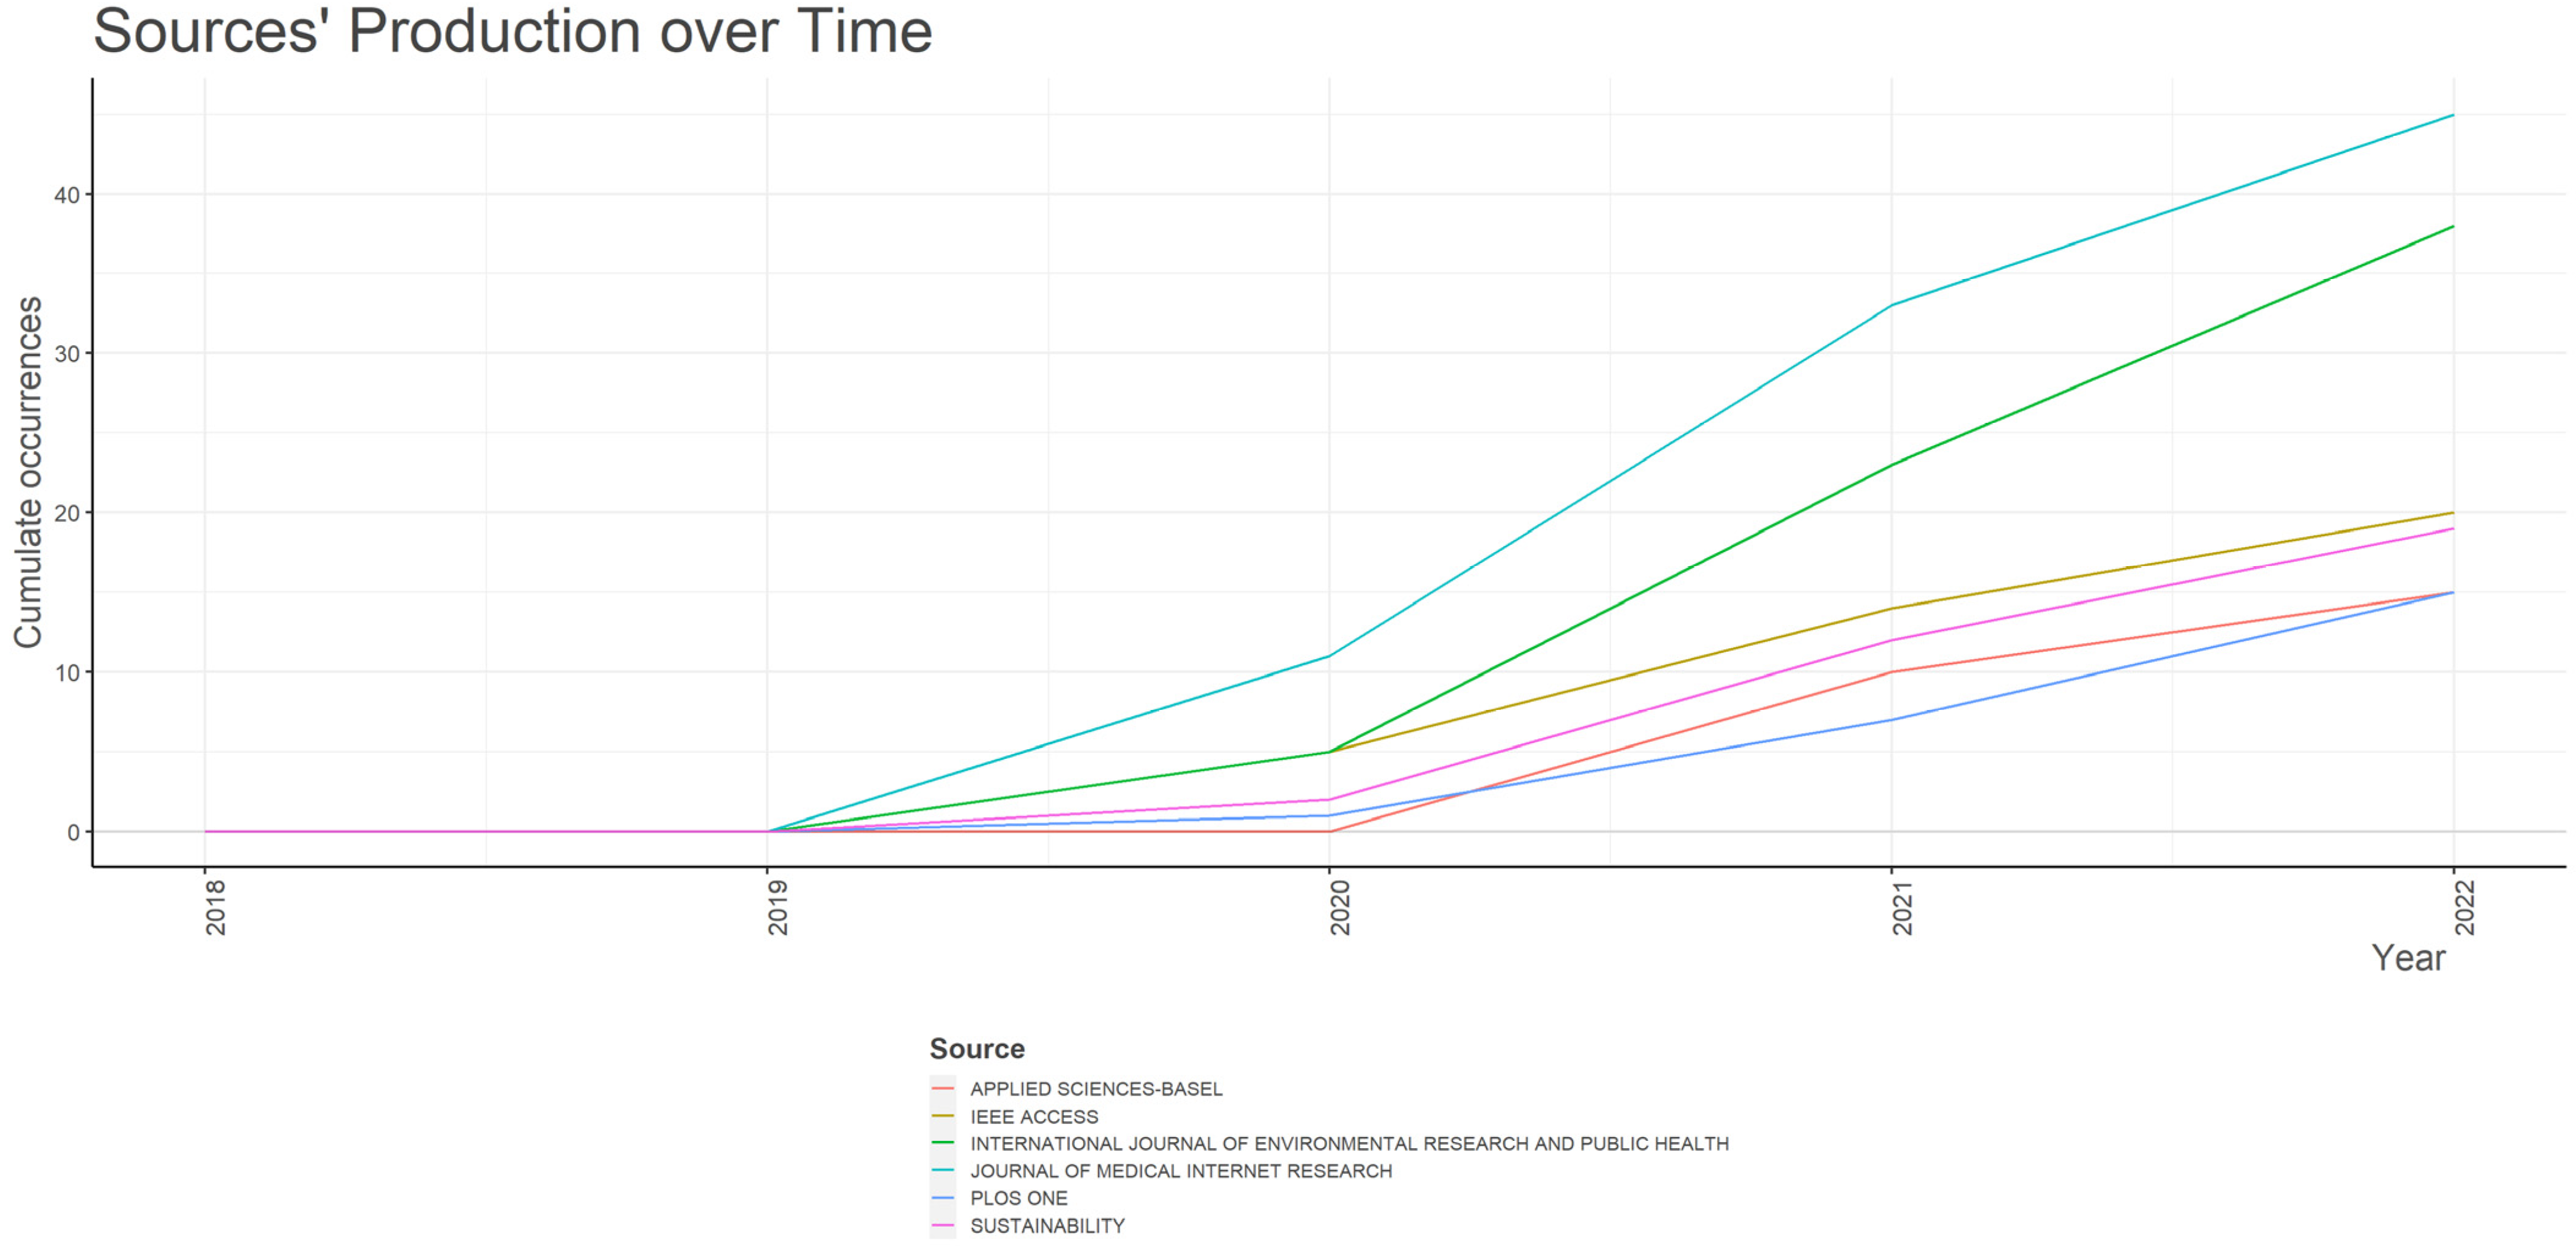
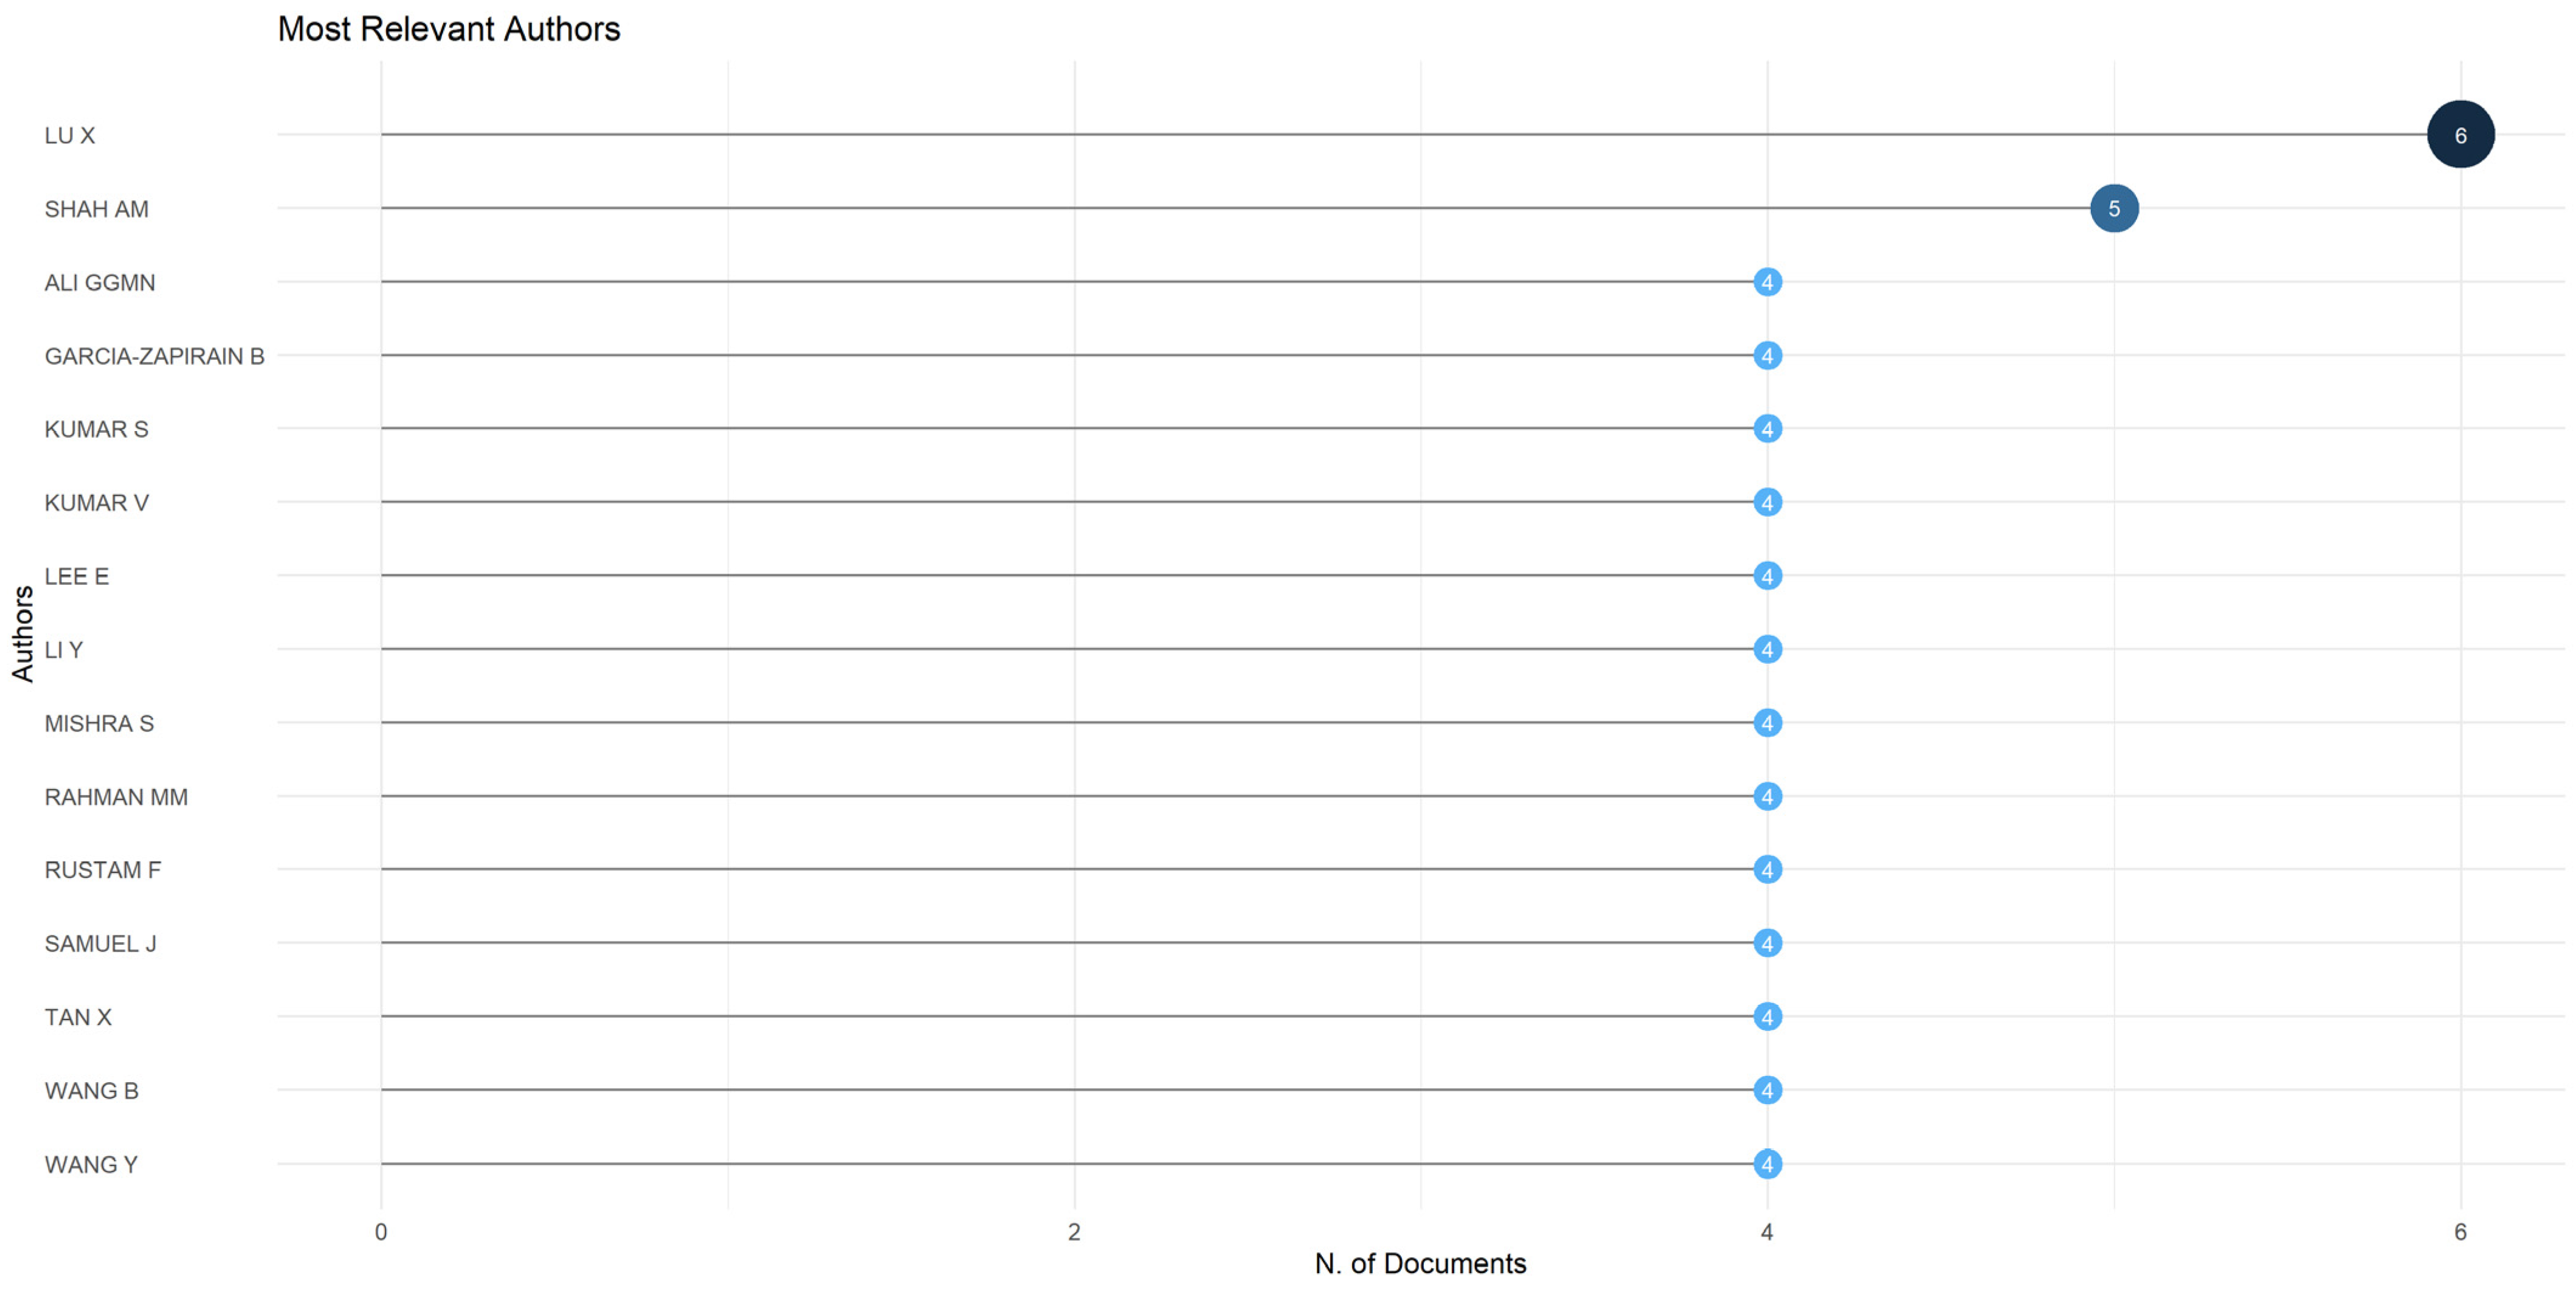
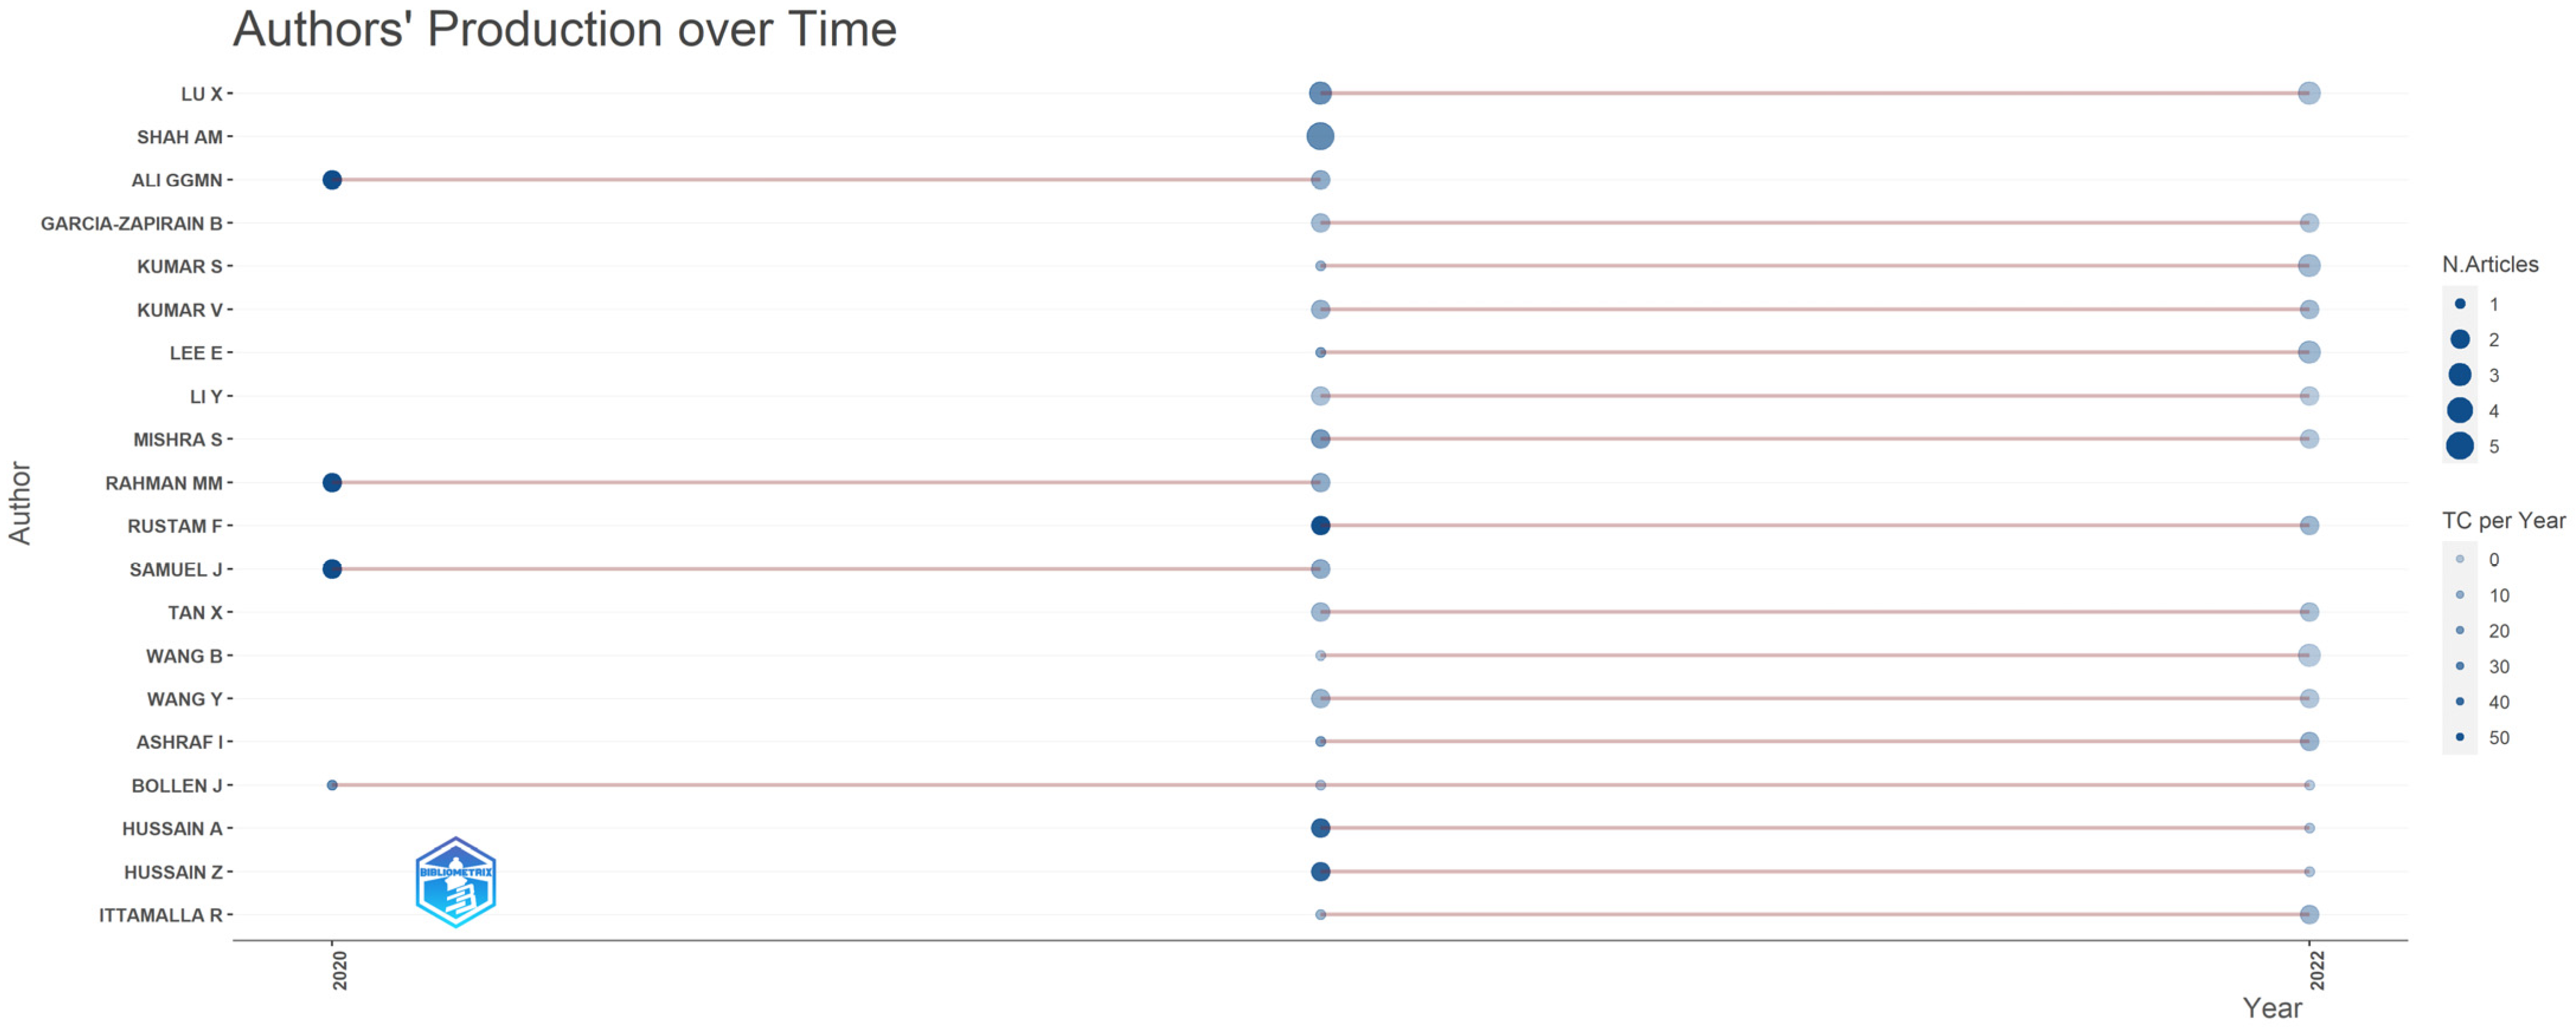
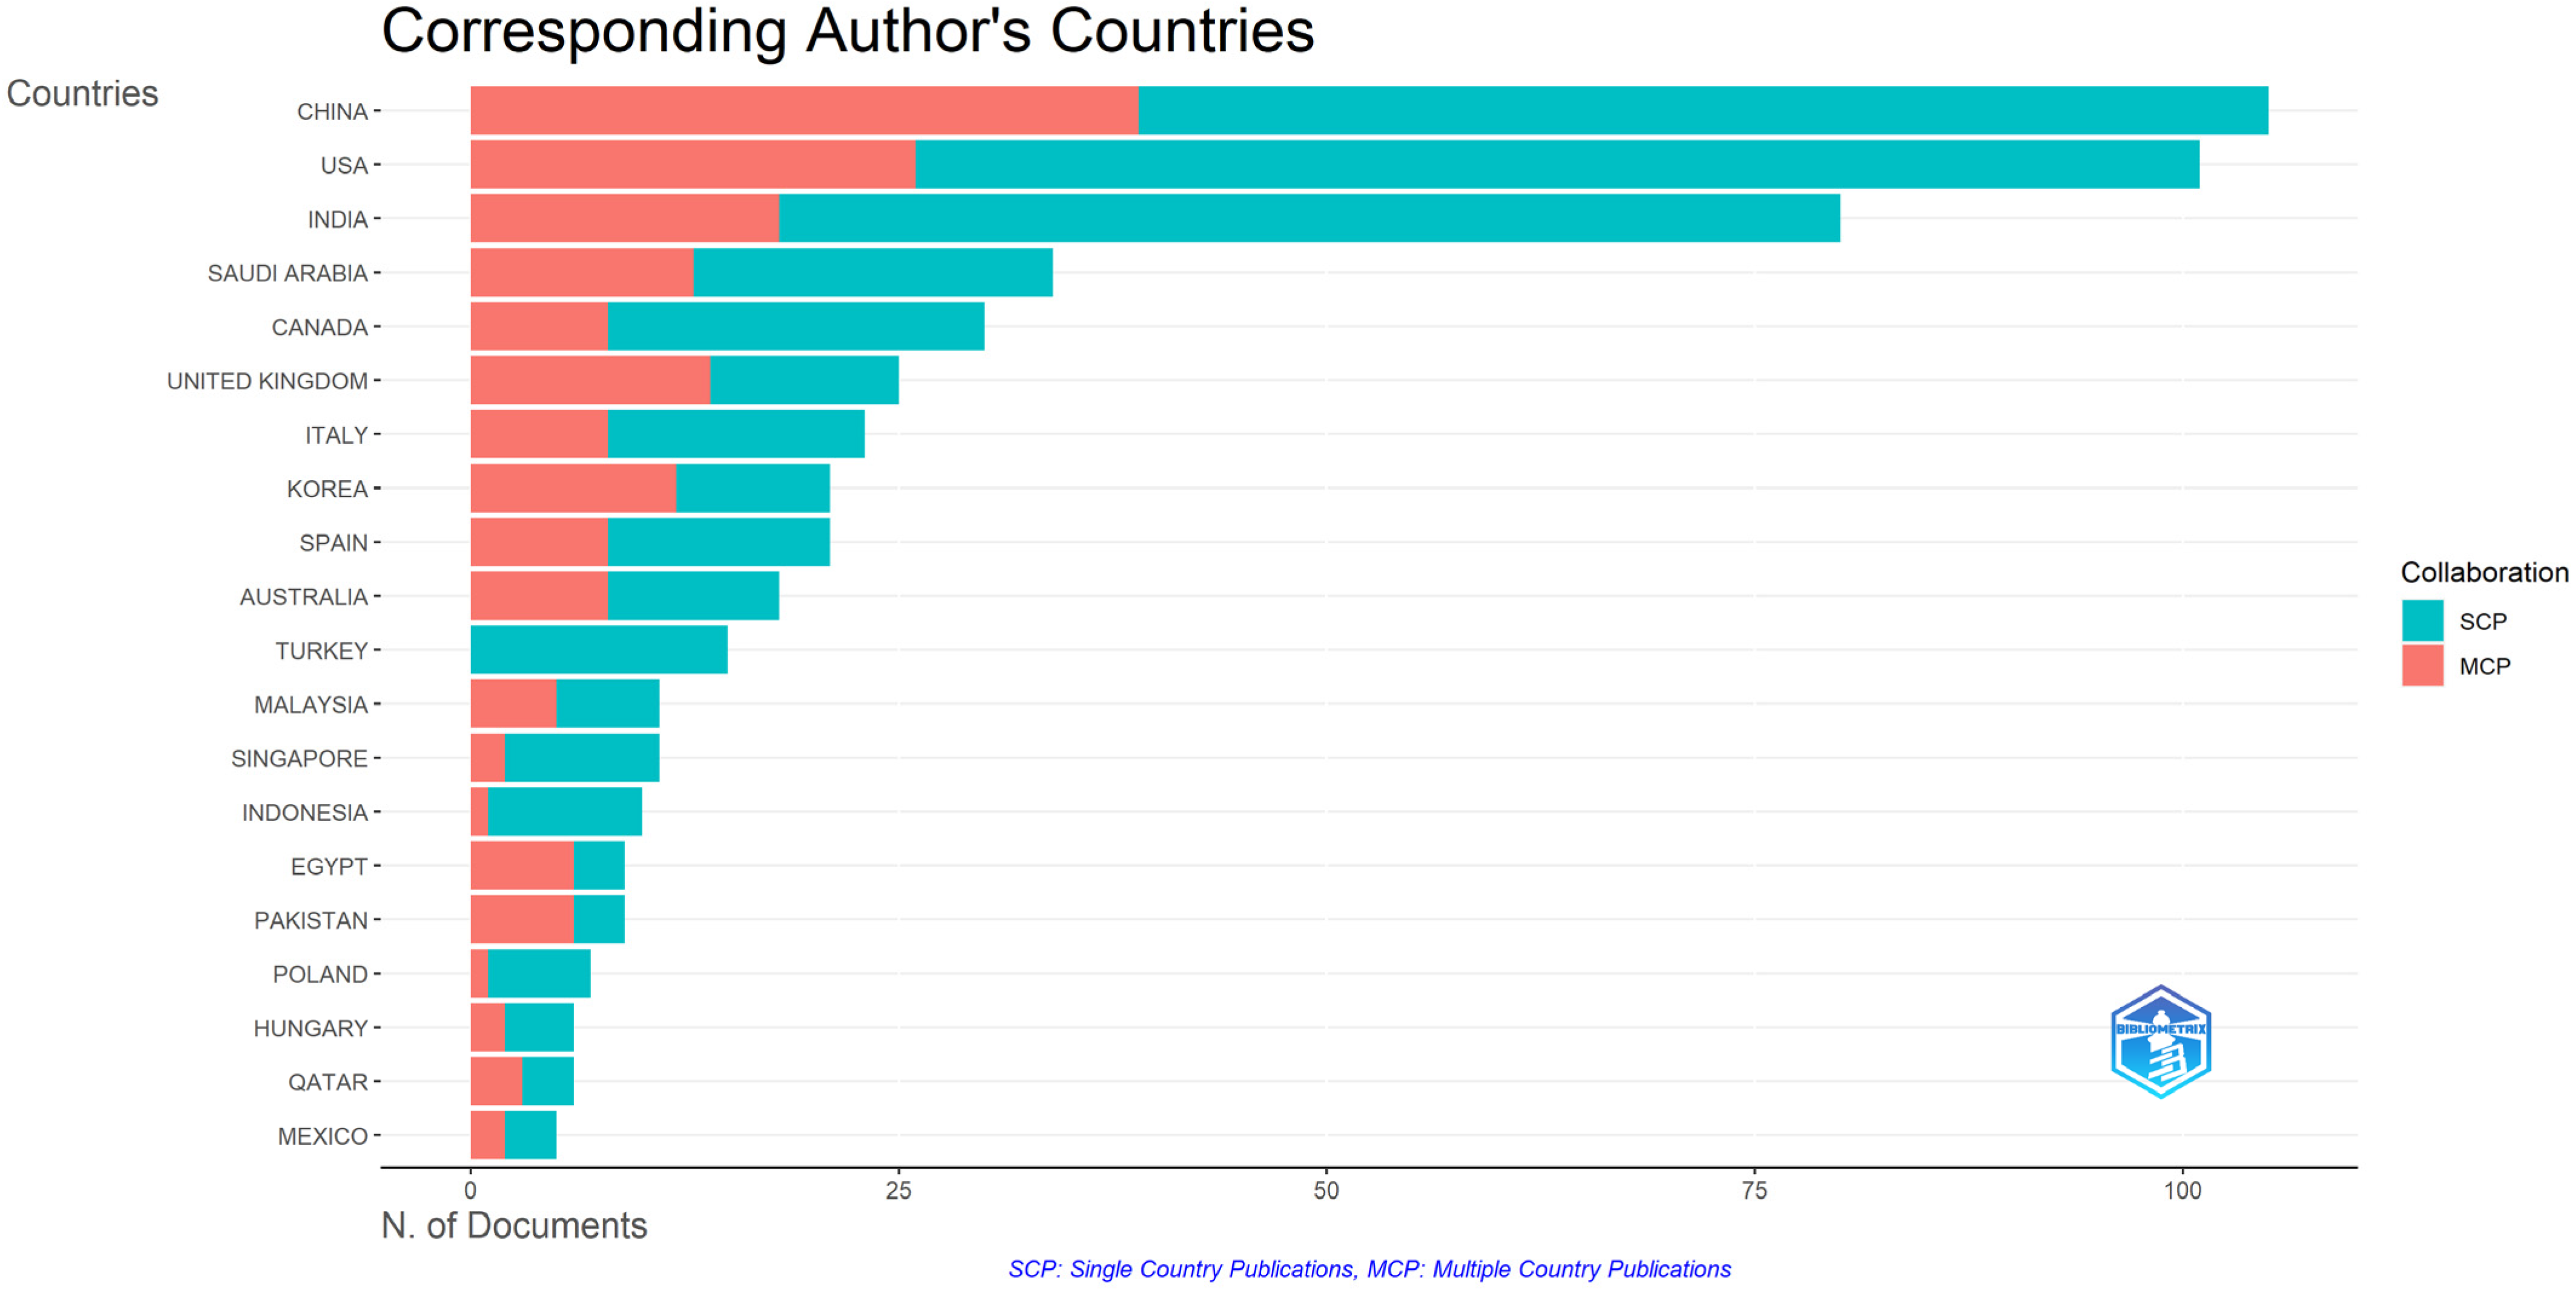
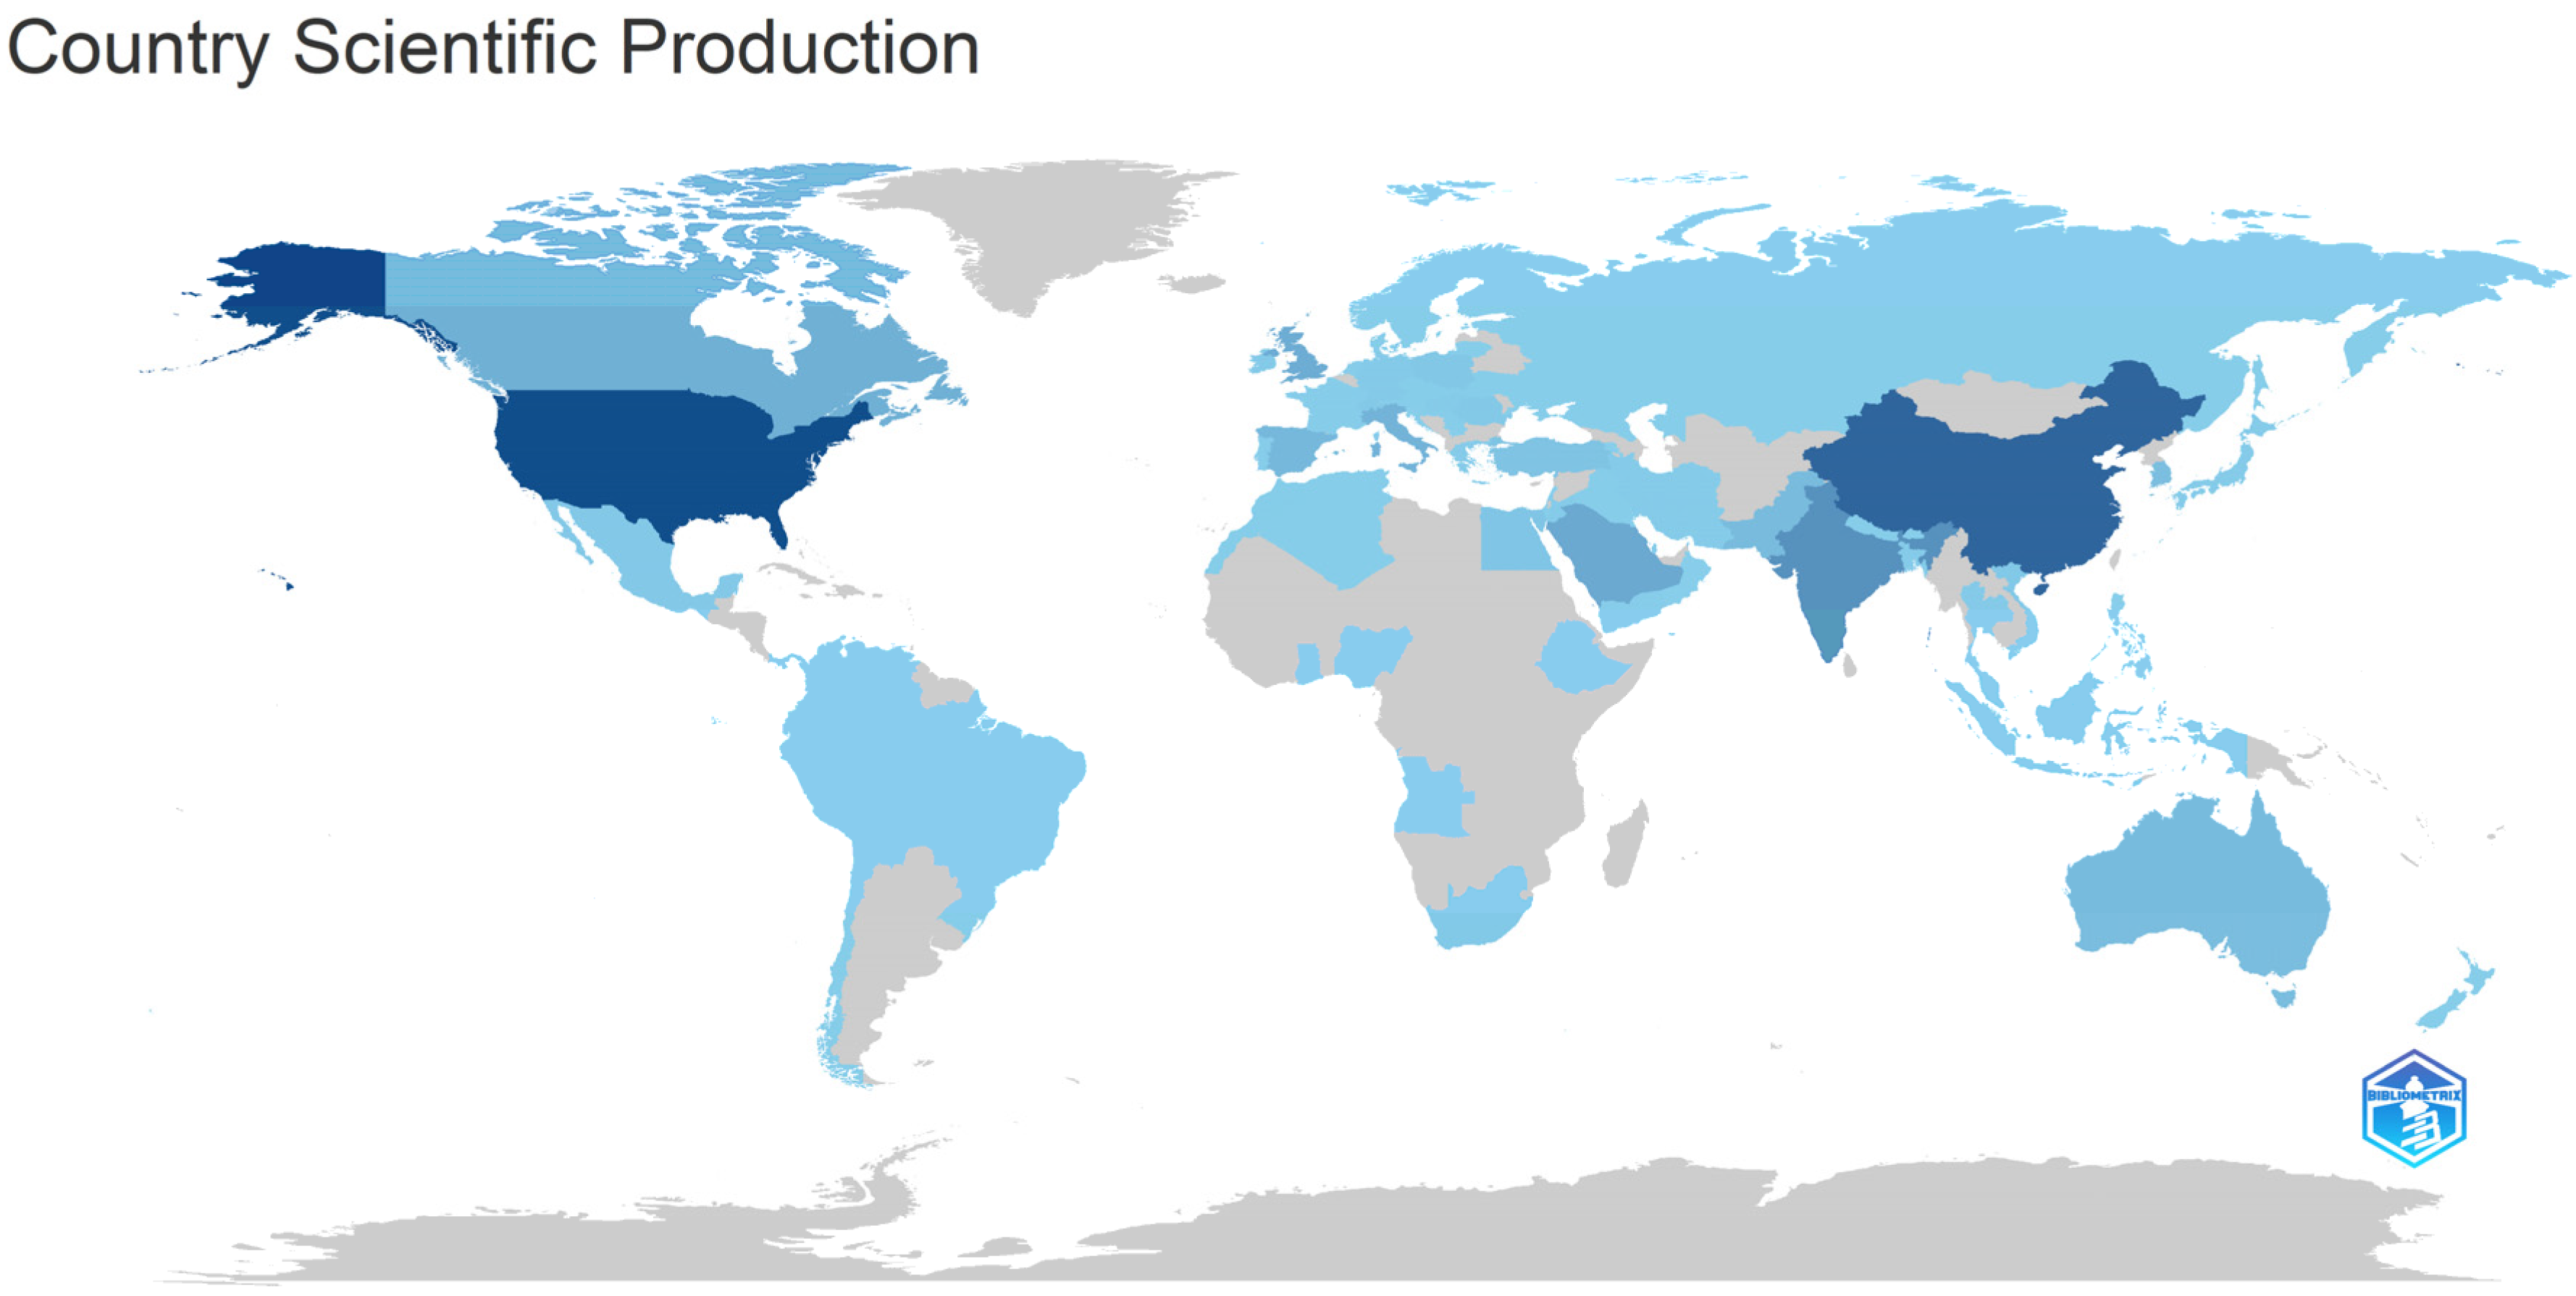
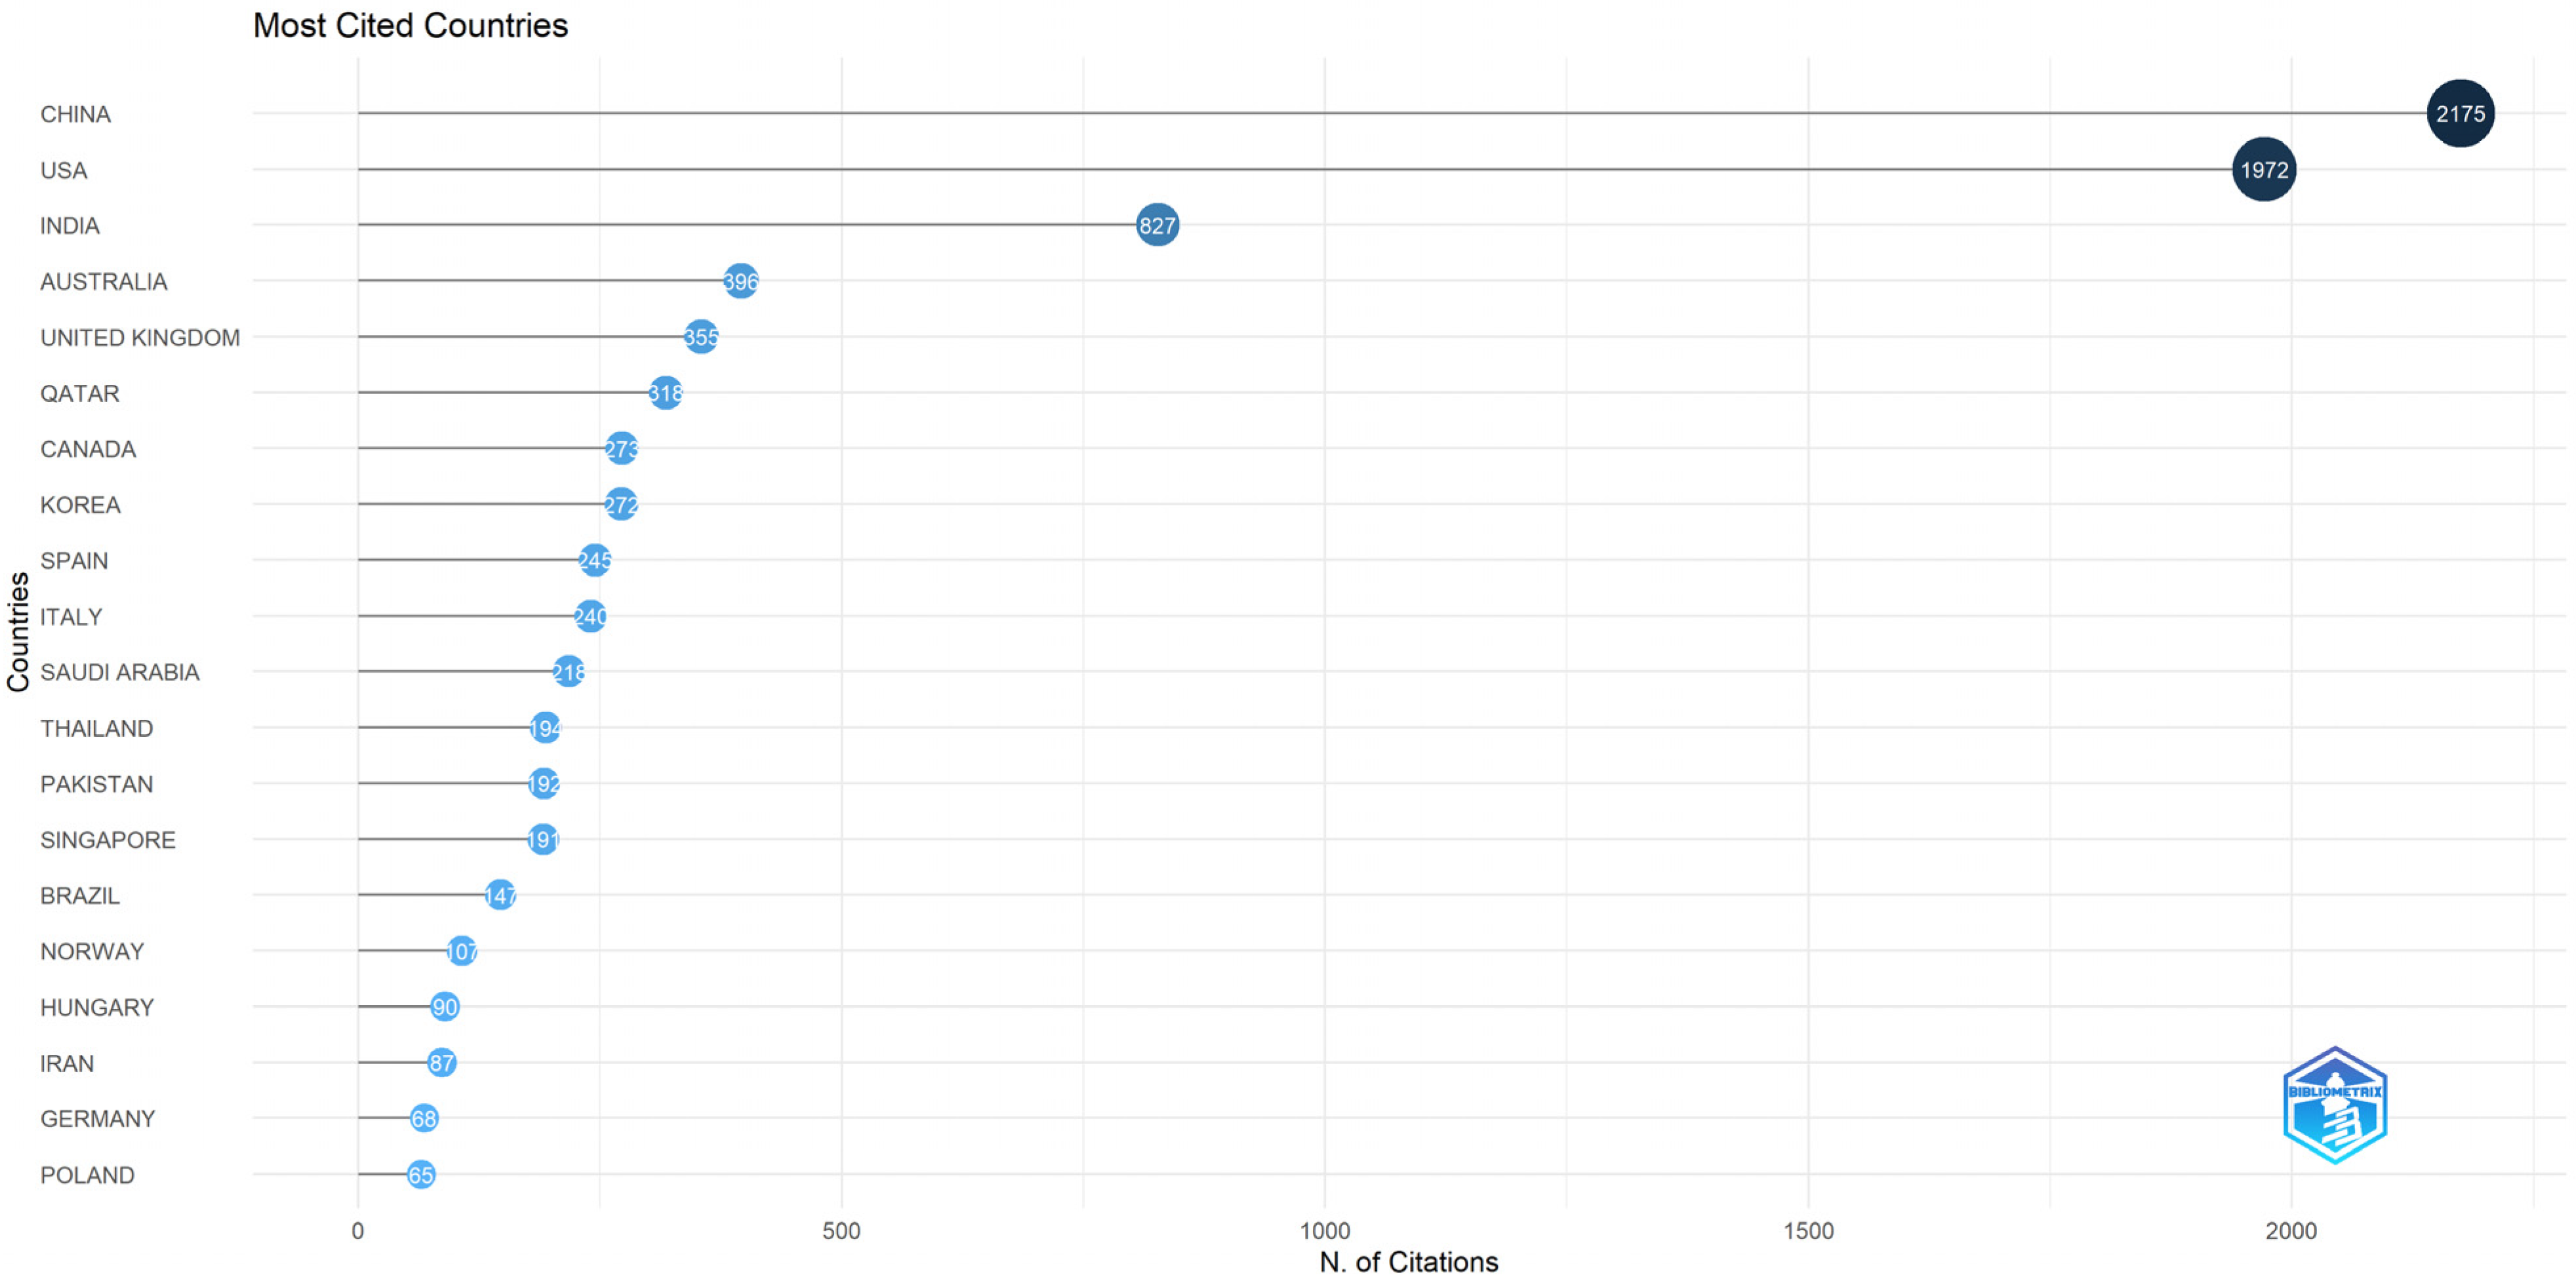
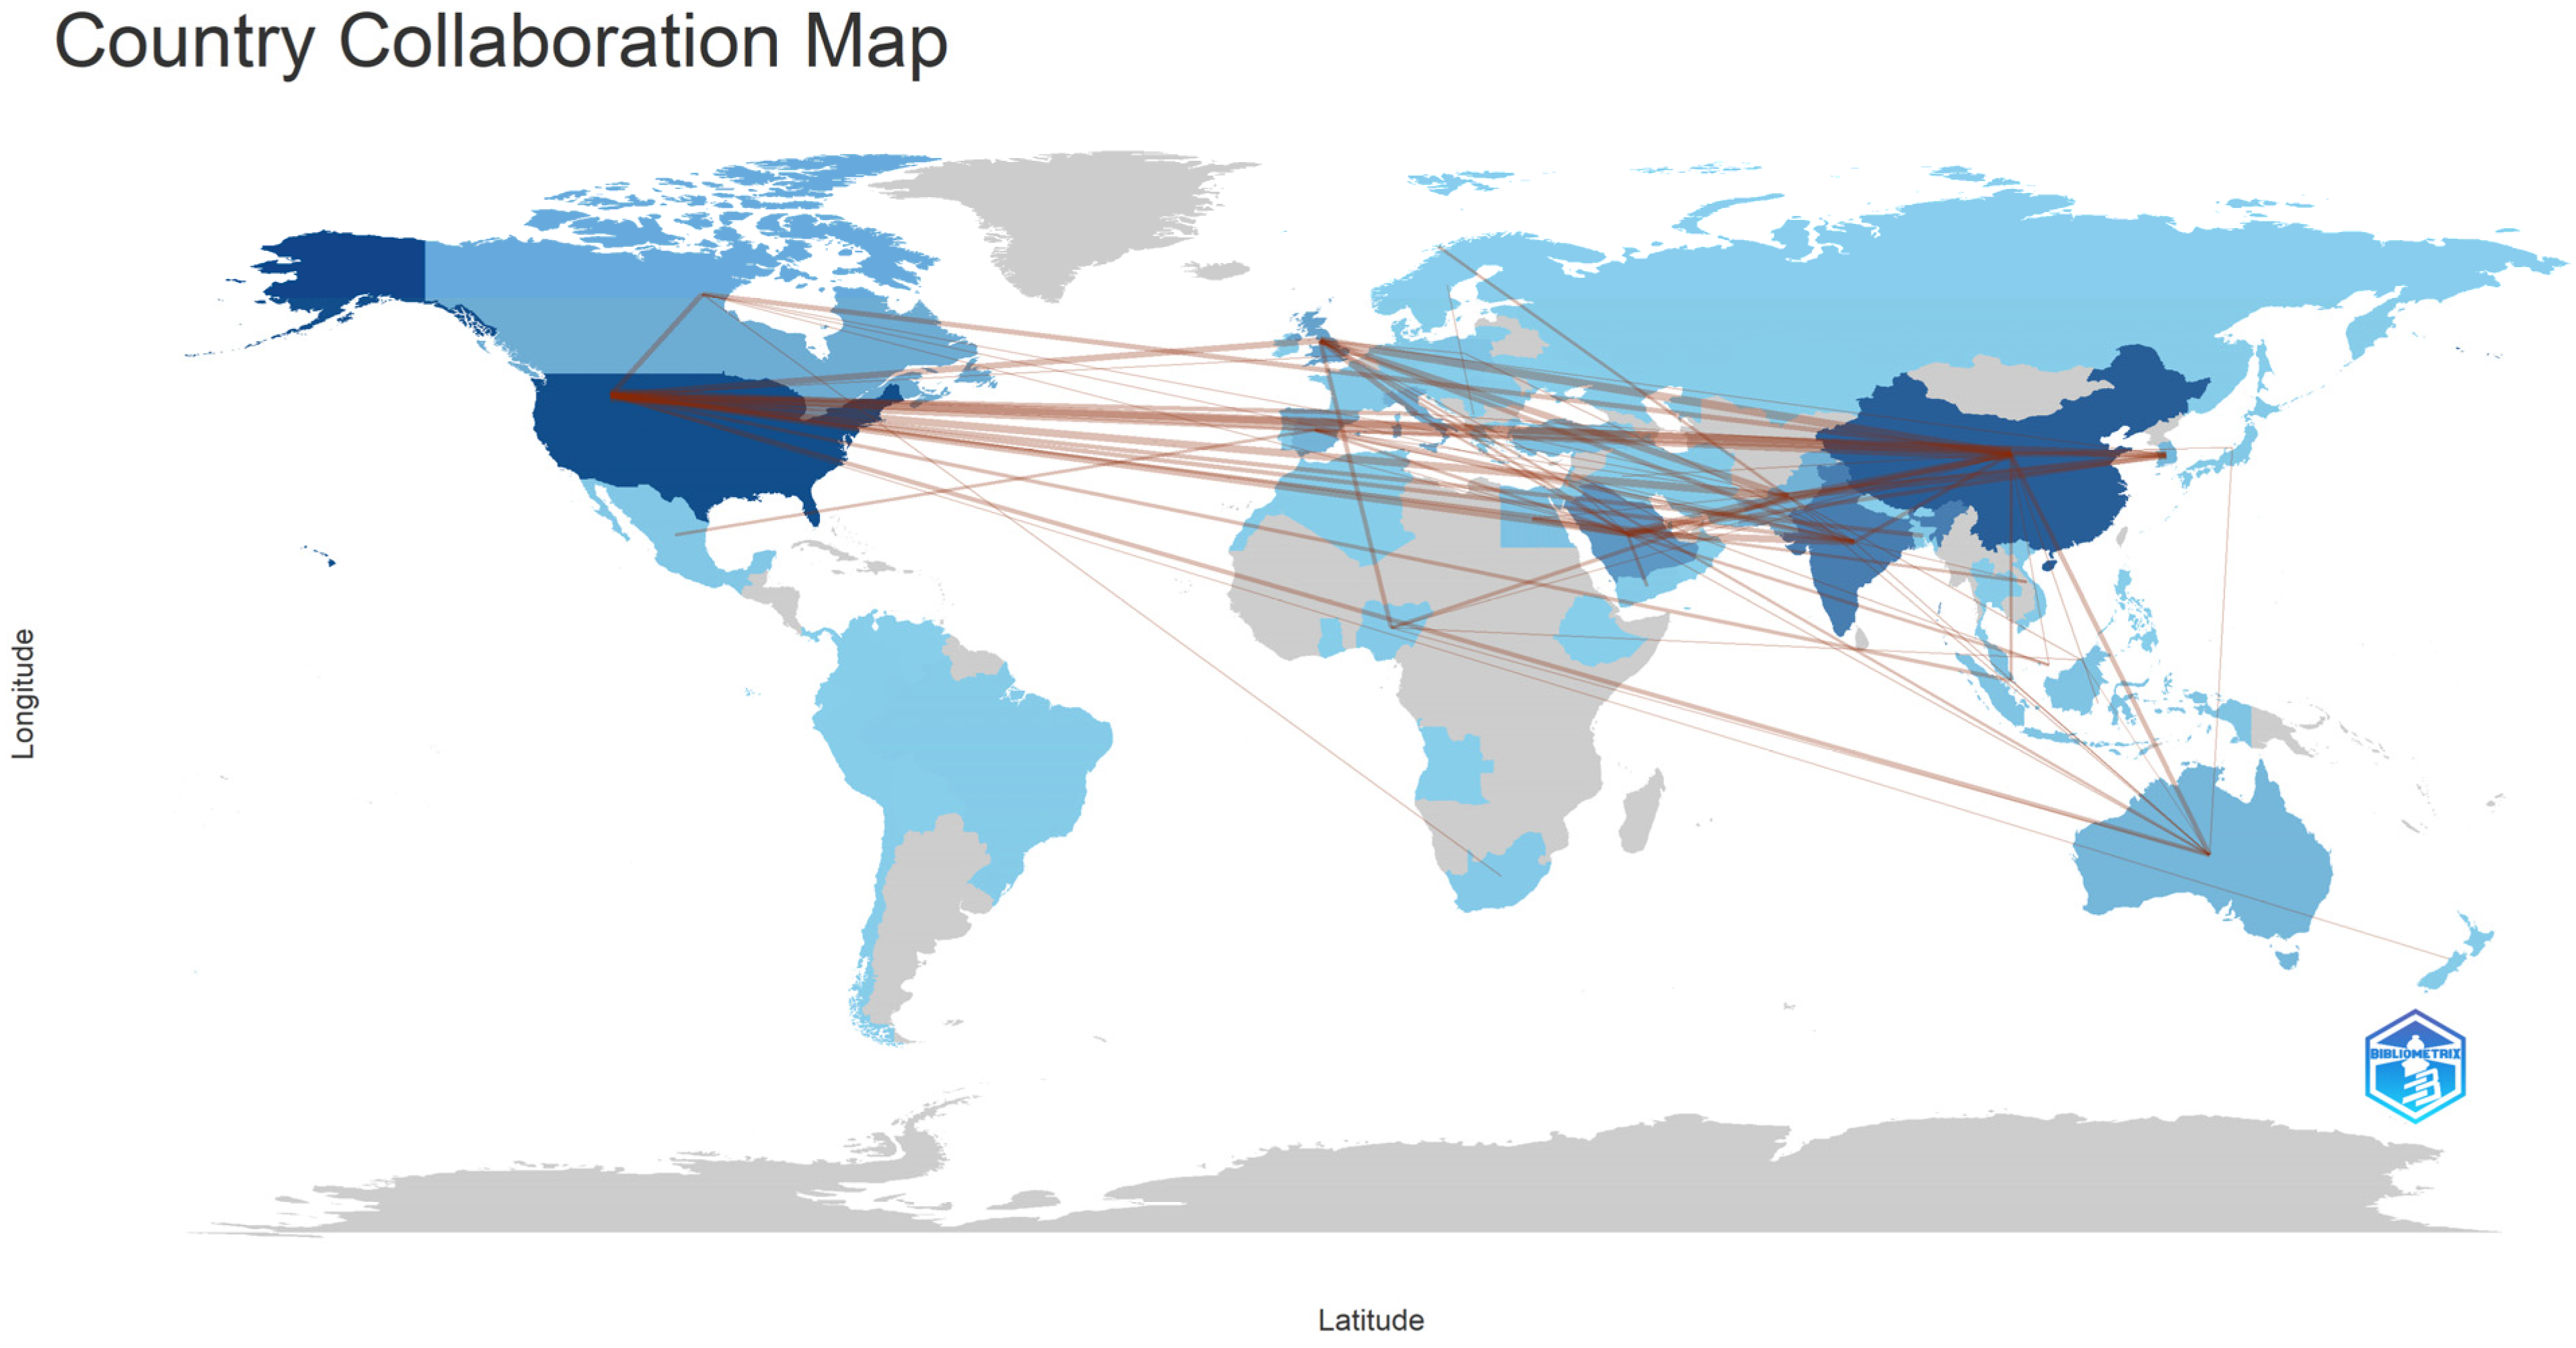
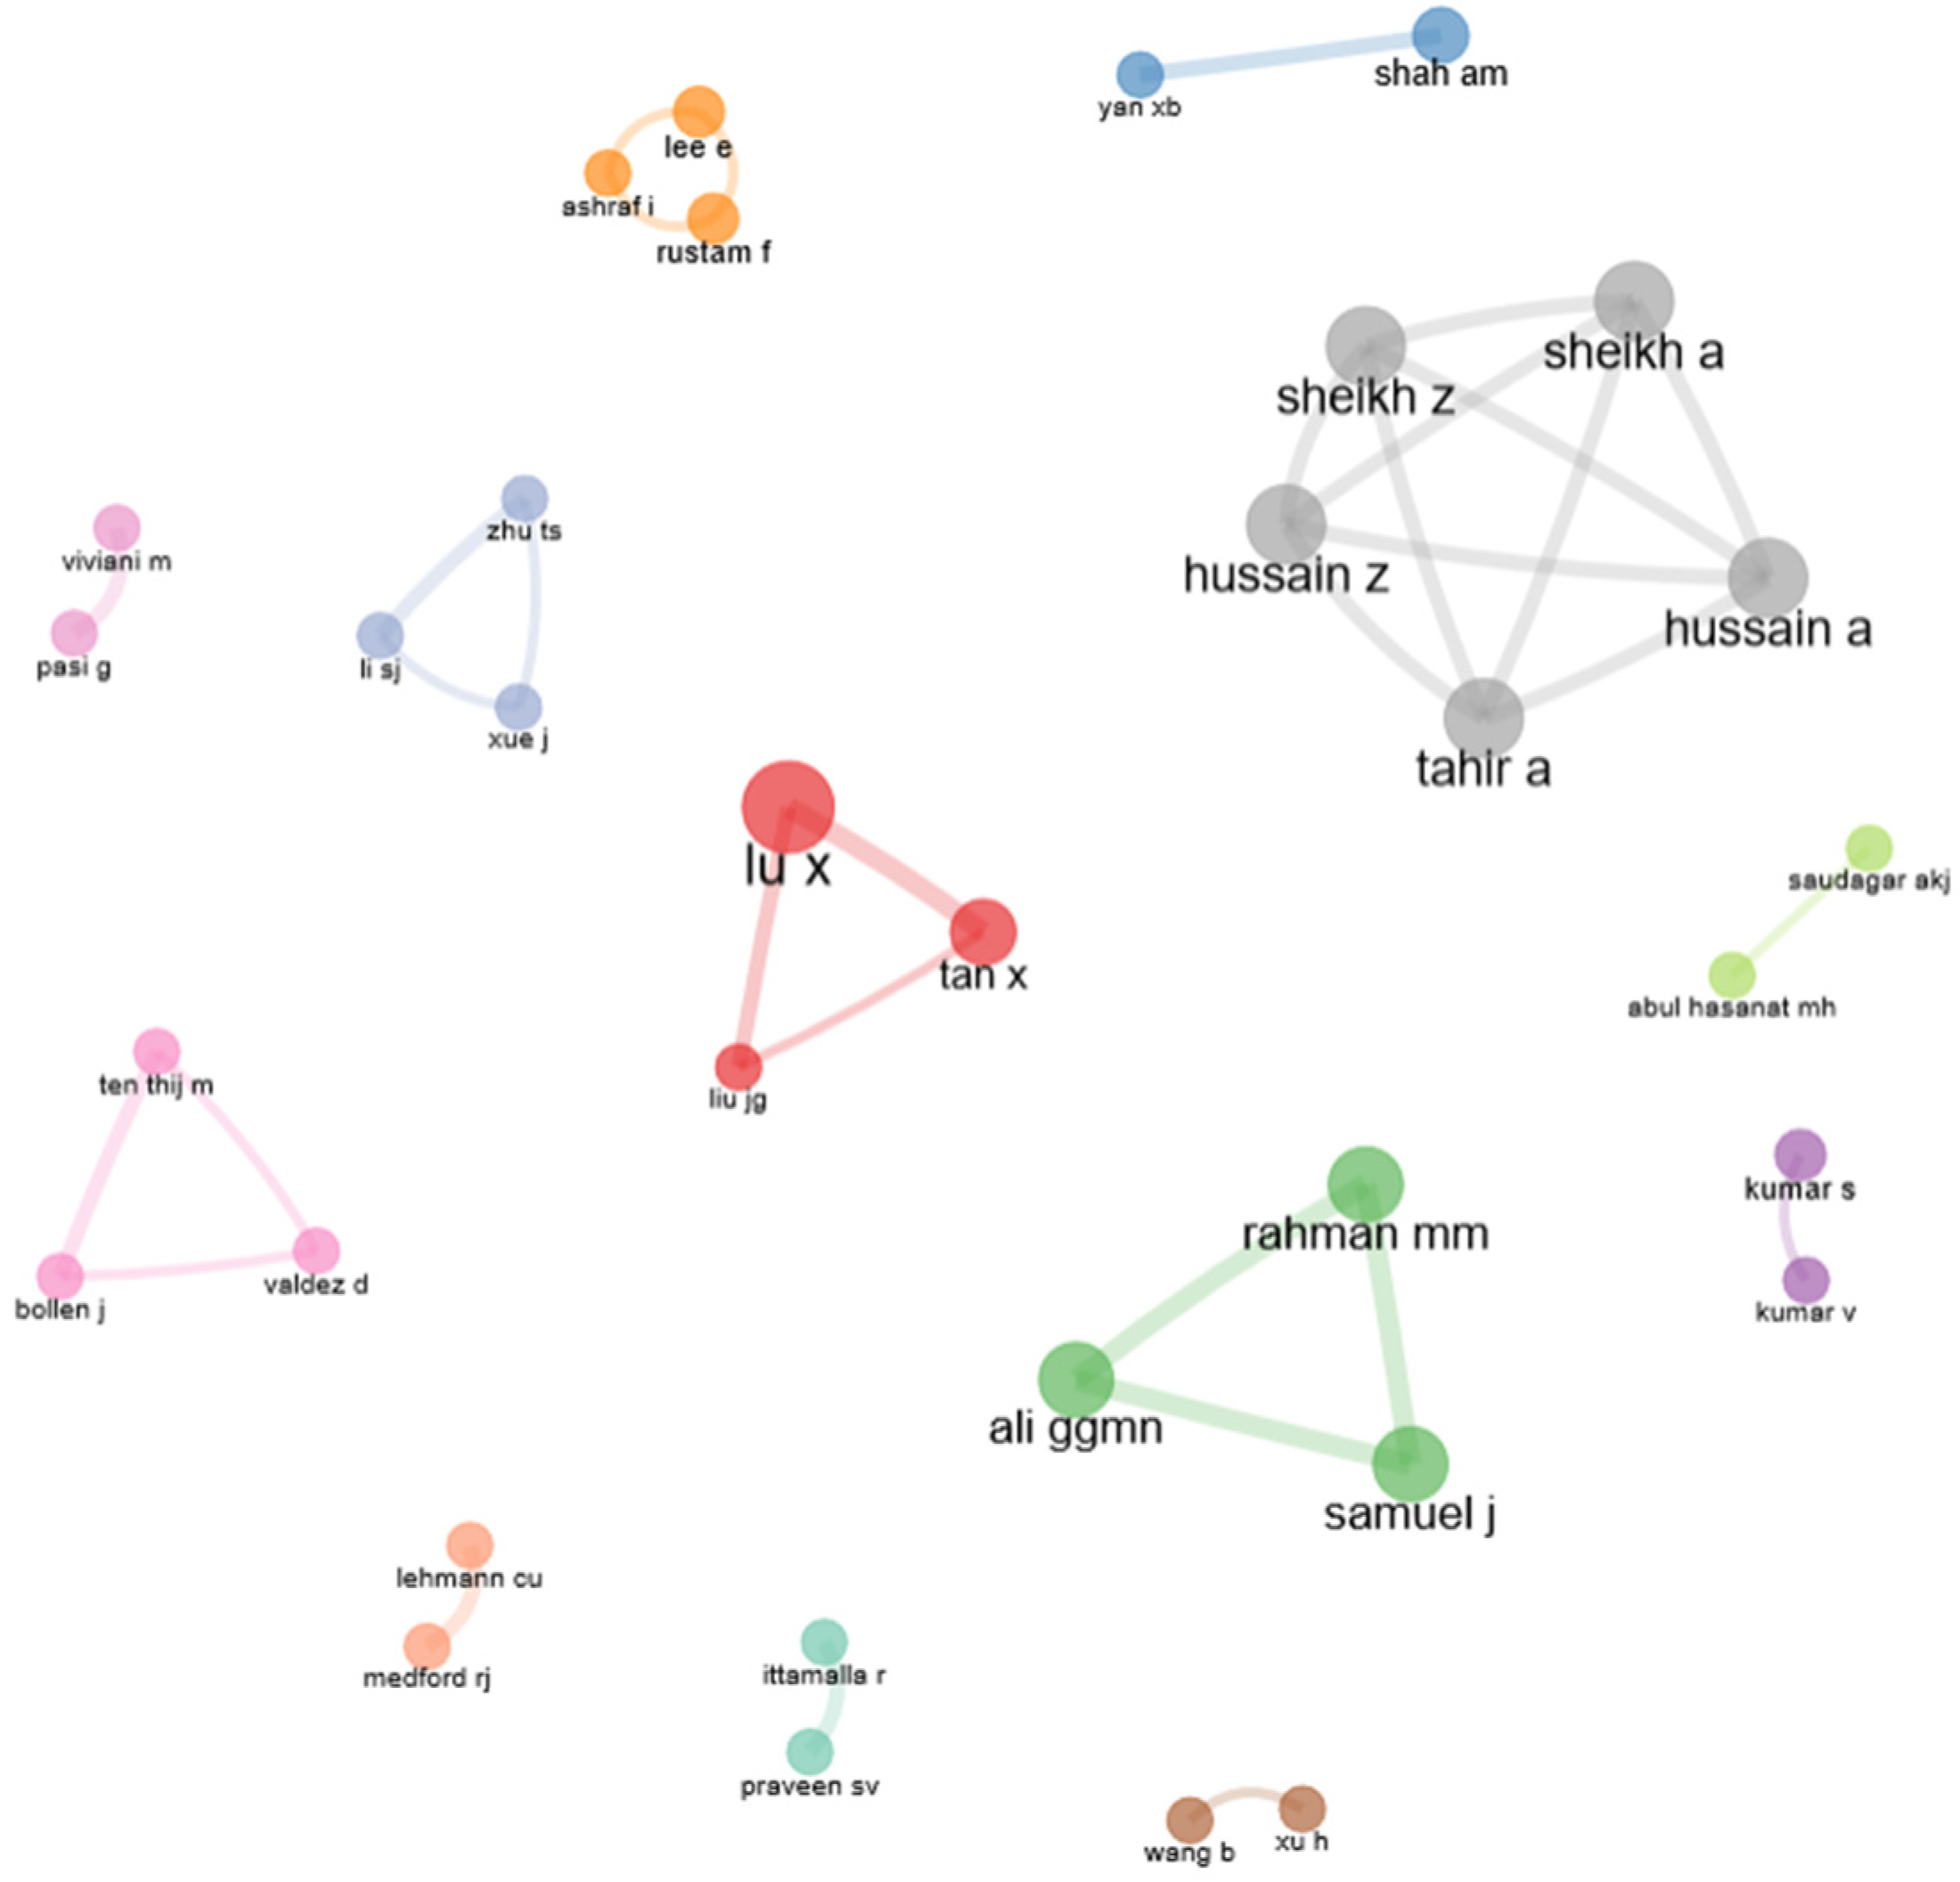
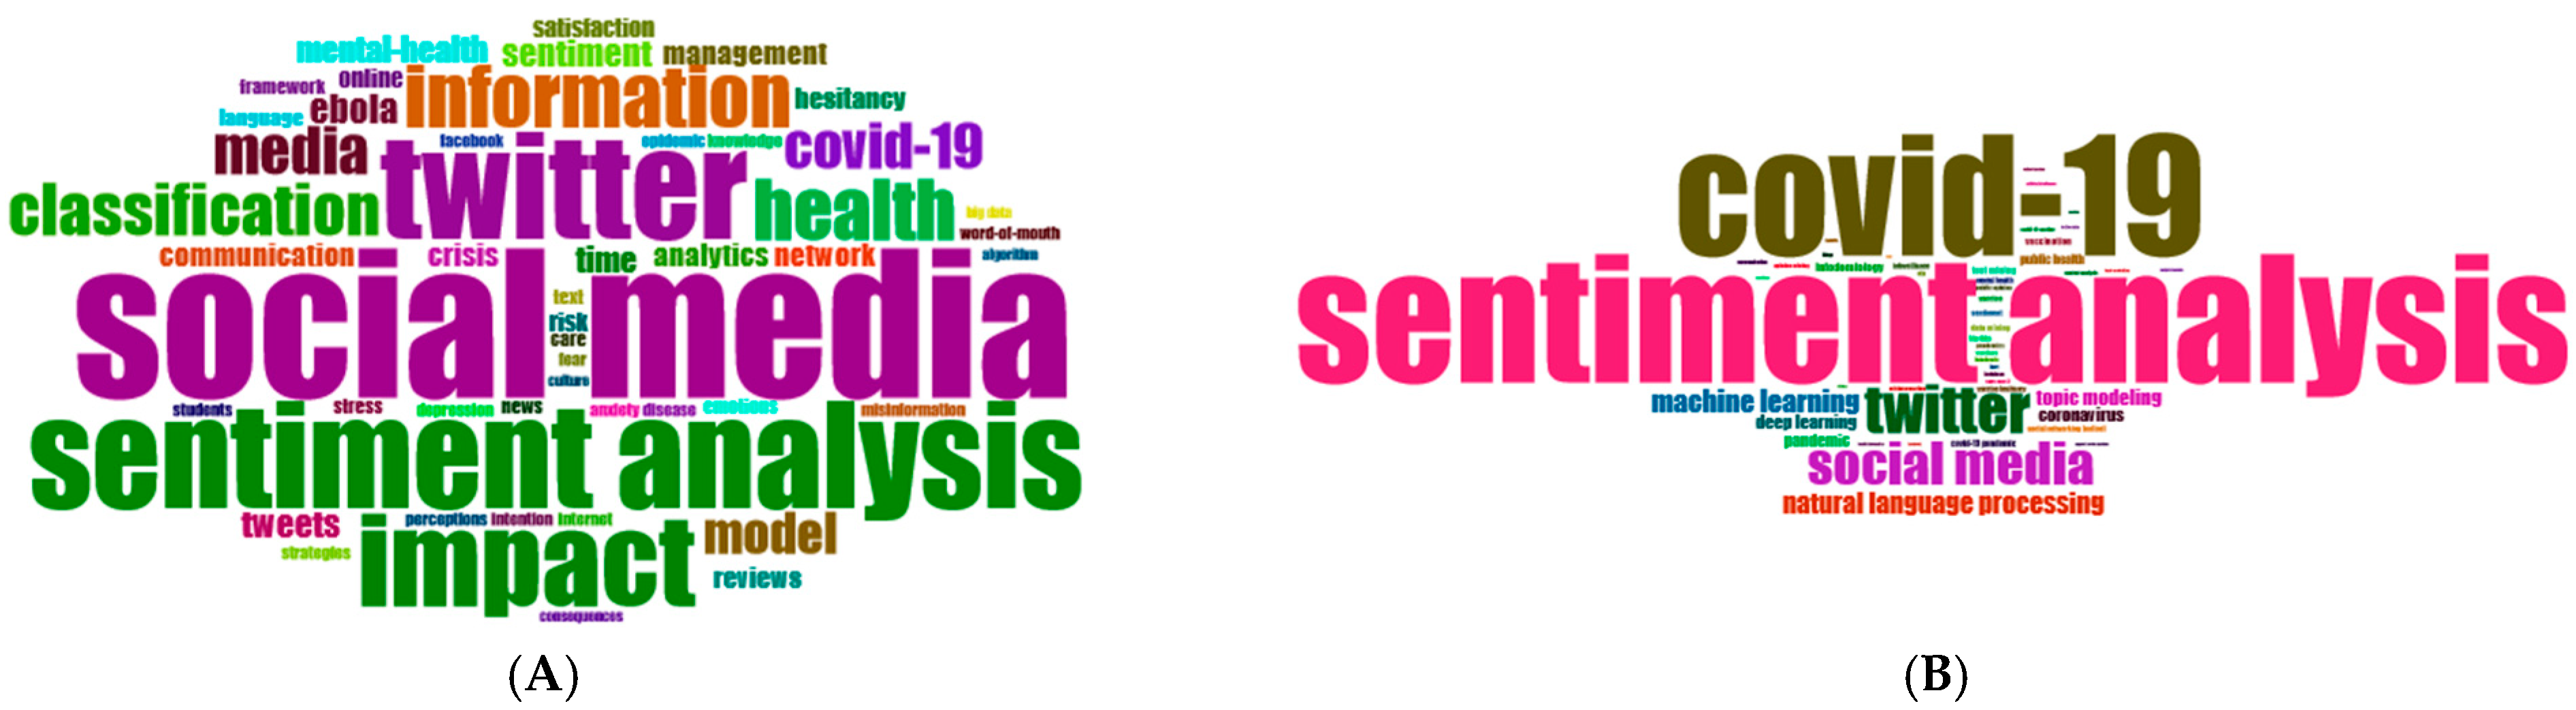
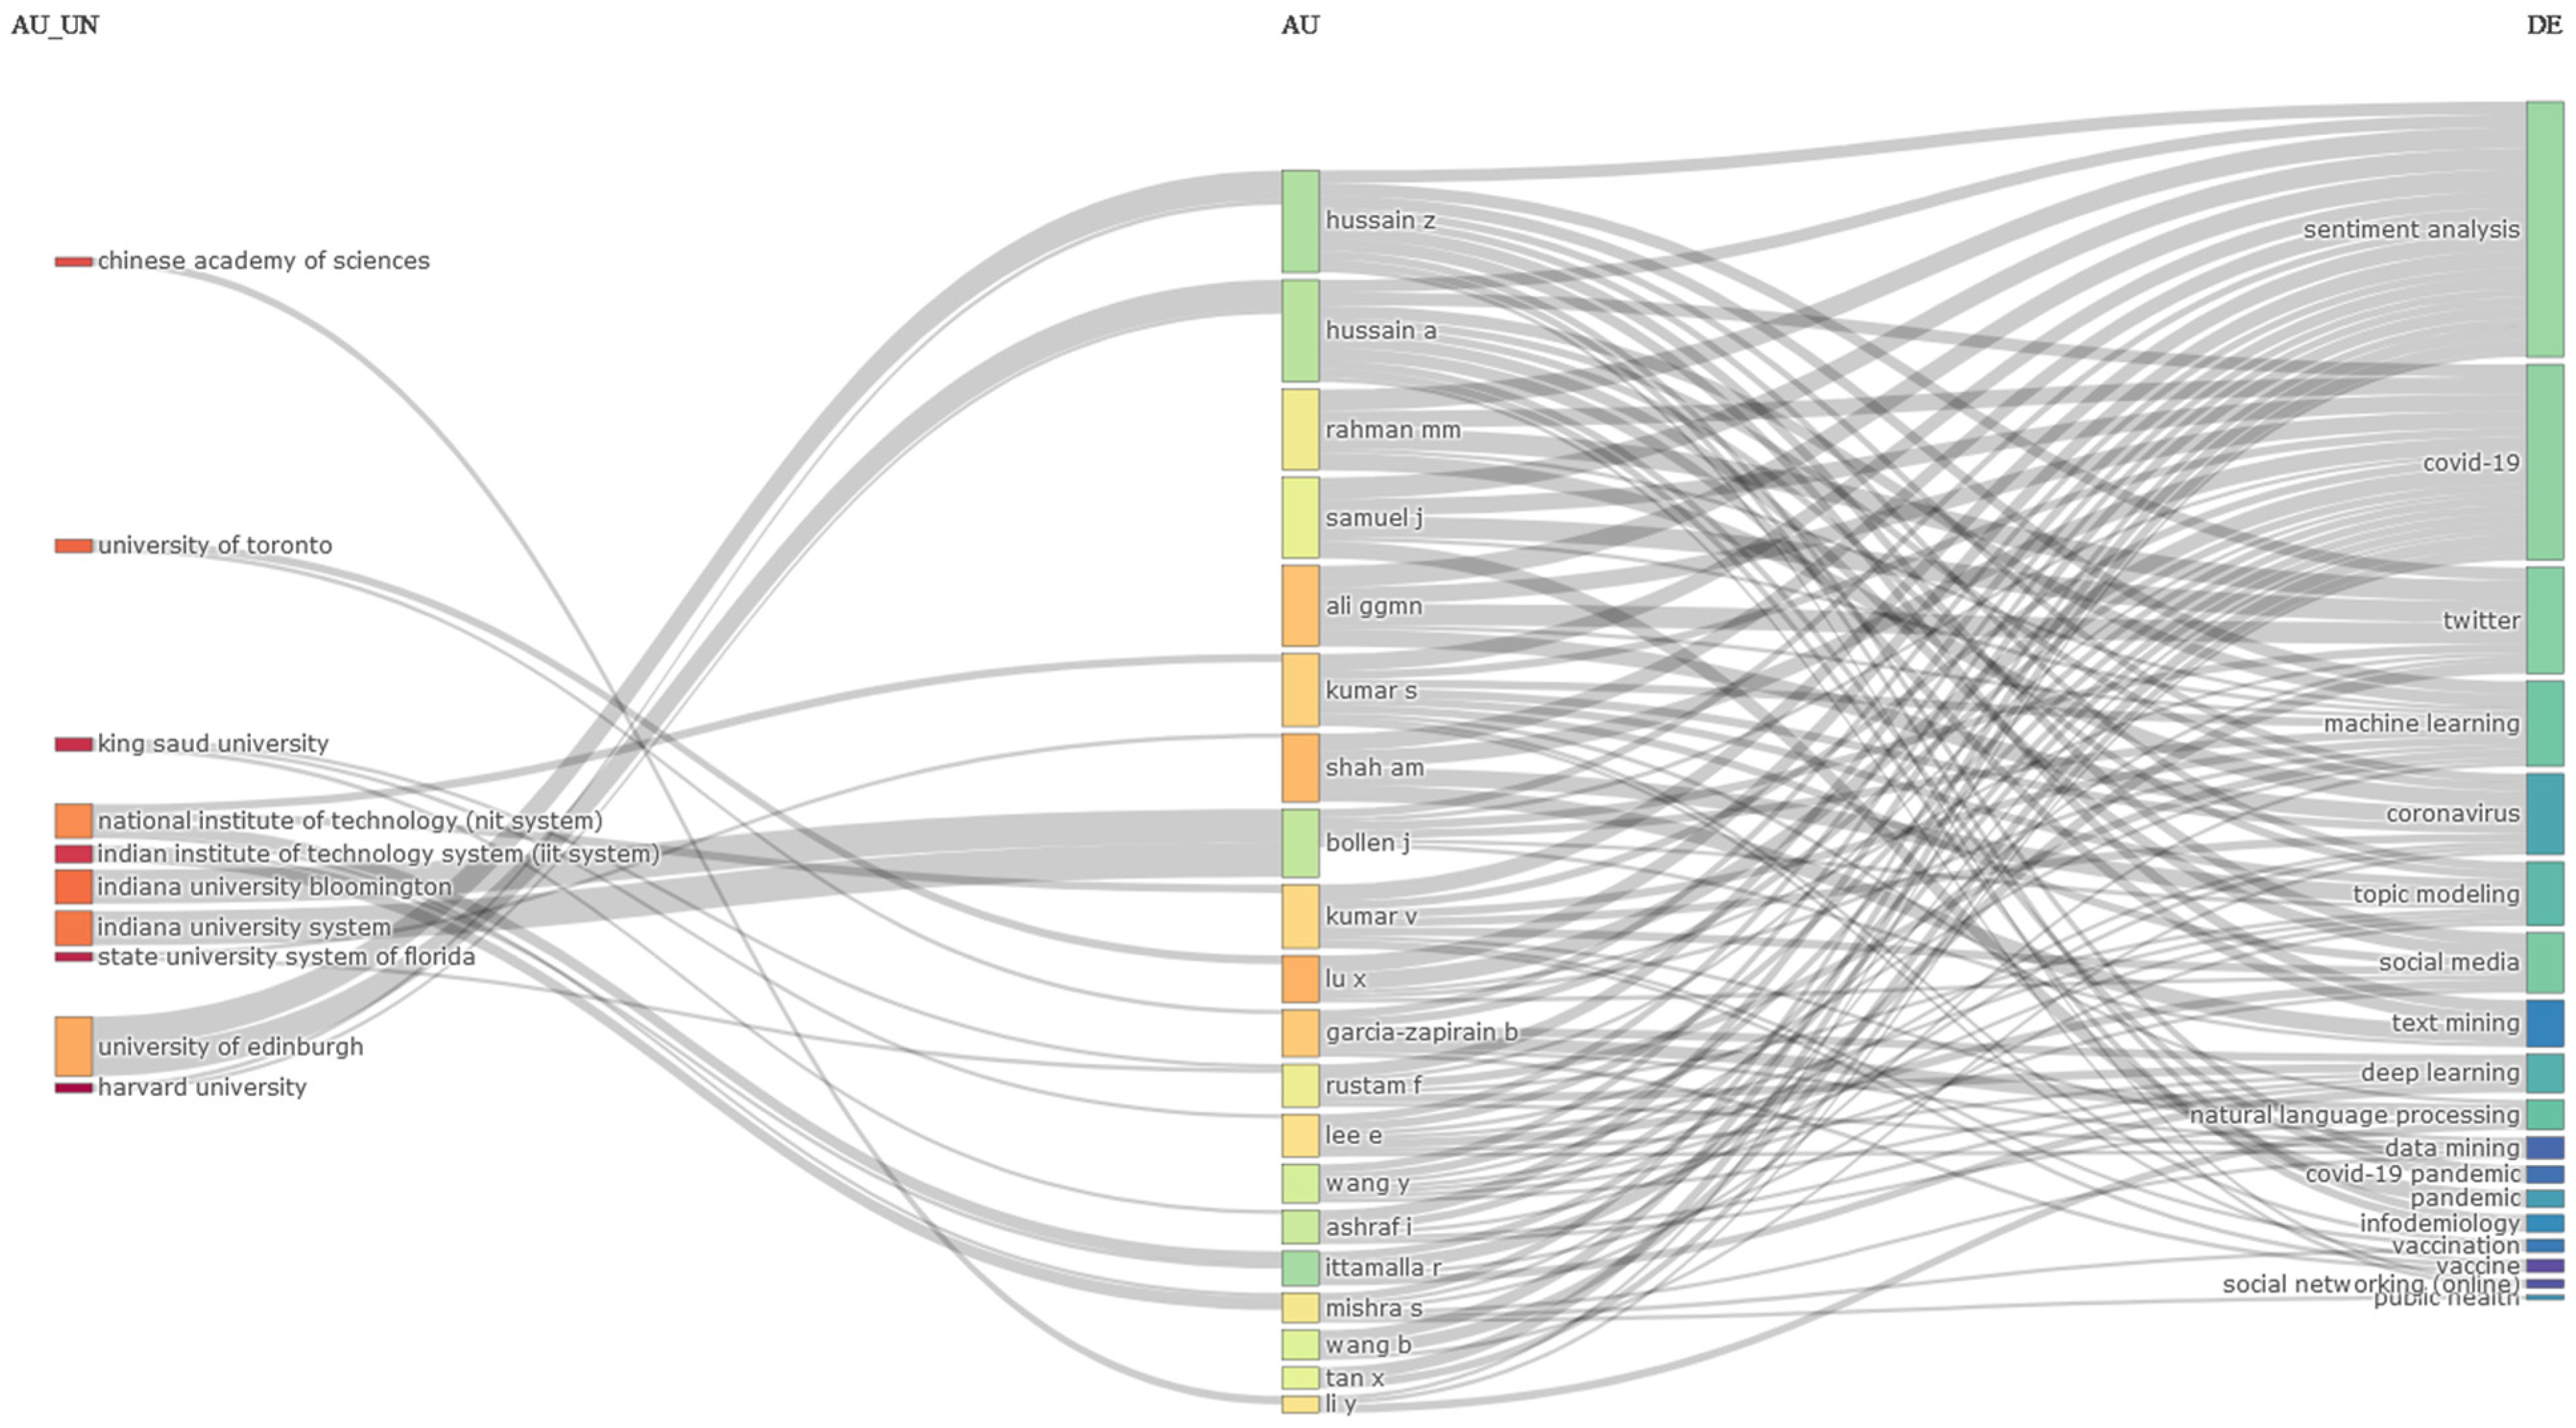
Table 1.
Data selection steps.
| Exploration Steps | Filters on WoS | Description | Query | Query Number | Count |
|---|---|---|---|---|---|
| 1 | Title/Abstract/Keywords | Contains the specific keyword related to sentiment analysis | ((TI = (sentiment_analysis)) OR AB = (sentiment_analysis)) OR AK = (sentiment_analysis) | #1 | 16,710 |
| Contains one of the specific keywords related to COVID-19 | (((((TI = (COVID-19)) OR TI = (coronavirus)) OR AB = (COVID-19)) OR AB = (coronavirus)) OR AK = (COVID-19)) OR AK = (coronavirus) | #2 | 464,584 | ||
| Contains #1 and #2 | #2 AND #1 | #3 | 1127 | ||
| 2 | Language | Limit to English | (#3) AND LA = (English) | #4 | 1116 |
| 3 | Document Type | Limit to Article | (#4) AND DT = (Article) | #5 | 882 |
| 4 | Year | Limit to 2022 | (#5) NOT PY = (2023) | #6 | 646 |
Table 2.
Main information about data.
| Indicator | Value |
|---|---|
| Timespan | 2020:2022 |
| Sources | 310 |
| Documents | 646 |
| Average years from publication | 1.55 |
| Average citations per documents | 14.43 |
| Average citations per year per document | 4.709 |
| References | 24,445 |
Table 3.
Document contents.
| Indicator | Value |
|---|---|
| Keywords plus | 620 |
| Author’s keywords | 1640 |
Table 4.
Authors.
| Indicator | Value |
|---|---|
| Authors | 2458 |
| Author appearances | 2779 |
| Authors of single-authored documents | 31 |
| Authors of multi-authored documents | 2427 |
Table 5.
Author collaboration.
| Indicator | Value |
|---|---|
| Single-authored documents | 31 |
| Documents per author | 0.263 |
| Authors per document | 3.8 |
| Co-authors per documents | 4.3 |
| Collaboration index | 3.95 |
Table 6.
Top 10 most global cited documents.
| No. | Paper (First Author, Year, Journal, Reference) | Number of Authors | Region | Total Citations (TC) | Total Citations per Year (TCY) | Normalized TC (NTC) |
|---|---|---|---|---|---|---|
| 1 | Li SJ, 2020, International Journal of Environmental Research and Public Health [56] | 5 | China, Canada | 888 | 222.00 | 13.55 |
| 2 | Abd-Alrazaq A, 2020, Journal of Medical Internet Research [57] | 5 | Qatar, Kuwait | 289 | 72.25 | 4.41 |
| 3 | Samuel J, 2020, Information [58] | 5 | USA, Bangladesh | 175 | 43.75 | 2.67 |
| 4 | Boon-Itt S, 2020, JMIR Public Health and Surveillance [59] | 2 | Thailand | 172 | 43.00 | 2.62 |
| 5 | Chakraborty K, 2020, Applied Soft Computing [60] | 6 | India, Saudi Arabia, Czech Republic, Egypt | 149 | 37.25 | 2.27 |
| 6 | Zhao YX, 2020, Journal of Medical Internet Research [61] | 4 | China | 147 | 36.75 | 2.24 |
| 7 | Shorten C, 2021, Journal of Big Data [62] | 3 | USA | 125 | 41.67 | 6.95 |
| 8 | Lyu JC, 2021, Journal of Medical Internet Research [63] | 3 | USA | 121 | 40.33 | 6.73 |
| 9 | Liu Q, 2020, Journal of Medical Internet Research [64] | 12 | China, USA, United Kingdom | 121 | 30.25 | 1.85 |
| 10 | Xue J, 2020, PLOS ONE [65] | 6 | Canada, USA, China | 120 | 30.00 | 1.83 |
Table 7.
Brief summary of the content of the top 10 most global cited documents.
| No. | Paper (First Author, Year, Journal, Reference) | Title | Methods Used | Data | Purpose |
|---|---|---|---|---|---|
| 1 | Li SJ, 2020, International Journal of Environmental Research and Public Health [56] | The Impact of COVID-19 Epidemic Declaration on Psychological Consequences: A Study on Active Weibo Users | Online Ecological Recognition (OER) based on machine-learning predictive models | The dataset consists of various Weibo posts from 17,865 active users, gathered over an interval of two weeks from 13 January to 26 January 2020. | Examine how the COVID-19 pandemic affects mental well-being from a psychological perspective, along with helping clinical practitioners and assisting policy makers, for improving the services and decisions. |
| 2 | Abd-Alrazaq A, 2020, Journal of Medical Internet Research [57] | Top Concerns of Tweeters During the COVID-19 Pandemic: Infoveillance Study | Data collection using APIs, Twitter Python Library, and PostgreSQL database. Predefined search terms. Extraction of text and metadata. Analysis of word frequency—unigrams and bigrams. Latent Dirichlet allocation for topic modeling. Sentiment analysis. Mean metrics. | The dataset consists of 167,073 unique English tweets from 160,829 unique users between 2 February and 15 March 2020 | Identify the most common topics posted on Twitter about the COVID-19 pandemic. |
| 3 | Samuel J, 2020, Information [58] | COVID-19 Public Sentiment Insights and Machine Learning for Tweets Classification | Textual Analytics. NRC sentiment lexicon. Data visualization. Machine learning techniques. | COVID-19 tweets, mostly based on fear and negative sentiments. | Understand the impact of COVID-19 pandemic on public sentiment, especially fear. Additionally, demonstrating the viability of machine learning classification methods on sentiment analysis. |
| 4 | Boon-Itt S, 2020, JMIR Public Health and Surveillance [59] | Public Perception of the COVID-19 Pandemic on Twitter: Sentiment Analysis and Topic Modeling Study | Sentiment analysis using frequency of words analysis. NLP and National Research Council (NRC) sentiment lexicon. Latent Dirichlet allocation algorithm for topic modeling. | 107,990 COVID-19 tweets in English, collected between 13 December and 9 March 2020. | Raise public awareness about COVID-19 pandemic trends and identify meaningful themes of concern expressed by Twitter users. |
| 5 | Chakraborty K, 2020, Applied Soft Computing [60] | Sentiment Analysis of COVID-19 tweets by Deep Learning Classifiers—A study to show how popularity is affecting accuracy in social media | Naïve Bayes classifiers. Ensemble models—AdaBoost classifier. Support vector machine (SVM) models. Linear models: logistic regression, linear model. N-grams: unigrams, bigrams, trigrams. Doc2Vec model | Dataset 1—23,000 retweeted tweets collected between 1 January 2019 and 23 March 2020. Dataset 2—226,668 tweets collected between December 2019 and May 2020. | Sentiment analysis during COVID-19 pandemic, along with the usage and evaluation of deep learning classifiers. |
| 6 | Zhao YX, 2020, Journal of Medical Internet Research [61] | Chinese Public’s Attention to the COVID-19 Epidemic on Social Media: Observational Descriptive Study | Trend analysis. Keyword analysis. Sentiment analysis. Social network analysis. | Data related to COVID-19 extracted from Sina Microblog hot search list between 31 December 2019 and 20 February 2020. | Investigate and analyze the public’s attention, emotional responses, and key concerns regarding the COVID-19 epidemic during its early stages in China, with the goal of providing valuable insights to aid government and health departments |
| 7 | Shorten C, 2021, Journal of Big Data [62] | Deep Learning applications for COVID-19 | Supervised learning. Unsupervised learning. Semi-supervised learning. Self-supervised learning. Reinforcement learning. Meta-learning. | Medical imaging data. Text and literature data. Health records data. Molecular and biological data. Mobility and Interaction Data. | Enhancing public health outcomes by using Deep Learning and various data to fight against COVID-19. |
| 8 | Lyu JC, 2021, Journal of Medical Internet Research [63] | COVID-19 Vaccine-Related Discussion on Twitter: Topic Modeling and Sentiment Analysis | Topic modeling. Sentiment analysis. Emotion analysis. Statistical analysis. Text mining and natural language processing (NLP). | 1,499,421 unique English-language tweets from 583,499 different users, related to COVID-19, collected between 11 March 2020 and 31 January 2021. | Contribute to a deeper understanding of public perceptions, concerns, and sentiments surrounding the existing COVID-19 vaccines. |
| 9 | Liu Q, 2020, Journal of Medical Internet Research [64] | Health Communication Through News Media During the Early Stage of the COVID-19 Outbreak in China: Digital Topic Modeling Approach | Data collection. Data processing. Topic modeling using latent Dirichlet allocation (LDA). | 7791 Chinese news articles extracted from WiseSearch database, collected between 1 January and 20 February 2020, which are related to COVID-19. | Gather media reports, examine the trends in media-driven health communications and analyze the media’s role in COVID-19 pandemic context. |
| 10 | Xue J, 2020, PLOS One [65] | Public discourse and sentiment during the COVID-19 pandemic: Using Latent Dirichlet Allocation for topic modeling on Twitter | Data preparation. Unsupervised machine learning using latent Dirichlet allocation (LDA) for topic modeling. Qualitative analysis. Sentiment analysis. | 1,963,285 English tweets related to COVID-19, collected from 23 January to 7 March 2020. | Investigate public discourse from social media network, identify topics, themes, emotional reactions, and sentiment changes during COVID-19 outbreak, providing insights for real-time surveillance and targeted interventions. |
Table 8.
Top 10 most frequent words in keywords plus.
| Words | Occurrences |
|---|---|
| social media | 69 |
| sentiment analysis | 49 |
| 49 | |
| impact | 43 |
| information | 29 |
| health | 28 |
| classification | 24 |
| media | 22 |
| COVID-19 | 21 |
| model | 19 |
Table 9.
Top 10 most frequent words in authors’ keywords.
| Words | Occurrences |
|---|---|
| sentiment analysis | 426 |
| COVID-19 | 401 |
| 159 | |
| social media | 142 |
| machine learning | 75 |
| natural language processing | 71 |
| topic modeling | 53 |
| deep learning | 46 |
| coronavirus | 45 |
| pandemic | 42 |
Table 10.
Top 10 most frequent bigrams in abstracts and titles.
| Bigrams in Abstracts | Occurrences | Bigrams in Titles | Occurrences |
|---|---|---|---|
| sentiment analysis | 633 | sentiment analysis | 190 |
| social media | 553 | COVID-pandemic | 133 |
| COVID-pandemic | 424 | social media | 85 |
| public health | 186 | machine learning | 34 |
| machine learning | 160 | twitter data | 34 |
| natural language | 115 | deep learning | 32 |
| topic modeling | 102 | COVID-vaccines | 25 |
| COVID-vaccines | 101 | COVID-vaccine | 24 |
| language processing | 100 | public sentiment | 24 |
| public opinion | 99 | topic modeling | 23 |
Table 11.
Top 10 most frequent trigrams in abstracts and titles.
| Trigrams in Abstracts | Occurrences | Trigrams in Titles | Occurrences |
|---|---|---|---|
| natural language processing | 100 | natural language processing | 16 |
| social media platforms | 61 | social media data | 14 |
| latent dirichlet allocation | 56 | twitter sentiment analysis | 12 |
| coronavirus disease COVID | 48 | COVID-sentiment analysis | 6 |
| support vector machine | 36 | deep learning model | 6 |
| language processing nlp | 35 | text mining approach | 6 |
| social media data | 32 | COVID-vaccine hesitancy | 5 |
| world health organization | 32 | sentiment analysis approach | 5 |
| dirichlet allocation lda | 27 | social media sentiment | 5 |
| machine learning models | 25 | aspect-based sentiment analysis | 4 |
Disclaimer/Publisher’s Note: The statements, opinions and data contained in all publications are solely those of the individual author(s) and contributor(s) and not of MDPI and/or the editor(s). MDPI and/or the editor(s) disclaim responsibility for any injury to people or property resulting from any ideas, methods, instructions or products referred to in the content. |
© 2023 by the authors. Licensee MDPI, Basel, Switzerland. This article is an open access article distributed under the terms and conditions of the Creative Commons Attribution (CC BY) license (https://creativecommons.org/licenses/by/4.0/).
Share and Cite
MDPI and ACS Style
Sandu, A.; Cotfas, L.-A.; Delcea, C.; Crăciun, L.; Molănescu, A.G. Sentiment Analysis in the Age of COVID-19: A Bibliometric Perspective. Information 2023, 14, 659. https://doi.org/10.3390/info14120659
AMA Style
Sandu A, Cotfas L-A, Delcea C, Crăciun L, Molănescu AG. Sentiment Analysis in the Age of COVID-19: A Bibliometric Perspective. Information. 2023; 14(12):659. https://doi.org/10.3390/info14120659
Chicago/Turabian StyleSandu, Andra, Liviu-Adrian Cotfas, Camelia Delcea, Liliana Crăciun, and Anca Gabriela Molănescu. 2023. "Sentiment Analysis in the Age of COVID-19: A Bibliometric Perspective" Information 14, no. 12: 659. https://doi.org/10.3390/info14120659
Note that from the first issue of 2016, this journal uses article numbers instead of page numbers. See further details here.