Abstract
Advances in image analysis and deep learning technologies have expanded the use of floor plans, traditionally used for sales and rentals, to include 3D reconstruction and automated design. However, a typical floor plan does not provide detailed information, such as the type and number of outlets and locations affecting the placement of furniture and appliances. Electrical plans, providing details on electrical installations, are intricate due to overlapping symbols and lines and remain unutilized as house manufacturers independently manage them. This paper proposes an analysis method that extracts the house structure, room semantics, connectivities, and specifics of wall and ceiling sockets from electrical plans, achieving robustness to noise and overlaps by leveraging the unique features of symbols and lines. The experiments using 544 electrical plans show that our method achieved better accuracy (+3.6 pt) for recognizing room structures than the state-of-the-art method, 87.2% in identifying room semantics and 97.7% in detecting sockets.
1. Introduction
In recent years, advances in image analysis and deep learning technologies have expanded the potential applications of floor plans, enabling tasks such as the extraction of structural information [1] and the generation of floor plans [2]. With such digitized and extracted information, we can make floor plan databases searchable and improve their accessibility [3,4], which is beneficial for house designers, architects, and interior planners, as well as real estate agents and customers. In addition, if floor plans contain the location and types of wall and ceiling sockets, and if we can extract such information, they will become more usable in various applications, e.g., we may enjoy designing furniture and appliance placement on the floor plan, based on the socket locations and types. Such a floor plan with wall and ceiling sockets is called an electrical equipment installation plan, or electrical plan for simplicity. Generally, the architects who design and build houses retain such information as CAD data. However, it may sometimes happen that only copied images of the floor plans are available after those houses are built due to copyright or some other issues. Therefore, the structural, semantic, and electric equipment information in the original CAD data has been lost or unavailable, although there is a certain need for leveraging such information. It is desirable to detect as much information as possible from images. However, electrical plans also contain much information, e.g., designer names, building materials, fire prevention specifications, and exterior wall color schemes, that is unnecessary for the abovementioned applications. Moreover, many symbols and lines are used to represent the sockets and wiring among them, and they often overlap with each other in the limited space. These features compromise recognition algorithms, and, consequently, applying the existing floor plan recognition methods [1] that have been designed for general, simple floor plan images is not straightforward.
This paper proposes a new method to analyze an electrical plan. The method focuses on the characteristics of symbols and lines to extract and distinguish the objects in the plan and complements missing parts to achieve robustness to noises and overlaps. It can extract room semantics inferred by room names and wall and ceiling socket types and locations, which have not been considered in the existing floor plan analysis techniques, as well as the room structure, which consists of room regions, doors, windows, walls, and room connectivity.
The method first extracts the outer and inner walls from a given electrical plan image using the morphological and Hough transforms. It then extracts the doors’ positions from the walls’ arrangement and the unevenness on the walls, which are less affected by other symbols and lines. Furthermore, it estimates each room region from the door and wall positions and the room connectivity. After that, the method extracts the room names, such as “children’s room” and “bedroom”, by extracting the strings from the electrical plan and estimating the corresponding rooms’ names from their positions on the image. Finally, it detects socket symbols using a well-known deep learning object recognition method (YOLO v8) and determines to which room each detected symbol belongs from its position in the image. Specifically, in the second and third steps, we have used an existing floor plan analysis method using deep learning [5] and input its output into our computer-vision-oriented approach to detect a wider variety of door types while suppressing false positives. We also infer the room names, which OCR cannot identify, from the already-detected information, such as the room connectivity and room size. The experiments using 544 electrical plans show that our method can achieve better accuracy (+3.6%) for the recognition of room structures than the state-of-the-art method and can recognize room semantics and sockets with reasonable accuracy.
The contributions of this paper are summarized as follows:
- We propose a method to handle electrical plan images, which are often chaotic with too much information in limited spaces. Due to this feature, our method outperforms the existing methods regarding recognition accuracy.
- The method can also extract semantic information, such as room names, wall and ceiling socket locations and types, and the room structure (walls, doors, and room regions).
- We have conducted experiments using real 544 electrical plans provided by one of the top house builders in Japan and confirmed the accuracy and efficacy of the method.
2. Related Work
2.1. Floor Plan Image Analysis and Recognition
Many approaches have detected and recognized components, such as texts, walls, symbols, and others in floor plan images.
As for text recognition, Fletcher and Kasturi [6] present an automatic string separation algorithm on document images that do not depend on font sizes and orientation by grouping black pixels and applying the Hough transform. Ahmed et al. [7] propose a method to extract character strings contained in floor plans by eliminating walls and line segment smearing. Ravagli et al. [8] combine several methods, including recent approaches leveraging convolutional neural networks, and outperform traditional text detection methods.
Many approaches have been designed to address the problem of extracting structural information, such as walls, doors, and windows, from floor plans to generate 3D floor plans and corresponding CAD files and some other purposes. Ah-Soon y Tombre [9] uses segmentation, vectorization, arc detection, and loop detection techniques to detect doors, windows, and walls from floor plans. de las Heras et al. [10] propose a method focusing on wall detection using object detection and attribute estimation techniques. The approach by Macé et al. [11] first recognizes walls using the conventional Hough transform combined with image vectorization and doors using arc extraction. Then, it detects rooms from floor plans by recursively decomposing the image until it obtains rectangular room areas. Ahmed et al. [12] propose a method to mitigate the negative impact of unnecessary information on room detection by identifying structural information like walls and doors and semantic information like room names and areas and removing components outside of the outer walls. Ahmed et al. [13] propose a method that takes similar approaches to identify structural information and semantic information, and it further applies OCR to the semantic information to annotate the room semantics automatically. The method by de las Heras et al. [14] recognizes room boundaries using a statistical patch-based segmentation approach and locates rooms using structural pattern recognition techniques that resemble boundary elements as a graph. Lam et al. [15] try to estimate room connectivity from detected room shapes, texts, and doors using SURF feature matching.
Most of the above methods rely on implicit drawing rules, e.g., walls should be drawn by thick black horizontal and vertical lines, and use those features to recognize the objects. They also rely on image processing algorithms, such as the morphology Hough transform. However, such rules are not always satisfied; for example, walls are often curved and drawn with diagonal lines. To address the issues, recent approaches leverage machine learning. Liu et al. [16] propose a method to extract wall and door segments using a CNN and estimate room regions based on the segments. Dodge et al. [1] propose fully convolutional networks (FCNs) for wall extraction on lower-resolution floor plan images than standard architectural documents. Ziran y Marinai [17] uses deep neural networks to recognize furniture objects, doors, and windows. Zeng et al. [5] design two DNNs, one for predicting room boundary elements and another for predicting room types. Rezvanifar et al. [18] adopt an object detection framework based on You Only Look Once (YOLO) to detect architectural symbols even with heavy occlusion and clutter. Lu et al. [19] present a new framework for parsing floor plans of rural residences that combines semantic neural networks with room segmentation. Kim et al. [20] propose a robust model to recognize rooms and openings surrounded by obscure patterns, including superimposed graphics and irregular notations. They use a conditional generative adversarial network to integrate various plan view formats into a unified and concise style to convert from raster to vector easily. de Jong [21] proposes multi-scale floor plan recognition and a 3D reconstruction method, which can be adapted for multi-unit floor plans describing entire buildings. Lv et al. [22] propose an automatic framework that accurately recognizes the room’s structure, type, and size. They use deep segmentation and detection networks to extract room structural information and use the key points detection network and cluster analysis to calculate the scales of rooms.
2.2. Our Contributions
Our approach differs from the existing floor plan analysis techniques in Section 2 in the following points. Firstly, it can recognize the structural components (rooms, walls, windows, and doors) and sockets on walls and ceilings in electrical plans. These plans are usually more complicated and chaotic than normal floor plans as they include a lot of similar symbols, wirings, lines, and texts associated with them. Many existing methods have focused on floor plans where door features are visible and text is legible, making them less applicable to electrical floor plans where noise obscures door features and text strings are not extractable. Therefore, our proposed approach complements by inferring information that such methods cannot detect using relatively robust features, such as wall arrangements and room sizes. Secondly, we have conducted comparative experiments with the state-of-the-art method using 544 real houses’ floor plan data in cooperation with a well-known large house builder in Japan. Our method achieved better (+3.6%) or similar recognition accuracy than the state-of-the-art method and could detect additional objects (wall and ceiling sockets) that could not be detected using the existing methods.
3. Method Overview
3.1. Procedure
In this paper, for a given floor plan image, we obtain structural information, semantic information, and socket information. The structural information consists of doors, windows, walls, and room connectivity, and the semantic information indicates room names. The socket information is the locations and types of wall and ceiling sockets for general/special-purpose electrical outlets, TVs, phones, and lights. Electrical plans contain much information, and they often overlap with each other in the limited space. Therefore, fine features such as doors and room names may be obscured by other information or noise and may not be visible. Hence, in our proposed method, in addition to capturing existing vision characteristics to extract the above information, we simultaneously employ image processing techniques that infer complementary information from robust features, such as wall arrangements and room sizes, which are less susceptible to noise.
Figure 1 shows the procedure of our proposed method.
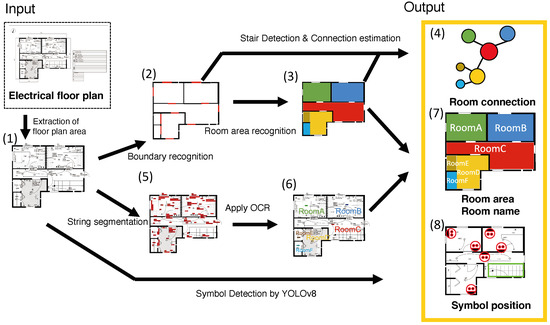
Figure 1.
Method overview:(1) extracted floor plan area; (2) room boundary, black represents walls, while red represents doors; (3) detected rooms painted in different colors; (4) extracted room connectivity; (5) extracted string painted in red; (6) identified room name; (7) associated room names and rooms; (8) detected symbol.
In step (1), it firstly crops the electrical plan image to obtain the floor plan area, which corresponds to the house floor, to remove unnecessary information outside the house. In this step, we utilize the fact that the floor plan area is surrounded by the outer wall, which is the thickest and darkest line. Therefore, we extract the thick and dark lines using morphological transformations to isolate the floor plan area. From the floor plan area extracted in step (1), it recognizes the structural information (rooms, walls, doors, and room connectivity) based on the positions of walls, doors, and windows through steps (2) to (4). More concretely, in step (2), it extracts walls, doors, and windows from the floor plan area extracted in step (1), assuming that a room is a region surrounded by walls, doors, and windows. Specifically, the designer depicts the walls as thicker and darker than others. Hence, we apply morphological transformations to isolate the walls. However, doors and windows use specific symbols (see Figure 2a) in images.
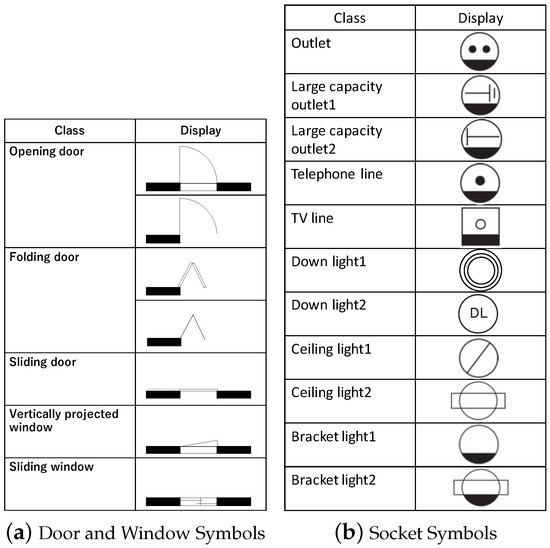
Figure 2.
Symbols in electrical plan.
To cope with this issue, we designed a technique to integrate the results of object detection techniques via deep learning based on descriptive features with the result of an interference technique using the wall arrangement. In step (3), the proposed method recognizes each room based on the region surrounded by walls, doors, and windows. In step (4), since doors connect rooms, it recognizes the room connectivity from the location relationship of doors and rooms.
In step (5), the method removes unnecessary objects such as lines and walls from the image and then identifies strings based on the distribution of sizes of the remaining objects and their arrangement, considering that strings consist of sequences of characters and characters are the largest in terms of number among the small objects. In step (6), OCR is applied to the extracted character lines to obtain the room names. Then, recognition errors are corrected based on the edit distance from the prepared list of potential room names. In this context, there may be missed detection and rooms without a name. However, considering the relationship between the room role, its name, and the room’s structure, we infer the room name using the room’s characteristics, such as its area size and connections with other rooms. In step (7), the method finally labels the room name to each room recognized in (3) based on the positional relationship. Finally, in step (8), to obtain socket information, we utilize YOLOv8, a deep learning-based object detection method, to extract socket symbols, allowing for adaptation to variations in symbol size, orientation, and details across images. The detectable socket symbols are illustrated in Figure 2b.
3.2. Electrical Plan
The proposed method uses an electrical plan image as an input. We assume that the image has enough resolution to read the texts. Figure 3 shows an electrical plan of a real house.
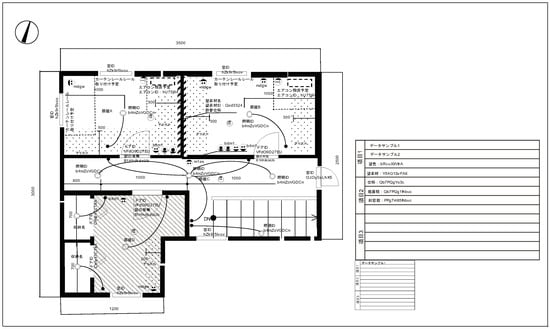
Figure 3.
Electrical plan (anonymized version).
We note that the image has been modified and simplified for anonymity due to the contract with the company that provided the 544 image dataset, and the ones in the dataset contain much more information, such as the walls’ materials and the door type IDs. In addition, the masked tables on the right side initially show the designer’s information, building materials, fire prevention specifications, and the color scheme of the exterior walls. In electrical plans, thick black lines are used for walls; in most cases, room names are written in the corresponding rooms. In addition, doors, windows, and electrical outlets are drawn. Since the space is too limited to accommodate all the symbols, lines, and other objects, they often overlap. Figure 4 shows a case that is difficult to recognize. In this case, double lines represent a sliding door, and the oblique lines and texts overlap. Such overlaps often happen in an electrical plan, which compromises the recognition algorithm.
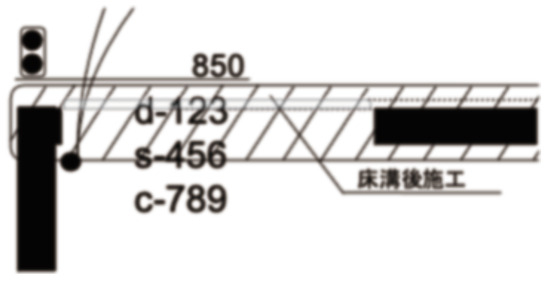
Figure 4.
Door window example.
4. Design Details
This section describes the proposed method for extracting structural, semantic, and socket information from electrical plan images.
4.1. Identifying Floor Plan Area
An electrical plan contains extra information such as the designer’s name, building materials, color schemes, and floor plan and socket information. The floor plan information and socket information are drawn inside the floor plan area, and others are outside, as seen in Figure 3. Therefore, we need to extract the floor plan area. Generally, the floor plan area boundary is the exterior walls drawn with the thickest black line. Using this feature, we extract the exterior walls based on morphological transformation [23]. Specifically, we first perform grayscaling and binarization on the image and then continue shrinking the image until the lines except the exterior walls disappear. After that, we dilate the image to its original size so that we can extract the exterior walls. Finally, the smallest rectangle containing all the remaining exterior walls is detected and regarded as a floor plan area. Figure 5 shows the result of morphology transformation application to Figure 3.
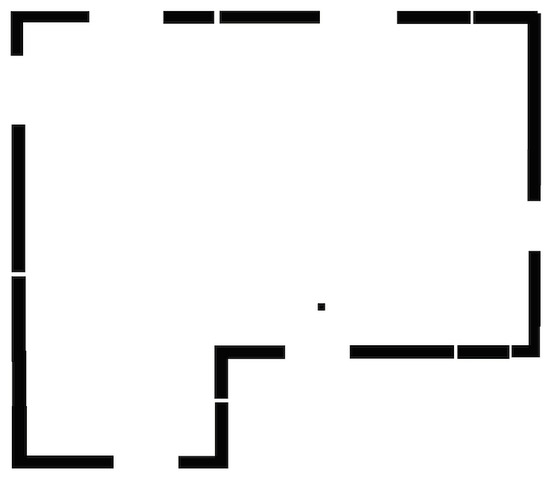
Figure 5.
Exterior wall extraction.
4.2. Room Recognition
For simplicity, in this paper, every indoor space in a house is called a room, even if it is a corridor or a storage space. Since the shape of a room is not limited to a rectangle, a rectangle detection method cannot be applied to find rooms. In addition, a room is surrounded by different parts, like interior/exterior walls, doors, and windows, meaning that a room boundary does not consist of a single line type. Therefore, the contour extraction method does not often work. Here, we take the following steps to extract rooms: (1) recognize the exterior walls, interior walls, windows, and doors independently; (2) form a single boundary by connecting different types of lines; and finally (3) detect each room region.
4.2.1. Exterior and Interior Walls
As seen, exterior and interior walls are drawn as thicker black lines than other elements. Some other objects look similar to those walls, but such objects are usually small objects that exist outside the floor plan area. Therefore, we extract the walls based on morphological transformation as in Section 4.1 and filter out non-wall elements based on their sizes and locations.
Firstly, we remove thin lines and small objects from the electrical plan via morphological transformation. Figure 6a shows the application result of the morphological transformation to the image in Figure 3.
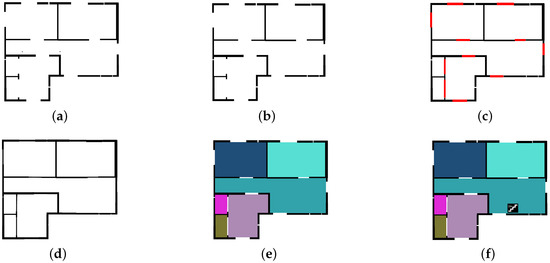
Figure 6.
Illustrative example of room recognition: (a) exterior and interior wall detection; (b) noise reduction; (c) door and window detection, where walls are painted black, while doors and windows are painted red.; (d) black lines for room detection; (e) room detection, where each room is painted in a different color; (f) stair detection.
Since lines for interior walls are not as thick as those for exterior walls, keeping the interior walls keeps some non-wall objects, such as characters, lines, and thick parts of symbols, as shown in Figure 6a. Those objects outside exterior walls can easily be eliminated based on their locations. Meanwhile, those inside the floor plan area should be detected by clustering pixels adjacent to each other and assessing the sizes of the bounding boxes. Figure 6b shows walls obtained by removing those non-wall objects from Figure 6a.
Figure 6b is still just an image with thin and thick lines, and we apply line segment detection to recognize the exterior and interior walls. Firstly, we apply the Canny method to the image to detect edges with just interior and exterior walls and then a Line Segment Detector (LSD, [24]) to detect line segments. Then, we pick up two parallel line segments with a common x-coordinate or a y-coordinate. Considering that thick black lines represent inner and outer walls, we can consider the area between the two line segments with the same x-coordinate or y-coordinate to be the wall if the black density of the area is sufficiently high. Therefore, we can recognize a wall that satisfies the above conditions from the detected two line segments. Assuming that the two lines are from the same wall, we obtain the wall’s thickness, angle, and coordinates. We note that some convexity may correspond to a door or window on the wall. This information is recorded for further analysis, as explained in the following section.
4.2.2. Window and Door
An electrical plan includes symbols, characters, and other objects drawn with thin lines, which often overlap. This may weaken the visual features, and conventional object detection methods relying on visual features may not work for door and window detection.
Our basic idea is to leverage the general experience that doors and windows are usually located between walls, and we may find them as blank spaces between the walls. Meanwhile, such a rule is not always functional due to various noises. Consequently, we take an approach to integrate the advantages of both object detection and rule-based detection.
From a preliminary experiment, we found that a window or door is one of the following:
- Blank space between two walls with equal thicknesses in a straight line;
- Blank space between a wall and a doorframe (a ridge on a wall that is found by line segment detection);
- Blank space between doorframes.
Our method seeks the above spaces based on the walls obtained in Section 4.2.1. Then, it recognizes the door and window objects using an object detection method based on their visual features. This paper uses the object detection method proposed by [5]. This combination results in fewer false negative cases.
Reducing false negatives leads to less misdetection, while false positives are increased. To reduce the false positives, we have analyzed those cases and designed rules to detect them. Firstly, in false positive cases, doors are often crossed. Such a case can easily be found by checking the intersection of two doors. Once one of two doors is found as a false positive object, we must determine which door should be removed. In this case, we remove the one found as a blank space mentioned above and believe the visual-feature-based object detection, as the latter causes fewer false positives. Secondly, there may be long doors, and we remove them by limiting the maximum length. We present the definition of the threshold for the maximum length of doors used in our proposed method below.
In the above equation, D represents the set of doors, and denotes the door length i. We consider the distribution of detected door lengths and account for the presence of double doors, setting the threshold as twice the average. To illustrate, we show a door/window detection result, including some false positives in Figure 7, where the walls are black, the doors and windows are white, and each recognized room is differently colored.
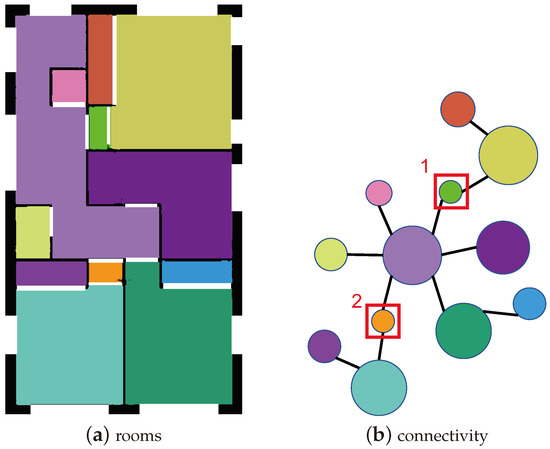
Figure 7.
False detection of doors and corrections. The rooms are painted in different colors, with the same room being painted the same color in both (a) and (b). Rooms 1 and 2 in (b) are errors caused by misidentifying doors.
We can see two small rooms with orange and light green colors, each with two doors. Figure 7b shows a room connectivity graph where circle sizes represent room sizes. This is generated by the room connectivity extraction method, which will be described in Section 4.3. Considering the role of these rooms, which is to connect large rooms, it is unnatural for such short “corridors” (we call them “rooms” in this paper) to have two doors. Therefore, we set a rule to remove such a door based on the number of adjacent rooms, the room size, and the connected walls. Figure 6c shows the result of window and door detection where they are colored red.
4.2.3. Room Region
4.3. Finding Room Connectivity
We also analyze how rooms are connected. Since doors and stairs connect rooms, we may estimate room connections based on the positional relations of rooms and doors. However, in our dataset and probably in other 2D floor plan data, each floor is illustrated separately, and we have to find the connection of floors based on the stairs. A stair is illustrated by a black circle with an arrow, a lattice pattern, and “UP”/“DN” characters for up/downstairs, as shown in Figure 8. We apply circle and line segment detection using the Hough transform to find a black circle and an arrow. Then, we find the strings UP or DN using the string extraction method described in Section 4.4. Finally, we connect two rooms where the UP and DN stairs are located.
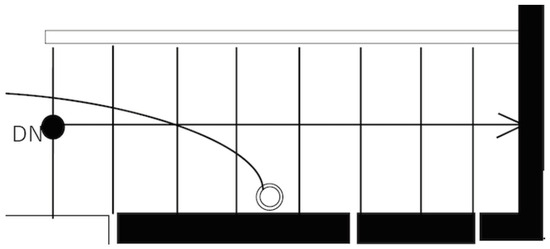
Figure 8.
Example of a Staircase.
4.4. Room Name Identification
Some room names are written in the electrical plan, but extracting the room names is not straightforward due to many line segments and other strings. They also overlap each other, which makes the problem harder. Therefore, in addition to the string extraction, we identify the room name using the structural information of the room, such as the region size, number of adjacent rooms, adjacent room name, and room types.
4.4.1. String Detection, OCR, and List Matching
Character recognition errors are likely to happen even if we can identify the corresponding regions. Furthermore, most of the characters and words in an electrical plan are not for room names. Therefore, we determine whether a detected character string is a room name or not, and if it is a room name, we identify its association with a room region. For this purpose, our method removes non-character elements and filters the remaining elements by sizes, aspect ratios, and black densities to extract characters based on the method by [7]. In this study, we introduce the following thresholds: the maximum area , the upper and lower limits of the ratio and , and the threshold for the maximum vertical and horizontal sizes .
In the above equation, E represents the set of elements, and and denote the width and height of element i, respectively. Then, the method extracts each character string region based on the vertical and horizontal alignment of the characters and recognizes characters using OCR (Optical Character Recognition/Reader) [25]. Finally, the method calculates the edit distance between the valid room names in a prepared list and the character string to determine whether or not it is a room name.
4.4.2. Inference from Structural Information
Some rooms’ names cannot be recognized by the abovementioned technique due to noise, the lack of some characters, and several other reasons. However, we may infer a room name based on the room size and the adjacent room information, such as the number of rooms, name, and room type. For example, a bathroom is often adjacent to a dressing room, a hall is adjacent to many rooms, and a storage room is smaller than a bedroom. Therefore, as shown in Figure 9, we estimate the room name based on the above structural features when the character string cannot be detected and recognized.
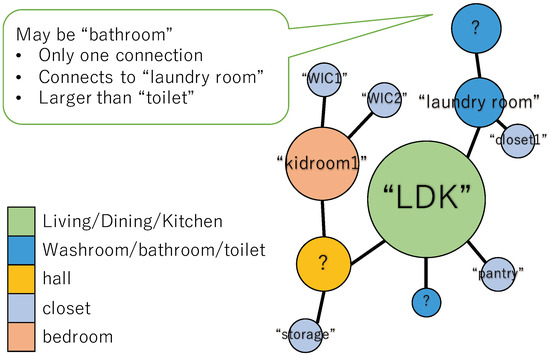
Figure 9.
Example of room name inference.
We use the five types of rooms obtained by applying the method proposed by [5], living/dining/kitchen, washroom/bathroom, hall, closet, and bedroom. More concretely, our method determines the names of each unknown room using the following rules:
- A room whose type is washroom/bathroom can have three names: “toilet”, “bathroom”, and “washroom”. Among them, “washroom” is the only one with a connection with multiple rooms, so the one with a connection with multiple rooms is called “washroom”. A “bathroom” is often connected to a room named “washroom” or “laundry room”, so the largest adjoining room with these names is “ bathroom”. Let the last one be “toilet”.
- Next, a room with only one adjacent room is considered a “closet” or “Western-style room”. (There are two room types in traditional Japanese houses: Japanese and Western style.)”Since there is also a large closet, the rooms smaller than the threshold are named “closet”, the ones that are large and of type closet are “closet”, and the others are “bedroom”.
- Find a room adjacent to more than one room, such as living room and toilet except for closet, and label the name “hall”.
- Name the rest of the rooms “Western-style rooms”.
4.5. Wall and Ceiling Socket Extraction
Finally, we extract wall and ceiling sockets from an electrical plan.
Electrical plans use symbols shown in Figure 2b for wall and ceiling sockets. Our method detects these socket symbols in each room. Figure 10 shows an overview of detecting socket symbols.
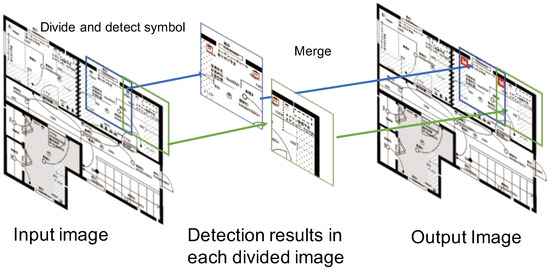
Figure 10.
Socket detection.
Socket symbols have a similar shape (circle) with different designs. For example, outlet symbols are drawn with two black dots and a black bottom in a circle. However, the sizes and shapes are not identical in different images. Moreover, they may overlap with line segments or text. Therefore, simple computer vision techniques like template matching and circle detection are unsuitable. Therefore, our method uses a feature-based deep learning detection method, particularly YOLOv8 by [26], which is robust to size variation and noise. We note that socket symbols are too small to make them inputs to YOLOv8. Therefore, we divide an electrical plan image into multiple cells with different grid patterns so that each symbol can be completely included in at least one cell. We note that one symbol may be detected in multiple cells, that is, in a cell that contains the whole shape of the symbol and another cell that contains only a part of it. To take the correct inference and eliminate the wrong one, we compare the likelihoods obtained by YOLOV8 and choose the better one.
5. Evaluation
This section evaluates whether the proposed method could extract electrical plans’ walls, doors, windows, room regions, names, connectivity, and sockets. We used 544 electrical plans of 356 houses (consisting of multiple floors) provided by a house builder in Japan, dividing them into an 80-20 ratio for training and testing. This dataset comprises scanned electrical floor plans created by multiple designers, exhibiting variations in shading, wall thickness, and smudges or blurs across the floor plans.
5.1. Comparison Method
To confirm the performance of our method in the recognition of walls, doors, windows, room regions, and room connectivity, we compared our results with those of the state-of-the-art method [5]. This method is based on a deep multi-task neural network with two tasks. One learns to recognize room boundaries like walls, doors, and windows, and the other learns to recognize room areas and predict room types. In particular, this method improves the recognition accuracy of room areas and types by introducing an attention mechanism that considers the characteristics of room boundary elements.
5.2. Evaluation Metrics
As evaluation metrics, we used Precision (the ratio of true positives over true and false positives), Recall (the ratio of true positives over true positives and false negatives), and the F-measure (the harmonic mean of Precision and Recall). We also used the IoU (Intersection over Union) for wall and room detection, which is obtained as the ratio of the intersection of two regions over their union. The definition of the metrics we used is shown below.
In the above equation, TP represents the number of true positives, FP represents the number of false positives, and FN represents the number of false negatives. A denotes the bounding boxes of the detection results, while B represents the bounding boxes of the ground truth.
5.3. Wall, Door and Window Detection Result
Table 1 shows the extraction results for the exterior and interior walls introduced in Section 4.2.1, where we regard the areas not detected as false negatives and those falsely detected as false positives.

Table 1.
Wall detection result.
The methods achieved similar performances, that is, the same F-measure. Also, the comparison method achieves a better Precision and IoU, while ours achieves a better Recall. We also investigate the door and window detection results introduced in Section 4.2.2. In this evaluation, we regard that a detected door/window is correct if it separates the rooms correctly and resides in the correct location, allowing up to 40% length error. As shown in Table 2, our method outperforms the comparison method. There are 2187 doors and windows in the test data, and the comparison method detected 2062, of which 125 were false negatives and 335 were false positives. Meanwhile, ours detected 2099, of which 88 were false negatives and 73 were false positives. This indicates that we have fewer false positives and negatives, compared with the state-of-the-art method, due to integrating different methods, (rule-based and feature-based approaches). This is because, in some images, the door features have been lost, and the comparison could not predict the presence of doors. However, our method complements such obscured doors based on our ruleset.
Table 2.
Door and window detection result.
5.4. Room Region Detection and Room Name Identification Results
Next, Table 3 and Table 4 show the room detection and room name identification results, which are described in Section 4.2.3 and Section 4.4, respectively.
Table 3.
Room detection result.
Table 4.
Room name identification result.
The evaluation in Table 3 is based on areas where false positives and false negatives are calculated by falsely detected areas and missing areas, respectively. In this evaluation, we calculate the metrics for each room to ascertain whether the same rooms are spatially segmented and extracted as the same rooms. The comparison method achieved a slightly better Recall than ours. The possible reason for the lower Recall in our method is the higher false positive rate in the wall detection. If the method detects a wall falsely, the detected room region may become smaller than the actual one. However, our method achieved a much better Precision, F-measure, and IoU. Among them, our proposed method achieved a 3.6 pt higher F-measure than the comparative method. Moreover, the number of rooms with an IoU of 0.8 or higher was 876 (82.4%) out of 1062 rooms in the comparison method and 962 (90.6%) in our approach. Our method benefits from high door and window detection accuracy.
As for the name identification, we regard the number of matched room names as true positives, no corresponding room names as false negatives, and different room names detected as false positives. The true room names are names like “master bedroom” or “Western-style room”, as they appear in the electrical plans. If there is a symbol of “toilet” or “bathtub” in a room without a name, the room is regarded as the symbol indicates. The other small rooms without names are regarded as “closet”. As a result, we achieved an F-measure of 87.2%, which is reasonable enough. We note that the walk-in closet’s identification F-measure was low. As shown in Figure 11, the name “walk-in closet” occupies more space, but the area of the corresponding room is not large.
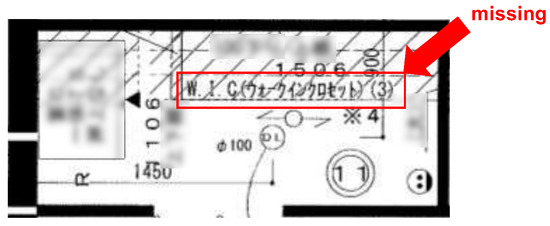
Figure 11.
Case for walk-in closet name.
Therefore, characters, lines, and symbols likely overlap with the name; consequently, the name is prone to be lost.
5.5. Room Connectivity Estimation Result
Table 5 and Table 6 show the results of room connectivity detection and staircase detection shown in Section 4.2.3, respectively.
Table 5.
Room connectivity estimation result.
Table 6.
Stair detection result.
We evaluated the accuracy of the room connection graph using the edit distance from the ground truth. We set the cost of adding, deleting, or replacing a node to 1 and that of deleting or adding an edge to 1. We can see the clear advantage in edit distance.
We also detected 88 staircases out of 115 staircases, meaning 27 staircases were missed and 33 were detected falsely, and we obtained the result shown in Table 6. The major reason for the false negatives is the failure to find the characters UP and DN. The area near the stairs is usually narrow but contains much information. Therefore, the strings UP and DN are likely obscured by other lines and objects. In order to prevent this phenomenon, it would be adequate to utilize prior knowledge and heuristics, such as the number of floors of the house, the location of stairs found on other floors, and the fact that stairs are in halls or near main rooms. For example, even if we cannot detect the strings UP and DN, we can detect a staircase if the plan locates the staircase in the same place as the staircase found on the other floor, and if it is the same staircase found on the upper floor, then it is the lower staircase.
5.6. Wall and Ceiling Socket Detection Result
Table 7.
Wall and ceiling socket detection result.
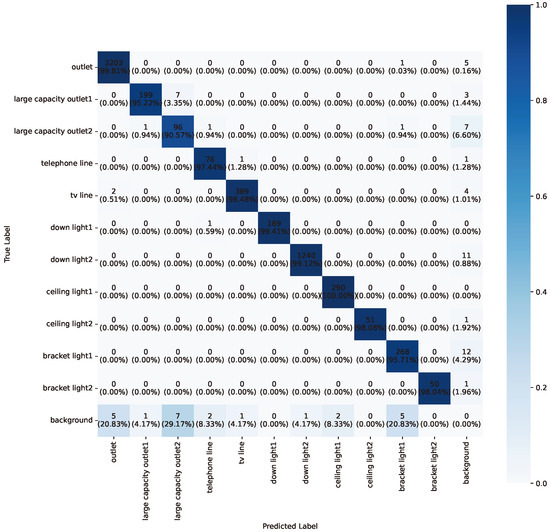
Figure 12.
Confusion matrix for socket detection.
Detection instances with IoU scores greater than 0.5 were considered correctly detected, and the evaluation metrics were computed based on this criterion. This leads to a high accuracy, i.e., a 97.7% F-measure, as shown in the table. In particular, symbols located in the central and spacious areas of the room, such as “downlight” and “ceiling light”, are extracted with a high accuracy. However, symbols situated along the walls, such as “large capacity outlet”, “telephone line”, and “bracket light”, indicated a relatively lower accuracy. Figure 13 shows an example of a missing case.
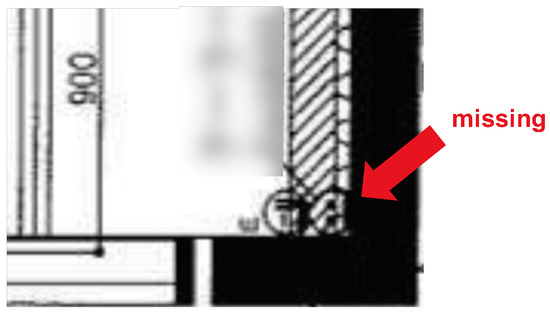
Figure 13.
Case of missing socket symbols.
In this example, many other thin lines or characters overlap with the symbols, and the wall and the symbol are partially combined. Hence, the socket feature cannot be extracted, and a detection omission occurs. To cope with this phenomenon, we may apply YOLO after reducing the noise, as described in Section 4.2.1, or remove the line segments by smearing.
6. Conclusions
This paper proposed a new method to analyze an electrical plan. The method focused on the characteristics of symbols and lines to extract and distinguish the objects in the plan and complements missing parts to achieve robustness to noises and overlaps. It could extract room semantics inferred by room names and wall and ceiling socket types and locations, which have not been considered in the existing floor plan analysis techniques, as well as room structures that consists of room regions, doors, windows, walls, and room connectivity. The experiments using 544 electrical plans show that our method can achieve a better accuracy (+3.6 pt) for the recognition of room structures than the state-of-the-art method and can recognize room semantics and sockets with reasonable accuracy.
In the future, we plan to extract symbols for sinks, stoves, and toilets to use complete indoor information. In addition, we plan to add support for diagonal and curved walls, although we had assumed that the walls would be on a grid in this study.
Author Contributions
Conceptualization, T.M. and H.Y.; methodology, F.T., T.M. and H.Y.; software, F.T.; validation, F.T., T.M. and H.Y.; formal analysis, F.T., T.M. and H.Y.; writing—original draft preparation, F.T.; writing—review and editing, T.M. and H.Y.; visualization, F.T.; supervision, H.Y.; project administration, H.Y.; All authors have read and agreed to the published version of the manuscript.
Funding
This work was partially funded by JST, CREST Grant Number JPMJCR21M5.
Data Availability Statement
The data in this research are not publicly available due to privacy concerns and confidential information shared by collaborating companies.
Acknowledgments
The authors would like to thank funded by JST, CREST Grant Number JPMJCR21M5.
Conflicts of Interest
The authors declare no conflicts of interest.
References
- Dodge, S.; Xu, J.; Stenger, B. Parsing floor plan images. In Proceedings of the International Conference on Machine Vision Applications (MVA), Nagoya, Japan, 8–12 May 2017; pp. 358–361. [Google Scholar]
- Zhu, J.; Zhang, H.; Wen, Y. A new reconstruction method for 3D buildings from 2D vector floor plan. Comput.-Aided Des. Appl. 2014, 11, 704–714. [Google Scholar] [CrossRef]
- Sharma, D.; Gupta, N.; Chattopadhyay, C.; Mehta, S. DANIEL: A Deep Architecture for Automatic Analysis and Retrieval of Building Floor Plans. In Proceedings of the 2017 14th IAPR International Conference on Document Analysis and Recognition (ICDAR), Kyoto, Japan, 9–15 November 2017; Volume 1, pp. 420–425. [Google Scholar] [CrossRef]
- Kato, N.; Yamasaki, T.; Aizawa, K.; Ohama, T. Users’ preference prediction of real estate properties based on floor plan analysis. IEICE Trans. Inf. Syst. 2020, 103, 398–405. [Google Scholar] [CrossRef]
- Zeng, Z.; Li, X.; Yu, Y.K.; Fu, C.W. Deep Floor Plan Recognition Using a Multi-Task Network with Room-Boundary-Guided Attention. In Proceedings of the IEEE International Conference on Computer Vision, Seoul, Republic of Korea, 27 October–2 November 2019; pp. 9096–9104. [Google Scholar]
- Fletcher, L.A.; Kasturi, R. A robust algorithm for text string separation from mixed text/graphics images. IEEE Trans. Pattern Anal. Mach. Intell. 1988, 10, 910–918. [Google Scholar] [CrossRef]
- Ahmed, S.; Weber, M.; Liwicki, M.; Dengel, A. Text/graphics segmentation in architectural floor plans. In Proceedings of the International Conference on Document Analysis and Recognition, Beijing, China, 18–21 September 2011; pp. 734–738. [Google Scholar]
- Ravagli, J.; Ziran, Z.; Marinai, S. Text recognition and classification in floor plan images. In Proceedings of the 2019 International Conference on Document Analysis and Recognition Workshops (ICDARW), Sydney, Australia, 22–25 September 2019; IEEE: Piscataway, NJ, USA, 2019; Volume 1, pp. 1–6. [Google Scholar]
- Ah-Soon, C.; Tombre, K. Variations on the analysis of architectural drawings. In Proceedings of the Fourth International Conference on Document Analysis and Recognition, Ulm, Germany, 18–20 August 1997; IEEE: Piscataway, NJ, USA, 1997; Volume 1, pp. 347–351. [Google Scholar]
- De las Heras, L.P.; Mas, J.; Valveny, E.; Sanchez, G. Wall patch-based segmentation in architectural floorplans. In Proceedings of the International Conference on Document Analysis and Recognition, San Jose, CA, USA, 21–26 August 2011; pp. 1270–1274. [Google Scholar]
- Macé, S.; Locteau, H.; Valveny, E.; Tabbone, S. A system to detect rooms in architectural floor plan images. In Proceedings of the IAPR International Workshop on Document Analysis Systems, Boston, MA, USA, 9–11 June 2010; pp. 167–174. [Google Scholar]
- Ahmed, S.; Liwicki, M.; Weber, M.; Dengel, A. Improved automatic analysis of architectural floor plans. In Proceedings of the International Conference on Document Analysis and Recognition, Beijing, China, 18–21 September 2011; pp. 864–869. [Google Scholar]
- Ahmed, S.; Liwicki, M.; Weber, M.; Dengel, A. Automatic room detection and room labeling from architectural floor plans. In Proceedings of the IAPR International Workshop on Document Analysis Systems, Gold Coast, Australia, 27–29 March 2012; pp. 339–343. [Google Scholar]
- De las Heras, L.P.; Ahmed, S.; Liwicki, M.; Valveny, E.; Sánchez, G. Statistical segmentation and structural recognition for floor plan interpretation. Int. J. Doc. Anal. Recognit. (Ijdar) 2014, 17, 221–237. [Google Scholar] [CrossRef]
- Lam, O.; Dayoub, F.; Schulz, R.; Corke, P. Automated topometric graph generation from floor plan analysis. In Proceedings of the Australasian Conference on Robotics and Automation 2015, Australian Robotics and Automation Association, Australia, Canberra, Australia, 2–4 December 2015; pp. 1–8. [Google Scholar]
- Liu, C.; Wu, J.; Kohli, P.; Furukawa, Y. Raster-to-vector: Revisiting floorplan transformation. In Proceedings of the IEEE International Conference on Computer Vision, Venice, Italy, 22–29 October 2017; pp. 2195–2203. [Google Scholar]
- Ziran, Z.; Marinai, S. Object detection in floor plan images. In Proceedings of the IAPR Workshop on Artificial Neural Networks in Pattern Recognition, Siena, Italy, 19–21 September 2018; Springer: Berlin/Heidelberg, Germany, 2018; pp. 383–394. [Google Scholar]
- Rezvanifar, A.; Cote, M.; Albu, A.B. Symbol spotting on digital architectural floor plans using a deep learning-based framework. In Proceedings of the IEEE/CVF Conference on Computer Vision and Pattern Recognition Workshops, Seattle, WA, USA, 14–19 June 2020; pp. 568–569. [Google Scholar]
- Lu, Z.; Wang, T.; Guo, J.; Meng, W.; Xiao, J.; Zhang, W.; Zhang, X. Data-driven floor plan understanding in rural residential buildings via deep recognition. Inf. Sci. 2021, 567, 58–74. [Google Scholar] [CrossRef]
- Kim, S.; Park, S.; Kim, H.; Yu, K. Deep Floor Plan Analysis for Complicated Drawings Based on Style Transfer. J. Comput. Civ. Eng. 2021, 35, 04020066. [Google Scholar] [CrossRef]
- De Jong, G. Multi-Unit Floor Plan Recognition and Reconstruction. Master’s Thesis, Delft University of Technology, Delft, The Netherlands, 2022. [Google Scholar]
- Lv, X.; Zhao, S.; Yu, X.; Zhao, B. Residential floor plan recognition and reconstruction. In Proceedings of the 2021 IEEE/CVF Conference on Computer Vision and Pattern Recognition (CVPR), Nashville, TN, USA, 20–25 June 2021; pp. 16712–16721. [Google Scholar]
- Huang, C.T.; Mitchell, O.R. A Euclidean distance transform using grayscale morphology decomposition. IEEE Trans. Pattern Anal. Mach. Intell. 1994, 16, 443–448. [Google Scholar] [CrossRef]
- Von Gioi, R.G.; Jakubowicz, J.; Morel, J.M.; Randall, G. LSD: A line segment detector. Image Process. Line 2012, 2, 35–55. [Google Scholar] [CrossRef]
- Smith, R. An overview of the Tesseract OCR engine. In Proceedings of the International Conference on Document Analysis and Recognition, Parana, Brazil, 23–26 September 2007; Volume 2, pp. 629–633. [Google Scholar]
- Jocher, G.; Chaurasia, A.; Qiu, J. YOLO by Ultralytics. 2023.
Disclaimer/Publisher’s Note: The statements, opinions and data contained in all publications are solely those of the individual author(s) and contributor(s) and not of MDPI and/or the editor(s). MDPI and/or the editor(s) disclaim responsibility for any injury to people or property resulting from any ideas, methods, instructions or products referred to in the content. |
© 2024 by the authors. Licensee MDPI, Basel, Switzerland. This article is an open access article distributed under the terms and conditions of the Creative Commons Attribution (CC BY) license (https://creativecommons.org/licenses/by/4.0/).