
Exploiting Properties of Student Networks to Enhance Learning in Distance Education
 , ,
, ,  , and
, and
Abstract
:1. Introduction
- “Deep and meaningful formal learning is supported, as long as one of the three forms of interaction (student-teacher; student-student; student-content) is at a high level. The other two may be offered at minimal levels, or even eliminated, without degrading the educational experience.
- High levels of more than one of the above three modes will likely provide a more satisfying educational experience, although these experiences may not be as cost- or time-effective as less interactive learning sequences.”
2. Related Work
3. Methodology
- Gathering and pre-processing anonymized data.
- Creating networks and computing network metrics.
- Conducting correlation analysis.
- Visualizing results and generating reports.
3.1. Scope and Research Questions
3.2. Participants
3.3. Dataset
- The actions with the indication “discussion created” and “post created” are separately assorted from the log file.
- The “discussion created” actions provide information on the creation of new discussion threads. Each thread is assigned to the participant who created it (student or tutor).
- Each post is assigned to the participant who uploaded it and to the corresponding discussion thread that belongs to.
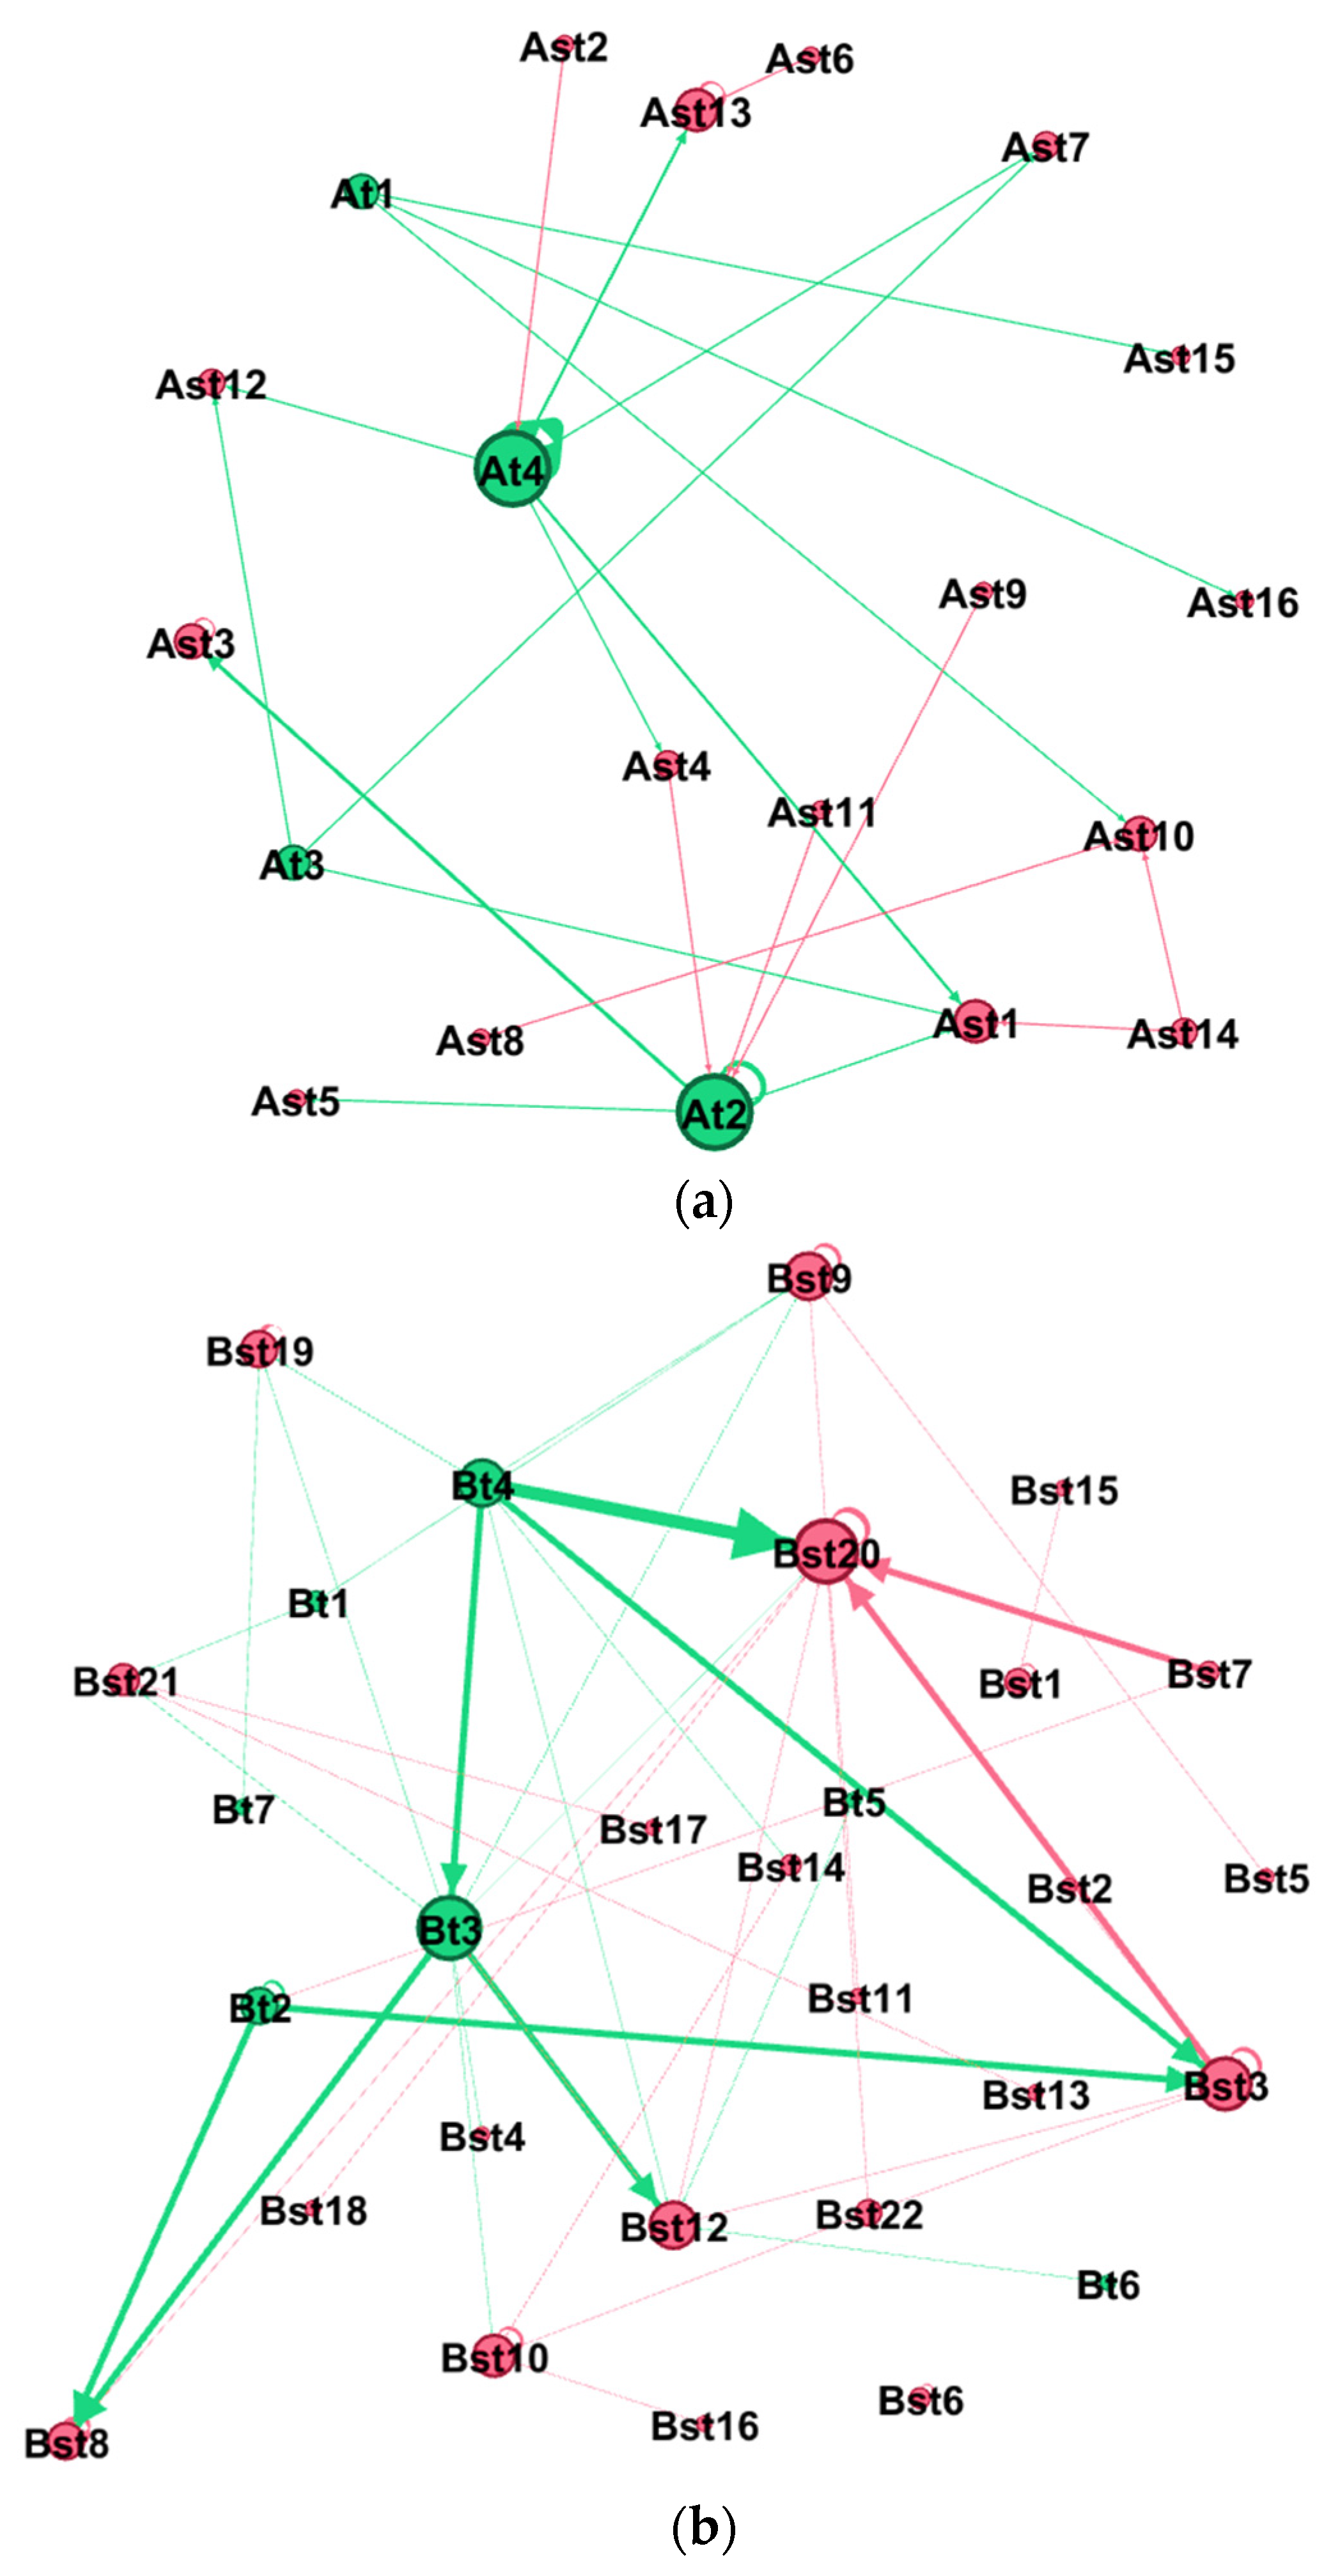
- Each participant is represented as a node.
- An incoming edge to a node represents a reply to a discussion thread this participant has created (i.e., if Ast5 has three incoming edges that then means that three participants had posted in the threads that Ast5 has created).
- An outgoing edge of a node denotes the posts that this specific participant made to other participants’ threads (i.e., if Bst2 has 8 outgoing edges, then that means that Bst2 had replied in the threads that 8 other participants had created).
- A self-loop denotes that the participant who made a post and created a thread replied to his/her original post.
3.4. Metrics and Algorithms
4. Results and Discussion
4.1. Networks Visualizations and Metrics
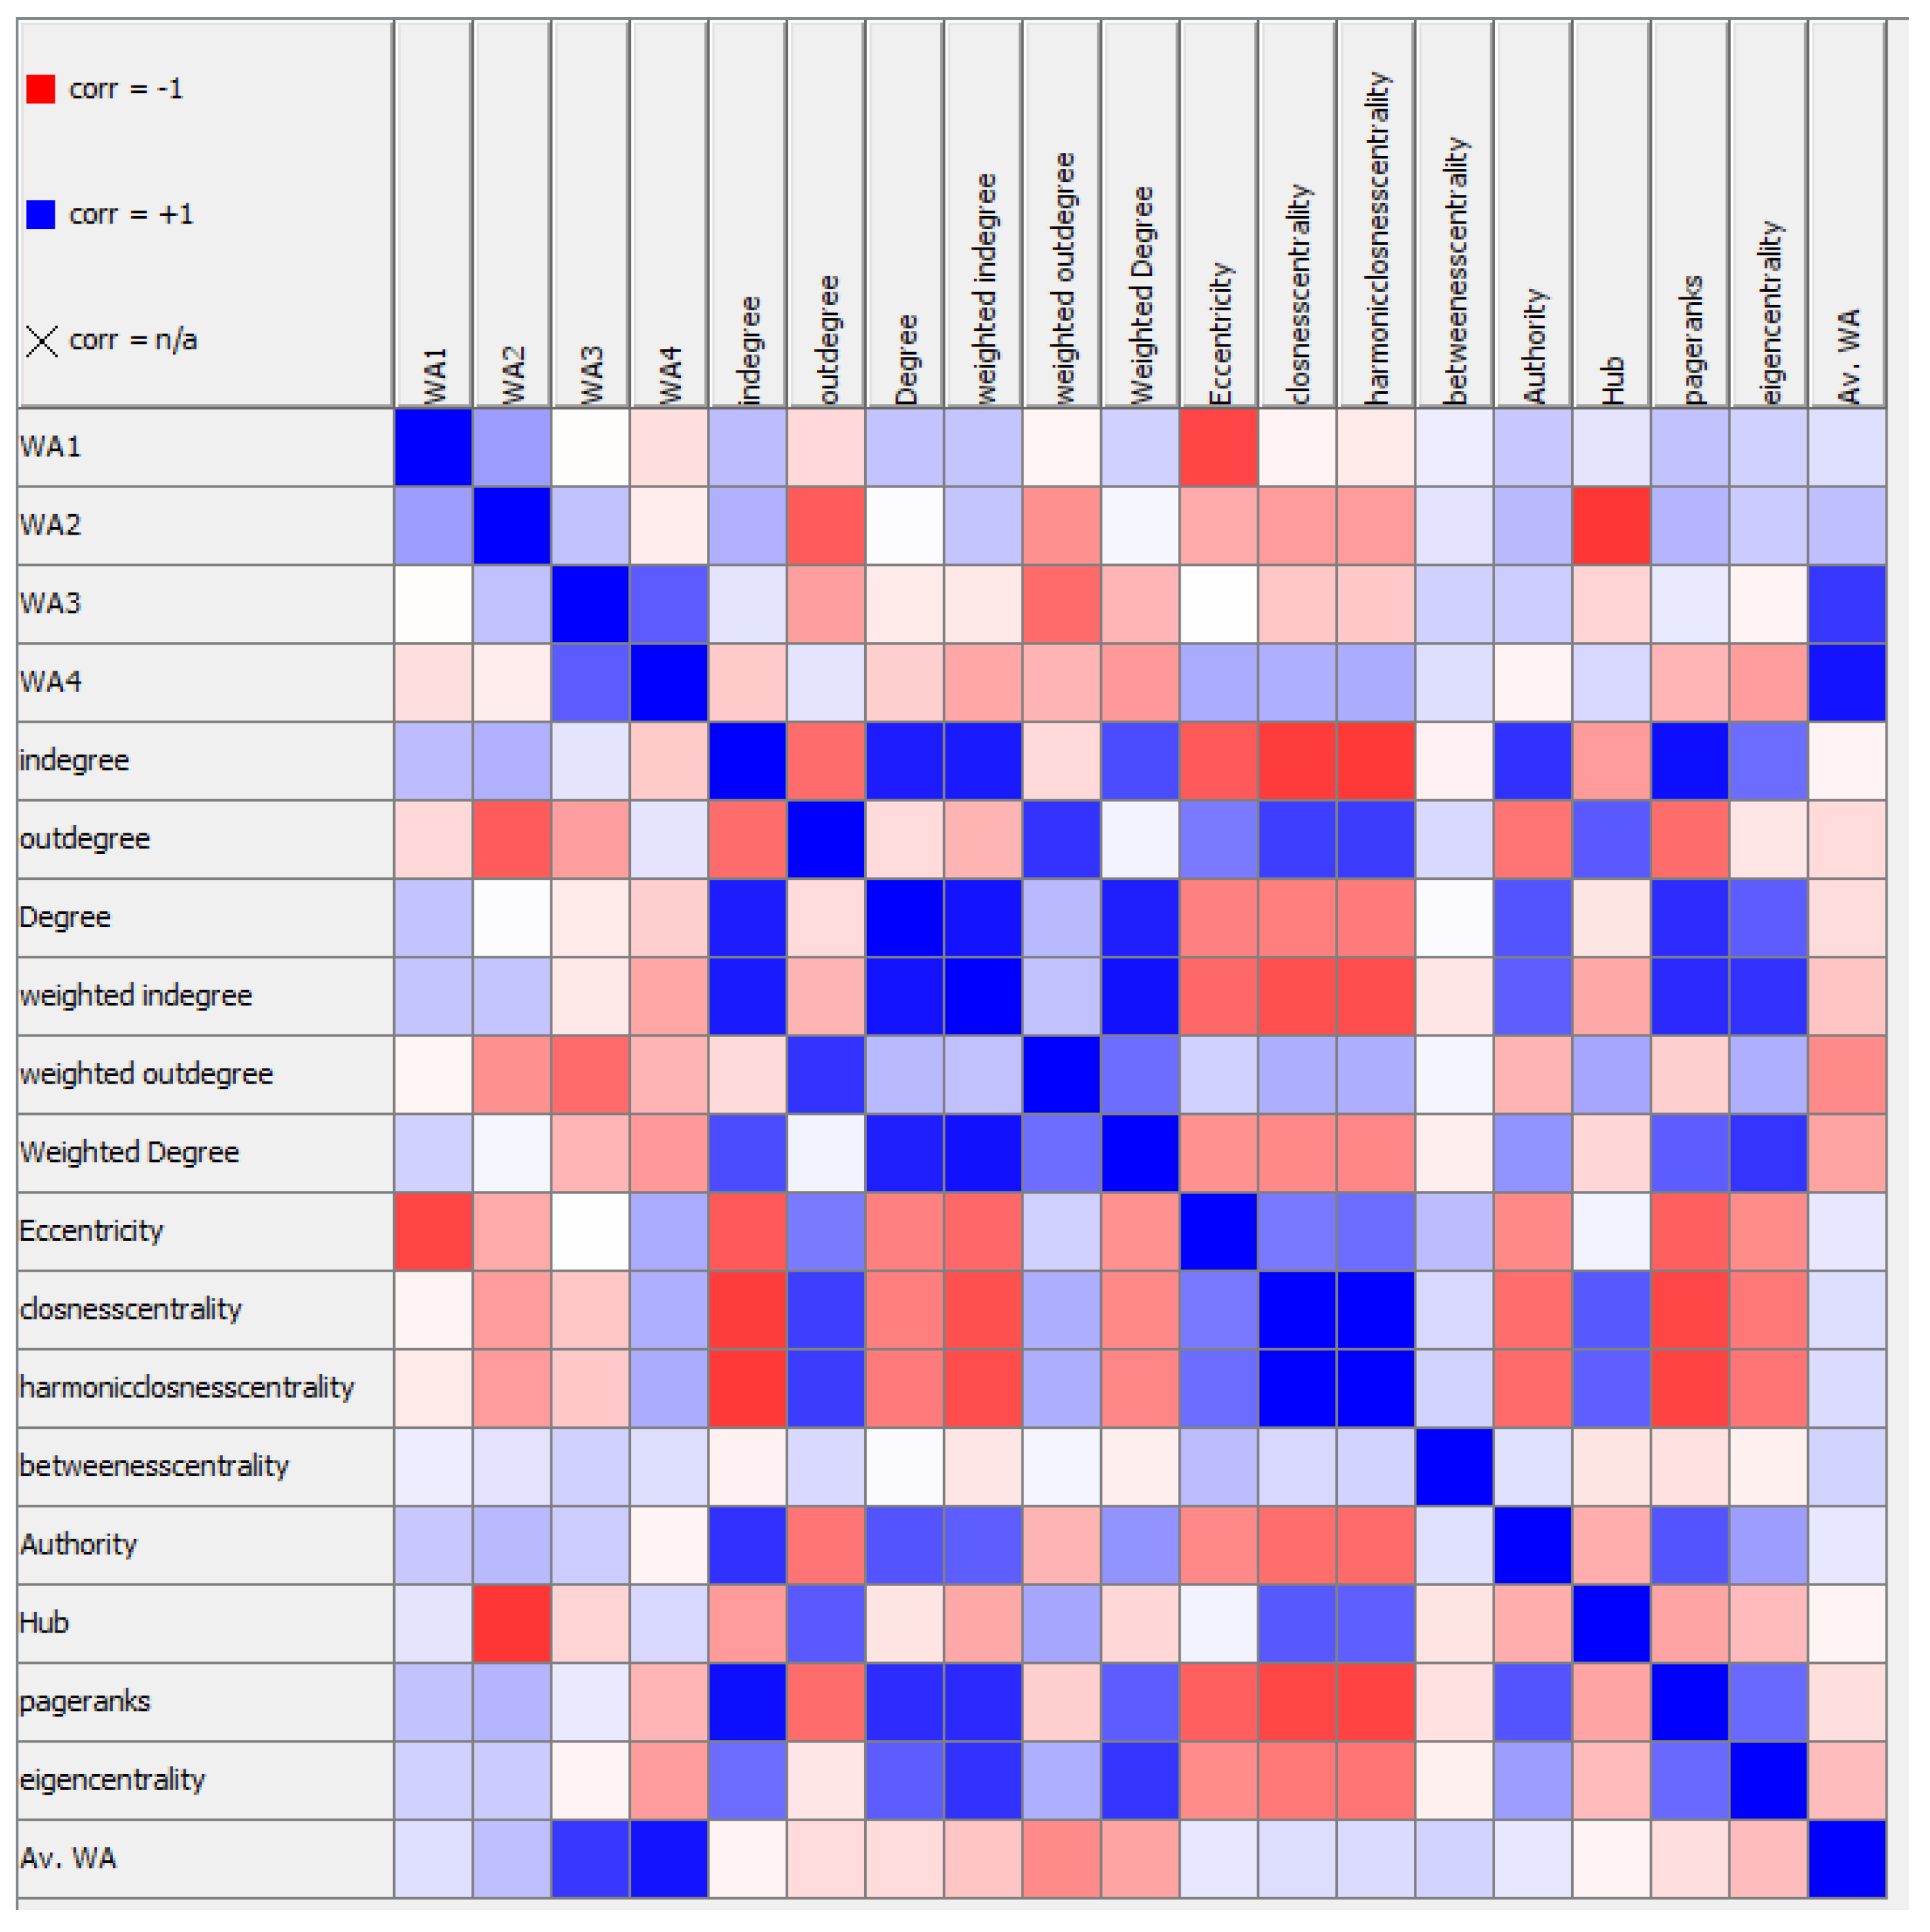
4.2. Correlation Analysis
5. Conclusions
- Feelings of personal relation between the teaching and learning parties promote study pleasure and motivation. Such feelings can be fostered by well-developed self-instructional material and two-way communication at a distance;
- Intellectual pleasure and study motivation are favorable to the attainment of study goals and the use of proper study processes and methods;
- The atmosphere, language, and conventions of friendly conversation favor feelings of personal relations, according to postulate 1;
- Messages given and received in conversational forms are comparatively easily understood and remembered.
Author Contributions
Funding
Institutional Review Board Statement
Data Availability Statement
Conflicts of Interest
Appendix A. Correlation Table
| Course A | |||
| Variable A | Variable B | Correlation Value | p Value |
| WA1 | WA2 | 0.385 | 0.156 |
| WA1 | WA3 | −0.011 | 0.968 |
| WA1 | WA4 | −0.130 | 0.644 |
| WA1 | In-degree | 0.263 | 0.344 |
| WA1 | Out-degree | −0.149 | 0.595 |
| WA1 | Degree | 0.235 | 0.400 |
| WA1 | Weighted In-degree | 0.230 | 0.410 |
| WA1 | Weighted Out-degree | −0.040 | 0.887 |
| WA1 | Weighted Degree | 0.179 | 0.523 |
| WA1 | Eccentricity | −0.730 | 0.002 * |
| WA1 | Closeness centrality | −0.045 | 0.873 |
| WA1 | Harmonic closeness centrality | −0.082 | 0.773 |
| WA1 | Betweenness centrality | 0.071 | 0.800 |
| WA1 | Authority | 0.218 | 0.436 |
| WA1 | Hub | 0.106 | 0.706 |
| WA1 | PageRank | 0.240 | 0.389 |
| WA1 | Eigenvector centrality | 0.179 | 0.523 |
| WA1 | Av. WA | 0.125 | 0.658 |
| WA2 | WA3 | 0.245 | 0.379 |
| WA2 | WA4 | −0.076 | 0.788 |
| WA2 | In-degree | 0.309 | 0.263 |
| WA2 | Out-degree | −0.644 | 0.010 * |
| WA2 | Degree | 0.013 | 0.964 |
| WA2 | Weighted In-degree | 0.231 | 0.406 |
| WA2 | Weighted Out-degree | −0.434 | 0.106 |
| WA2 | Weighted Degree | 0.034 | 0.903 |
| WA2 | Eccentricity | −0.335 | 0.222 |
| WA2 | Closeness centrality | −0.393 | 0.148 |
| WA2 | Harmonic closeness centrality | −0.391 | 0.149 |
| WA2 | Betweenness centrality | 0.110 | 0.696 |
| WA2 | Authority | 0.275 | 0.321 |
| WA2 | Hub | −0.788 | 0.000 * |
| WA2 | PageRank | 0.292 | 0.292 |
| WA2 | Eigenvector centrality | 0.202 | 0.470 |
| WA2 | Av. WA | 0.249 | 0.370 |
| WA3 | WA4 | 0.643 | 0.010 * |
| WA3 | In-degree | 0.108 | 0.703 |
| WA3 | Out-degree | −0.380 | 0.162 |
| WA3 | Degree | −0.083 | 0.770 |
| WA3 | Weighted In-degree | −0.090 | 0.750 |
| WA3 | Weighted Out-degree | −0.583 | 0.023 * |
| WA3 | Weighted Degree | −0.292 | 0.292 |
| WA3 | Eccentricity | −0.005 | 0.986 |
| WA3 | Closeness centrality | −0.222 | 0.427 |
| WA3 | Harmonic closeness centrality | −0.210 | 0.452 |
| WA3 | Betweenness centrality | 0.182 | 0.517 |
| WA3 | Authority | 0.200 | 0.476 |
| WA3 | Hub | −0.170 | 0.544 |
| WA3 | PageRank | 0.081 | 0.775 |
| WA3 | Eigenvector centrality | −0.043 | 0.880 |
| WA3 | Av. WA | 0.783 | 0.001 * |
| WA4 | In-degree | −0.206 | 0.460 |
| WA4 | Out-degree | 0.106 | 0.708 |
| WA4 | Degree | −0.191 | 0.495 |
| WA4 | Weighted In-degree | −0.348 | 0.203 |
| WA4 | Weighted Out-degree | −0.296 | 0.284 |
| WA4 | Weighted Degree | −0.403 | 0.136 |
| WA4 | Eccentricity | 0.332 | 0.226 |
| WA4 | Closeness centrality | 0.315 | 0.253 |
| WA4 | Harmonic closeness centrality | 0.327 | 0.234 |
| WA4 | Betweenness centrality | 0.130 | 0.644 |
| WA4 | Authority | −0.045 | 0.874 |
| WA4 | Hub | 0.159 | 0.572 |
| WA4 | PageRank | −0.291 | 0.293 |
| WA4 | Eigenvector centrality | −0.389 | 0.152 |
| WA4 | Av. WA | 0.927 | 0.000 * |
| In-degree | Out-degree | −0.578 | 0.024 * |
| In-degree | Degree | 0.889 | 0.000 * |
| In-degree | Weighted In-degree | 0.900 | 0.000 * |
| In-degree | Weighted Out-degree | −0.144 | 0.608 |
| In-degree | Weighted Degree | 0.706 | 0.003 * |
| In-degree | Eccentricity | −0.652 | 0.008 * |
| In-degree | Closeness centrality | −0.766 | 0.001 * |
| In-degree | Harmonic closeness centrality | −0.782 | 0.001 * |
| In-degree | Betweenness centrality | −0.055 | 0.845 |
| In-degree | Authority | 0.807 | 0.000 * |
| In-degree | Hub | −0.390 | 0.150 |
| In-degree | PageRank | 0.946 | 0.000 * |
| In-degree | Eigenvector centrality | 0.576 | 0.025 * |
| In-degree | Av. WA | −0.047 | 0.868 |
| Out-degree | Degree | −0.140 | 0.618 |
| Out-degree | Weighted In-degree | −0.296 | 0.284 |
| Out-degree | Weighted Out-degree | 0.801 | 0.000 * |
| Out-degree | Weighted Degree | 0.047 | 0.868 |
| Out-degree | Eccentricity | 0.520 | 0.047 * |
| Out-degree | Closeness centrality | 0.757 | 0.001 * |
| Out-degree | Harmonic closeness centrality | 0.764 | 0.001 * |
| Out-degree | Betweenness centrality | 0.149 | 0.595 |
| Out-degree | Authority | −0.546 | 0.035 * |
| Out-degree | Hub | 0.653 | 0.008 * |
| Out-degree | PageRank | −0.575 | 0.025 * |
| Out-degree | Eigenvector centrality | −0.104 | 0.713 |
| Out-degree | Av. WA | −0.142 | 0.614 |
| Degree | Weighted In-degree | 0.926 | 0.000 * |
| Degree | Weighted Out-degree | 0.274 | 0.322 |
| Degree | Weighted Degree | 0.883 | 0.000 * |
| Degree | Eccentricity | −0.500 | 0.058 |
| Degree | Closeness centrality | −0.504 | 0.055 |
| Degree | Harmonic closeness centrality | −0.520 | 0.047 * |
| Degree | Betweenness centrality | 0.017 | 0.953 |
| Degree | Authority | 0.673 | 0.006 * |
| Degree | Hub | −0.107 | 0.704 |
| Degree | PageRank | 0.826 | 0.000 * |
| Degree | Eigenvector centrality | 0.640 | 0.010 * |
| Degree | Av. WA | −0.137 | 0.627 |
| Weighted In-degree | Weighted Out-degree | 0.242 | 0.385 |
| Weighted In-degree | Weighted Degree | 0.933 | 0.000 * |
| Weighted In-degree | Eccentricity | −0.592 | 0.020 * |
| Weighted In-degree | Closeness centrality | −0.688 | 0.005 * |
| Weighted In-degree | Harmonic closeness centrality | −0.703 | 0.003 * |
| Weighted In-degree | Betweenness centrality | −0.097 | 0.730 |
| Weighted In-degree | Authority | 0.631 | 0.012 * |
| Weighted In-degree | Hub | −0.342 | 0.213 |
| Weighted In-degree | PageRank | 0.837 | 0.000 * |
| Weighted In-degree | Eigenvector centrality | 0.803 | 0.000 * |
| Weighted In-degree | Av. WA | −0.226 | 0.419 |
| Weighted Out-degree | Weighted Degree | 0.574 | 0.025 * |
| Weighted Out-degree | Eccentricity | 0.180 | 0.522 |
| Weighted Out-degree | Closeness centrality | 0.317 | 0.249 |
| Weighted Out-degree | Harmonic closeness centrality | 0.317 | 0.250 |
| Weighted Out-degree | Betweenness centrality | 0.040 | 0.887 |
| Weighted Out-degree | Authority | −0.293 | 0.289 |
| Weighted Out-degree | Hub | 0.350 | 0.200 |
| Weighted Out-degree | PageRank | −0.192 | 0.493 |
| Weighted Out-degree | Eigenvector centrality | 0.315 | 0.252 |
| Weighted Out-degree | Av. WA | −0.457 | 0.086 |
| Weighted Degree | Eccentricity | −0.433 | 0.107 |
| Weighted Degree | Closeness centrality | −0.463 | 0.083 |
| Weighted Degree | Harmonic closeness centrality | −0.476 | 0.073 |
| Weighted Degree | Betweenness centrality | −0.067 | 0.812 |
| Weighted Degree | Authority | 0.423 | 0.116 |
| Weighted Degree | Hub | −0.159 | 0.573 |
| Weighted Degree | PageRank | 0.635 | 0.011 * |
| Weighted Degree | Eigenvector centrality | 0.795 | 0.000 * |
| Weighted Degree | Av. WA | −0.360 | 0.188 |
| Eccentricity | Closeness centrality | 0.527 | 0.044 * |
| Eccentricity | Harmonic closeness centrality | 0.575 | 0.025 * |
| Eccentricity | Betweenness centrality | 0.264 | 0.342 |
| Eccentricity | Authority | −0.467 | 0.079 |
| Eccentricity | Hub | 0.046 | 0.870 |
| Eccentricity | PageRank | −0.626 | 0.013 * |
| Eccentricity | Eigenvector centrality | −0.454 | 0.089 |
| Eccentricity | Av. WA | 0.094 | 0.740 |
| Closeness centrality | Harmonic closeness centrality | 0.998 | 0.000 * |
| Closeness centrality | Betweenness centrality | 0.154 | 0.584 |
| Closeness centrality | Authority | −0.574 | 0.025 * |
| Closeness centrality | Hub | 0.654 | 0.008 * |
| Closeness centrality | PageRank | −0.724 | 0.002 * |
| Closeness centrality | Eigenvector centrality | −0.530 | 0.042 * |
| Closeness centrality | Av. WA | 0.132 | 0.639 |
| Harmonic closeness centrality | Betweenness centrality | 0.176 | 0.531 |
| Harmonic closeness centrality | Authority | −0.583 | 0.023 * |
| Harmonic closeness centrality | Hub | 0.627 | 0.012 * |
| Harmonic closeness centrality | PageRank | −0.741 | 0.002 * |
| Harmonic closeness centrality | Eigenvector centrality | −0.542 | 0.037 * |
| Harmonic closeness centrality | Av. WA | 0.139 | 0.620 |
| Betweenness centrality | Authority | 0.123 | 0.661 |
| Betweenness centrality | Hub | −0.106 | 0.706 |
| Betweenness centrality | PageRank | −0.117 | 0.678 |
| Betweenness centrality | Eigenvector centrality | −0.059 | 0.835 |
| Betweenness centrality | Av. WA | 0.178 | 0.525 |
| Authority | Hub | −0.323 | 0.240 |
| Authority | PageRank | 0.670 | 0.006 * |
| Authority | Eigenvector centrality | 0.383 | 0.159 |
| Authority | Av. WA | 0.092 | 0.743 |
| Hub | PageRank | −0.357 | 0.191 |
| Hub | Eigenvector centrality | −0.266 | 0.337 |
| Hub | Av. WA | −0.045 | 0.873 |
| PageRank | Eigenvector centrality | 0.588 | 0.021 * |
| PageRank | Av. WA | −0.130 | 0.644 |
| Eigenvector centrality | Av. WA | −0.264 | 0.341 |
| * indicates statistically significant correlation. | |||
| Course B—Correlation Table | |||
| Variable A | Variable B | Correlation Value | p Value |
| WA1 | WA2 | 0.596 | 0.003 * |
| WA1 | WA3 | 0.471 | 0.027 * |
| WA1 | In-degree | −0.408 | 0.060 |
| WA1 | Out-degree | 0.152 | 0.501 |
| WA1 | Degree | −0.347 | 0.114 |
| WA1 | Weighted In-degree | −0.393 | 0.070 |
| WA1 | Weighted Out-degree | 0.163 | 0.469 |
| WA1 | Weighted Degree | −0.309 | 0.162 |
| WA1 | Eccentricity | 0.296 | 0.182 |
| WA1 | Closeness centrality | 0.207 | 0.356 |
| WA1 | Harmonic closeness centrality | 0.218 | 0.329 |
| WA1 | Betweenness centrality | 0.154 | 0.493 |
| WA1 | Authority | −0.355 | 0.105 |
| WA1 | Hub | 0.270 | 0.224 |
| WA1 | PageRank | −0.448 | 0.037 * |
| WA1 | Eigenvector centrality | −0.513 | 0.015 * |
| WA1 | Av. WA | 0.731 | 0.000 * |
| WA2 | WA3 | 0.718 | 0.000 * |
| WA2 | In-degree | −0.375 | 0.085 |
| WA2 | Out-degree | 0.164 | 0.466 |
| WA2 | Degree | −0.313 | 0.156 |
| WA2 | Weighted In-degree | −0.345 | 0.116 |
| WA2 | Weighted Out-degree | 0.204 | 0.362 |
| WA2 | Weighted Degree | −0.254 | 0.253 |
| WA2 | Eccentricity | 0.329 | 0.135 |
| WA2 | Closeness centrality | 0.258 | 0.247 |
| WA2 | Harmonic closeness centrality | 0.269 | 0.226 |
| WA2 | Betweenness centrality | 0.151 | 0.503 |
| WA2 | Authority | −0.225 | 0.314 |
| WA2 | Hub | 0.330 | 0.133 |
| WA2 | PageRank | −0.433 | 0.044 * |
| WA2 | Eigenvector centrality | −0.432 | 0.045 * |
| WA2 | Av. WA | 0.914 | 0.000 * |
| WA3 | In-degree | −0.133 | 0.556 |
| WA3 | Out-degree | 0.156 | 0.487 |
| WA3 | Degree | −0.084 | 0.711 |
| WA3 | Weighted In-degree | −0.069 | 0.759 |
| WA3 | Weighted Out-degree | 0.202 | 0.368 |
| WA3 | Weighted Degree | −0.008 | 0.971 |
| WA3 | Eccentricity | 0.194 | 0.386 |
| WA3 | Closeness centrality | 0.215 | 0.336 |
| WA3 | Harmonic closeness centrality | 0.217 | 0.332 |
| WA3 | Betweenness centrality | 0.180 | 0.424 |
| WA3 | Authority | 0.029 | 0.899 |
| WA3 | Hub | 0.291 | 0.189 |
| WA3 | PageRank | −0.153 | 0.496 |
| WA3 | Eigenvector centrality | −0.116 | 0.607 |
| WA3 | Av. WA | 0.900 | 0.000 * |
| In-degree | Out-degree | 0.037 | 0.870 |
| In-degree | Degree | 0.962 | 0.000 * |
| In-degree | Weighted In-degree | 0.964 | 0.000 * |
| In-degree | Weighted Out-degree | 0.121 | 0.591 |
| In-degree | Weighted Degree | 0.896 | 0.000 * |
| In-degree | Eccentricity | −0.463 | 0.030 * |
| In-degree | Closeness centrality | −0.563 | 0.006 * |
| In-degree | Harmonic closeness centrality | −0.568 | 0.006 * |
| In-degree | Betweenness centrality | 0.188 | 0.402 |
| In-degree | Authority | 0.958 | 0.000 * |
| In-degree | Hub | −0.202 | 0.367 |
| In-degree | PageRank | 0.963 | 0.000 * |
| In-degree | Eigenvector centrality | 0.855 | 0.000 * |
| In-degree | Av. WA | −0.325 | 0.140 |
| Out-degree | Degree | 0.307 | 0.165 |
| Out-degree | Weighted In-degree | 0.122 | 0.588 |
| Out-degree | Weighted Out-degree | 0.883 | 0.000 * |
| Out-degree | Weighted Degree | 0.345 | 0.115 |
| Out-degree | Eccentricity | 0.567 | 0.006 * |
| Out-degree | Closeness centrality | 0.394 | 0.069 |
| Out-degree | Harmonic closeness centrality | 0.414 | 0.055 |
| Out-degree | Betweenness centrality | 0.551 | 0.008 * |
| Out-degree | Authority | 0.064 | 0.777 |
| Out-degree | Hub | 0.871 | 0.000 * |
| Out-degree | PageRank | 0.011 | 0.961 |
| Out-degree | Eigenvector centrality | 0.004 | 0.987 |
| Out-degree | Av. WA | 0.182 | 0.417 |
| Degree | Weighted In-degree | 0.951 | 0.000 * |
| Degree | Weighted Out-degree | 0.355 | 0.105 |
| Degree | Weighted Degree | 0.947 | 0.000 * |
| Degree | Eccentricity | −0.287 | 0.196 |
| Degree | Closeness centrality | −0.429 | 0.047 * |
| Degree | Harmonic closeness centrality | −0.429 | 0.046 * |
| Degree | Betweenness centrality | 0.329 | 0.135 |
| Degree | Authority | 0.929 | 0.000 * |
| Degree | Hub | 0.044 | 0.844 |
| Degree | PageRank | 0.920 | 0.000 * |
| Degree | Eigenvector centrality | 0.816 | 0.000 * |
| Degree | Av. WA | −0.260 | 0.243 |
| Weighted In-degree | Weighted Out-degree | 0.263 | 0.238 |
| Weighted In-degree | Weighted Degree | 0.966 | 0.000 * |
| Weighted In-degree | Eccentricity | −0.369 | 0.091 |
| Weighted In-degree | Closeness centrality | −0.432 | 0.045 * |
| Weighted In-degree | Harmonic closeness centrality | −0.438 | 0.042 * |
| Weighted In-degree | Betweenness centrality | 0.181 | 0.420 |
| Weighted In-degree | Authority | 0.935 | 0.000 * |
| Weighted In-degree | Hub | −0.113 | 0.615 |
| Weighted In-degree | PageRank | 0.928 | 0.000 * |
| Weighted In-degree | Eigenvector centrality | 0.909 | 0.000 * |
| Weighted In-degree | Av. WA | −0.278 | 0.210 |
| Weighted Out-degree | Weighted Degree | 0.503 | 0.017 * |
| Weighted Out-degree | Eccentricity | 0.478 | 0.024 * |
| Weighted Out-degree | Closeness centrality | 0.350 | 0.110 |
| Weighted Out-degree | Harmonic closeness centrality | 0.367 | 0.093 |
| Weighted Out-degree | Betweenness centrality | 0.365 | 0.095 |
| Weighted Out-degree | Authority | 0.140 | 0.533 |
| Weighted Out-degree | Hub | 0.727 | 0.000 * |
| Weighted Out-degree | PageRank | 0.027 | 0.904 |
| Weighted Out-degree | Eigenvector centrality | 0.088 | 0.697 |
| Weighted Out-degree | Av. WA | 0.224 | 0.317 |
| Weighted Degree | Eccentricity | −0.203 | 0.365 |
| Weighted Degree | Closeness centrality | −0.293 | 0.185 |
| Weighted Degree | Harmonic closeness centrality | −0.294 | 0.184 |
| Weighted Degree | Betweenness centrality | 0.260 | 0.243 |
| Weighted Degree | Authority | 0.875 | 0.000 * |
| Weighted Degree | Hub | 0.093 | 0.681 |
| Weighted Degree | PageRank | 0.839 | 0.000 * |
| Weighted Degree | Eigenvector centrality | 0.838 | 0.000 * |
| Weighted Degree | Av. WA | −0.189 | 0.399 |
| Eccentricity | Closeness centrality | 0.720 | 0.000 * |
| Eccentricity | Harmonic closeness centrality | 0.759 | 0.000 * |
| Eccentricity | Betweenness centrality | 0.411 | 0.058 |
| Eccentricity | Authority | −0.365 | 0.095 |
| Eccentricity | Hub | 0.708 | 0.000 * |
| Eccentricity | PageRank | −0.400 | 0.065 |
| Eccentricity | Eigenvector centrality | −0.379 | 0.082 |
| Eccentricity | Av. WA | 0.306 | 0.166 |
| Closeness centrality | Harmonic closeness centrality | 0.998 | 0.000 * |
| Closeness centrality | Betweenness centrality | 0.032 | 0.889 |
| Closeness centrality | Authority | −0.492 | 0.020 * |
| Closeness centrality | Hub | 0.566 | 0.006 * |
| Closeness centrality | PageRank | −0.517 | 0.014 * |
| Closeness centrality | Eigenvector centrality | −0.388 | 0.074 |
| Closeness centrality | Av. WA | 0.264 | 0.235 |
| Harmonic closeness centrality | Betweenness centrality | 0.057 | 0.800 |
| Harmonic closeness centrality | Authority | −0.495 | 0.019 * |
| Harmonic closeness centrality | Hub | 0.588 | 0.004 * |
| Harmonic closeness centrality | PageRank | −0.520 | 0.013 * |
| Harmonic closeness centrality | Eigenvector centrality | −0.396 | 0.068 |
| Harmonic closeness centrality | Av. WA | 0.272 | 0.221 |
| Betweenness centrality | Authority | 0.289 | 0.191 |
| Betweenness centrality | Hub | 0.542 | 0.009 * |
| Betweenness centrality | PageRank | 0.190 | 0.396 |
| Betweenness centrality | Eigenvector centrality | −0.024 | 0.914 |
| Betweenness centrality | Av. WA | 0.189 | 0.401 |
| Authority | Hub | −0.125 | 0.580 |
| Authority | PageRank | 0.920 | 0.000 * |
| Authority | Eigenvector centrality | 0.833 | 0.000 * |
| Authority | Av. WA | −0.171 | 0.447 |
| Hub | PageRank | −0.180 | 0.424 |
| Hub | Eigenvector centrality | −0.210 | 0.349 |
| Hub | Av. WA | 0.347 | 0.114 |
| PageRank | Eigenvector centrality | 0.897 | 0.000 * |
| PageRank | Av. WA | −0.369 | 0.091 |
| Eigenvector centrality | Av. WA | −0.367 | 0.093 |
| * indicates statistically significant correlation. | |||
| Course A—SNA Normalized Metrics | ||||||||||||||
| Label | In-Degree | Out-Degree | Degree | Weighted In-Degree | Weighted Out-Degree | Weighted Degree | Eccentricity | Closness Centrality | Harmonic Closness Centrality | Betweenness centrality | Authority | Hub | Page Rank | Eigenvector Centrality |
| Ast14 | 0 | 1 | 0.333 | 0.000 | 0.667 | 0.125 | 0.250 | 1.000 | 1.000 | 0.000 | 0.000 | 1.000 | 0.000 | 0.000 |
| Ast11 | 0 | 0.5 | 0.000 | 0.000 | 0.333 | 0.000 | 0.500 | 0.571 | 0.625 | 0.000 | 0.000 | 0.000 | 0.000 | 0.000 |
| Ast10 | 0.75 | 0 | 0.667 | 0.500 | 0.000 | 0.250 | 0.000 | 0.000 | 0.000 | 0.000 | 0.208 | 0.000 | 0.841 | 0.019 |
| Ast3 | 0.5 | 0.5 | 0.667 | 0.833 | 0.667 | 0.750 | 0.000 | 0.000 | 0.000 | 0.000 | 0.163 | 0.000 | 0.471 | 1.000 |
| Ast2 | 0 | 0.5 | 0.000 | 0.000 | 0.333 | 0.000 | 1.000 | 0.409 | 0.481 | 0.000 | 0.000 | 0.000 | 0.000 | 0.000 |
| Ast9 | 0 | 0.5 | 0.000 | 0.000 | 0.333 | 0.000 | 0.500 | 0.571 | 0.625 | 0.000 | 0.000 | 0.000 | 0.000 | 0.000 |
| Ast1 | 1 | 0 | 1.000 | 0.833 | 0.000 | 0.500 | 0.000 | 0.000 | 0.000 | 0.000 | 1.000 | 0.000 | 1.000 | 0.530 |
| Ast8 | 0 | 0.5 | 0.000 | 0.000 | 0.333 | 0.000 | 0.250 | 1.000 | 1.000 | 0.000 | 0.000 | 0.172 | 0.000 | 0.000 |
| Ast16 | 0.25 | 0 | 0.000 | 0.167 | 0.000 | 0.000 | 0.000 | 0.000 | 0.000 | 0.000 | 0.034 | 0.000 | 0.153 | 0.006 |
| Ast7 | 0.5 | 0 | 0.333 | 0.333 | 0.000 | 0.125 | 0.000 | 0.000 | 0.000 | 0.000 | 0.689 | 0.000 | 0.299 | 0.134 |
| Ast6 | 0 | 0.5 | 0.000 | 0.000 | 0.333 | 0.000 | 0.250 | 1.000 | 1.000 | 0.000 | 0.000 | 0.374 | 0.000 | 0.000 |
| Ast5 | 0.25 | 0 | 0.000 | 0.167 | 0.000 | 0.000 | 0.000 | 0.000 | 0.000 | 0.000 | 0.163 | 0.000 | 0.471 | 0.390 |
| Ast13 | 0.75 | 0.5 | 1.000 | 1.000 | 1.000 | 1.000 | 0.000 | 0.000 | 0.000 | 0.000 | 0.452 | 0.000 | 0.605 | 0.509 |
| Ast12 | 0.5 | 0 | 0.333 | 0.333 | 0.000 | 0.125 | 0.000 | 0.000 | 0.000 | 0.000 | 0.689 | 0.000 | 0.299 | 0.134 |
| Ast4 | 0.25 | 0.5 | 0.333 | 0.167 | 0.333 | 0.125 | 0.500 | 0.571 | 0.625 | 1.000 | 0.396 | 0.000 | 0.146 | 0.128 |
| Course B—SNA Normalized Metrics | |||||||||||||||
| Label | In-Degree | Out-Degree | Degree | Weighted In-Degree | Weighted Out-Degree | Weighted Degree | Eccentricity | Closness Centrality | Harmonic Closness Centrality | Betweenness Centrality | Authority | Hub | Page Rank | Clustering | Eigenvector Centrality |
| Bst14 | 0.111 | 0.333 | 0.111 | 0.077 | 0.250 | 0.077 | 0.500 | 1.000 | 1.000 | 0.026 | 0.245 | 0.216 | 0.022 | 0.000 | 0.005 |
| Bst9 | 0.667 | 0.333 | 0.667 | 0.462 | 0.250 | 0.462 | 0.000 | 0.000 | 0.000 | 0.000 | 0.643 | 0.000 | 0.441 | 0.200 | 0.236 |
| Bst18 | 0.000 | 0.333 | 0.000 | 0.000 | 0.250 | 0.000 | 0.500 | 1.000 | 1.000 | 0.000 | 0.000 | 0.495 | 0.000 | 0.000 | 0.000 |
| Bst13 | 0.000 | 0.333 | 0.000 | 0.000 | 0.250 | 0.000 | 0.500 | 1.000 | 1.000 | 0.000 | 0.000 | 0.180 | 0.000 | 0.000 | 0.000 |
| Bst8 | 0.333 | 0.667 | 0.444 | 0.538 | 1.000 | 0.769 | 0.500 | 1.000 | 1.000 | 0.026 | 0.311 | 0.495 | 0.120 | 0.333 | 0.236 |
| Bst22 | 0.000 | 1.000 | 0.222 | 0.000 | 0.750 | 0.154 | 0.500 | 1.000 | 1.000 | 0.000 | 0.000 | 1.000 | 0.000 | 0.167 | 0.000 |
| Bst12 | 0.444 | 1.000 | 0.667 | 0.385 | 0.750 | 0.538 | 1.000 | 0.600 | 0.667 | 1.000 | 0.572 | 0.966 | 0.365 | 0.167 | 0.072 |
| Bst17 | 0.000 | 0.333 | 0.000 | 0.000 | 0.250 | 0.000 | 0.500 | 1.000 | 1.000 | 0.000 | 0.000 | 0.180 | 0.000 | 0.000 | 0.000 |
| Bst21 | 0.444 | 0.000 | 0.333 | 0.308 | 0.000 | 0.231 | 0.000 | 0.000 | 0.000 | 0.000 | 0.363 | 0.000 | 0.419 | 0.000 | 0.072 |
| Bst7 | 0.000 | 0.667 | 0.111 | 0.000 | 0.750 | 0.154 | 1.000 | 0.667 | 0.750 | 0.000 | 0.000 | 0.528 | 0.000 | 0.000 | 0.000 |
| Bst20 | 1.000 | 0.333 | 1.000 | 1.000 | 0.250 | 1.000 | 0.000 | 0.000 | 0.000 | 0.000 | 1.000 | 0.000 | 1.000 | 0.222 | 1.000 |
| Bst6 | 0.111 | 0.333 | 0.111 | 0.077 | 0.250 | 0.077 | 0.000 | 0.000 | 0.000 | 0.000 | 0.000 | 0.000 | 0.000 | 0.000 | 0.024 |
| Bst5 | 0.000 | 0.333 | 0.000 | 0.000 | 0.250 | 0.000 | 0.500 | 1.000 | 1.000 | 0.000 | 0.000 | 0.319 | 0.000 | 0.000 | 0.000 |
| Bst4 | 0.111 | 0.000 | 0.000 | 0.077 | 0.000 | 0.000 | 0.000 | 0.000 | 0.000 | 0.000 | 0.256 | 0.000 | 0.042 | 0.000 | 0.056 |
| Bst11 | 0.000 | 0.333 | 0.000 | 0.000 | 0.250 | 0.000 | 0.500 | 1.000 | 1.000 | 0.000 | 0.000 | 0.319 | 0.000 | 0.000 | 0.000 |
| Bst10 | 0.556 | 0.333 | 0.556 | 0.385 | 0.250 | 0.385 | 0.000 | 0.000 | 0.000 | 0.000 | 0.435 | 0.000 | 0.418 | 0.200 | 0.231 |
| Bst19 | 0.444 | 0.333 | 0.444 | 0.385 | 0.500 | 0.462 | 0.000 | 0.000 | 0.000 | 0.000 | 0.534 | 0.000 | 0.214 | 0.333 | 0.189 |
| Bst16 | 0.000 | 0.333 | 0.000 | 0.000 | 0.250 | 0.000 | 0.500 | 1.000 | 1.000 | 0.000 | 0.000 | 0.216 | 0.000 | 0.000 | 0.000 |
| Bst3 | 0.667 | 0.667 | 0.778 | 0.615 | 0.750 | 0.769 | 0.500 | 1.000 | 1.000 | 0.079 | 0.584 | 0.495 | 0.494 | 0.238 | 0.329 |
| Bst15 | 0.000 | 0.333 | 0.000 | 0.000 | 0.250 | 0.000 | 0.500 | 1.000 | 1.000 | 0.000 | 0.000 | 0.000 | 0.000 | 0.000 | 0.000 |
| Bst2 | 0.000 | 0.333 | 0.000 | 0.000 | 0.250 | 0.000 | 1.000 | 0.667 | 0.750 | 0.000 | 0.000 | 0.289 | 0.000 | 0.000 | 0.000 |
| Bst1 | 0.222 | 0.333 | 0.222 | 0.154 | 0.250 | 0.154 | 0.000 | 0.000 | 0.000 | 0.000 | 0.000 | 0.000 | 0.151 | 0.500 | 0.047 |
References
- Dziuban, C.; Graham, C.R.; Moskal, P.D.; Norberg, A.; Sicilia, N. Blended learning: The new normal and emerging technologies. Int. J. Educ. Technol. High. Educ. 2018, 15, 3. [Google Scholar] [CrossRef]
- Bojović, Ž; Bojović, P.D.; Vujošević, D.; Šuh, J. Education in times of crisis: Rapid transition to distance learning. Comput. Appl. Eng. Educ. 2020, 28, 1467–1489. [Google Scholar] [CrossRef]
- Davis, B.; Carmean, C.; Wagner, E. The Evolution of the LMS:From Management to Learning—Deep Analysis of Trends Shaping the Future of e-Learning; The ELearning Guild Research: Santa Rosa, CA, USA, 2009. [Google Scholar]
- Simpson, O. Supporting Students in open and Distance Learning; KoganPage: London, UK, 2002. [Google Scholar]
- Moore, M.G. Toward a Theory of Independent Learning and Teaching. J. High. Educ. 1973, 44, 661–679. [Google Scholar] [CrossRef]
- Panagiotakopoulos, C.T.; Tsiatsos, T.; Lionarakis, A.; Tsanakos, N. Teleconference in support of distance learning: Views of educators. Open Educ.-J. Open Distance Educ. Educ. Technol. 2013, 9, 5–18. [Google Scholar] [CrossRef]
- Zimmerman, B.J. Self-regulated learning and academic achievement: An overview. Educ. Psychol. 1990, 25, 3–17. [Google Scholar] [CrossRef]
- Livingston, J.A. Metacognition: An Overview. Psychology 2003, 13, 259–266. [Google Scholar]
- Wedemeyer, C.A. Independent study. In The International Encyclopedia of Higher Education; Knowles, A.S., Ed.; CIHED: Boston, MA, USA, 1977. [Google Scholar]
- Miyazoe, T.; Anderson, T. Interaction equivalency in an OER, MOOCS and informal learning era. J. Interact. Media Educ. 2013, 1–15. [Google Scholar] [CrossRef]
- Kagklis, V.; Karatrantou, A.; Panagiotakopoulos, C.T.; Verykios, V.S. A learning analytics methodology for detecting sentiment in student fora: A case study in distance education. Eur. J. Open Distance E-Learn 2015, 18, 74–94. [Google Scholar] [CrossRef]
- Geigle, C.; Zhai, C. Modeling MOOC Student Behavior with Two-Layer Hidden Markov Models. In Proceedings of the 4th ACM Conference on Learning at Scale, Cambridge, MA, USA, 20–21 April 2017; pp. 205–208. [Google Scholar] [CrossRef]
- Wollny, S.; Di Mitri, D.; Jivet, I.; Muñoz-Merino, P.; Scheffel, M.; Schneider, J.; Tsai, Y.-S.; Whitelock-Wainwright, A.; Gašević, D.; Drachsler, H. Students’ Expectations of Learning Analytics across Europe. J. Comput. Assist. Learn. 2023, 39, 1325–1338. [Google Scholar] [CrossRef]
- Setiawan, R.; Budiharto, W.; Kartowisastro, I.H.; Prabowo, H. Finding model through latent semantic approach to reveal the topic of discussion in discussion forum. Educ. Inf. Technol. 2020, 25, 31–50. [Google Scholar] [CrossRef]
- Siemens, G.; Baker, R.S.J. Learning Analytics and Educational Data Mining: Towards Communication and Collaboration. In Proceedings of the LAK 2012: Second International Conference on Learning Analytics and Knowledge, Vancouver, BC, Canada, 29 April–2 May 2012. [Google Scholar]
- Brindley, J.E.; Walti, C.; Blaschke, L.M. Creating Effective Collaborative Learning Groups in an Online Environment. IRRODL 2009, 10, 1–18. Available online: http://www.irrodl.org/index.php/irrodl/article/view/675/1271 (accessed on 1 October 2014). [CrossRef]
- Tsoni, R.; Samaras, C.; Paxinou, E.; Panagiotakopoulos, C.; Verykios, V.S. From analytics to cognition: Expanding the reach of data in learning. In Proceedings of the 11th International Conference on Computer Supported Education, Heraklion, Greece, 2–4 May 2019; Volume 2, pp. 458–465. [Google Scholar] [CrossRef]
- Motz, B.A.; Quick, J.D.; Wernert, J.A.; Miles, T.A. A pandemic of busywork: Increased online coursework following the transition to remote instruction is associated with reduced academic achievement. Online Learn. 2021, 25, 70–85. [Google Scholar] [CrossRef]
- Conijn, R.; Snijders, C.; Kleingeld, A.; Matzat, U. Predicting Student Performance fsrom LMS Data: A Comparison of 17 Blended Courses Using Moodle LMS. IEEE Trans. Learn. Technol. 2017, 10, 17–29. [Google Scholar] [CrossRef]
- Lang, C.; Siemens, G.; Wise, A.; Gasevic, D. Handbook of Learning Analytics; Society for Learning Analytics Research (SoLAR): Beaumont, AB, Canada, 2017. [Google Scholar] [CrossRef]
- Tsoni, R.; Sakkopoulos, E.; Verykios, V.S. Revealing latent student traits in distance learning through SNA and PCA. In Handbook on Intelligent Techniques in the Educational Process: Vol 1 Recent Advances and Case Studies; Springer International Publishing: Cham, Switzerland, 2022; pp. 185–209. [Google Scholar]
- Tsoni, R.; Sakkopoulos, E.; Panagiotakopoulos, C.T.; Verykios, V.S. On the equivalence between bimodal and unimodal students’ collaboration networks in distance learning. Intell. Decis. Technol. 2021, 15, 305–319. [Google Scholar] [CrossRef]
- Lee, S.Y.; Chae, H.S.; Natriello, G. Identifying User Engagement Patterns in an Online Video Discussion Platform. In Proceedings of the 11th International Conference on Educational Data Mining, Buffalo, NY USA, 15–18 July 2018. [Google Scholar]
- Sturludóttir, E.G.; Arnardóttir, E.; Hjálmtýsson, G.; Óskarsdóttir, M. Gaining insights on student course selection in higher education with community detection. arXiv 2021, arXiv:2105.01589. [Google Scholar]
- Tsoni, R.; Paxinou, E.; Stavropoulos, E.; Panagiotakopoulos, C.T.; Verykios, V.S. Looking under the hood of students’ collaboration networks in distance learning. In The Envisioning Report for Empowering Universities; European Association of Distance Teaching Universities: Maastricht, The Netherlands, 2020; p. 39. [Google Scholar]
- López-Flores, N.G.; Óskarsdóttir, M.; Islind, A.S. Analysis of discussion forum interactions for different teaching modalities based on temporal social networks. In Proceedings of the NetSciLA22 Workshop, Online, 22 March 2022. [Google Scholar]
- Huang, J.; Dasgupta, A.; Ghosh, A.; Manning, J.; Sanders, M. Superposter behavior in MOOC fora. In Proceedings of the First ACM Conference on Learning @ Scale Conference, Atlanta, GA, USA, 4–5 March 2014; pp. 117–126. [Google Scholar]
- Pinski, G.; Narin, F. Citation influence for journal aggregates of scientific publications: Theory, with application to the literature of physics. Inf. Process. Manag. 1976, 12, 297–312. [Google Scholar] [CrossRef]
- Brin, S.; Page, L. The Anatomy of a Large-Scale Hypertextual Web Search Engine. In Proceedings of the Seventh International Conference on World Wide Web 7, Brisbane, Australia, 14–18 April 1998. [Google Scholar]
- Davis, P.M. Eigenfactor: Does the Principle of Repeated Improvement Result in Better Journal Impact Estimates than Raw Citation Counts? J. Am. Soc. Inf. Sci. Technol. 2008, 59, 2186–2188. [Google Scholar] [CrossRef]
- Sanchez, T.; Naranjo, D.; Vidal, J.; Salazar, D.; Pérez, C.; Jaramillo, M. Analysis of Academic Performance Based on Sociograms: A Case Study with Students from At-Risk Groups. J. Technol. Sci. Educ. 2021, 11, 167–179. [Google Scholar] [CrossRef]
- Easley, D.; Kleingeld, J. Networks, Crowds, and Markets: Reasoning about a Highly Connected World; Cambridge University Press: Cambridge, UK, 2010. [Google Scholar]
- Putnik, G.; Costa, E.; Alves, C.; Castro, H.; Varela, L.; Shah, V. Analysing the correlation between social network analysis measures and performance of students in social network-based engineering education. Int. J. Technol. Des. Educ. 2016, 26, 413–437. [Google Scholar] [CrossRef]
- Da Silva, L.F.C.; Barbosa, M.W.; Gomes, R.R. Measuring participation in distance education online discussion forums using social network analysis. J. Assoc. Inf. Sci. Technol. 2019, 70, 140–150. [Google Scholar] [CrossRef]
- Hernández-García, Á.; González-González, I.; Jiménez-Zarco, A.I.; Chaparro-Peláez, J. Applying social learning analytics to message boards in online distance learning: A case study. Comput. Hum. Behav. 2015, 47, 68–80. [Google Scholar] [CrossRef]
- Hernández García, Á.; González González, I.; Jiménez Zarco, A.I.; Chaparro Peláez, J. Visualizations of online course interactions for social network learning analytics. Int. J. Emerg. Technol. Learn. 2016, 11, 6–15. [Google Scholar] [CrossRef]
- Adraoui, M.; Retbi, A.; Idrissi, M.K.; Bennani, S. Social learning analytics to describe the learners’ interaction in online discussion forum in Moodle. In Proceedings of the 2017 16th International Conference on Information Technology Based Higher Education and Training (ITHET), Ohrid, Macedonia, 10–12 July 2017; IEEE: New York, NY, USA, 2017; pp. 1–6. [Google Scholar]
- Shonyy. PageRank: Link Analysis Explanation and Python Implementation from Scratch-The Algorithm that Starts Google. Towards Data Science. Available online: https://towardsdatascience.com/pagerank-3c568a7d2332 (accessed on 8 January 2024).
- Kleinberg, J.M.; Kumar, R.; Raghavan, P.; Rajagopalan, S.; Tomkins, A.S. The web as a graph: Measurements, models and methods. In Proceedings of the International Computing and Combinatorics Conference, Tokyo, Japan, 26–28 July 1999; Springer: Berlin/Heidelbergm, Germany, 1999; pp. 1–17. [Google Scholar]
- Kleinberg, J.M. Authoritative sources in a hyperlinked environment. J. ACM 1999, 46, 604–632. [Google Scholar] [CrossRef]
- Borgatti, S.P.; Halgin, D.S. On network theory. Organ. Sci. 2011, 22, 1168–1181. [Google Scholar] [CrossRef]
- Vygotsky, L. Zone of proximal development. Mind Soc. Dev. High. Psychol. Process. 1987, 5291, 157. [Google Scholar]
- Rigney, D. The Matthew Effect: How Advantage Begets Further Advantage; Columbia University Press: New York, NY, USA, 2010. [Google Scholar]
- Gkontzis, A.F.; Kotsiantis, S.; Kalles, D.; Panagiotakopoulos, C.T.; Verykios, V.S. Polarity, emotions and online activity of students and tutors as features in predicting grades. Intell. Decis. Technol. 2020, 14, 409–436. [Google Scholar] [CrossRef]
- Tsoni, R.; Panagiotakopoulos, T.C.; Verykios, V.S. Revealing Latent Traits in the Social Behavior of Distance Learning Students. Education and Information Technologies. 2021. Available online: https://link.springer.com/article/10.1007%2Fs10639-021-10742-6 (accessed on 7 March 2024).
- Saqr, M.; Elmoazen, R.; Tedre, M.; López-Pernas, S.; Hirsto, L. How well centrality measures capture student achievement in computer-supported collaborative learning? A systematic review and meta-analysis. Educ. Res. Rev. 2022, 35, 100437. [Google Scholar] [CrossRef]
- Kipling, R.P.; Stiles, W.A.; de Andrade-Lima, M.; MacKintosh, N.; Roberts, M.W.; Williams, C.L.; Wootton-Beard, P.C.; Watson-Jones, S.J. Interaction in online postgraduate learning: What makes a good forum? Distance Educ. 2023, 44, 162–189. [Google Scholar] [CrossRef]
- Holmberg, B. Guided didactic conversation in distance education. In Distance Education: International Perspectives; Sewart, D., Keegan, D., Holmberg, B., Eds.; Croom Helm: London, UK, 1983; pp. 114–122. [Google Scholar]
- Perraton, H. A theory for distance education. In Distance Education: International Perspectives; Sewart, D., Keegan, D., Holmberg, B., Eds.; Routledge: New York, NY, USA, 1988; pp. 34–45. [Google Scholar]
- DiGiacomo, D.K.; Usher, E.L.; Han, J.; Abney, J.M.; Cole, A.E.; Patterson, J.T. The benefits of belonging: Students’ perceptions of their online learning experiences. Distance Educ. 2023, 44, 24–39. [Google Scholar] [CrossRef]
- Lee, M.; Lim, J. Do online teaching and social presences contribute to motivational growth? Distance Educ. 2023, 44, 66–85. [Google Scholar] [CrossRef]
- Steinert, Y.; Fontes, K.; Mortaz-Hejri, S.; Quaiattini, A.; Nooraie, R.Y. Social Network Analysis in Undergraduate and Postgraduate Medical Education: A Scoping Review. Acad. Med. 2023, 99, 452–465. [Google Scholar] [CrossRef] [PubMed]
- Xu, W.; Chen, Y.; Yang, L. The dynamics of social performance and cognitive depth between students and teacher in online discussion forums with the SNA and LDA approach. Innov. Educ. Teach. Int. 2023, 1–17. [Google Scholar] [CrossRef]
- Crossette, N.; Carr, L.D.; Wilcox, B.R. Correlations between student connectivity and academic performance: A pandemic follow-up. Phys. Rev. Phys. Educ. Res. 2023, 19, 010106. [Google Scholar] [CrossRef]


| Course A | ||||||||
|---|---|---|---|---|---|---|---|---|
| Variable | Min | Max | Mean | Std. Deviation | Variance | Skewness | Kurtosis | Overall Sum |
| WA1 | 7.5 | 10 | 9.83 | 0.65 | 0.42 | −3.87 | 15.00 | 147.50 |
| WA2 | 7 | 10 | 9.67 | 0.84 | 0.70 | −2.82 | 7.94 | 145.00 |
| WA3 | 7.5 | 10 | 9.47 | 0.81 | 0.66 | −1.49 | 1.40 | 142.00 |
| WA4 | 0 | 10 | 8.39 | 3.44 | 11.80 | −2.32 | 4.09 | 125.80 |
| Av. WA | 6.75 | 10 | 9.34 | 1.03 | 1.06 | −1.87 | 2.66 | 140.08 |
| In-degree | 0 | 4 | 1.27 | 1.33 | 1.78 | 0.69 | −0.64 | 19.00 |
| Out-degree | 0 | 2 | 0.67 | 0.62 | 0.38 | 0.31 | −0.40 | 10.00 |
| Degree | 1 | 4 | 1.93 | 1.10 | 1.21 | 0.89 | −0.44 | 29.00 |
| Weighted in-degree | 0 | 6 | 1.73 | 2.09 | 4.35 | 1.06 | −0.19 | 26.00 |
| Weighted out-degree | 0 | 3 | 0.87 | 0.92 | 0.84 | 0.94 | 0.52 | 13.00 |
| Weighted degree | 1 | 9 | 2.60 | 2.47 | 6.11 | 1.81 | 2.50 | 39.00 |
| Eccentricity | 0 | 4 | 0.87 | 1.19 | 1.41 | 1.47 | 2.09 | 13.00 |
| Closeness centrality | 0 | 1 | 0.34 | 0.41 | 0.17 | 0.67 | −1.22 | 5.12 |
| Harmonic closeness centrality | 0 | 1 | 0.36 | 0.42 | 0.18 | 0.54 | −1.48 | 5.36 |
| Betweenness centrality | 0 | 0.02 | 0.00 | 0.00 | 0.00 | 3.87 | 15.00 | 0.02 |
| Authority | 0 | 0.65 | 0.16 | 0.21 | 0.04 | 1.20 | 0.47 | 2.44 |
| Hub | 0 | 0.27 | 0.03 | 0.07 | 0.01 | 3.10 | 10.03 | 0.42 |
| PageRank | 0.02 | 0.06 | 0.03 | 0.01 | 0.00 | 1.01 | 0.06 | 0.46 |
| Eigenvector Centrality | 0 | 1 | 0.19 | 0.29 | 0.09 | 1.83 | 3.16 | 2.85 |
| Course B | ||||||||
|---|---|---|---|---|---|---|---|---|
| Variable | Min | Max | Mean | Std. Deviation | Variance | Skewness | Kurtosis | Overall Sum |
| WA1 | 5 | 10 | 8.22 | 1.63 | 2.64 | −1.09 | 0.13 | 180.90 |
| WA2 | 0 | 10 | 7.35 | 2.65 | 7.02 | −1.45 | 1.62 | 161.70 |
| WA3 | 0 | 10 | 7.50 | 3.04 | 9.24 | −1.61 | 1.69 | 165.00 |
| Av. WA | 2.9 | 9.7 | 7.69 | 2.11 | 4.47 | −1.21 | 0.52 | 169.20 |
| In-degree | 0 | 9 | 2.09 | 2.64 | 6.94 | 1.15 | 0.53 | 46.00 |
| Out-degree | 0 | 3 | 1.23 | 0.75 | 0.56 | 1.07 | 1.56 | 27.00 |
| Degree | 1 | 10 | 3.32 | 2.77 | 7.66 | 1.02 | −0.04 | 73.00 |
| Weighted in-degree | 0 | 13 | 2.64 | 3.54 | 12.53 | 1.46 | 1.95 | 58.00 |
| Weighted out-degree | 0 | 4 | 1.45 | 1.06 | 1.12 | 1.06 | 0.30 | 32.00 |
| Weighted degree | 1 | 14 | 4.09 | 3.95 | 15.61 | 1.24 | 0.54 | 90.00 |
| Eccentricity | 0 | 2 | 0.77 | 0.69 | 0.47 | 0.32 | −0.70 | 17.00 |
| Closeness Centrality | 0 | 1 | 0.59 | 0.47 | 0.22 | −0.43 | −1.83 | 12.93 |
| Harmonic Closeness Centrality | 0 | 1 | 0.60 | 0.47 | 0.22 | −0.49 | −1.81 | 13.17 |
| Betweenness Centrality | 0 | 0.03 | 0.00 | 0.01 | 0.00 | 4.64 | 21.64 | 0.03 |
| Authority | 0 | 0.57 | 0.13 | 0.17 | 0.03 | 1.11 | 0.54 | 2.83 |
| Hub | 0 | 0.29 | 0.07 | 0.09 | 0.01 | 1.26 | 1.13 | 1.64 |
| PageRank | 0.01 | 0.04 | 0.01 | 0.01 | 0.00 | 1.89 | 3.99 | 0.27 |
| Eigenvector Centrality | 0 | 1 | 0.11 | 0.22 | 0.05 | 3.30 | 12.56 | 2.50 |
| Course A | |||
|---|---|---|---|
| Variable A | Variable B | Correlation Value | p Value |
| WA1 | Eccentricity | −0.730 | 0.002 * |
| WA2 | Out-degree | −0.644 | 0.010 |
| WA2 | Hub | −0.788 | 0.000 * |
| WA3 | Weighted out-degree | −0.583 | 0.023 * |
| Course B | |||
|---|---|---|---|
| Variable A | Variable B | Correlation Value | p Value |
| WA1 | PageRank | −0.448 | 0.037 * |
| WA1 | Eigenvector centrality | −0.513 | 0.015 * |
| WA2 | PageRank | −0.433 | 0.044 * |
| WA2 | Eigenvector centrality | −0.432 | 0.045 * |
Disclaimer/Publisher’s Note: The statements, opinions and data contained in all publications are solely those of the individual author(s) and contributor(s) and not of MDPI and/or the editor(s). MDPI and/or the editor(s) disclaim responsibility for any injury to people or property resulting from any ideas, methods, instructions or products referred to in the content. |
© 2024 by the authors. Licensee MDPI, Basel, Switzerland. This article is an open access article distributed under the terms and conditions of the Creative Commons Attribution (CC BY) license (https://creativecommons.org/licenses/by/4.0/).
Share and Cite
Tsoni, R.; Paxinou, E.; Gkoulalas-Divanis, A.; Karapiperis, D.; Kalles, D.; Verykios, V.S. Exploiting Properties of Student Networks to Enhance Learning in Distance Education. Information 2024, 15, 234. https://doi.org/10.3390/info15040234
Tsoni R, Paxinou E, Gkoulalas-Divanis A, Karapiperis D, Kalles D, Verykios VS. Exploiting Properties of Student Networks to Enhance Learning in Distance Education. Information. 2024; 15(4):234. https://doi.org/10.3390/info15040234
Chicago/Turabian StyleTsoni, Rozita, Evgenia Paxinou, Aris Gkoulalas-Divanis, Dimitrios Karapiperis, Dimitrios Kalles, and Vassilios S. Verykios. 2024. "Exploiting Properties of Student Networks to Enhance Learning in Distance Education" Information 15, no. 4: 234. https://doi.org/10.3390/info15040234