Abstract
Over the past couple of decades, global positioning system (GPS) technology has been utilized to collect large-scale data from travel surveys. As the precise spatiotemporal characteristics of travel could be provided by GPS devices, the issues of traditional travel survey, such as misreporting and non-response, could be addressed. Considering the defects of dedicated GPS devices (e.g., the need for a large sum of money to buy devices, forgetfulness in the taking of devices to collect data, limiting of the sample size because of the number of devices, etc.), and the fact that the smartphone is becoming one of the necessities of life, there is an opportunity for smartphones to replace dedicated GPS devices. Although several general reviews of GPS travel survey and GPS data-processing methods have been written, a systematic review of smartphone-based GPS data collection and travel mode detection has not be made.. The studies were collected from six databases. The purpose of this review is to critically evaluate the current literature on the existing methodologies of travel mode detection based on GPS raw data collected by smartphones. Meanwhile, according to a systematic comparison of the different methods of data preprocessing for travel mode detection, this paper details the strengths and weaknesses of the existing methods. Furthermore, it is a very important step towards developing methodologies and applications for GPS raw data collected by smartphones.
1. Introduction
Due to the worsening traffic congestion, transportation demand modeling and travel behavior research have played more and more significant roles in the formulation and evaluation of transportation demand management policies over the past two decades. In practice, travel surveys are widely used to collect crucial infrastructure data for traffic demand analysis in transportation system planning [1,2].
The traditional travel survey methods have gone through some stages. In the 1950s, the first travel survey approach, the face-to-face interview, was used in the field of urban transport planning, in which interviewers needed to visit participants’ homes and ask questions about the household’s travel information and the interviewers used paper and pencil to record the answers. In the 1960s, however, considering the weaknesses of the face-to-face interviews, such as safety and cost issues, the mail-out/mail-back survey [3], which is relatively safer and more cost-effective, gradually replaced it, but its low response rate was a major challenge. Furthermore, the collected data needed to be transferred from paper to computers, which required manpower [4]. In the 1980s, for the purpose of surmounting the shortcomings of paper-and-pencil interviews (PAPI), computer-assisted surveys were introduced. Computer-assisted surveys are of three main types: the computer-assisted telephone interview (CATI), the computer-assisted personal interview, and the computer-assisted self-interview (CASI) [5]. However, all of these approaches had some demerits, such as misreporting [3] and non-response [6]. Thus, in order to overcome the disadvantages of these methods, methods for collecting travel data automatically had to be considered.
For the sake of improving the accuracy and quantity of travel data and supplementing the traditional data elements that were collected on paper or via electronic travel diaries, Global Positioning System (GPS) technology, proving accurate data such as location, time, speed, heading and so on, has been used for travel surveys since the middle of the 1990s [7,8]. Over the past couple of decades, GPS-based surveys have been undertaken in many countries, such as the USA, the United Kingdom, Australia, Austria, Canada, China, Demark, France, Israel, the Netherlands, Japan, Sweden, Switzerland, and so on [9,10,11,12,13,14,15,16,17,18,19,20,21]. Meanwhile, it has been widely recognized that GPS-based data collection methods can present obvious advantages over traditional travel methods. GPS-based data collection methods impose fewer requirements on the respondents, provide greater spatial and temporal precision, and are capable of reducing labor and time costs [22]. Removing the burden and fatigue from the survey respondents and allowing researchers to collect detailed travel data are other important advantages of GPS-based data collection methods [23,24]. In view of the very low level of burden and fatigue on respondents, the surveys’ length can be extended from the traditional single day to multi-day travel information collection, which provides a chance to test the dynamics of multi-day travel patterns [1,25]. Although the time and positional characteristics of travel can be recorded accurately by GPS devices, important attributes such as travel mode, trip purpose, and start and end of trip cannot be extracted from the data collected by GPS devices. Therefore, data processing procedures become useful and necessary, because the GPS raw data would be insufficient for travel modeling purpose without the results of the data processing procedures [4,25].
A number of methods for processing GPS data for application to a GPS-based travel survey have been studied. Among those studies, the majority concentrated on the identification of travel modes. Lots of approaches have been applied in inferring travel modes based on GPS data collected by dedicated GPS devices, such as Rule-based Method [25,26], Bayesian Model with Expectation Maximization [27], Fuzzy Logic Approach [19], Bayesian Belief Network Model [28], Multilayer Perceptron [29], Support Vector Machine [30], Artificial Neural Networks [31,32], and many others. Travel surveys based on dedicated GPS devices have the following disadvantages, however: (1) researchers need to spend huge amounts of money on dedicated GPS devices; (2) forgetting to take the GPS devices results in incomplete data collection; (3) the number of dedicated GPS devices is a limitation of the sample size; (4) in GPS-based travel survey, dedicated GPS devices need to be distributed to and retrieved from participants [33].
The smartphone is becoming one of the necessities of daily life and is in most instances equipped with a GPS module, which provides an opportunity to use smartphones to replace dedicated GPS devices to collect travel data [34]. Some smartphone-based GPS travel surveys have been conducted in these studies [35,36]. In light of the increasing popularity of smartphones, the probability that people will forget to carry their own smartphones is very low when they go out. Thus, utilizing smartphones to collect travel data would reduce expenditure on surveys and ensure efficacy in data collection. In addition, the accelerometer sensor is also built into some smartphones; using this function can record more data, which could be used to recognize travel modes [28]. Smartphone-based GPS surveys have some weaknesses: (1) the short battery lives of smartphones (compared with dedicated GPS devices); (2) the unstable signal acquisition in certain areas, such as urban canyons; (3) the high cost of transferring data from phones to data centers [4]. Due to the flaws of smartphone-based GPS surveys, it is important to choose a proper methodology to process the data.
The focus of this study is to assess existing methodologies of detecting travel modes based on GPS data collected by smartphones. In this study, the prime aim is to provide a systematic review of the existing methodologies of travel mode detection, compare the different data processing methods that have applied in existing studies, and analyze the pros and cons of these methods. Also, it is a crucial step towards developing the methodologies and applications of GPS data collected by smartphone.
The rest of this paper is organized as follows: the methods and a review of eligible papers are given in Section 2. The systematic review process is presented in Section 3. Section 4 describes the quality of the reviewed studies. Limitations and strengths of this paper are proposed in Section 5. Finally, the discussion and conclusions are provided in Section 6.
2. Methods
2.1. Search Strategy and Databases Searched
In light of the PRISMA (preferred reporting items for systematic reviews and meta-analyses) statement [37], six databases, Web of Science (1997–December 2015), ScienceDirect (1997–December 2015), Academic Search Complete (1997–December 2015), Scopus (1997–December 2015), Cambridge Journals Online (1997–December 2015), and the TRIS (Transportation Research Information Services) and (International Transport Research Documentation) ITRD database (TRID) (1997–December 2015), were searched using keywords contained in the title, abstract, mesh heading, and eligible terms (the reason for selecting 1997 as the start date is that that was the first time GPS technology was used for travel surveys). There are three categories of search terms and at last one term from each category must be used in combination: (1) smartphone, cell phone, and mobile phone; (2) GPS data, GPS trajectory, GPS raw data, and GPS track; (3) travel mode, transportation mode, movement patterns, travel mode detection, travel mode identification, travel mode recognition, infer travel mode, identify travel mode, detect travel mode, detect transportation mode, infer transportation mode, deduce travel mode, classify travel mode, and identify transportation. Considering the specific structure of each database, the search must be adapted to match the database. It was important to examine the previous reviews. The references within identified articles were, of course, also reviewed for further studies.
2.2. Inclusion and Exclusion Criteria
In order to make sure that each study included in the review was eligible, studies had to: (1) be written in English and published in a peer-reviewed English journal; (2) use a smartphone as a tool to collect data; (3) collect at least the GPS data by smartphone; (4) relate to travel mode detection procedure; and (5) have at least one dependent variable related to travel.
2.3. Data Extraction
A standardized data extraction table was extracted from the papers using the matrix method. The information abstracted from each eligible article included study characteristics (e.g., study design, study area, study duration), data preprocessing methods (e.g., data error recognition), trip/segment identification methods (e.g., feature selection reliability testing, parameter selection reliability testing), and travel mode detection methods (e.g., feature selection reliability testing, comparison of experimental results). For the credibility of data extraction, the authors drew a subsample of eight papers and extracted the data independently. The authors approved of 80% of the extracted data, indicating high inter-rater reliability.
2.4. Quality Assessment
The quality of the included studies in this review is carefully assessed through a modified checklist which contains data collecting methodological quality scale and data processing methodological quality scale.
To capture the influences affecting the quality of data collecting methods, the modified checklist includes five aspects: study design, the basis of sample size selection, survey duration, measures to overcome drawbacks, and ground truth. The study design may include travel surveys and experimental surveys. This is because the quality of GPS data of an experimental survey might be better than multi-day travel, which is likely to influence the accuracy of the data processing methods [4]. Hence a study design was added in the checklist as one of the criteria. Adequate sample size calculation is of importance to determine the number of participants [30]. A formula for the minimum sample size was introduced by Bolbol et al. [30]. Adequate sample size should not be less than the minimum sample size. Thus, the adequate sample size selection was chosen in the checklist as one of the criteria. The reason why survey data were collected over two weeks was to ensure the natural flow of travel patterns of each participant [30]. The weaknesses of smartphone-based GPS travel surveys are likely to affect the accuracy of GPS raw data, which further influences the accuracy of the data processing methods. Therefore, measures for overcoming the drawbacks are essential to ensure the accuracy of GPS raw data. Ground truth is used to calculate the accuracy of travel mode detection, so ground truth is selected to be one of the criteria [4].
In order to assess the influences affecting the quality of data processing methodology, the modified checklist includes three aspects: data preprocessing methods, trip/segment identification methods, and travel mode detection methods. It is important to recognize and clean the error data before they can be used in the next part, so it is a necessary step to provide a statistical basis for the choice of independent variables in the trip/segment identification and travel mode detection [30]. Comparison of different experimental results is to show whether the proposed approach is the best.
All included studies were evaluated on the basis of the 10 criteria listed in Table 1. The possible range of evaluation scores was 2 to 12.

Table 1.
Checklist for evaluating studies’ quality.
3. Systematic Review Process
The search and retrieval process is shown in Figure 1. The number of papers collected from each database mentioned above were 1584 (web of science), 1552 (ScienceDirect), 2107 (Scopus), 225 (Academic Search Complete), 107 (TRID), and 79 (Cambridge Journals Online). After duplicates were removed, a total of 4137 different records were extracted from six databases, of which 265 were identified following the screening of titles and abstracts. There are three reasons to exclude ineligible records: the GPS raw data is not collected by smartphone; the collected data are not used to detect travel modes; and the full text is not available. Thus, the full text of 12 publications was retrieved. The reference lists of excluded reviews were reviewed and potential papers were gathered. Finally, 12 published papers matching all the criteria were included in this review [1,31,38,39,40,41,42,43,44,45,46,47], as shown in Table 2. In particular, we selected [39] because the segment identification method of this study is a significant data preprocessing technique for travel mode detection.
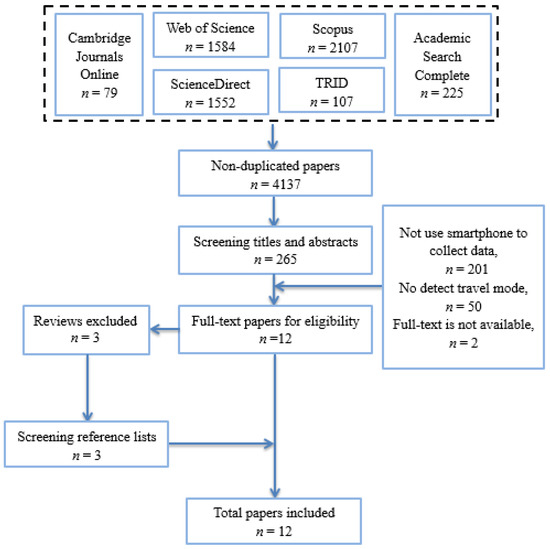
Figure 1.
The flowchart of systematic review process.
Table 2.
Summary of studies included in this systematic review.
3.1. GPS Data Processing Procedure
The common procedure of GPS data processing to detect travel modes consists of three parts: the first is transferring data collected from GPS-enabled smartphones to computers and creating output files that can be used for the next statistical analysis; the second is to identify trips/segments; and the last is to detect travel modes according to the previously processed data.
3.2. Data Preprocessing Procedure
Manual mistakes such as inaccurate timing and underreporting trips can be avoided using the GPS raw data collected from smartphones. However, it is a pity that the GPS raw data may have systematic errors. Hence, it is necessary to preprocess the fresh GPS data before they can be utilized in the next steps. The typical data preprocessing procedure can be divided into two parts: records’ features are used for error recognition and then to determine the methods or steps of data transformation. A summary of the data preprocessing procedure is shown in Table 3.
Table 3.
Summary of data error recognition and preprocessing in the selected papers.
Xiao et al. [39] utilized three rules to remove incomplete or invalid data. The first rule is that incomplete track points that may indicate wrong records were removed. The second is that records with fewer than four satellites (for 3D use) or with a Horizontal Dilution of Precision (HDOP) of four or more were eliminated. The last rule is that track points with an altitude of more than 200 m are deleted. They also used three steps to preprocess the cleaned track data. The first step is to convert the UTC time to local data and time. The second step is to extract track data for each person-day based on user ID and the local date. The last step is to re-number all track points of one person-day to infer the trip end.
Lari et al. [40] found that speed, an attribute calculated based on three geographical parameters (altitude, longitude, and latitude), was a significant factor affecting the accuracy of recoding data, so they used the maximum speed values of different modes to clean the raw data.
Nitsche et al. [42] utilized a Kalman filter to preprocess the track data. For instance, they combined the raw GPS and cell location data with the predictions of a linear model assuming zero mean, Gaussian-distributed acceleration to calculate accurate, smooth tracks. They also transformed the data of tri-axial accelerometer into a rotation-invariant signal because the direction of the three-dimensional acceleration vector had a great impact on the accuracy of the accelerometer data.
Stenneth et al. [43] rejected the invalid GPS points based on the accuracy of the latitude and longitude coordinates and the change in speed.
Zhang et al. [44] calculated the values of speed and heading from point positions and time stamps and utilized a smoothing method to reduce speed errors by averaging the neighborhood.
Reddy et al. [46] recognized and discarded invalid GPS points from three points: the accuracy of vertical, horizontal, heading and speed; the dilution of precision of time, vertical and horizontal; and the changes in speed values of the GPS signal. The accelerometer data were cleaned as well. They pointed out that the number of such data was very limited, and should be excluded.
However, the data preprocessing procedure was not mentioned in these papers [41,45]. The data preprocessing methods were simply referred to in papers [1,31,38,47].
3.3. Trip/Segment Identification
In this part, the concept of trip, also defined as a segment, refers only to a one-mode trip. For all researchers, the first challenge of the GPS data processing procedure would be trip identification (TI) or segment identification (SI). The data about each trip, travel mode detection, and trip purpose imputation that the travel model needs are based on the results of TI. A summary of attributes used for TI/SI in the selected papers is shown in Table 4. Currently, rule-based algorithms are used by most researchers to undertake TI/SI procedures.
Table 4.
Summary of records’ parameters used for TI/SI in selected papers.
Xiao et al. [39] found that the specific values of parameters of rule-based methods in most existing studies were selected based on researchers’ experience. So these studies neglected the possibility of obtaining better prediction accuracy by using an optimal combination from a list of candidates. Xiao et al. paid attention to developing algorithms for identifying trip ends and selecting the best parameter combination from a list of pre-defined candidates to improve trip ends prediction accuracy. In order to optimize the parameter values, two situations were considered: single loss and normal recording. Under the single loss situation, they defined two different destinations: habitual destination and non-habitual destination. Two different parameters for dwell time were defined to judge whether there existed a trip end for a stop near habitual destinations or non-habitual destinations. Under the single available situation, due to the existence of two types of trip ends, they extracted two different parameters (critical length and critical distance) to identify trip ends. Individual parameters had five values that could constitute 625 distinct parameter combinations. By calculating and comparing the results of different combinations, the best result could be obtained: 96.02% accuracy, with a low error rate of 4.74%. Although the improved algorithm obtains a high accuracy of SI, the choice sets of four parameters actually lacked the theoretical research.
Nitsche et al. [42] used the speed threshold and amplitudes of the accelerometer signal to avoid coverage of multiple travel modes. The signal available situation was considered, but the signal loss situation was ignored. Moreover, the value of the speed threshold was not pointed out.
Zhang et al. [44] derived individual travel-mode segments from GPS traces by identifying stops. As they mentioned, very low speed and very small distance changes could be defined as stops. A new parameter, heading change, was the first selected to improve the performance of travel segment identification. Meanwhile, the thresholds of the three parameters used to form the different segments were put forward: the distance change for five continuous points is less than 5 meters; the speed value for five continuous points is less than 0.5 m/s; and the change of heading of five continuous points is larger than 100 degrees.
Zheng et al. [47] utilized change point to divide each trip into segments. In order to verify the validity of this approach, they selected two baseline methods, uniform duration-based and uniform length-based segmentation, to distinguish the trips.
Yang et al. [41] adopted the wavelet transform modulus maximum (WTMM) algorithm for SI processing. The Gaussian family [Gaus (n)] was selected because it had the best performance in mode transfer time detection compared with Haar and Daubechies family. As a result, the accuracy of SI is more than 95%. However, this research has some limitations. For example, the GPS signal loss situation, which could have a great impact on the results of SI, is not considered. Meanwhile, seven types of special multimode travel could not represent all combinations of travel modes, such as walk–bus–bicycle (public bicycle)–walk–subway–walk. Moreover, it might be unreasonable to just use walk as the conversion of different travel modes.
Lari et al. [40] collected GPS tracks via an appropriate application that recorded vital information such as the segments, time, date, instant speed, accuracy, bearing, altitude, latitude, and longitude. This paper did not refer to the SI procedure. Unfortunately, the papers of [31,43,45,46] did not provide details of the TI/SI procedure.
3.4. Travel Mode Detection
Travel mode detection is the third part of the GPS data processing procedure. Table 5 shows a summary of the different approaches used for travel mode detection in the selected papers. There are two categories of methods for travel mode detection: machine learning methods and hybrid methods. A detailed description of the machine learning methods for MD in each of the selected papers is given in the next 12 paragraphs.
Table 5.
Summary of methods of travel mode detection utilized in selected papers.
Gonzalez et al. [45] indicated that the custom Java ME activity daily application, used to collect the travel behavior data, had some limitations. For example, running the application would shorten the battery life of the phone; the financial cost of data collection using this application was very high; and users could not place phone calls or send text messages or e-mails while the application was active. So TRAC-IT was designed to improve upon these limitations, such as by using a smart algorithm to conserve battery energy and running as a background application. They chose neural networks (NNs) to identify travel modes. In their research, two datasets, namely all GPS points and critical GPS points, were used. They applied 10-fold cross-validation to train and test the neural network. Based on their results, the highest accuracy achieved for travel mode detection is as high as 91.23% for the only critical points using a learning rate of 0.1 and a training time of 300 epochs. However, their research has two limitations. The first is that the sample set of trips for training is not enough. The second is that the GPS data are manually segmented by the participators. It should be noted that the two limitations might affect the accuracy of mode detection.
Yang et al. [41] selected the neural network (NN) algorithm to determine the travel mode of each trip segment. As a result, the accuracy of travel mode detection is more than 86%. Moreover, the accuracy of bus mode detection is higher than the accuracy in any other study. However, there are two limitations in this study: the first is that the authors do not consider the defect of the traditional NN algorithm—it is easy to fall into local optimum; the second is that the results comparison has little meaning because different studies use a different quality of data, which has a great impact on the results.
The neural networks (NNs) algorithm was selected by Byon [31] to identify different travel modes. The objective of this article was to compare travel mode detection performances using NNs between traditional GPS data and the data collected by smartphone. There are two innovative aspects to this article: the first is examining the impact of varying sampling rates and monitoring durations on mode detection accuracy; the second is detecting travel modes in different conditions, such as peak scenario versus nonpeak scenario, general versus route-specific, and fixed orientation versus no fixed orientation of smartphone. There are also some limitations in this article, such as the lack of a GPS data preprocessing procedure. In this article, the algorithm could be developed to improve the accuracy of travel mode detection, such as by replacing NNs with PSO-NNs.
Xiao et al. [1] made a table showing the different methods applied to identify travel modes and a summary of the corresponding accuracies. They found that the accuracy of Neural networks (NNs) was best. However, the traditional NNs were likely to fall into local optimum when it was trained by back-propagation algorithms. In order to solve this problem, they utilized particle swarm optimization (PSO) to search for a global optimum. In their analysis, according to exit studies, they selected five features to infer travel modes: the average speed, medium speed, average absolute acceleration, travel distance, and 95th percentile speed. However, the result of distinguishing bus segments from car segments was not good when only the abovementioned speed-related features were used. To address the issue, they extracted a new feature named “low-speed point rate” and made use of the two-sample Kolmogorov–Smirnov test between bus segment and car segment to ensure the value of “low-speed point rate”. They divided the raw data randomly into two separate subsets consisting of 25% and 75% of data used for testing and training, respectively. From their results, the accuracy of mode detection in the training set is 95.81% and the mode-identification accuracy of the test set is 94.44%. Because of the relatively lower accuracy when distinguishing bus and car segments, potential features that could preferably differentiate these two segments should be added to improve accuracy.
Another machine learning method currently adopted in travel mode detection is Bayesian networks. Xiao et al. [38] indicated that most of the methods employed for travel mode detection did not describe the complex relationship between the features selected as input variables, and most of these studies did not use the confusion matrix dated from the initial classifier to improve their classifiers. Thus, they utilized Bayesian networks to detect modes based on GPS data collected in a smartphone-based travel survey from mid-October 2013 to mid-July 2014. In the authors’ analysis, they used a K2 algorithm to establish the structure of Bayesian networks and estimated the corresponding conditional probability tables with maximum likelihood methods. They extracted four features (the average speed, 95% percentile speed, the average absolute acceleration, and travel distance) to construct Bayesian networks to identify the travel modes. Based on the first confusion matrix in this paper, it is possible to make a better distinction between bike and e-bike modes as well as between car and bus modes. In order to further improve the mode-identification performance, they added two targeted features, named low speed rate and average heading change, to the feature set. According to the comparison of the results of the original and updated Bayesian networks, the updated Bayesian network has better mode-identification performance, which means these targeted features have a great effect upon improving the accuracy of travel mode detection. Even though the improved Bayesian network achieved a better result, it still has much room for improvement, such as using GIS sources, and adding potential features that could markedly distinguish bike and e-bike segments.
Similar to the abovementioned machine learning methods, random forest was used by Lari et al. [40] to classify travel modes. In their research, several valuable attributes (e.g., speed, accuracy, delta bearing, delta speed, acceleration, and delta acceleration) that might affect the output were mentioned. In order to obtain reliable and acceptable results, they selected some parameters (e.g., the number of trees and the number of attributes) to develop the random forest model. In order to ensure the accuracy of the random forest model, they randomly selected 30% of the total sample as the test set and 70% of the total sample as the training set. Based on their results, the accuracy of mode identification is 96.91%. On the other hand, two attributes, instant speed and the accuracy of the GPS track, are proven to be the most influential attributes based on mean decrease accuracy index and the Gini index. Although the accuracy of mode detection is very high, there are three main limitations of their research. First, the data error recognition procedure might be not considered comprehensively because they just used the maximum speed value to clean the dataset. These conditions should be considered, including the incomplete track points collected and the altitude of track points beyond the highest altitude of the area. High-accuracy data could possibly increase the accuracy of the random forest model. Secondly, they selected four different forests to examine, but a scientific basis for the selection is not given. Thirdly, using smartphones to collect GPS data proved that the phones have a short battery life problem (compared with dedicated GPS devices), which could affect the amount of data collection, but a solution is not given in this paper.
Stenneth et al. [43] proposed a novel method to identify a user’s travel mode based on the GPS data collected from the mobile device and external transportation network data. The novel features and the traditional features were selected to infer travel modes. The novel features consisted of average bus location closeness, candidate bus location closeness, average rail line trajectory closeness, and bus stop closeness rate. The traditional features were the average accuracy of GPS coordinates, average speed, average heading change, and average acceleration. They chose five classification models (Bayesian Net, Decision Tree, Random Forest, Naïve Bayesian, and Multilayer Perceptron) to detect modes. Based on their analysis, the mode-identification performance of these five models can be improved when increasing transportation network data. According to the comparison of recognition results of different employed approaches, the accuracy of Random Forest is the highest. The proposed approach can achieve high accuracy for detecting various travel modes, but there are two major limitations to their research. First, the amount of training data is insufficient, which could affect the accuracy of mode detection. Secondly, this study does not contain the TI procedure, which could also affect the results.
Zheng et al. [47] designed an automatic mode detection approach comprised of three aspects: a change point-based segmentation method, an inference model, and a post-processing algorithm based on conditional probability. In the inference step, the four inference models used in the experiment were Decision Tree, Bayesian Net, Support Vector Machine, and Conditional Random Field. Meanwhile, two criteria, accuracy by length and accuracy by duration, were chosen to evaluate the performance of the four mentioned inference models. From their results, the change point-based segmentation approach outperforms the uniform duration-based and uniform length-based approaches. Furthermore, as compared to other inference models, Decision Tree achieves a higher degree of accuracy of travel mode detection. However, this paper lacks the raw data preprocessing steps, such as recognizing and cleaning error data, which could have an impact on the accuracy of segment and further reduce the accuracy of identification.
A hybrid method represents a combination of different methods. A detailed description of the hybrid methods for MD in each of the selected papers is given in the next four paragraphs.
Nitsche et al. [42] found that the existing methods for detecting travel modes based on the GPS data collected by smartphones had some drawbacks, such as coping with the impact of GPS data, only distinguishing a small number of travel modes, and the need to infer trip ends of a trip chain. In order to overcome these drawbacks, they increased two types of data obtained from cellular network and accelerometer reading, and utilized an ensemble of probabilistic classifiers combined with a Discrete Hidden Markov Model (DHMM) to detect eight travel modes. They recruited 15 volunteers equipped with a smartphone with the developed logging application to collect data in the metropolitan area of Vienna, Austria over a period of two months. The recognition accuracy of different travel modes varied considerably. For instance, the detection accuracy of train and subway are 65%, while the detection accuracy for bicycles is 95%. There are some limitations in the paper. For example, they do not provide more details for data error recognition. Due to the lack of comparison between the identification accuracy of different methods based on the same data, it is hard to say that the method they proposed is better at detecting travel modes than other methods. Thus, the proposed hybrid method has much room for improvement.
Zhang et al. [44] presented a novel multi-stage method to identify travel modes. In the first stage, they used three parameters (mean speed, maximum speed, and heading related changes) to identify the three main travel modes (walking, bicycles, and motorized vehicles) on the basis of the identified segments. In the second stage, the specific travel mode (car, bus, tram, or train) was classified based on Support Vector Machines (SVMs) from the motorized vehicles class. From their results, the classification of travel mode they presented is qualitative and the accuracy is as high as 93%. In this paper, they overcome some problems and ambiguities of existing studies on travel mode recognition. For instance, they use fuzzy logic to address the problem that empirically determined valued are not always suitable for all environment and test data, and to overcome the ambiguity exists that in GPS data. However, there are two limitations in this paper. First, they do not take the incomplete GPS trajectory into account, which could affect the accuracy of segment identification and further influence the accuracy of transportation mode detection. Secondly, the amount of training data and testing data is insufficient. These issues could limit their approach to classifying the four specific travel modes.
Reddy et al. [46] presented a novel travel mode classification system consisting of a decision tree followed by a first-order discrete Hidden Markov Model. The dataset used to train and test the travel mode classification system was collected from an experiment in which 16 volunteers were asked to put 6 phones in different positions to obtain 15 minutes data of each mode. According to their results, the accuracy of mode detection is 93.6%. An important and meaningful conclusion we can come to in this research is that the position of the phone has no effect on the quality of the data collection. It should be noted that the dataset was collected from an experiment from which better data could be obtained. It is a pity that the authors did not test the novel approach on a long-time travel survey in which the quality of data would be easily influenced by signal problems.
4. Quality of Reviewed Studies
The scores of the quality of eligible articles range from 2 to 12, as shown in Table 6. According to the Table 6, 8 studies (66.7%) applied the data collected from travel surveys. Not all studies use an adequate sample size for their travel surveys. Most studies use ground truth to calculate the accuracy of travel mode detection or train classification models. Many studies (n = 7, 58.3%) took appropriate measures to recognize errors in the data. For instance, 72.7% of studies tested independent variables selection reliability in travel mode detection methods. However, none of the studies tested the independent variables selection reliability in the trip/segment identification procedure. Eight studies (72.7%) compared results with other experimental results in order to highlight the superiority of the proposed method. According to the total scores of each paper in Table 6, the highest score from the selected papers is 10 while the lowest is 3, which means there is much room for improvement.
Table 6.
Distribution of quality characteristics across reviewed studies.
5. Limitations and Strengths
The limitations in this review should be considered when explicating the current results. In the first place, the eligible articles must be published in English, which kept relevant literature published in other languages from being selected. Secondly, the included studies focused only on travel mode detection approaches, and different approaches used to identify trip purposes do not be discussed. This study had two strengths: articles were rigorously screened based on the aforementioned well-defined inclusion/exclusion criteria in six databases, and the quality of the articles included was evaluated in a standardized way.
6. Discussion and Conclusions
At present, smartphone-based GPS travel surveying, though it may still have some problems, is widely recognized as offering substantial advantages over traditional travel survey methods. The travel survey method not only increases the accuracy of travel information but also provides a chance to explore the dynamics of multi-day travel patterns. Moreover, more information about travel behavior can be offered by smartphone-based GPS travel surveys. The aim of this systematic literature review is to summarize and critically appraise the travel mode detection methodologies. To our knowledge, this review may be the first one to systematically search the eligible literature and evaluate the existing methodologies of travel mode detection based on GPS data collected by smartphone.
In order to have a strict evaluation process, this systematic review has provided a detailed discussion of GPS data processing, such as the GPS data preprocessing procedure, TI/SI procedure, and travel mode detection. The review has also carefully discussed advantages and disadvantages of the different methods used in the included articles. Although new appropriate approaches or improved methods are utilized to obtain highly accurate results, there are several research gaps in the steps of GPS data processing.
The aforementioned drawbacks of smartphone-based GPS travel surveys, such as the short battery life of smartphones, signal loss, the information of ground truth, and so on, should be taken into consideration when these surveys are conducted, because these limitations could have an impact on the accuracy of the data. It is common sense that a TI/SI procedure is undertaken before travel mode detection. Thus, the accuracy of TI/SI might highly affect the accuracy of travel mode detection. In addition, signal noise and signal loss could reduce the accuracy of TI/SI and further influence the accuracy of travel mode detection. Moreover, it is a significant step to take appropriate measures to avoid the negative impacts of drawbacks. According to the prediction results of different modes in selected papers, similar modes, such as bike and e-bike, bus and car, are difficult to distinguish. Furthermore, most researchers only use a segment or a single trip to deduce its mode. In addition, the participants recruited by researchers to take part in a travel survey have not been divided into different types based on their social attributes, such as students, workers, and so on. Different types of people have different travel patterns; the travel time, travel frequency, and mode choice patterns might be not the same for university students and workers, for instance [48,49].
Attention must be paid to ways of coping with the drawbacks of smartphone-based GPS travel surveying and improving travel mode detection methods. The accuracy of travel mode detection could be further improved, which could make smartphone-based GPS travel survey take the place of traditional travel surveys.
Acknowledgments
This research has been supported by the Six Peak of Talents Projects of Jiangsu Province (No. 2015-JY-025) and the Ministry of education of humanities and social science project, China (No. 11YJA630152). The authors would like to express their appreciation to Kobina Amo-Aidoo who modified the English grammar, and everyone who provided suggestions and comments on this paper.
Author Contributions
Linlin Wu, Biao Yang, and Peng Jing together searched for eligible papers from six databases and read the eligible papers carefully. Biao Yang wrote the paper. All authors have read and approved the final manuscript.
Conflicts of Interest
The authors declare no conflict of interest.
References
- Xiao, G.; Juan, Z.; Zhang, C. Travel mode detection based on GPS track data and Bayesian networks. Comput. Environ. Urban Syst. 2015, 54, 14–22. [Google Scholar] [CrossRef]
- Yue, Y.; Lan, T.; Yeh, A.G.O.; Li, Q.Q. Zooming into individuals to understand the collective: A review of trajectory-based travel behavior studies. Travel Behav. Soc. 2014, 1, 69–78. [Google Scholar] [CrossRef]
- Wolf, J.L. Using GPS Data Loggers to Replace Travel Diaries in the Collection of Travel Data. Ph.D. Thesis, Georgia Institute of Technology, School of Civil and Environmental Engineering, Atlanta, GA, USA, 2000. [Google Scholar]
- Shen, L.; Stopher, P.R. Review of GPS travel survey and GPS data-processing methods. Transp. Rev. 2014, 34, 316–334. [Google Scholar] [CrossRef]
- Stopher, P.; Fitzgerald, C.; Zhang, J. Search for a global positioning system device to measure person travel. Transp. Res. Part C Emerg. Technol. 2008, 16, 350–369. [Google Scholar] [CrossRef]
- Zimowski, M.; Tourangeau, R.; Ghadialy, R.; Pedlow, S. Nonresponse in household travel surveys. Available online: http://citeseerx.ist.psu.edu/viewdoc/download?doi=10.1.1.570.6554&rep=rep1&type=pdf (accessed on 9 November 2016).
- Gong, L.; Morikawa, T.; Yamamoto, T.; Sato, H. Deriving Personal Trip Data from GPS Data: A Literature Review on the Existing Methodologies. Procedia Soc. Behav. Sci. 2014, 138, 557–565. [Google Scholar] [CrossRef]
- Stopher, P.; Clifford, E.; Zhang, J.; Fitzgerald, C. Deducing Mode and Purpose from GPS Data. Available online: http://ws.econ.usyd.edu.au/itls/wp-archive/itls-wp-08-06.pdf (accessed on 9 November 2016).
- Beijing Municipal Committee of Transportation. The Fourth Beijing Comprehensive Transportation Survey Report (2012, July); Beijing Transport Research Centre, Beijing Municipal Committee of Transportation: Beijing, China, 2012.
- Bohte, W.; Maat, K. Deriving and validating trip purposes and travel modes for multi-day GPS-based travel surveys: A large-scale application in the Netherlands. Transp. Res. Part C Emerg. Technol. 2009, 17, 285–297. [Google Scholar] [CrossRef]
- Itsubo, S.; Hato, E. A Study of the Effectiveness of a Household Travel Survey Using GPS-equipped Cell Phones and a WEB Diary through a Comparative Study with a Paper based Travel Survey. In Proceedings of the Transportation Research Board 85th Annual Meeting, Washington, DC, USA, 22–26 January 2006.
- Kelly, P.; Krenn, P.; Titze, S.; Stopher, P.; Foster, C. Quantifying the Difference Between Self-Reported and Global Positioning Systems-Measured Journey Durations: A Systematic Review. Transp. Rev. 2013, 33, 443–459. [Google Scholar] [CrossRef]
- Krygsman, S.; Nel, J.H. The Use of Global Positioning Devices in Travel Surveys—A Developing Country Application. In Proceedings of the 28th Southern African Transport Conference (SATC 2009), Pretoria, South Africa, 6–9 July 2009.
- Marchal, P.; Roux, S.; Yuan, S.; Hubert, J.P.; Armoogum, J.; Madre, J.L.; Lee-Gosselin, M.E.H. A study of non-response in the GPS sub-sample of the French national travel survey 2007–08. In Proceedings of the 8th International Conference on Survey Methods in Transport, France, 25–31 May 2008.
- Oliveira, M.; Vovsha, P.; Wolf, J.; Birotker, Y.; Givon, D.; Paasche, J. Global positioning system-assisted prompted recall household travel survey to support development of advanced travel model in Jerusalem, Israel. Transp. Res. Record J. Transp. Res. Board 2011, 2246, 16–23. [Google Scholar] [CrossRef]
- Papinski, D.; Scott, D.M.; Doherty, S.T. Exploring the route choice decision-making process: A comparison of planned and observed routes obtained using person-based GPS. Transp. Res. Part F Traffic Psychol. Behav. 2009, 12, 347–358. [Google Scholar] [CrossRef]
- Rasmussen, T.K.; Ingvardson, J.B.; Halldórsdóttir, K.; Nielsen, O.A. Using Wearable GPS Devices in Travel Surveys: A Case Study in the Greater Copenhagen Area. In Proceedings of the Annual Transport Conference at Aalborg University, Aalborg, Denmark, 26–27 August 2013.
- Schnfelder, S.; Axhausen, K.W.; Antille, N.; Bierlaire, M. Exploring the potentials of automatically collected GPS data for travel behavior analysis. GI-Technol. Verk. Logist. 2002, 66, 455–456. [Google Scholar]
- Schuessler, N.; Axhausen, K.W. Processing Raw Data from Global Positioning Systems without Additional Information. Transp. Res. Rec. J. Transp. Res. Board 2009, 2105, 28–36. [Google Scholar] [CrossRef]
- Stopher, P.R.; Moutou, C.J.; Liu, W. Sustainability of Voluntary Travel Behavior Change Initiatives: A 5-Year Study. In Proceedings of the Australasian Transport Research Forum, Brisbane, Australia, 2–4 October 2013.
- Stopher, P.; Wargelin, L. Conducting a Household Travel Survey with GPS: Reports on a Pilot Study. In Proceedings of the 12th World Conference on Transport Research, Lisbon, Portugal, 11–15 July 2010.
- Vij, A.; Shankari, K. When is big data big enough? Implications of using GPS-based surveys for travel demand analysis. Transp. Res. Part C Emerg. Technol. 2015, 56, 446–462. [Google Scholar] [CrossRef]
- Wolf, J.; Hallmark, S.; Oliveira, M.; Guensler, R.; Sarasua, W. Accuracy issues with route choice data collection by using global positioning system. Transp. Res. Rec. J. Transp. Res. Board 1999, 1660, 66–74. [Google Scholar] [CrossRef]
- Zhou, J.; Golledge, R. Real-time tracking of activity scheduling/schedule execution within a unified data collection framework. Transp. Res. Part A Policy Pract. 2007, 41, 444–463. [Google Scholar] [CrossRef]
- Gong, H.; Chen, C.; Bialostozky, E.; Lawson, C.T. A GPS/GIS method for travel mode detection in New York City. Comput. Environ. Urban Syst. 2012, 36, 131–139. [Google Scholar] [CrossRef]
- Chen, C.; Gong, H.; Lawson, C.; Bialostozky, E. Evaluating the feasibility of a passive travel survey collection in a complex urban environment: Lessons learned from the New York City case study. Transp. Res. Part A Policy Pract. 2010, 44, 830–840. [Google Scholar] [CrossRef]
- Patterson, D.J.; Liao, L.; Fox, D.; Kautz, H. Inferring High-Level Behavior from Low-Level Sensors. In Proceedings of the Fifth International Conference on Ubiquitous Computing, Seattle, WA, USA, 12–15 October 2003.
- Feng, T.; Timmermans, H.J. Transportation mode recognition using GPS and accelerometer data. Transp. Res. Part C Emerg. Technol. 2013, 37, 118–130. [Google Scholar] [CrossRef]
- Rudloff, C.; Ray, M. Detecting Travel Modes and Profiling Commuter Habits Solely Based on GPS Data. In Proceedings of the Transportation Research Board 89th Annual Meeting, Washington, DC, USA, 10–14 January 2010.
- Bolbol, A.; Cheng, T.; Tsapakis, I.; Haworth, J. Inferring hybrid transportation modes from sparse GPS data using a moving window SVM classification. Comput. Environ. Urban Syst. 2012, 36, 526–537. [Google Scholar] [CrossRef]
- Byon, Y.; Liang, S. Real-time transportation mode detection using smartphones and artificial neural networks: Performance comparisons between smartphones and conventional global positioning system sensors. J. Intell. Transp. Syst. 2014, 18, 264–272. [Google Scholar] [CrossRef]
- Byon, Y.; Abdulhai, B.; Shalaby, A. Real-time transportation mode detection via tracking global positioning system mobile devices. J. Intell. Transp. Syst. 2009, 13, 161–170. [Google Scholar] [CrossRef]
- Maruyama, T.; Mizokami, S.; Hato, E. A Smartphone-Based Travel Survey Trial Conducted in Kumamoto, Japan: An Examination of Voluntary Participants’ Attributes. In Proceedings of the Transportation Research Board 93rd Annual Meeting, Washington, DC, USA, 12–16 January 2014.
- Gilani, H. Automatically Determine Route and Mode of Transport Using a GPS Enabled Phone. Graduate Thesis and Dissertations, University of South Florida, Tampa, FL, USA, 2005. [Google Scholar]
- Bierlaire, M.; Chen, J.; Newman, J. A probabilistic map matching method for smartphone GPS data. Transp. Res. Part C Emerg. Technol. 2013, 26, 78–98. [Google Scholar] [CrossRef]
- Xiao, Y.; Low, D.; Bandara, T.; Pathak, P. In Transportation Activity Analysis Using Smartphones. In Proceedings of the Consumer Communications and Networking Conference (CCNC), Las Vegas, NV, USA, 14–17 January 2012.
- Moher, D.; Liberati, A.; Tetzlaff, J.; Altman, D.G.; Group, T.P. Preferred Reporting Items for Systematic Reviews and Meta-Analyses: The PRISMA Statement. Int. J. Surg. 2010, 8, 336–341. [Google Scholar] [CrossRef] [PubMed]
- Xiao, G.; Juan, Z.; Gao, J. Travel Mode Detection Based on Neural Networks and Particle Swarm Optimization. Information 2015, 6, 522–535. [Google Scholar] [CrossRef]
- Xiao, G.; Juan, Z.; Gao, J. Inferring Trip Ends from GPS Data Based on Smartphones in Shanghai. In Proceedings of the Transportation Research Board 94th Annual Meeting, Washington, DC, USA, 11–15 January 2015.
- Lari, Z.A.; Golroo, A. Automated Transportation Mode Detection Using Smart Phone Applications via Machine Learning: Case Study Mega City of Tehran. In Proceedings of the Transportation Research Board 94th Annual Meeting, Washington, DC, USA, 11–15 January 2015.
- Yang, F.; Yao, Z.; Jin, P.J. GPS and Acceleration Data in Multimode Trip Data Recognition Based on Wavelet Transform Modulus Maximum Algorithm. Transp. Res. Rec. J. Transp. Res. Board 2015, 2526, 90–98. [Google Scholar] [CrossRef]
- Nitsche, P.; Widhalm, P.; Breuss, S.; Brändle, N.; Maurer, P. Supporting large-scale travel surveys with smartphones—A practical approach. Transp. Res. Part C Emerg. Technol. 2014, 43, 212–221. [Google Scholar] [CrossRef]
- Stenneth, L.; Wolfson, O.; Yu, P.S.; Xu, B. In Transportation Mode Detection Using Mobile Phones and GIS Information. In Proceedings of the 19th ACM SIGSPATIAL International Conference on Advances in Geographic Information Systems, Chicago, IL, USA, 1–4 November 2011.
- Zhang, L.; Dalyot, S.; Eggert, D.; Sester, M. Multi-Stage Approach to Travel-Mode Segmentation and Classification of GPS Traces. In Proceedings of the ISPRS Guilin 2011 Workshop on International Archives of the Photogrammetry, Remote Sensing and Spatial Information Sciences, Guilin, China, 20–21 October 2011.
- Gonzalez, P.A.; Weinstein, J.S.; Barbeau, S.J.; Labrador, M.A.; Winters, P.L.; Georggi, N.L.; Perez, R. Automating mode detection for travel behaviour analysis by using global positioning systems-enabled mobile phones and neural networks. IET Intell. Transp. Syst. 2010, 4, 37–49. [Google Scholar] [CrossRef]
- Reddy, S.; Mun, M.; Burke, J.; Estrin, D.; Hansen, M.; Srivastava, M. Using mobile phones to determine transportation modes. ACM Trans. Sens. Netw. 2010, 6, 662–701. [Google Scholar] [CrossRef]
- Zheng, Y.; Liu, L.; Wang, L.; Xie, X. Learning Transportation Mode from Raw GPS Data for Geographic Applications on the Web. In Proceedings of the International Conference on World Wide Web, Beijing, China, 21–25 April 2008.
- Zhan, G.; Yan, X.; Zhu, S.; Wang, Y. Using hierarchical tree-based regression model to examine university student travel frequency and mode choice patterns in China. Transp. Policy 2016, 45, 55–65. [Google Scholar] [CrossRef]
- Asad, K.; Wang, X.; Son, S.; Paul, A. Travel by University Students in Virginia: Is This Travel Different from Travel by the General Population? Transp. Res. Rec. 2011, 2255, 137–145. [Google Scholar]
© 2016 by the authors; licensee MDPI, Basel, Switzerland. This article is an open access article distributed under the terms and conditions of the Creative Commons Attribution (CC-BY) license (http://creativecommons.org/licenses/by/4.0/).