Article

Usability as the Key Factor to the Design of a Web Server for the CReF Protein Structure Predictor: The wCReF

by
Vanessa Stangherlin Machado Paixão-Cortes
,
Michele Dos Santos da Silva Tanus
,
Walter Ritzel Paixão-Cortes
,
Osmar Norberto De Souza
*,
Marcia De Borba Campos
and
Milene Selbach Silveira
Graduate Program in Computer Science—PPGCC, Pontifical Catholic University of Rio Grande do Sul (PUCRS), Ipiranga Avenue, 6681 Partenon, Porto Alegre 90619-900, Rio Grande do Sul, Brazil
*
Author to whom correspondence should be addressed.
Information 2018, 9(1), 20; https://doi.org/10.3390/info9010020
Submission received: 20 December 2017 / Revised: 11 January 2018 / Accepted: 13 January 2018 / Published: 17 January 2018
(This article belongs to the Special Issue Information Technology: New Generations (ITNG 2017))

Abstract

:
Protein structure prediction servers use various computational methods to predict the three-dimensional structure of proteins from their amino acid sequence. Predicted models are used to infer protein function and guide experimental efforts. This can contribute to solving the problem of predicting tertiary protein structures, one of the main unsolved problems in bioinformatics. The challenge is to understand the relationship between the amino acid sequence of a protein and its three-dimensional structure, which is related to the function of these macromolecules. This article is an extended version of the article wCReF: The Web Server for the Central Residue Fragment-based Method (CReF) Protein Structure Predictor, published in the 14th International Conference on Information Technology: New Generations. In the first version, we presented the wCReF, a protein structure prediction server for the central residue fragment-based method. The wCReF interface was developed with a focus on usability and user interaction. With this tool, users can enter the amino acid sequence of their target protein and obtain its approximate 3D structure without the need to install all the multitude of necessary tools. In this extended version, we present the design process of the prediction server in detail, which includes: (A) identification of user needs: aiming at understanding the features of a protein structure prediction server, the end user profiles and the commonly-performed tasks; (B) server usability inspection: in order to define wCReF’s requirements and features, we have used heuristic evaluation guided by experts in both the human-computer interaction and bioinformatics domain areas, applied to the protein structure prediction servers I-TASSER, QUARK and Robetta; as a result, changes were found in all heuristics resulting in 89 usability problems; (C) software requirements document and prototype: assessment results guiding the key features that wCReF must have compiled in a software requirements document; from this step, prototyping was carried out; (D) wCReF usability analysis: a glimpse at the detection of new usability problems with end users by adapting the Ssemugabi satisfaction questionnaire; users’ evaluation had 80% positive feedback; (E) finally, some specific guidelines for interface design are presented, which may contribute to the design of interactive computational resources for the field of bioinformatics. In addition to the results of the original article, we present the methodology used in wCReF’s design and evaluation process (sample, procedures, evaluation tools) and the results obtained.

1. Introduction

Bioinformatics is a multidisciplinary research field [1,2,3,4], born from the use of computational tools for the analysis of genetic, biochemical and molecular biology data. It involves the union of computer science, mathematics, statistics and molecular biology [5]. It is in this context that the area grows exponentially [6,7,8,9]. Studies [7,9,10,11] indicate a growth in the supply of computational resources in support of the area. Nucleic acids’ research presents a series of tools, like biological databases (database issue, https://nar.oxfordjournals.org/content/44/D1.toc ) and web-based software resources (web server issue, https://academic.oup.com/nar/issue/44/W1). In addition to these resources, the ExPASy (Bioinformatics Resource Portal, https://www.expasy.org/resources) Portal provides access to approximately 350 bioinformatics tools, including proteomics, genomics, phylogeny, systems biology, population genetics and transcriptomics, among others. However, the availability of computing resources is not synonymous with the ease of use. Theoretical and empirical research reports demonstrate usability problems in various bioinformatics systems. Studies [9,11,12,13,14,15,16,17,18,19,20] point out usability limitations in bioinformatics tools such as difficulties related to the high workload required to access information and having to use command line interfaces, commonly used in bioinformatics. Pavelin [21] highlights navigability issues at interfaces. Rutherford [22] points out that there is a great learning curve due to the complexity required to perform simple tasks.
Considering that how people perceive and interact with bioinformatics tools can influence the understanding of the data and the results of the analysis [16], the study of the factors that affect users’ experiences in the use of interactive biological systems is essential [9]. Thus, usability should be a persistent concern in bioinformatics systems given the amount of information they need to handle and visualize using several tools with many different capabilities [17].
It is fundamental to provide an adequate and efficient interface so that the scientists can have access to the contents of the knowledge bases. Studying usability issues is something of profound value to researchers who are increasingly dependent on these interfaces [22].
The Web Server for the CReF Protein Structure Predictor (wCReF) is an automated web server for computational prediction of three-dimensional protein structures. It was developed as an alternative to facilitate the use of the CReF [23,24,25] method by the users, since the method did not have a graphical user interface that was efficient and having good usability. Its execution was done locally, by command line, and it was available only on the Linux platform. We designed a web application aimed at guaranteeing greater access to users, eliminating the need to use a specific operating system or running the predictor locally. Therefore, wCReF works as a server for exchanging information where the user inputs the data of interest, i.e., the target protein, and wCReF processes and returns as a result the approximate 3D structure of a protein.
This article is an extended version of the article titled wCReF—The Web Server for the CReF Protein Structure Predictor, accepted at the Information Technology Conference—New Generations—ITNG 2017 [26], where we describe the creation process behind wCReF and discuss usability issues considered in its design and identified during the assessment with Human-Computer Interaction (HCI) and bioinformatics experts and end users. This release also describes the wCReF design process in detail:
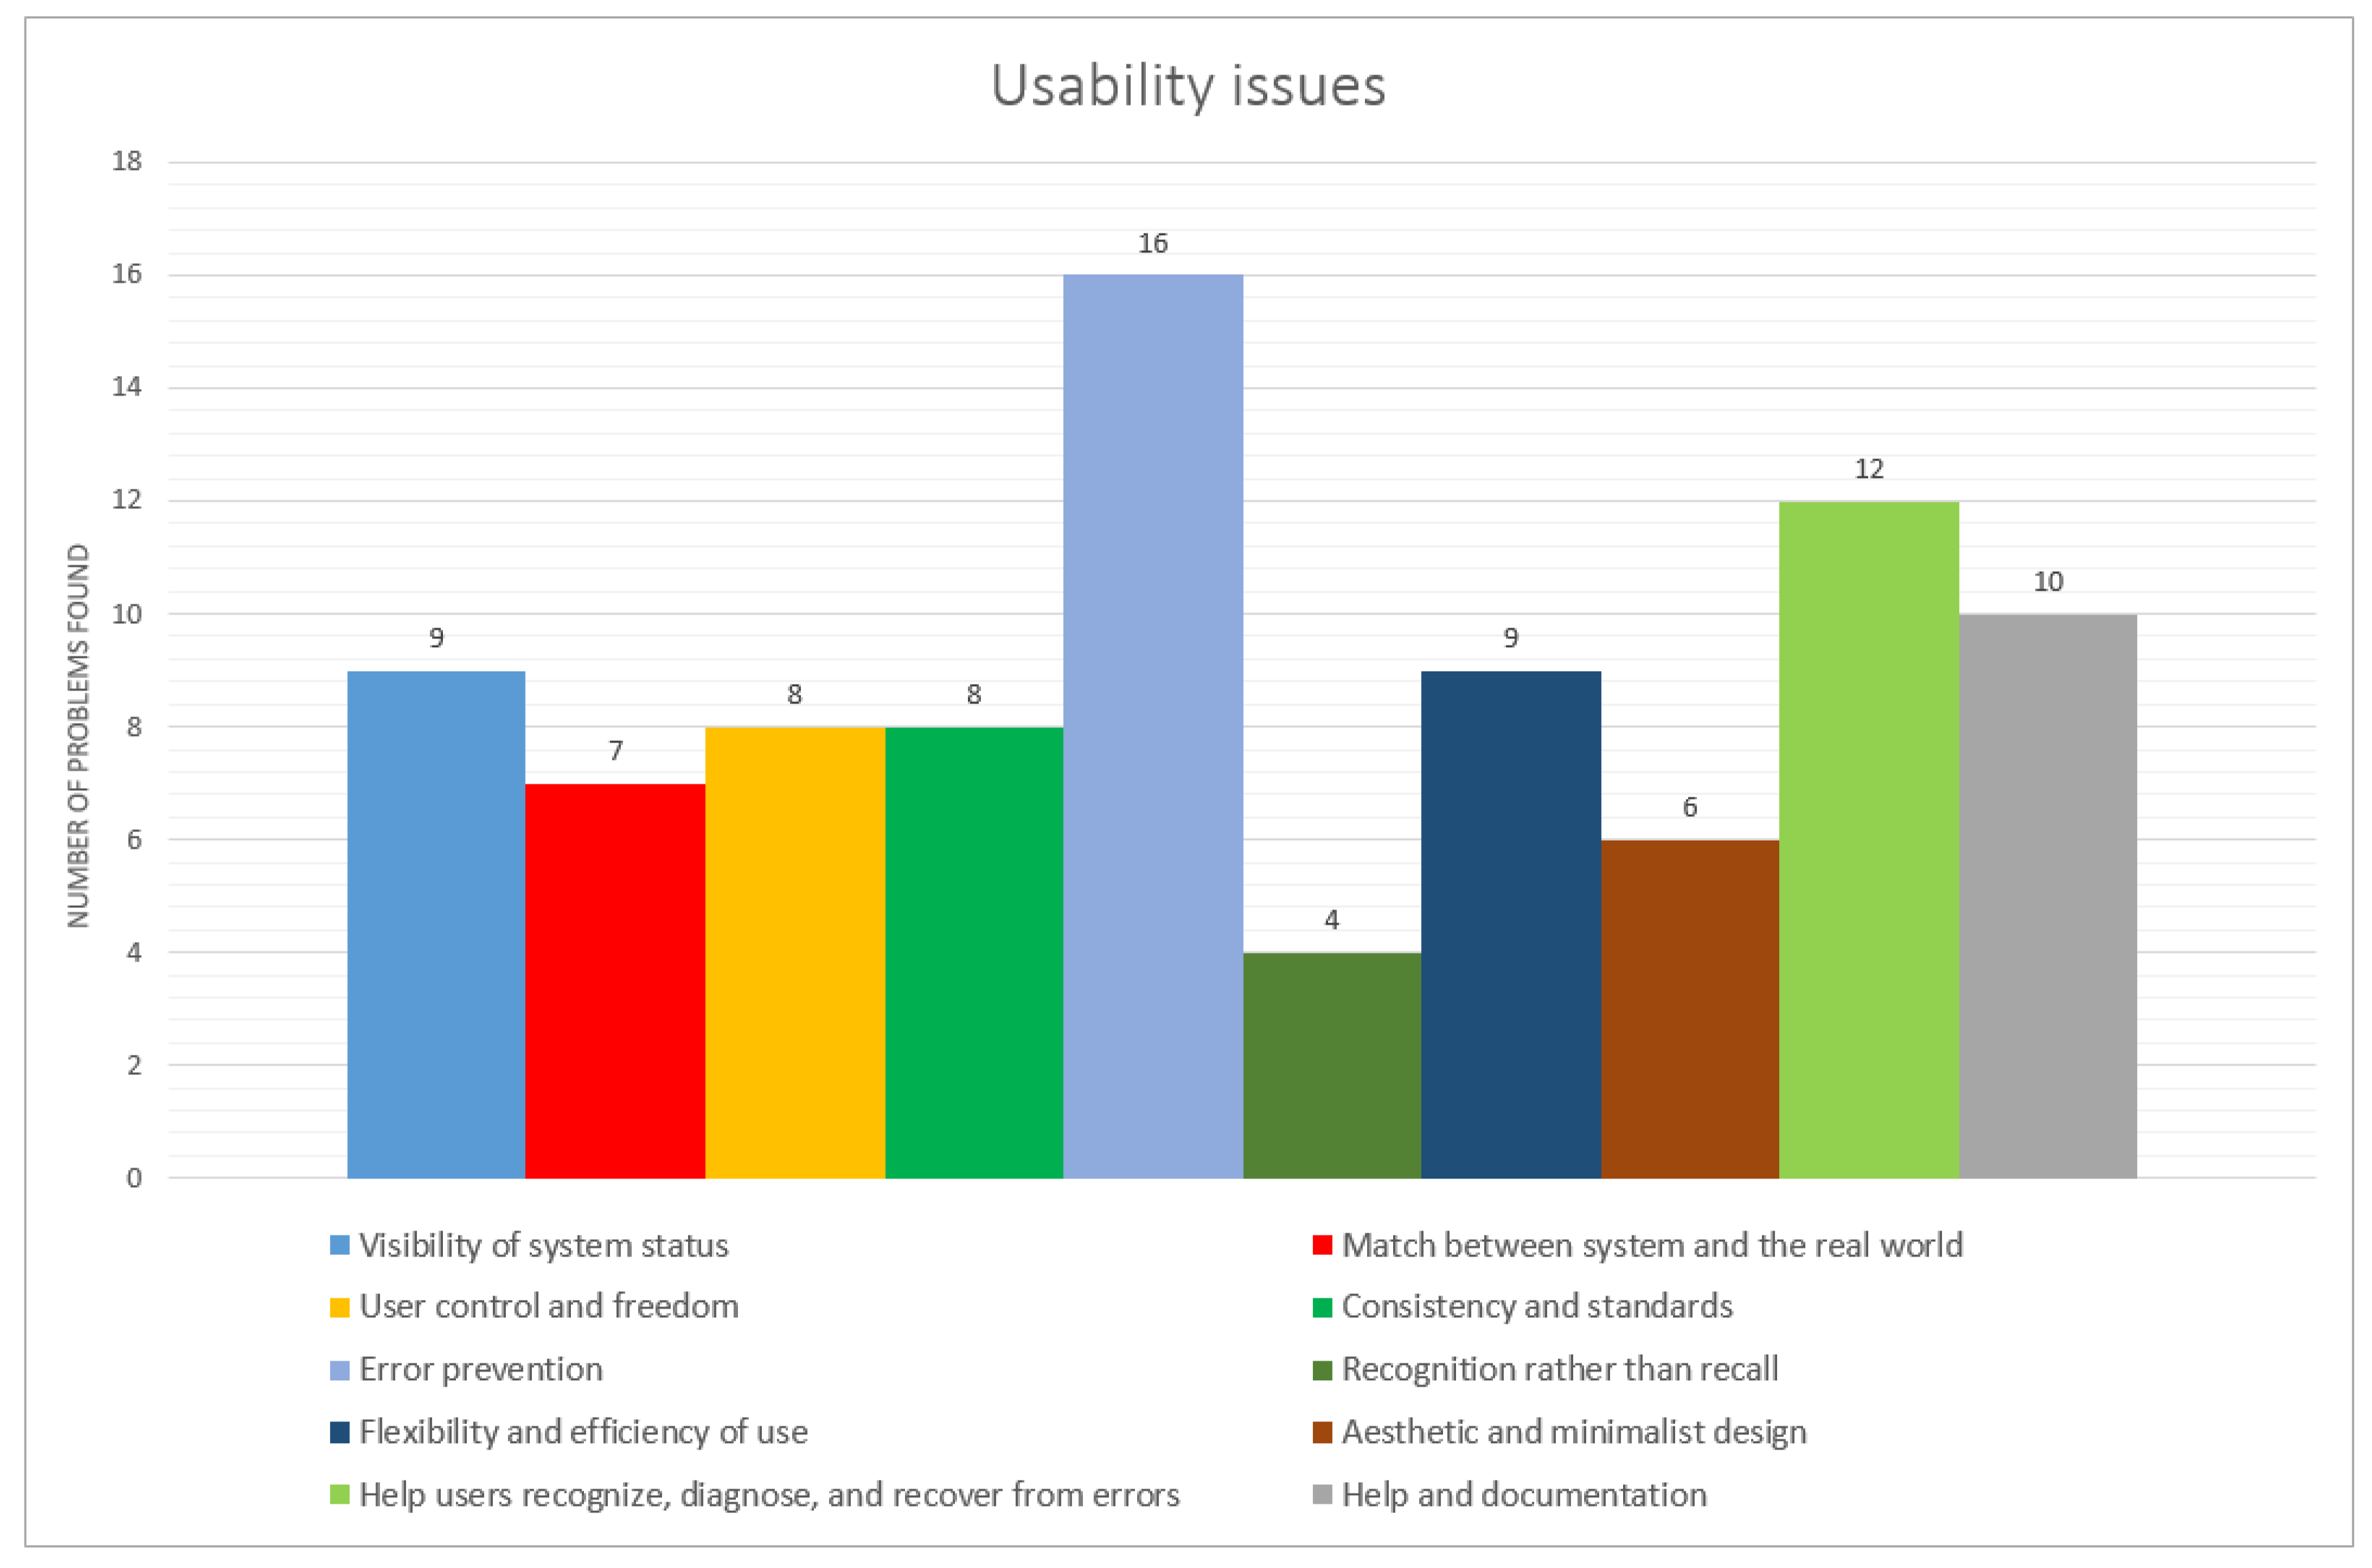
  • Requirements definition: To define the requirements for its development, usability evaluations were conducted. They were guided by experts on both the human-computer interaction and bioinformatics domain areas, in three protein structure prediction servers—I-TASSER (Iterative Threading ASSEmbly Refinement) [27,28], QUARK (Computer Algorithm for Ab Initio Protein Structure Prediction and Protein Peptide Folding) [29] and Robetta [30]—all participants of the CASP (Critical Assessment of Protein Structure Prediction) competition. The inspections were conducted through the heuristic evaluation method using Nielsen’s 10 heuristics. Violations were found in all heuristics resulting in 89 usability problems. They were classified into 5 severities, 29 scored as being of high priority and 25 as problems to be solved immediately.
  • Results analysis: The assessment of results, to serve as an orientation guide for the key features that wCReF, must be compiled in a software requirements document for its implementation.
  • Prototyping: From this step, prototyping was carried out, which helped with the detection of new usability problems with end users by adapting the Ssemugabi satisfaction questionnaire.
This article presents the methodology involved in the construction and evaluation process of wCReF (sample, procedures, evaluation tools) and the results obtained. Finally, some specific guidelines for interface design are presented, which may contribute to the design of interactive computational resources for the field of bioinformatics.

2. Background

Protein structure prediction servers are automated tools where the user provides as input the sequence of the target protein and the execution parameters, obtaining as a result the three-dimensional model of the protein, which is then used to infer its function and guide experimental efforts [30].
These servers use different computational approaches to predict the spatial conformation from the amino acid sequence or primary structure. The objective is to understand how the amino acid sequence of a protein and its three-dimensional structure are related to each other and how this relationship helps to determine the function of these macromolecules. Anfinsen’s experiments [31] suggested that the information necessary for the formation of a protein’s structure is encoded in its sequence, and the question of predicting these structures has become one of the biggest research challenges today.
Thus, scientists continue to develop tools for predicting the structure with increasing accuracy [32]. However, researchers have not achieved a universal solution to the problem of protein structure prediction (Protein Structure Prediction problem (PSP)).
Despite the progress in the experimental determination of the three-dimensional structures of proteins, the number of predicted structures did not keep pace with the explosive growth of sequence information [33], since the elucidation of sequences is a relatively simpler task compared to predicting 3D structures of proteins [34]. This leads us to the fact that there are 1000-times more sequences than structures, and there is not a variety of methods that can predict the three-dimensional structures of proteins [35]. Thus, the difference between the number of sequences and proteins with known structures or functions continues to increase at an exponential rate [36].
Therefore, the development of computational methods to predict 3D structures from sequences is a way to solve this problem [37]. These methods can also be used to fill the gap between the large amount of sequence data and the unknown properties of these proteins [38].
Among the methods related to protein structure prediction is CReF (Central Residue Fragment-based Method) proposed by Dorn and Norbert Souza [23] for the prediction of proteins or polypeptides’ approximate 3D structure.
The CReF method presented good results in the prediction of protein structures, demonstrating scientific potential for further studies and applications [23,24,25,39].
Despite the promising results, this method did not have a user-friendly interface. Its execution was performed locally, and it was available only for the Linux platform and required the installation of several software dependencies, such as Torsions (http://www.bioinf.org.uk/software/torsions/), Weka (https://www.cs.waikato.ac.nz/ml/weka/) and Amber (http://ambermd.org/), among others. Furthermore, you needed to change some parts of the source code. Due to these factors, the method was difficult to use by less experienced users, and its application was restricted to the installation site.
In order to automate the method, facilitate its use and make it available to users, a web server for predicting protein structures has been developed: wCReF [26].
With this tool, the users can enter the amino acid sequence of a target protein and obtain the approximate 3D structure of a protein in an automated manner without the need to install additional tools.

Protein Structure Prediction Servers

The tendency of the use of prediction servers has been observed when analyzing the CASP (Critical Assessment of Techniques for Protein Structure Prediction) program, initiated in 1994 by the group of J.Moult, where biannually, protein prediction techniques are evaluated [40]. Its last edition occurred in 2016 with 191 participating research groups (CASP11).
CASP is a “blind” competition where the scientific community tries to predict the 3D structure of proteins whose structures are known, but not yet available to the public. Target sequences are available to research groups from around the world. Each participant group applies some method or algorithm in order to predict the structure of the target proteins, which in the end are revealed and evaluated by CASP.
Many of the computational methods used by these scientists are made available via the web as a server for predicting protein structures. These prediction servers use different computational approaches to predict the three-dimensional structure of proteins from their amino acid sequence.
These predictions are performed faster than experimental methods and are obtaining more and more models of 3D structures with good quality and accuracy. The obtained models are used to infer the function of the protein and guide the experimental efforts, contributing in the field of research as a whole [30].
Examples of prediction servers, described in the literature and presented in CASP, are Rosetta, known as server Robetta [30], I-TASSER [27,28] and QUARK [29].
We can observe (Table 1) that the participation of prediction servers of 3D protein structures in CASP has increased since the first editions (source: http://predictioncenter.org/).
However, protein function prediction is an open research problem, and it is not yet clear which tools are the best for predicting the function of a macromolecule. At the same time, critically evaluating these tools and understanding the landscape of the function prediction field is challenging [41].

3. wCReF

3.1. Algorithm

The Central Residue Fragment method (CReF) applies data mining techniques to the Protein Data Bank [42,43] in order to predict a protein’s backbone torsion angles [23].
CReF does not make use of entire fragments, but only the phi and psi torsion angle information of the central residue in the template fragments obtained from the Protein Data Bank (PDB) [23]. After applying clustering techniques to these data and guided by a consensus secondary structure prediction of the target sequence, we build approximate conformations for the target sequence [23].
The algorithm performs the following steps:
  • Fragments the target sequence using a sliding window with an odd number of residues. For each fragment, go through Steps 2 to 5 to predict its central residue dihedral angles.
  • Performs a BLAST [44] search using the target fragment as the query and obtains the top scoring matches to use as templates.
  • Uses the k-means algorithm to cluster the templates’ central residue torsion angles ( ϕ and ψ ) and the secondary structure prediction of the target sequence.
  • Uses the selected cluster’s centroid as the central residue torsion angles.
By setting the fragment size and BLAST parameters, such as the substitution matrix and gap penalty, the user is able to fine-tune the prediction process and outcome. The prediction library has a REST API that interfaces with wCReF. When a new prediction is submitted through wCReF’s interface, it is added to a task queue. Workers will then retrieve items from the queue, making the prediction process scalable. The API also allows querying a given task’s status and retrieving the prediction results.
wCReF users obtain approximate 3D structures, which can then be used as starting conformations in refinement procedures employing state-of-the-art molecular mechanics methods such as molecular dynamics simulations [23]. The method is very fast. Dorn’s paper [23] illustrates its efficacy in three case studies of polypeptides whose sizes vary from 34–70 amino acids. As indicated by the Root-Mean-Square Deviation (RMSD) values, the initial results show that the predicted conformations adopt a fold similar to the experimental structures. Starting from these approximate conformations, the search space is expected to be greatly reduced and the refinement steps can consequently demand a much reduced computational effort to achieve a more accurate polypeptide 3D structure [23].

3.2. Implementation

3.2.1. Preparing the CReF Environment

Using the instructions provided by CReF documentation, the first step in implementing wCReF was to build an environment where CReF could run with no issues. The difficulties in doing that, depending on your familiarity with this type of task, reinforce the need for an easy-to-use interface. This step also updated the documentation, describing more thoroughly the server’s installation process and usage.

3.2.2. Deciding the Architectural Model

Considering that CReF was an existing method, capable of running standalone, we have decided that wCReF would be a web interface, serving two purposes: the first being to provide a friendly graphical user interface to execute the method and the second to serve as a gateway for more information about the CReF method. The web interface would be the first element to increase the usability. The last aspect considered on the architecture was that CReF, as it was, could be used by one person at a time, as it did not have any mechanism to allow multiple executions. Therefore, a service layer was designed, with task scheduling capabilities that allow multiple executions to be queued and executed.

3.3. The Design Process

Usability seeks to ensure that systems are easy to learn to use, effective and enjoyable [16]. Usability barriers can directly influence user satisfaction, leading to extra time to understand the system and interact with it. These questions become more complex when there is a wider range of user profiles, such as in the bioinformatics field. Despite this, usability seems not to be considered as crucial by many protein structure prediction servers, resulting in hard to use interfaces and users getting lost in obtaining the results. To avoid this in wCReF, we follow the guidelines of [45,46], which direct us to identify usability problems as soon as they can be detected. For this, two previous steps have been carried out:
  • Identify users’ needs: to understand the features of a protein structure prediction server, the end user profiles and the commonly-performed tasks. wCReF’s interface considered both expert and novice users in the bioinformatics field.
  • Server usability inspection: in order to define wCReF’s requirements and features, we have used Nielsen’s 10 heuristics from the heuristic evaluation [47,48].

3.3.1. Identify Users’ Needs

In order to know the users and their tasks, we sought to understand the features of a 3D protein structure prediction server, what is the profile of the end users and which tasks are commonly performed. As a first step, experts from the Laboratory of Bioinformatics, Modeling and Simulation of Biosystems (LABIO) were consulted to know what tasks are often performed by a user who wishes to submit an amino acid sequence to a prediction server. The result helped to define which activities should be performed by the specialists during the evaluation. This aimed at facilitating the use of prediction servers, especially by those evaluators who are not experts in bioinformatics. In addition, assessment guidelines were passed by the assessment leader via email, in a tutorial format. Nine tasks were defined as a common scenario for users using this type of system:
  • Register as user (prediction servers usually require registration).
  • Log in with the credentials. Change password or update personal information.
  • Find out how to input data to perform the prediction.
  • Send the sequence of a target protein for prediction.
  • View the prediction queue.
  • Modify the parameters for prediction (if available) and perform a new send.
  • Check if the server returned the expected data.
  • Check if it has documentation, help and bibliographical references.
  • See if the results are easy to access and understand.

3.3.2. Server Usability Inspection

In this evaluation step, three CASP participant servers predicting 3D structures of proteins were inspected: I-TASSER, QUARK and Robetta (Table 2).
Each inspector evaluated the three servers, trying to identify, in his/her interface, problems that violated any of the 10 Nielsen heuristics: visibility of system status; match between the system and the real world; user control and freedom; consistency and standards; error prevention; recognition rather than recall; flexibility and efficiency of use; aesthetic and minimalist design; help users recognize, diagnose and recover from errors; and help and documentation [47,48]. The evaluators traversed the interface several times, inspecting the various dialog elements, comparing it to the heuristics list. We recommended that they inspect the interface at least twice and suggested that the first step be the general analysis of the system, in which the evaluator would freely analyze the interface seeking to know it. Then, make a second pass, which should allow the evaluator to focus on specific interface elements and know how they fit into the whole.
As commonly-used applications in the field of bioinformatics are developed by both computer scientists, programmers, biologists and scientists, it was defined that the evaluators would be from different areas of knowledge, both specialists in the area of human-computer interaction and the domain area, so the problems encountered would be different. Since the prediction servers are not part of the domain of HCI experts, it was necessary, in this research, to create a tutorial on how to use a protein framework prediction server. For this task, four (4) expert evaluators were chosen (Table 3) and an evaluation leader. All the evaluators received the informed consent form.
We believe that heuristic evaluation is an efficient method for this purpose, since it is inexpensive and quick to identify usability problems and also applicable to bioinformatics tools [15]. Only after all evaluations were completed, the results were aggregated. This process is important in order to ensure independent and impartial evaluations of each evaluator [47]. In the end, all the problems encountered in the heuristic evaluation were put together in a single document. All reviewers were given a form with guidelines on how to conduct the heuristic evaluation, with support of HCI specialists to understand the tasks, as well as an electronic form to fill out usability errors that violate the principles. Each problem found and specified should also contain a degree of severity (from zero to four) according to the Nielsen classification (Table 4).
Only after all individual assessments were completed, the results were consolidated by the assessor. This process is important in order to ensure independent and impartial evaluations of each inspector [22]. Due to the availability of experts’ time for a single meeting, parallel conversations were held in order to lessen any doubts. A total of 89 heuristics was found to have been violated, in the three servers evaluated according to (Table 5).
The I-TASSER server was the one that presented the least errors, with 18 in total, Robetta with 26 problems pointed out by the specialists and the server QUARK, which was evaluated by the inspectors (A, B and C), with 24 errors, to which were added 21 errors from Inspector D, totaling 45 errors. Inspector D was unable to complete the evaluation of the other two servers in time. However, his opinion regarding the QUARK server as a specialist in the IHC area was important because he detected 21 usability errors in this interface. We can observe in Figure 1 that the two heuristics that were most cited in the evaluations were error prevention and helping users to recognize, diagnose and recover from errors.
Usability errors were found for all heuristics defined by Nielsen. The Evaluation Lead compiled the results presented in the evaluations into a single document. In addition to the two heuristics mentioned previously referring to system errors, most usability problems that occurred were related to:
  • Visibility of system status: There was a lack of information about where the user was in the interface. Navigation information such as the selected menu or navigation map was not available.
  • Flexibility and efficiency of use: errors regarding user registration on the server, submission of a protein and also on saving the results of the prediction.
  • Recognition instead of reminder: Problems occurred such as links with system instructions opened in other pages of the browser, and this was not visible on the same page.
  • User control and freedom: The user must be able to return to the initial state after being in an unwanted state (undo and redo). This did not happen. Although systems present this possibility, the relative functionalities were not working or errors occurred during their execution.
  • Consistency and standards: System design errors do not follow basic interface patterns following system standards. On one of the servers, for example, the menu in different parts of the system switches location (Figure 2).
One of the most frequent errors found in the heuristics was related to the error messages presented in the interfaces of the evaluated servers, as observed in the comments:
  • “Error messages should be highlighted in a standard format next to the error that occurred.”
  • “There are red messages in the text. Although important, warnings could be presented in a different way so as not to distract users.”
  • “Standardize error warnings. Errors appear in different forms in the interface, in other windows, or in text format equal to other information, such as required fields.”
  • “In case of errors there is no possibility to return to the initial state.”
  • “Errors do not have different colors or symbols in order to get the user’s attention.”
  • “It should be possible to cancel the prediction request. In an evaluation the user sent a wrong submission, the system did not detect it and the user could not send another request until the first one was processed.”
  • “Error messages do not follow a pattern. Some open in a new browser window, in text format, without buttons for confirmation or return to the previous state. The messages should appear on the same screen as the error, as it is usual on any operating system.”
For example, we present a problem found in one of the interfaces (Figure 3). The error message opens in another browser page, being displayed outside the place where the error occurred, and there is no confirmation to check if the user understood that an error occurred, making it difficult to return to the previous state without losing information. Additionally, when the user clicks the link “Back to Home”, it returns to the home page of the search group, not to the server home page, making it confusing.
In addition to finding heuristics violations, each evaluator defined the degree of severity for every usability problem (Figure 4). The greater the number and degree of severity of the problems found, the lower the usability of the interface, and vice versa [49]. As we can see in Figure 4, more than half of the errors were considered to be serious and catastrophic, which in the opinion of the evaluators should be corrected, since they are extremely important for the operation of the interface. According to the experts, 31% of the errors are simple and do not need to be adjusted immediately, 33% were considered serious (high priority for fixing) and 28% catastrophic, thus demonstrating how the usability of these systems needs to be studied and improved. The problems classified as cosmetic and unimportant were 8%. Although systems are recognized, functional and extremely useful to the scientific community, usability elements need to be improved.
In the heuristic evaluation of the prediction server interfaces, the differences between the IT/HCI specialists and those who are scientists in other areas (biologists, chemists, physicists) in the way they understand these interfaces became evident, as expected. We can see that users of bioinformatics tools are highly focused on obtaining the results from the tools, so they tend to forgive certain shortcomings of the interfaces as long as they get their results. Another point to note is that the developers of such tools are often not in the area of computing and, therefore, have no training on the development of quality software with respect to the interface. In order to demonstrate this, we will compare the answers of Evaluators A, B and D on the problems presented in the submission of the sequence. Specialist A in the area of bioinformatics classified the errors as cosmetic and simple:
  • “The server does not allow the modeling of amino acid sequences smaller than 20 and greater than 200.”—Simple (Specialist A, bioinformatics)
  • “When the user inputs the amino acid sequence, the server should check the input’s size and format and indicate any irregularity. Currently this verification is only performed after submission.”—Cosmetic (Specialist A, bioinformatics)
On the other hand, the evaluators of the HCI area classified this problem as catastrophic:
  • “I changed the amino acid sequence by removing special characters and the system only validated the email. I could not perform the task.”—Catastrophic (Specialist B, HCI)
  • “There are no error messages when an incorrect protein sequence is pasted.”—Catastrophic (Specialist D, HCI)
For example, in the evaluation of the QUARK server, in terms of heuristics “help users to recognize, diagnose and recover errors”, Bioinformatics Specialists A and C did not detect any problems. Expert B has detected four violations:
  • “In the email field it is stated that an academic email must be used. However, I made up an email address and it was accepted ... I submitted it again using @hotmail email and it was detected. That is, this control seems to exist for a list of known mail servers. If there is no way to define what is academic and what is not, there should be no such restriction.”—Catastrophic (Specialist B, HCI)
  • “I changed the amino acid sequence, removing some symbols, and the system simply returned information about the email.”—Catastrophic (Specialist B, HCI)
  • “There is a lack of information on the limitation of generating one job at a time, until the pending one is finished.”—Catastrophic (Specialist B, HCI)
  • “There is no information on why it is necessary to use an academic email. If the user does not have it, he cannot use that server.”—Catastrophic (Specialist B, HCI)
In this way, we can see that the users of bioinformatics tools are users that are extremely focused on the results to be obtained from the tools, so they tend to forgive certain deficiencies of the interfaces, as long as they obtain their results. This behavior is visible in the results obtained, since the evaluators most closely involved with the area of bioinformatics found few errors and considered them not so relevant, whereas specialists in usability and HCI found many more mistakes, considered serious and catastrophic.

4. wCReF Usability Analysis

Based on the previous steps, we defined software requirements for the development of a prototype, which was evaluated by a method of observation, carried out directly with the end users. The methodology used in each of these steps is described in the following sections.

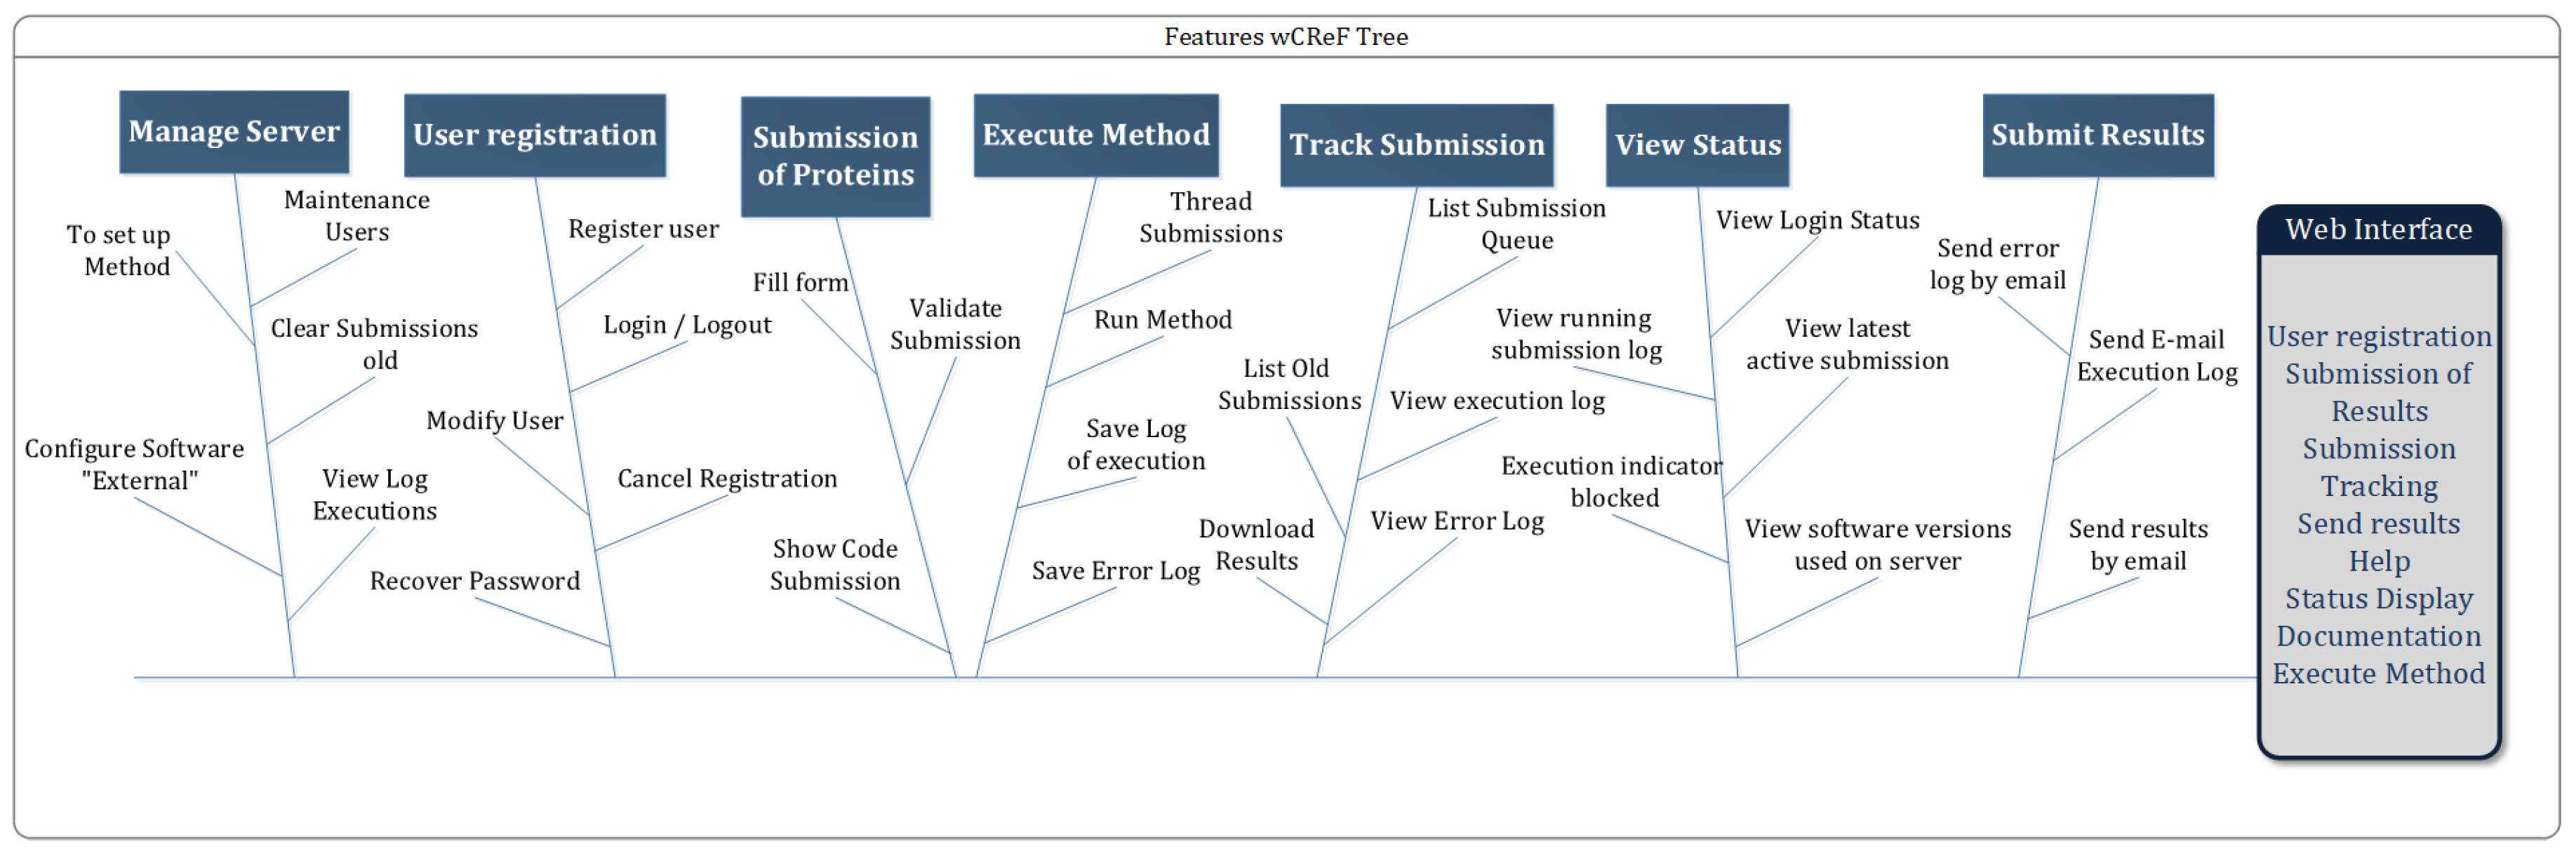
4.1. Software Requirements Document and Prototype

In the modeling of interfaces, there are two essential phases: specification of requirements and prototyping [50]. Preece et al. [46] define that requirements consist of a statement about the intended product that specifies what it should do or how it should operate. The software requirements of the wCReF interface were based on the heuristic evaluation and complemented by suggestions from the LABIO team members who participated in the project. Its specification took into account the functionalities of the system regarding usability for its users. Functional requirements have been defined (Figure 5), which describe what the system should do.
The Non-functional requirements indicate the limitations of the system in its development [46]:
  • Security requirements: Only the system administrator can configure.
  • The application layer for web compatible browsers (Internet Explorer, Firefox, Internet Explorer).
  • Reliability requirements: The system must be available 24 h a day, seven days a week. Because it is not a critical system, the system may be out of order until some fault that may occur is corrected.
  • Performance requirements: Although not a core requirement of the system, it should be considered as a software quality factor, since bioinformatics users often need rapid results in their research.
  • Hardware and software: As it is a Web application it must be accessed by any browser that is connected to the network (Internet), the necessary hardware and software not being defined here.
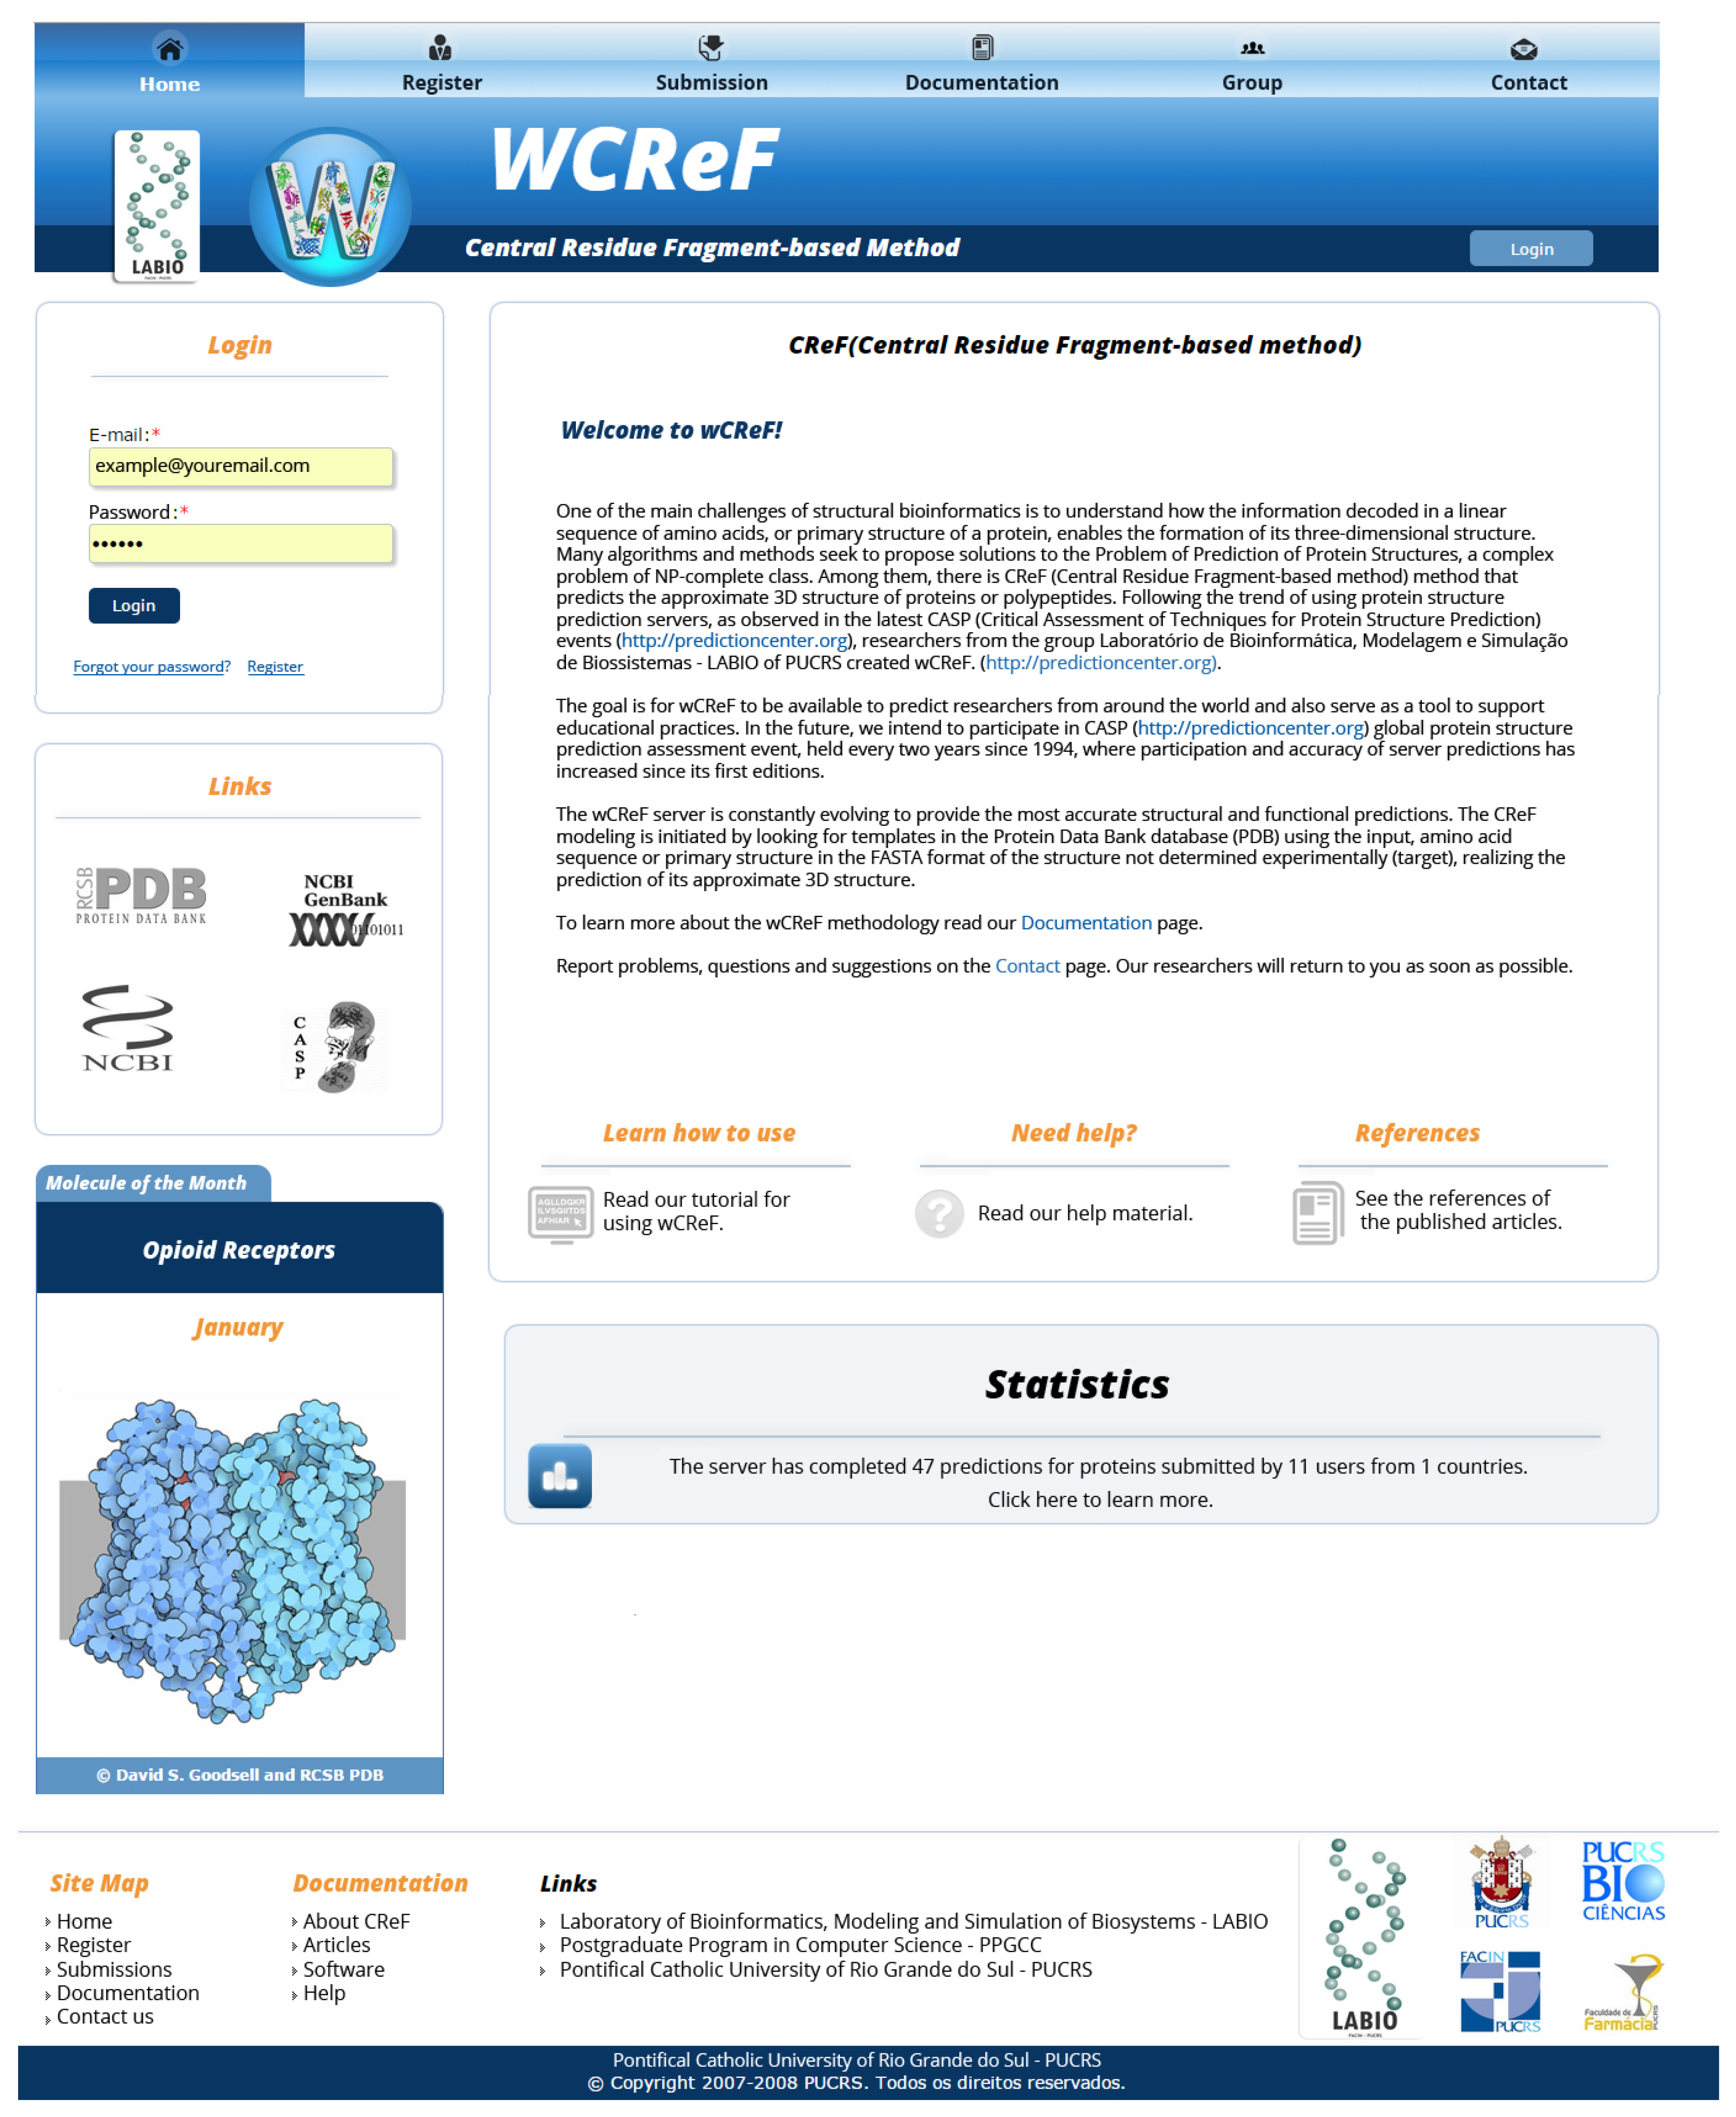
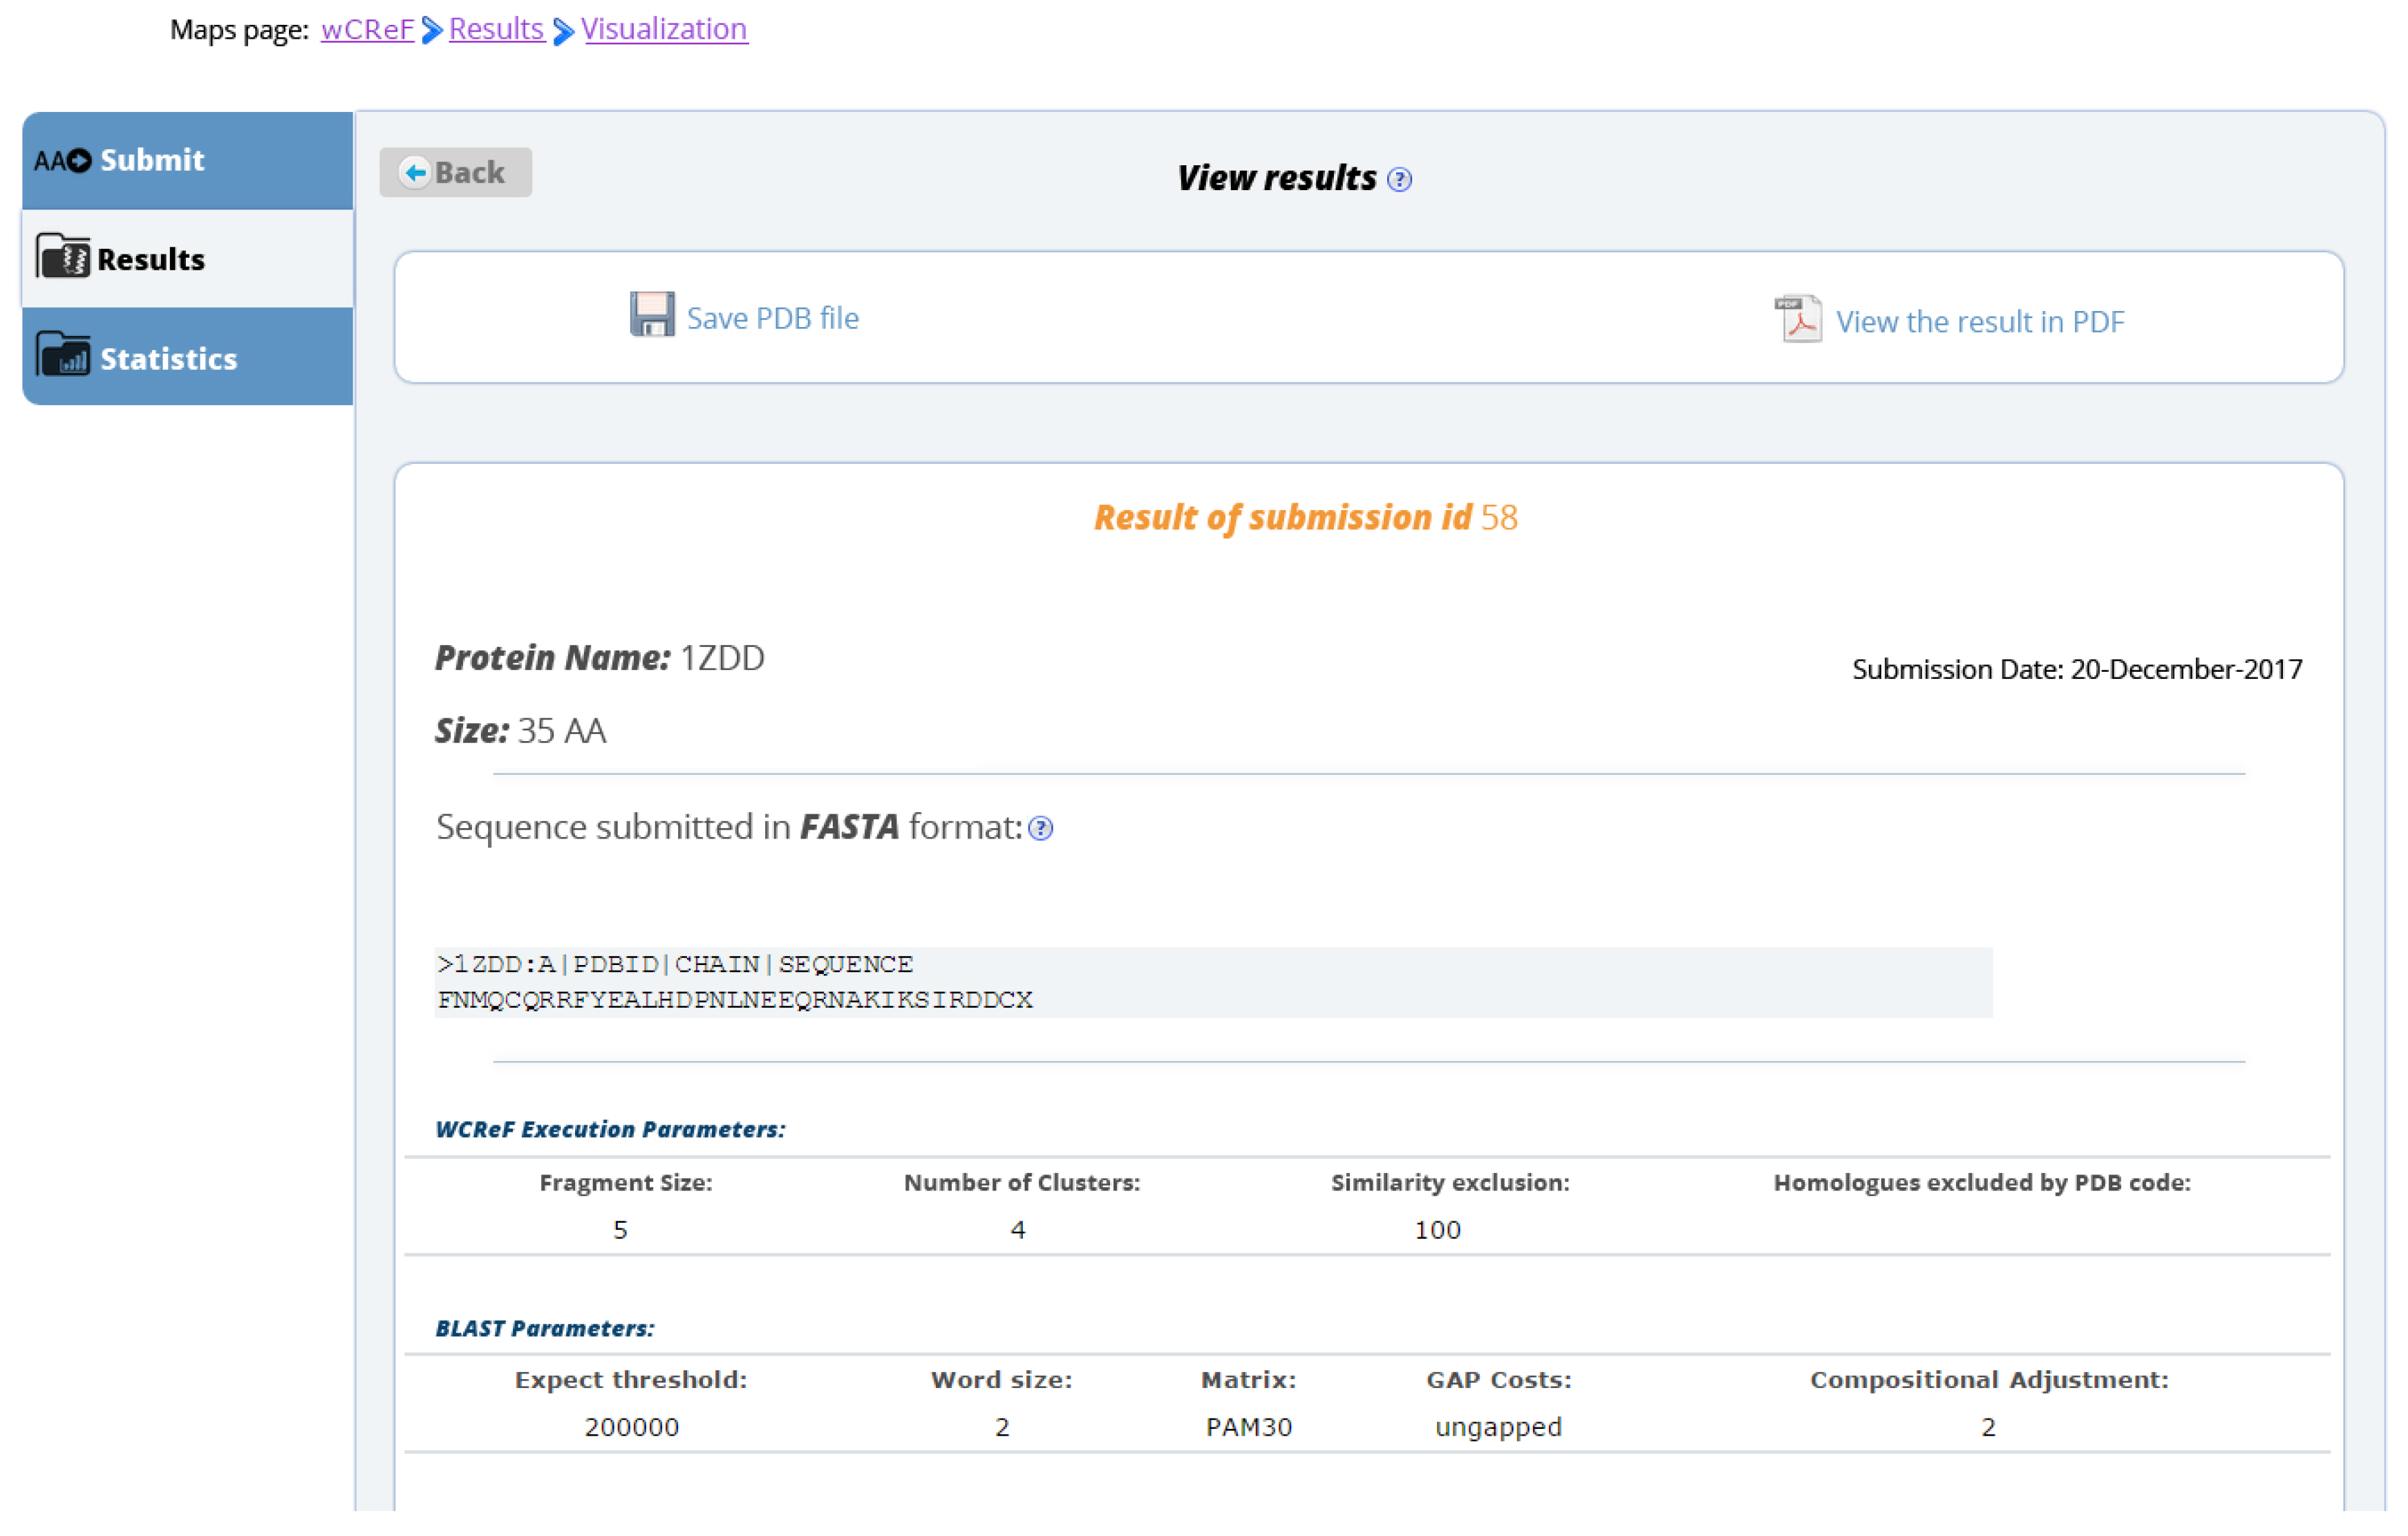
From the definition of the requirements of wCReF, a prototype of high fidelity was developed using HTML5 (Hypertext Markup Language), CSS (Cascading Style Sheets), Flask (http://flask.pocoo.org/) and MySQL (https://www.mysql.com/).
As the wCReF interface is independent of the prediction method, any changes in CReF do not change the web interface. The database, the HTML and CSS and page templates do not change if the method undergoes changes, which facilitates updates and maintenance.

4.2. User Interface

The wCReF has a common area for all users (Figure 6), with public access and an area that is only accessed when performing log-in, to make predictions and track the results.
The public pages are composed of the server home page, where general information is presented, as well as external links and information on the research group. In addition to the home page, there are the following pages: user registration, submissions, documentation, staff and talk to us. We emphasize that the submissions page displays all the submissions made in wCReF, but the only available information is the general status of each submission. To follow the result, the user needs to log into the system.
The private pages’ content is unique to each user and can be accessed through the wCReF sign-in system. It has the main screen for submission, the submissions status page and the results page. Users can submit a prediction, access and view the results and access statistics. It also has a user profile page for the registered user.
To send a protein prediction request for a target protein, the user must enter the name of the protein to be predicted, the query sequence in FASTA format and optionally modify certain parameters. They can be of two types: the parameters related to wCReF implementation and the parameters used in the BLASTp (https://blast.ncbi.nlm.nih.gov/Blast.cgi?PAGE=Proteins) execution, all described in Table 6.
In the submissions page, users can track their predictions, almost in real time. As the users send their jobs, they will be added and presented with the submission number, ID, name of protein, size (number of amino acids) and date of submission. The progress status of the prediction on the server (which the CReF step is running) is also given and, finally the result, with the option to be redirected to the results page or delete it.
The results page summarizes all the information about the prediction, including the input sequence, the prediction of the secondary structure and the predicted three-dimensional structure. wCReF has a molecular viewer embedded on the results page. Figure 7, Figure 8 and Figure 9 show sections of wCReF results page. For this example, we have used the 1ZDD protein [51]. There is an option to print the results in PDF or download in PDB format.
At the end of the wCReF preview page, the approximate 3D structure can be viewed in different ways (Figure 9). The visualization software used in wCReF is iView, an interactive viewer of three-dimensional structures of molecules based on WebGL [52]. Its components are connected to the wCReF interface through HTML code.
The wCReF preview page generates the image of the secondary structure with POLYVIEW-2D [53] and displays the approximate 3D structure with iView automatically, not requiring any installation or configuration. The approximate protein prediction is available in the standard format of the Protein Data Bank, with the extension “pdb” and works on most viewers of biological macromolecules.
It is important to notice that wCReF also makes available extensive help to understand the server’s purpose and how to use it, in the form of online help, tutorials and documentation, available to users at any time.

4.3. Questionnaire Evaluation

Questionnaires are very useful tools in evaluating the interaction between the user and the interface. They are used to collect subjective information of users’ profiles, interface quality and problems encountered during system usage [31]. Their use is important to capture user feedback about the system and to get feedback on the application that has been developed. In this sense, we used questionnaires to gather users’ opinions about the use of the wCReF prototype, aiming at making improvements and correcting errors.

4.3.1. Methodology

To structure the evaluations by questionnaires, we used the Ssemugabi questionnaire as the model [54,55]. The Ssemugabi questionnaire is used to measure usability in web interfaces, based on Nielsen heuristics. It is divided into two parts: the first with questions concerning Nielsen’s heuristics and the second with a focus on the area of E-learning. As in this study, the application context is bioinformatics, we adapted the second part of the questionnaire with emphasis on the usability of the prediction servers. The questionnaire was presented to participants as follows:
  • Presentation of the research, important to motivate the user through a previous description of the research and the benefits of its contribution.
  • Ethical care, through the free-informed consent term.
  • Instructions on how to fill in the required information and usage scenario.
The questionnaire consisted of five parts:
  • User profile: As bioinformatics is an interdisciplinary area, we sought to know the profile of the user who performed the tests and their experience in the area, covering seven questions.
  • Interface design: 50 closed questions (adapted from the Ssemugabi questionnaire), plus one question for each of the 10 heuristics, open to usability problem notes, totaling 60 questions.
  • Web design: 8 issues (7 closed and 1 open) involving the simplicity of site navigation, organization and structure, also based on the Ssemugabi questionnaire.
  • New questions were created to analyze the usability of bioinformatics tools, more specifically prediction servers of protein structures. This block includes 19 questions with 19 closed questions and 2 open questions. The first five closed questions refer to the relevance of the web server content for the bioinformatics area and the others about server usability: clarity of goals, objectives and results (Table 7).
  • Conclusion: five research closing questions and two open questions for pointing out positive and negative aspects of the system.
To compile the results, it was defined that each questionnaire response would be assigned values according to the Likert scale [56].
Questionnaire respondents included students of the discipline of bioinformatics of the courses of Post-Graduation in Computer Science, Graduation in Pediatrics and Child Health, Postgraduation in Zoology, Postgraduation in Medicine and Sciences of the Health, Post-graduation in Cellular and Molecular Biology, Professional Master’s Degree in Pharmaceutical Biotechnology and undergraduate students in Biological Sciences, all belonging to PUCRS (Pontifical Catholic University of Rio Grande do Sul) .
These participants are not the same experts of the heuristic evaluation, because we use two different methods for HCI usability assessment, each with its defined protocols: in the previous study, we used a method of inspection (three to five evaluators are recommended), which may be experts in bioinformatics or in HCI [47]. In this part of the study, the method of data collection was used, using a questionnaire that measures the satisfaction of use and the usability of end users. For this questionnaire, we have used a different population.

4.3.2. Results

The study consisted of 12 participants, whose profile is presented in Table 8. Only one specialist previously participated in the heuristic assessment (identified as User D).
Users reported knowing what the prediction of protein structures is, four of which did not know an online server for predicting protein structures. Of the 12 participants, only User K did not mention some web interface of his knowledge that he uses and knows to work in bioinformatics. The following applications were listed as previously used: PDB, Swiss-Model, NCBI-Blast, ClustalW, Net Primer, Proscan, Gene Ontology, MAFFT (Multiple Sequence Alignment Program for Unix-like Operating Systems) , Data Monkey and the I-TASSER, QUARK, Swiss-Model, Robetta, Phyre.
Figure 10 contains the 972 responses, including those that were left blank. The answers were separated according to the blocks that were presented in the satisfaction questionnaire (interface item that brings the questions related to the ten Nielsen heuristics, web design with questions related to the interface according to the Ssemugabi questionnaire, bioinformatics with the questions created to evaluate the usability according to the domain area and conclusions). Through the value attributed to each question, it was possible to quantify the agreement or disagreement of the users regarding the specific aspects of usability.
In the opinion of the users, we can verify that the highest ranked evaluations were around 80% of the response percentage, reaching a total of 99% of positive answers at the conclusion. Of the total of 972 responses, 392 were ranked with best score (strongly agree) and 385 agree, and 114 responses were neutral. In the negatives, 54 were marked as disagree and nine strongly disagree. Blank responses were 18. The total positive, negative and neutral points are depicted in Figure 11. As we can see, most of the responses rated the system positively (777 responses). The negative items pointed out in the prototype constitute important feedback to improve the wCReF interface.
Many responses were neutral, especially in the design of interface (87 of 600). In the evaluations, it was noticed that the users used neutral to classify a response that they did not consider themselves capable of responding to, or because there was no fact that justified their answer. Let us use the example of User A: The same user marked the whole session of recognition, diagnosis and recovery of errors with maybe (five replies) and reported that no error occurred during his test; he did not think he was able to respond. The correct one in this case would be to have an option for the user as “Not applicable”, which does not exist in the list of options of the satisfaction questionnaire that was used. We suggest that for new applications of this questionnaire, a sixth option (not applicable) be added.
The negative points were used to correct the usability problems of the interface and to reduce interaction problems. The main negative points pointed out by users were related to:
  • Presentation of a course map: A map with the same functionality as the menu has been added, besides indicating the place where the user is in the interface.
  • External links: should point to corresponding web pages. In this way, a revision of the interface links was performed to ensure that there were no errors in this regard.
  • Internal links: The creation of links to a given section on a page, mainly on pages that have an extensive content, was suggested, facilitating the navigation.
  • Color patterns for links: All interface links have been adjusted to match web standards: unvisited links in blue and visited links in green or purple.
  • Copyright statement: Because the wCReF interface and the CReF method are the results of scientific research, within an academic environment, there is a concern about the attribution of copyright of any material, source or software that is used. Although all references were cited, some links with the full reference were not working. A review of the references made available was then performed in order to solve the problem.
  • Highlight buttons/icons: It was suggested to highlight the save button by using metaphors, such as a floppy disk icon.
  • Results presentation: Users suggested that after submitting a protein sequence, they would be forwarded to a page to track their submission instead of remaining on the prediction submission page.
In addition to these issues, other problems were related to the submission of a protein. Thus, it was defined that:
  • When the user submits a protein to the server, he/she receives in his/her e-mail a summary of his/her request, with the name of the protein submitted, the sequence given, the optional parameters and the date it was sent to the system together with the place it is in the queue.
  • When the prediction of the target protein is completed, another email is sent to inform that the prediction is finished, along with the link to view the results and the protein in the PDB format as an attachment.
Another important point to note is the evaluation of User D regarding the wCReF interface. As we mentioned, User D is one of the experts who participated in the heuristic assessment. In the evaluation of wCReF carried out with the adapted questionnaire of Ssemugabi, there were no negative answers (I disagree and totally disagree) in the block that covers the 10 Nielsen heuristics. This suggests that this expert considered that the developed interface did not present problems that violated the heuristic in the closed questions. Only one question was marked with the disagree option. This evaluation was related to web design (the results of the submission are communicated to me without being connected to the server, by other means, such as by e-mail), and the solution was proposed in the item described previously.

5. Discussion

The first step in applying methodologies and principles to ensure the usability of user interfaces should aim to gain a better understanding of the behavior of scientists, their experiences, tasks and work context.
Thus, at first, we evaluated the prediction servers’ interfaces to define the software requirements of wCReF. The evaluation involved an inspection method, the heuristic assessment, where the specialists pointed out the main usability problems encountered in the interfaces of the Robetta, QUARK and I-TASSER servers.
The main issues found by experts during the prediction servers’ evaluation was navigation and system visibility, user log-in, FASTA format validation, academic email address requirement, information presented as long texts, lack of information on prediction status, such as execution time and results’ presentation. Additionally, they also suffered from non-standardized error messages, menus and icons and a non-customizable user interface, as it was not adapted to novices or experts.
Furthermore, the differences between IT/HCI specialists and those who are scientists in other areas (biologists, chemists, physicists) in the way they understand these interfaces are evident, as expected. This demonstrates the importance of the multidisciplinary work in the development of these interfaces, since the opinion of different experts pointed to different problems of the servers.
The next step was implementing a prototype following the guidelines of the experts. In our evaluation, we opted to perform tests with end users to aggregate their opinion to the experts.
The evaluation of the prototype, by adapting the Ssemugabi questionnaire [54,55], was positive. Of the total 972 evaluations, approximately 80% were positive, suggesting that the prototype was well designed considering usability aspects. We would like to highlight that the main positive point, noticed several times in the open questions, was that the interface is “easy to use”. We can see some of the positive comments in the users’ evaluations:
  • “Very good visualization interface of the predicted structure with all the data we have set for the algorithm execution.” (User A, Computer Science)
  • “Easy to use, very simple.” (User A, Computer Science)
  • “The system is easy for beginners”, “the results are presented in a consistent way” and “the help is available at every step.” (User B, Biology)
  • “The system has a simple and clear interface.” “The understanding of the method and submissions are easy.” (User C, Computer Science)
  • “The interface is easy to use, beautiful and simple.” (User D, Information Systems)
  • “Easy to use interface.” (User E, Mathematics, and User G, Pharmacy)
  • “wCReF is a Web system to predict the 3D structure of proteins. The system follows the basic standards required for usability to new and advanced users responding satisfactorily to the purpose for which it was developed.” (User F, Biological Sciences)
  • “The interface is simple and lightweight (no overload of colors, images) and has objective menus.” (User H, Biological Sciences)
Since one of the characteristics of usability is ease of use, we believe that we have achieved our goal at this stage. With the evaluation results, the interface of wCReF has been improved with the suggestions of the users and the correction of usability problems.
The interface is simple and offers advanced features without imposing a steep learning curve usually associated with complex systems. For example, data on the prediction are arranged in a single window, without other information that can disrupt the user, being sent directly to the wCReF server, and the users do not need to provide their e-mail and password for each new submission.
With our evaluation results, wCReF interface has been improved. The requirements raised in the evaluation include:
  • System visibility: viewing submissions made and their status, updated every 30 s.
  • Clear information about the need to sign in: displays a visible information that the user is required to register on the server for sending jobs and viewing the job queue and sent jobs.
  • Minimalist design: reduced menu and priority to the sequence submission area. The menu options are shown only upon request.
  • Warning and error messages: displayed in windows on the same page where the error occurred and requiring user confirmation; attention to colors and symbols to highlight information.
  • Preventing mistakes: indication of what data are required and which are optional. The function of clearing a field is only performed through user confirmation.
  • Error handling: if we enter incorrect data, such as an amino acid sequence in incompatible format, the server displays a warning notice.
  • Delete a job or prediction directly: use of a button, without the need for various actions, with user confirmation and the option of sending more than one job at a time to the server.
  • Interface consistency: menus, icons and interface buttons are unique and standardized.
  • Prediction result not only sent by email: this makes it difficult to use the server as part of a workflow. There is a page with the results that can be read from time to time to determine whether the prediction was complete.
We advised that the user has to register and log in before submitting a protein sequence for prediction. In spite of that, we found usability problems related to the fact that it was not clear the user needed to log-in before submitting the prediction. For some of the analyzed servers, the log-in area was displayed after the user sent the prediction, which facilitated the occurrence of the error, or was presented only when submitting a sequence. Therefore, the wCReF sign-in area is highlighted on the homepage, and the log-in area is always displayed on the interface. Furthermore, it was found for the evaluated servers that too much text was used when communicating with users, usually differentiated only by titles. There is no standardization on the pages. In wCReF, we have prioritized the use of shortcuts, buttons, messages and information displayed according to user interest, assembled into blocks or new pages, separated by menus according to interest or related content.
In the submissions page, there is a search field, to perform a search by the date that the prediction was submitted, the name that was assigned to the protein or the identification number (ID). One of the requirements to ensure visibility was to display the jobs (work) that are running to the user. For ethical reasons, the user can only monitor submissions from this page and view their status. To view the result of the prediction, the user needs to be in his/her private area. This is important because it ensures that each user can only see her/his results. The need for software localization was also detected by heuristic evaluation. This feature will be added to the wCReF interface, allowing researchers and users from other countries to use the server, as all the interface will be presented in their language of choice.
Finally, we can take advantage of the results of the evaluations as a starting point to define the usability solutions for modeling other web applications in bioinformatics. Table 9 points out specific guidelines for interface design that can be used by other teams to build their bioinformatics systems, based on the problems presented.

Availability and Requirements

Project name: wCReF Project home page: wcref.labio.org Operating system: platform independent Technologies: HTML, CSS, Python, MySQL Other requirements: browser with WebGL support.

6. Conclusions

For the development of the wCReF interface, it was very important, from its conception, starting from the requirements survey stage to the final stages of development, that usability evaluations were carried out.
This allowed the web interface to obtain the goals proposed in the study, prioritizing usability as the main focus of the application. Campos and Matias [57] stated that techniques such as heuristic analysis and small user tests can be very revealing for any developer. Additionally, in this case, both the performance of the heuristic evaluation and the evaluations made with end users were the differential that contributed to a satisfactory development of this interface. The results support the initial hypothesis that the study of usability from conception to final product, through usability evaluation, was able to guarantee the wCReF interface’s good usability, focused on its users.
We believe that the construction of wCReF’s interface taking into account requirements raised in the heuristic evaluation was what contributed to most of the positive responses from the users. However, since our goal is to provide an interface developed to ensure user satisfaction through usability, the bad points were important in correcting those errors and in minimizing interaction problems.
In addition, another point to consider is the simplicity of the interface, with the aim of providing advanced functionality without imposing the accentuated learning curve usually associated with complex systems. For example, the prediction data are arranged in a single window, containing no other information that can disrupt the user, being sent directly to the wCReF server and no need to enter the e-mail and password at each new submission.
We believe this study has resulted in an easy-to-use, interactive application that can be used by both experienced users in their scientific research and by less experienced users, even serving as a tool to support bioinformatics teaching.

Acknowledgments

This work was supported in part by grants to O.N.S. (CNPq, 308124/2015-4; FAPERGS (Fundação de Amparo à Pesquisa do Estado do Rio Grande do Sul) , TO2054-2551/13-0). O.N.S. is a CNPq Research Fellow. V.S.M.P.-C. and M.d.S.d.S.T. are supported by CAPES/PROSUP (Coordenação de Aperfeiçoamento de Pessoal de Nível Superior/Programa de Suporte à Pós-Graduação de Instituições de Ensino Particulares) PhD scholarships. W.R.P-C. is supported by a DELL (Dell Computers, Inc.) scholarship.

Author Contributions

V.S.M.P.-C. did the research and written the paper; M.d.S.d.S.T. and W.R.P.-C. have worked on improvements on the CReF method and paper translation; O.N.S., M.d.B.C. and M.S.S. have oriented the research and reviewed the paper, providing guidance on the specific topics.

Conflicts of Interest

The authors declare no conflict of interest.

References

  1. Bruhn, R.; Jennings, S.F. A multidisciplinary bioinformatics minor. ACM SIGCSE Bull. 2007, 39, 348–352. [Google Scholar] [CrossRef]
  2. Ranganathan, S. Bioinformatics education—Perspectives and challenges. PLoS Comput. Biol. 2005, 1, e52. [Google Scholar] [CrossRef] [PubMed]
  3. Goujon, M.; McWilliam, H.; Li, W.; Valentin, F.; Squizzato, S.; Paern, J.; Lopez, R. A new bioinformatics analysis tools framework at EMBL-EBI. Nucleic Acids Res. 2010, 38, W695–W699. [Google Scholar] [CrossRef] [PubMed]
  4. Fulekar, M. Bioinformatics: Applications in Life and Environmental Sciences; Springer Science & Business Media: New York, NY, USA, 2009. [Google Scholar]
  5. Luscombe, N.M.; Greenbaum, D.; Gerstein, M. What is bioinformatics? An introduction and overview. Yearb. Med. Inform. 2001, 1, 2. [Google Scholar]
  6. Gibas, C.; Jambeck, P. Developing Bioinformatics Computer Skills; O’Reilly Media, Inc.: Sebastopol, CA, USA, 2001. [Google Scholar]
  7. Magana, A.J.; Taleyarkhan, M.; Alvarado, D.R.; Kane, M.; Springer, J.; Clase, K. A survey of scholarly literature describing the field of bioinformatics education and bioinformatics educational research. CBE-Life Sci. Educ. 2014, 13, 607–623. [Google Scholar] [CrossRef] [PubMed]
  8. Lesk, A. Introduction to Bioinformatics; Oxford University Press: Oxford, UK, 2013. [Google Scholar]
  9. Al-Ageel, N.; Al-Wabil, A.; Badr, G.; AlOmar, N. Human factors in the design and evaluation of bioinformatics tools. Procedia Manuf. 2015, 3, 2003–2010. [Google Scholar] [CrossRef]
  10. Acland, A.; Agarwala, R.; Barrett, T.; Beck, J.; Benson, D.A.; Bollin, C.; Bolton, E.; Bryant, S.H.; Canese, K.; Church, D.M.; et al. Database resources of the national center for biotechnology information. Nucleic Acids Res. 2014, 42, D13–D21. [Google Scholar]
  11. Douglas, C.; Goulding, R.; Farris, L.; Atkinson-Grosjean, J. Socio-Cultural characteristics of usability of bioinformatics databases and tools. Interdiscip. Sci. Rev. 2011, 36, 55–71. [Google Scholar] [CrossRef]
  12. Bolchini, D.; Finkelstein, A.; Perrone, V.; Nagl, S. Better bioinformatics through usability analysis. Bioinformatics 2008, 25, 406–412. [Google Scholar] [CrossRef] [PubMed]
  13. Bolchini, D.; Finkestein, A.; Paolini, P. Designing usable bio-information architectures. In Human-Computer Interaction. Interacting in Various Application Domains; Springer: Berlin/Heidelberg, Germany, 2009; pp. 653–662. [Google Scholar]
  14. Mirel, B. Usability and usefulness in bioinformatics: Evaluating a tool for querying and analyzing protein interactions based on scientists’ actual research questions. In Proceedings of the IEEE International Professional Communication Conference (IPCC 2007), Seattle, WA, USA, 1–3 October 2007; pp. 1–8. [Google Scholar]
  15. Mirel, B.; Wright, Z. Heuristic evaluations of bioinformatics tools: A development case. In Human-Computer Interaction. New Trends; Springer: Berlin/Heidelberg, Germany, 2009; pp. 329–338. [Google Scholar]
  16. Shaer, O.; Kol, G.; Strait, M.; Fan, C.; Grevet, C.; Elfenbein, S. G-nome surfer: A tabletop interface for collaborative exploration of genomic data. In Proceedings of the SIGCHI Conference on Human Factors in Computing Systems, Atlanta, GA, USA, 10–15 April 2010; pp. 1427–1436. [Google Scholar]
  17. Machado, V.S.; Paixão-Cortes, W.R.; de Souza, O.N.; de Borba Campos, M. Decision-Making for Interactive Systems: A Case Study for Teaching and Learning in Bioinformatics. In Proceedings of the International Conference on Learning and Collaboration Technologies, Vancouver, BC, Canada, 9–14 July 2017; Springer: New York, NY, USA, 2017; pp. 90–109. [Google Scholar]
  18. Veretnik, S.; Fink, J.L.; Bourne, P.E. Computational biology resources lack persistence and usability. PLoS Comput. Biol. 2008, 4, e1000136. [Google Scholar] [CrossRef] [PubMed]
  19. Javahery, H.; Seffah, A.; Radhakrishnan, T. Beyond power: Making bioinformatics tools user-centered. Commun. ACM 2004, 47, 58–63. [Google Scholar] [CrossRef]
  20. Seemann, T. Ten recommendations for creating usable bioinformatics command line software. GigaScience 2013, 2, 15. [Google Scholar] [CrossRef] [PubMed]
  21. Pavelin, K.; Cham, J.A.; de Matos, P.; Brooksbank, C.; Cameron, G.; Steinbeck, C. Bioinformatics meets user-centred design: A perspective. PLoS Comput. Biol. 2012, 8, e1002554. [Google Scholar] [CrossRef] [PubMed]
  22. Rutherford, P.; Abell, W.; Churcher, C.; McKinnon, A.; McCallum, J. Usability of navigation tools for browsing genetic sequences. In Proceedings of the Eleventh Australasian Conference on User Interface, Brisbane, QD, Australia, 1 January 2010; Australian Computer Society, Inc.: Darlinghurst, NSW, Australia, 2010; Volume 106, pp. 33–41. [Google Scholar]
  23. Dorn, M.; Norberto de Souza, O. CReF: A central-residue-fragment-based method for predicting approximate 3-D polypeptides structures. In Proceedings of the 2008 ACM Symposium on Applied Computing, Fortaleza, Brazil, 16–20 March 2008; ACM: New York, NY, USA, 2008; pp. 1261–1267. [Google Scholar]
  24. Dorn, M.; Breda, A.; Norberto de Souza, O. A hybrid method for the protein structure prediction problem. In Proceedings of the Brazilian Symposium on Bioinformatics, Santo André, Brazil, 28–30 August 2008; Springer: New York, NY, USA, 2008; pp. 47–56. [Google Scholar]
  25. Dorn, M.; Norberto de Souza, O. Mining the Protein Data Bank with CReF to predict approximate 3-D structures of polypeptides. Int. J. Data Min. Bioinform. 2010, 4, 281–299. [Google Scholar] [CrossRef] [PubMed]
  26. Machado, V.S.; da Silva Tanus, M.D.S.; Paixão-Cortes, W.R.; Norberto de Souza, O.; de Borba Campos, M.; Silveira, M.S. wCReF–A Web Server for the CReF Protein Structure Predictor. In Information Technology-New Generations; Springer: New York, NY, USA, 2018; pp. 831–838. [Google Scholar]
  27. Wu, S.; Skolnick, J.; Zhang, Y. Ab initio modeling of small proteins by iterative TASSER simulations. BMC Biol. 2007, 5, 17. [Google Scholar] [CrossRef] [PubMed]
  28. Zhang, Y. I-TASSER server for protein 3D structure prediction. BMC Bioinform. 2008, 9, 40. [Google Scholar] [CrossRef] [PubMed]
  29. Zhang, Y. Interplay of I-TASSER and QUARK for template-based and ab initio protein structure prediction in CASP10. Proteins Struct. Funct. Bioinform. 2014, 82, 175–187. [Google Scholar] [CrossRef] [PubMed]
  30. Kim, D.E.; Chivian, D.; Baker, D. Protein structure prediction and analysis using the Robetta server. Nucleic Acids Res. 2004, 32, W526–W531. [Google Scholar] [CrossRef] [PubMed]
  31. Anfinsen, C.B. Principles that govern the folding of protein chains. Science 1973, 181, 223–230. [Google Scholar] [CrossRef] [PubMed]
  32. Kozma, D.; Tusnády, G.E. TMFoldWeb: A web server for predicting transmembrane protein fold class. Biol. Direct 2015, 10, 54. [Google Scholar] [CrossRef] [PubMed] [Green Version]
  33. Marks, D.S.; Hopf, T.A.; Sander, C. Protein structure prediction from sequence variation. Nat. Biotechnol. 2012, 30, 1072–1080. [Google Scholar] [CrossRef] [PubMed]
  34. Santos Filho, O.A.; Alencastro, R.D. Modelagem de proteínas por homologia. Química Nova 2003, 26, 253–259. [Google Scholar] [CrossRef]
  35. Dill, K.A.; MacCallum, J.L. The protein-folding problem, 50 years on. Science 2012, 338, 1042–1046. [Google Scholar] [CrossRef] [PubMed]
  36. Roche, D.B.; Buenavista, M.T.; Tetchner, S.J.; McGuffin, L.J. The IntFOLD server: An integrated web resource for protein fold recognition, 3D model quality assessment, intrinsic disorder prediction, domain prediction and ligand binding site prediction. Nucleic Acids Res. 2011, 39, W171–W176. [Google Scholar] [CrossRef] [PubMed]
  37. Lee, J.; Wu, S.; Zhang, Y. Ab Initio Protein Structure Prediction. In From Protein Structure to Function with Bioinformatics; Springer: Dordrecht, The Netherlands, 2009; pp. 3–25. [Google Scholar]
  38. Cao, R.; Freitas, C.; Chan, L.; Sun, M.; Jiang, H.; Chen, Z. ProLanGO: Protein Function Prediction Using Neural Machine Translation Based on a Recurrent Neural Network. Molecules 2017, 22, 1732. [Google Scholar] [CrossRef] [PubMed]
  39. Dall’Agno, K.C.; Norberto de Souza, O. An expert protein loop refinement protocol by molecular dynamics simulations with restraints. Expert Syst. Appl. 2013, 40, 2568–2574. [Google Scholar] [CrossRef]
  40. Moult, J.; Fidelis, K.; Kryshtafovych, A.; Schwede, T.; Tramontano, A. Critical Assessment of Methods of Protein Structure Prediction (CASP)–Round XII. Proteins Struct. Funct. Bioinform. 2017. [Google Scholar] [CrossRef] [PubMed]
  41. Jiang, Y.; Oron, T.R.; Clark, W.T.; Bankapur, A.R.; D’Andrea, D.; Lepore, R.; Funk, C.S.; Kahanda, I.; Verspoor, K.M.; Ben-Hur, A.; et al. An expanded evaluation of protein function prediction methods shows an improvement in accuracy. Genome Biol. 2016, 17, 184. [Google Scholar] [CrossRef] [PubMed]
  42. Zardecki, C.; Dutta, S.; Goodsell, D.S.; Voigt, M.; Burley, S.K. RCSB Protein Data Bank: A Resource for Chemical, Biochemical, and Structural Explorations of Large and Small Biomolecules. Chem. Educ. 2016, 93, 569–575. [Google Scholar] [CrossRef]
  43. Berman, H.; Westbrook, J.; Feng, Z.; Gilliland, G.; Bhat, T.; Weissig, H.; Shindyalov, I.; Bourne, P. The Protein Data Bank. Nucleic Acids Res. 2000, 28, 235–242. [Google Scholar] [CrossRef] [PubMed]
  44. Altschul, S.F.; Gish, W.; Miller, W.; Myers, E.W.; Lipman, D.J. Basic local alignment search tool. J. Mol. Biol. 1990, 215, 403–410. [Google Scholar] [CrossRef]
  45. Hartson, H.R. Human–computer interaction: Interdisciplinary roots and trends. J. Syst. Softw. 1998, 43, 103–118. [Google Scholar] [CrossRef]
  46. Sharp, H.; Rogers, Y.; Preece, J. Interaction Design: Beyond Human-Computer Interaction; Wiley: New York, NY, USA, 2007. [Google Scholar]
  47. Nielsen, J. Usability inspection methods. In Proceedings of the Conference Companion on Human Factors in Computing Systems, Boston, MA, USA, 24–28 April 1994; ACM: New York, NY, USA, 1994; pp. 413–414. [Google Scholar]
  48. Nielsen, J. Usability Engineering; Elsevier: Amsterdam, The Netherlands, 1994. [Google Scholar]
  49. Winckler, M.A.A.; Farenc, C.; Palanque, P.; Pimenta, M.S. Avaliação da Navegação de Interfaces Web a partir de Modelos. In Proceedings of the Workshop Sobre Fatores Humanos Em Sistemas Computacionais, Florianópolis, Brazil, 15–17 October 2001; Volume 4. [Google Scholar]
  50. Oliveira, E.S.; Lima, C.R.B. Realce das normas e padrões: A usabilidade como fator primordial para a boa interatividade do usuário. Cad. Ciênc. Hum. Soc. Apl. 2013, 1, 1–17. [Google Scholar]
  51. Starovasnik, M.A.; Braisted, A.C.; Wells, J.A. Structural mimicry of a native protein by a minimized binding domain. Proc. Natl. Acad. Sci. USA 1997, 94, 10080–10085. [Google Scholar] [CrossRef] [PubMed]
  52. Li, H.; Leung, K.S.; Nakane, T.; Wong, M.H. iview: An interactive WebGL visualizer for protein-ligand complex. BMC Bioinform. 2014, 15, 56. [Google Scholar] [CrossRef] [PubMed]
  53. Porollo, A.A.; Adamczak, R.; Meller, J. POLYVIEW: A flexible visualization tool for structural and functional annotations of proteins. Bioinformatics 2004, 20, 2460–2462. [Google Scholar] [CrossRef] [PubMed]
  54. Ssemugabi, S. Usability Evaluation of a Web-Based E-Learning Application: A Study of Two Evaluation Methods. Ph.D. Thesis, University of South Africa (UNISA), Pretoria, South Africa, 2009. [Google Scholar]
  55. Ssemugabi, S.; De Villiers, R. A comparative study of two usability evaluation methods using a web-based e-learning application. In Proceedings of the 2007 Annual Research Conference of the South African Institute of Computer Scientists and Information Technologists on IT Research in Developing Countries, Port Elizabeth, South Africa, 2–3 October 2007; ACM: New York, NY, USA, 2007; pp. 132–142. [Google Scholar]
  56. Likert, R. Likert technique for attitude measurement. In Social Psychology: Experimentation, Theory, Research; Sahakian, W.S., Ed.; Intext Educational Publishers: Scranton, PA, USA, 1972; pp. 101–119. [Google Scholar]
  57. Campos, P.; Matias, M. Avaliação de usabilidade de sites web. Rev. Caminhos 2012, 3, 189–203. [Google Scholar]
Figure 1. Usability issues encountered by evaluators. Heuristics with most violations were error prevention, help users recognize, diagnose and recover errors and help and documentation.
Information 09 00020 g001
Figure 2. I-TASSER menu. The menu is displayed in various interface locations and in several different patterns. This window was presented at the bottom of the interface, which is not common. The ideal would be to present it always the same way in different parts of the interface.
Information 09 00020 g002
Figure 3. One of the heuristics violated: help users recognize, diagnose, and recover errors. The error message was displayed in a new browser window, far from where it occurred (I-TASSER).
Information 09 00020 g003
Figure 4. Degree of severity attributed in the heuristic evaluation of the prediction servers of 3D protein structures.
Information 09 00020 g004
Figure 5. wCReF functional requirements.
Information 09 00020 g005
Figure 6. wCReF homepage with log-in area, server usage information, statistics and links to additional resources (all the figures of the article show the content in Portuguese. The wCReF website is being updated to support multiple languages).
Information 09 00020 g006
Figure 7. wCReF results page. The first part shows the submission parameters as sent by the user.
Information 09 00020 g007
Figure 8. wCReF results page. Secondary structure representation.
Information 09 00020 g008
Figure 9. wCReF results page. 3D viewer. Here, we can see three different ways to view the 3D structure: (A) ribbon and colored by secondary structure succession; (B) ball and stick; (C) molecular surface.
Information 09 00020 g009
Figure 10. Answers of the questionnaires. The questions are separated by blocks according to the heuristics: interface design (Nielsen heuristics), web design, bioinformatics and conclusions.
Information 09 00020 g010
Figure 11. Total positive, negative and neutral responses by topic. The positive issues were those classified as “partially agree” and “totally agree”, neutrals with “maybe”, negatives with “partially disagree” and “strongly disagree” and those with no marked responses.
Information 09 00020 g011
Table 1. Number of participant servers in the Critical Assessment of Protein Structure Prediction (CASP) in the last 8 editions.
EditionYearNumber of Registered Prediction Servers
CASP12201680
CASP11201484
CASP102012122
CASP92010139
CASP82008122
CASP7200698
CASP6200465
CASP5200272
Table 2. The prediction servers evaluated.
Prediction ServerAvailable at:Reference
QUARKhttp://zhanglab.ccmb.med.umich.edu/QUARK/[29]
I-TASSERhttp://zhanglab.ccmb.med.umich.edu/I-TASSER/[27,28]
Robettahttp://robetta.bakerlab.org/[30]
Table 3. The participants of the heuristic evaluation.
ParticipantEducationExpertise
APhD in Physical and Biomolecular SciencesBioinformatics
BPhD in Informatics in EducationComputer Science, Informatics in Education and HCI
CPhD student in Computer ScienceBioinformatics and Software Development
DPhD in DesignHCI, Design and Assistive Technologies
Table 4. Severity scale assigned in the heuristic evaluation.
SeverityTypeMeaning
0InsignificantIt is not fully considered an usability problem.
1CosmeticOnly an aesthetic problem: it does not need to be repaired unless there is extra time available in the project.
2SimpleMinor usability issue: fixing this issue should have low priority.
SeriousGreater usability problem: it is important to fix it, so it should be given high priority.
4CatastrophicUsability catastrophe: it is mandatory to fix it before the product is released.
Table 5. Usability problems found in the heuristic evaluation.
InspectorABCDTotal
I-TASSER3123X18
QUARK31652124 + 21 = 45
Robetta21311X26
TOTAL841192189
Table 6. Optional wCReF parameters.
Type of ParametersParameterDefinition
CReFFragment sizesize of amino acids in a fragment: 5, 7 or 9
Number of clusters for ϕ and ψ anglesDefine the number of clusters created by the k-means algorithm
Exclude homologues with similarity overThreshold to exclude fragments from the template search: 100%, 90%, 80% or 70%
Exclude homologues based on PDB codeExclude from the PDB template search the proteins informed with PDB code
BLAST generalExpect thresholdProbability to find this sequence in a random model
Word sizeSequence length for alignment: the default values are 2 or 3
MatrixAssociate the score that will be applied to aligned sequences. Select according to sequence type
Gap costsThe cost of a gap in the aligned sequence, according to the selected matrix
Table 7. Usability satisfaction questions for the bioinformatics area regarding protein structure prediction servers.
NumberQuestion
1The content of the site follows the application patterns in bioinformatics.
2The information is relevant to the development of activities on the server.
3The content is at the appropriate level for my understanding.
4It is clear which materials are copyrighted and which ones are not.
5The server content cites the appropriate references of the material that is used.
5I understood what the server objectives are.
7I understood the methodology used in wCReF.
8I can perform a submission of a target protein satisfactorily.
9If I am an advanced user, I can understand the optional parameters in the wCReF submission.
10The optional wCReF parameters are in accordance with those used by related applications that I know of.
11I can clearly find information about the results.
12The response time for my submission is in line with what I expected.
13The results are presented in a clear way.
14The results are presented in a concise manner.
15The results are in line with what I expected.
16I can save my results.
17The results of the submission are communicated to me without being connected to the server by other means, such as email.
18Statistics give me useful information.
19As a researcher of the area I can send suggestions, complaints and ask questions to the server’s responsible.
Table 8. Profile of participants.
ParticipantStudy Area
APost-graduation in Medicine and Health Sciences; Graduation in Pharmacy.
BPost-Graduation in Computer Science; Graduation in Computer Engineering.
CPost-graduation in Cellular and Molecular Biology; Degree in biology.
DPost-Graduation in Computer Science; Graduation in Computer Science.
EPost-Graduation in Computer Science; Bachelor in Information Systems.
FPost-Graduate in Zoology;
GGraduate in Pediatrics and Child Health Undergraduate in Biological Sciences.
HPost-Graduation in Computer Science; Bachelor in Mathematics.
IPostgraduate in Zoology; Graduation in biological sciences.
JMaster’s Degree in Pharmaceutical Biotechnology; Graduation in Pharmacy.
KUndergraduate Degree in Biological Sciences.
LUndergraduate Degree in Biological Sciences.
Table 9. Specific guidelines for designing bioinformatics interfaces.
HeuristicGuideline
Visibility of system statusProvide the result of the prediction in different ways, not just by e-mail. Example: Offer a page with results that can be constantly updated to check if the prediction has been completed.
The server needs to inform the user that the protein structure is being predicted.
The system must inform the user of the time required for prediction.
The system should show the user the list of prediction jobs.
The system must inform about how the requested prediction will be delivered.
The message that the protein sequence was sent must be highlighted so that the user is sure to have successfully submitted the prediction request.
The system should make it clear that the user needs to log in to submit a prediction.
Match between system and the real worldInclude buttons or icons symbolizing actions familiar to the user such as back, forward, home, save, etc.
Provide the option of sending more than one prediction at once.
Focusing the area of prediction submission, avoiding the excess of menus and information, without categorization.
User control and freedomProvide standard forward, back, undo, redo (undo and redo) buttons available on all interface screens.
Allow users to update their password and personal information.
There must be an option to exit the system (log-out).
Prioritize warning messages when performing actions. Example: when the “clean form” button is clicked, it must confirm the user’s intent, as it erases the information previously entered.
Consistency and standardsStandardize the error messages. Avoid error messages in a new browser window, in text format, without confirmation buttons and returning to the previous state.
The messages should appear on the same screen as the error, as is the default for any operating system.
Standardize the buttons and differentiate buttons with different functions.
Maintain a standard menu across all interface screens. Preferably use menus in a single format, in the same location and standardized across the entire interface.
Mandatory fields must use the usual symbology that indicates the field of this type
This speeds up user interaction.
Standardize behaviors for similar actions.
Define a pattern of what the user needs to report prior to submitting his/her job; for example, email verification, password and information related to the amino acid sequence. Required fields must be flagged.
Error preventionInform the user about the type of input for submission in the system. Example: FASTA format. Do not allow the submission or loading of a file that is not compatible with the one indicated.
Confirm and advise the user if the protein sequence is according to the required standards for submission.
When the user inputs data incorrectly, the server should check the size and formatting of the input and indicate any irregularity.
Error preventionIf the user is required to log-in before submitting a prediction request, she/he must be informed in advance.
The system should allow the user to choose the type of structure prediction to be performed and allow the modification of input parameters.
User registration must be unique for every system. For example, the registration must be the same to send the prediction and to participate in the discussion forum.
Allow the registration of different types of e-mail, not just academic accounts.
This allows the use of the system by other students or teachers and can also be used as an educational tool.
The system should provide an example of the correct FASTA sequence to be used on the main page to guide the user.
The error messages should be highlighted in the standard format in the same window, next to the error. What often happens is a message in red, but one that can be confused with other prominent messages on the page.
Recognition rather than recallThe system should indicate a marked path to know where the user is at any given time.
Describe the features that are not familiar language to the users, that is providing a glossary of technical terms, to facilitate the use of less experienced users. Example: features such as fragment libraries or options like specify secondary structure for specific resides or assign additional restraints and templates to guide modeling.
Provide explanatory terms, with associated links, close to their functionality. A quick help can be included with the mouse or a help symbol that explains the data in a line.
Flexibility and efficiency of useThe action of deleting a job in the system must be unique, preventing the user from performing several activities to complete the process.
The user should have the option to cancel the prediction sent, since many servers only accept one prediction per user.
The system must allow customization of the submission process, distinguishing between experienced and inexperienced users.
Aesthetic and minimalist designAvoid too much text to pass information to users, differentiated only by titles.
This makes the content confusing and have too much information. Prioritize the standardization and use of shortcuts, buttons, messages and the distribution of information according to the user’s interest, assembled in blocks or new screens.
Present the menus in a minimalist way. Highlight the functionality menu of the application, leaving less prominently those that are from other pages or other tools.
The actions of similar functionalities should be gathered and presented in a simplified way, without an excess or redundancy of options. For example, actions could be shown only when clicked or when the mouse pointer was placed over items.
Interface warnings and important information should be presented in a clear and prominent format, avoiding red information in the middle of the text, so as not to distract and confuse users.
Help users recognize, diagnose and recover errorsStandardize error warnings, preventing them from appearing in different forms in the interface, as in other windows or in text format equal to other information, as required fields.
In case of errors, allow the user to return to the initial state.
Help users recognize, diagnose and recover errorsAgain, the prediction submitted should have the possibility of cancellation. In case of sending the wrong submission, the system must detect and inform the user.
Enable the user to recover password and username.
Identify if the user is already registered in the system.
Indicate errors with different colors or symbols in order to draw the user’s attention.
Avoid losing forms’ data when the user accidentally clicks the back button.
Help and documentationThe documentation on the server functionalities, the possible inputs and outputs should be clear and available in a simplified way. The user must be informed about the entries that the server accepts, as well as the output files.
Quick and contextual help should be made available so that the user does not need to read all the documentation, especially for those who are interested only in configuring and visualizing, such as quick help in each entry field on the submission page.
Clarify to the user essential information, such as the reason for the need to log-in with an academic e-mail or sending a single job at a time in the documentation, in cases where it applies.
The parameters presented in the results must be explained through links and appropriate documentation, such as S (Sheet), H (Helix) or C (Coil) in the prediction of the secondary structure, or what SignalP (Signal Peptide), C-score, S-score or Y-score mean, or the TM-score (TM-score is a metric for measuring the structural similarity of two protein models) parameter.

