


Abstract
The forecasting of presidential election results (PERs) is a very complex problem due to the diversity of electoral factors and the uncertainty involved. The use of a hybrid approach composed of techniques such as machine learning (ML) and Simulation in forecasting tasks is promising because the former presents good results but requires a good balance between data quantity and quality, and the latter supplies said requirement; nonetheless, each technique has its limitations, parameters, processes, and application contexts, which should be treated as a whole to improve the results. This study proposes a systematic method to build a model to forecast the PERs with high precision, based on the factors that influence the voter’s preferences and the use of ML and Simulation techniques. The method consists of four phases, uses contextual and synthetic data, and follows a procedure that guarantees high precision in predicting the PER. The method was applied to real cases in Brazil, Uruguay, and Peru, resulting in a predictive model with 100% agreement with the actual first-round results for all cases.
1. Introduction
A presidential election is the most important event in democratic countries, through which citizens freely participate by choosing the candidate who will assume their country’s leadership. In American countries, the government period varies from four to six years; and in Europe, from four to five years. Citizens vote with the hope of better living conditions and the implementation of fairer state policies. Therefore, society and researchers show great interest in these processes, focusing their efforts on understanding and explaining the behavior of voters and its modeling [1], the influence of personal and socioeconomic environment on voters [2], the effect of opinions (messages) through social networks and media [3], and the precision of methods to forecast election results, such as surveys, expert opinions or quantitative models [4].
The forecasting of presidential election results (PERs) acquires importance each time an electoral process is called, where electoral preferences get closer to the final election result; however, measuring voter preferences presents a significant error rate due to the diversity of scenarios and electoral factors (EF) that affect and add uncertainty to the electoral results, which makes the forecasting of PER difficult to solve.
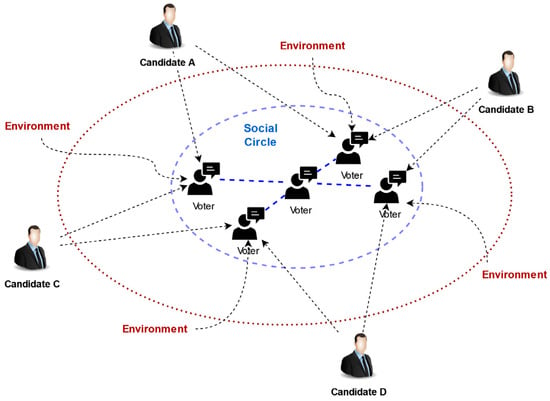
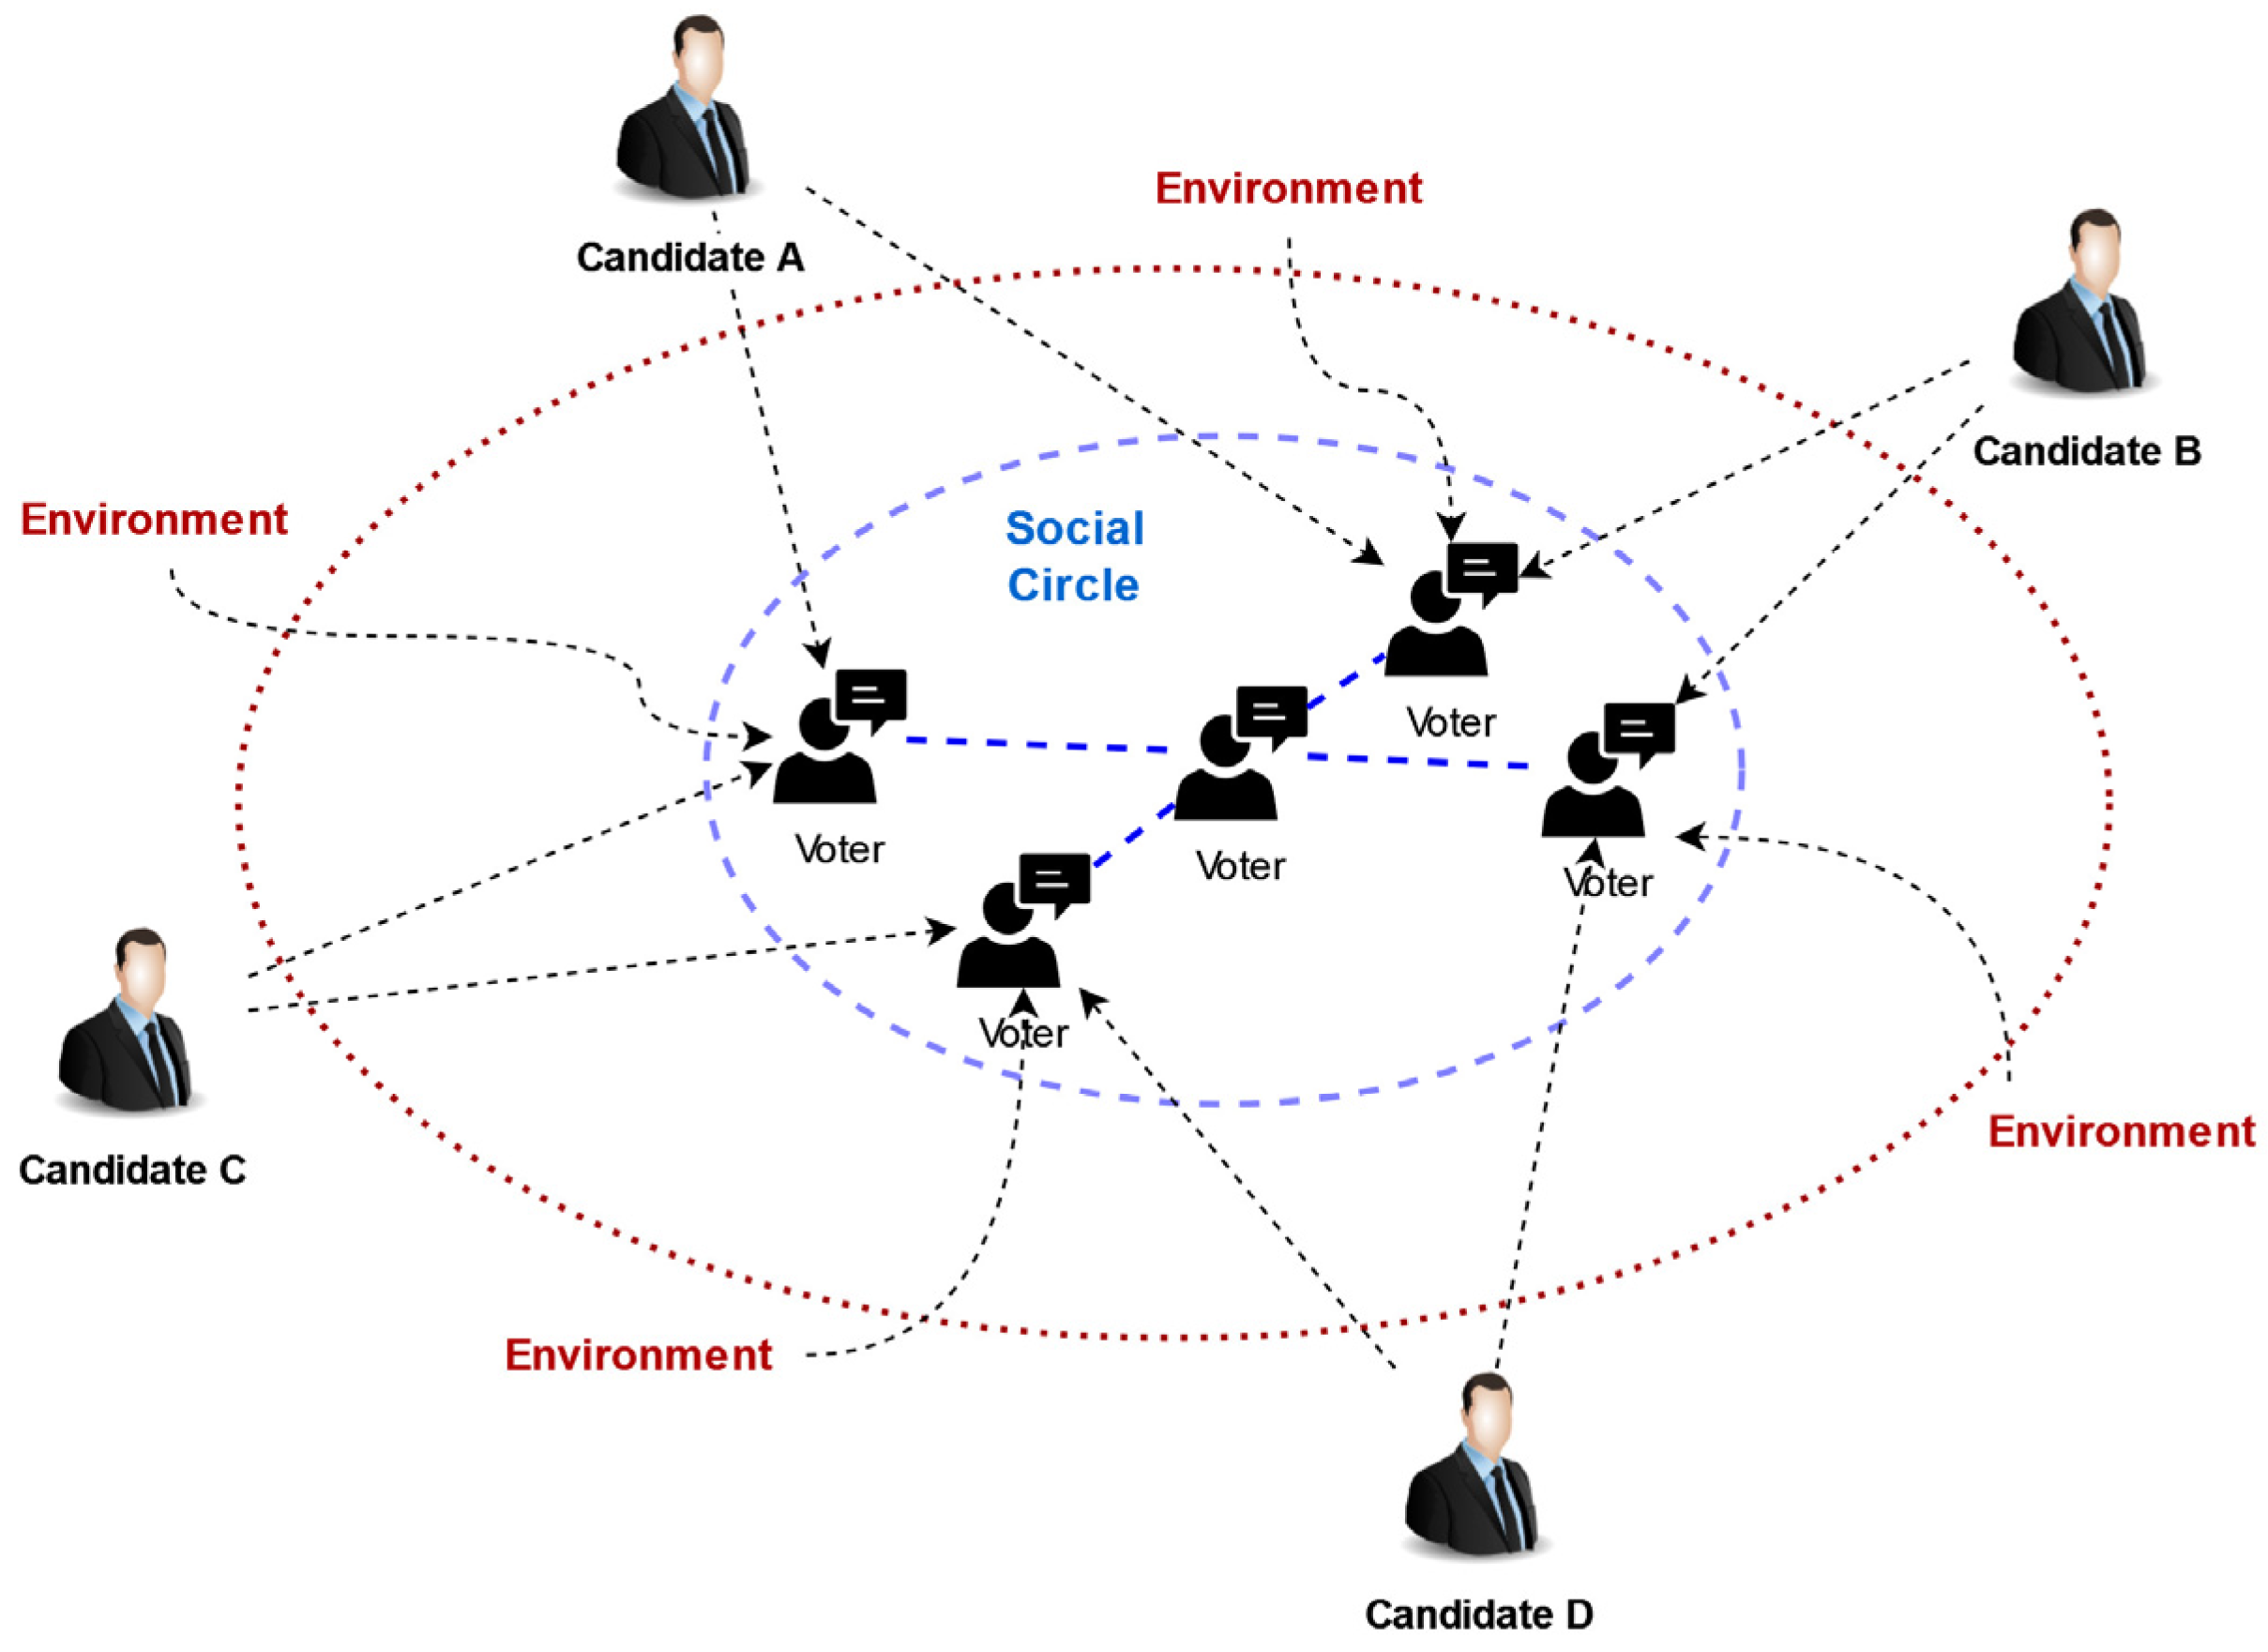
Voters are influenced by their expectations and their social circle, which, in turn, are influenced by the environment, as shown in Figure 1. Personal expectations are influenced by factors such as age [5], gender [6], and marital status [7]; the social circle influences voters through factors such as social networks [8], religion [9], and family [10]; and the environment, which is the specific context of each country, influences voters through factors such as the economic situation [11] and the level of public service offered [1]. Therefore, some important EFs are age, gender, marital status, social networks, religion, and family. These key EFs are finally analyzed by presidential candidates who seek to influence voters with their proposals, which are disseminated through the media, social networks, or electoral campaigns.
Figure 1.
Several factors influence a voter’s electoral decision.
The forecasting of PERs has been approached by using methods and techniques from different disciplines, such as those related to computer science and social science: vote counting using simulation [12], election results forecasting using data from Twitter [13], fuzzy logic [14], and regression [15]. However, these studies do not explicitly establish criteria for identifying more appropriate machine learning (ML) algorithms or criteria for selecting EF. Moreover, there are not enough available data to use ML models, and the existing data cannot be extrapolated from one country to another because it is contextual and temporal.
A method based on Simulation and ML, more specifically, an Artificial Neural Network (ANN), is proposed in this study to systematically build a model to forecast the PER in a way that can be applied to any democratic electoral context. The simulation technique is used because it is an alternative to overcoming the difficulty of a lack of data and has been well employed to describe the voting behavior for the Lithuanian Parliament elections in 1992, 2008, and 2012 [16]. To validate this proposal, seven case studies on presidential elections in Brazil, Uruguay, and Peru were analyzed. Therefore, the main contributions of this article are the following:
- To provide a systematic method to build a model to forecast the PER that applies to any case study;
- To show the usability of the proposed method via its application in seven real cases in three countries.
The article is organized as follows. In Section 2, we review the literature on models for predicting election results. The overview of the proposed model to forecast the PER is described in Section 3. In Section 4, the use of the proposed method in seven case studies of presidential elections is presented, along with the results. Finally, conclusions and discussions follow in Section 5.
2. State of the Art
Studies about election results are focused on identifying EFs, representing voter behavior, and predicting the election results.
2.1. Electoral Factors (EFs)
EFs is understood as everything that affects voter preference and, consequently, their voting decision [17]. Some of these are shown in Table 1.
Table 1.
Factors that influence voter preferences.
2.2. Voter Behavior Models
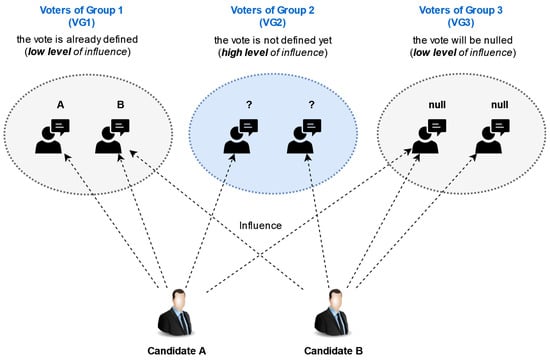
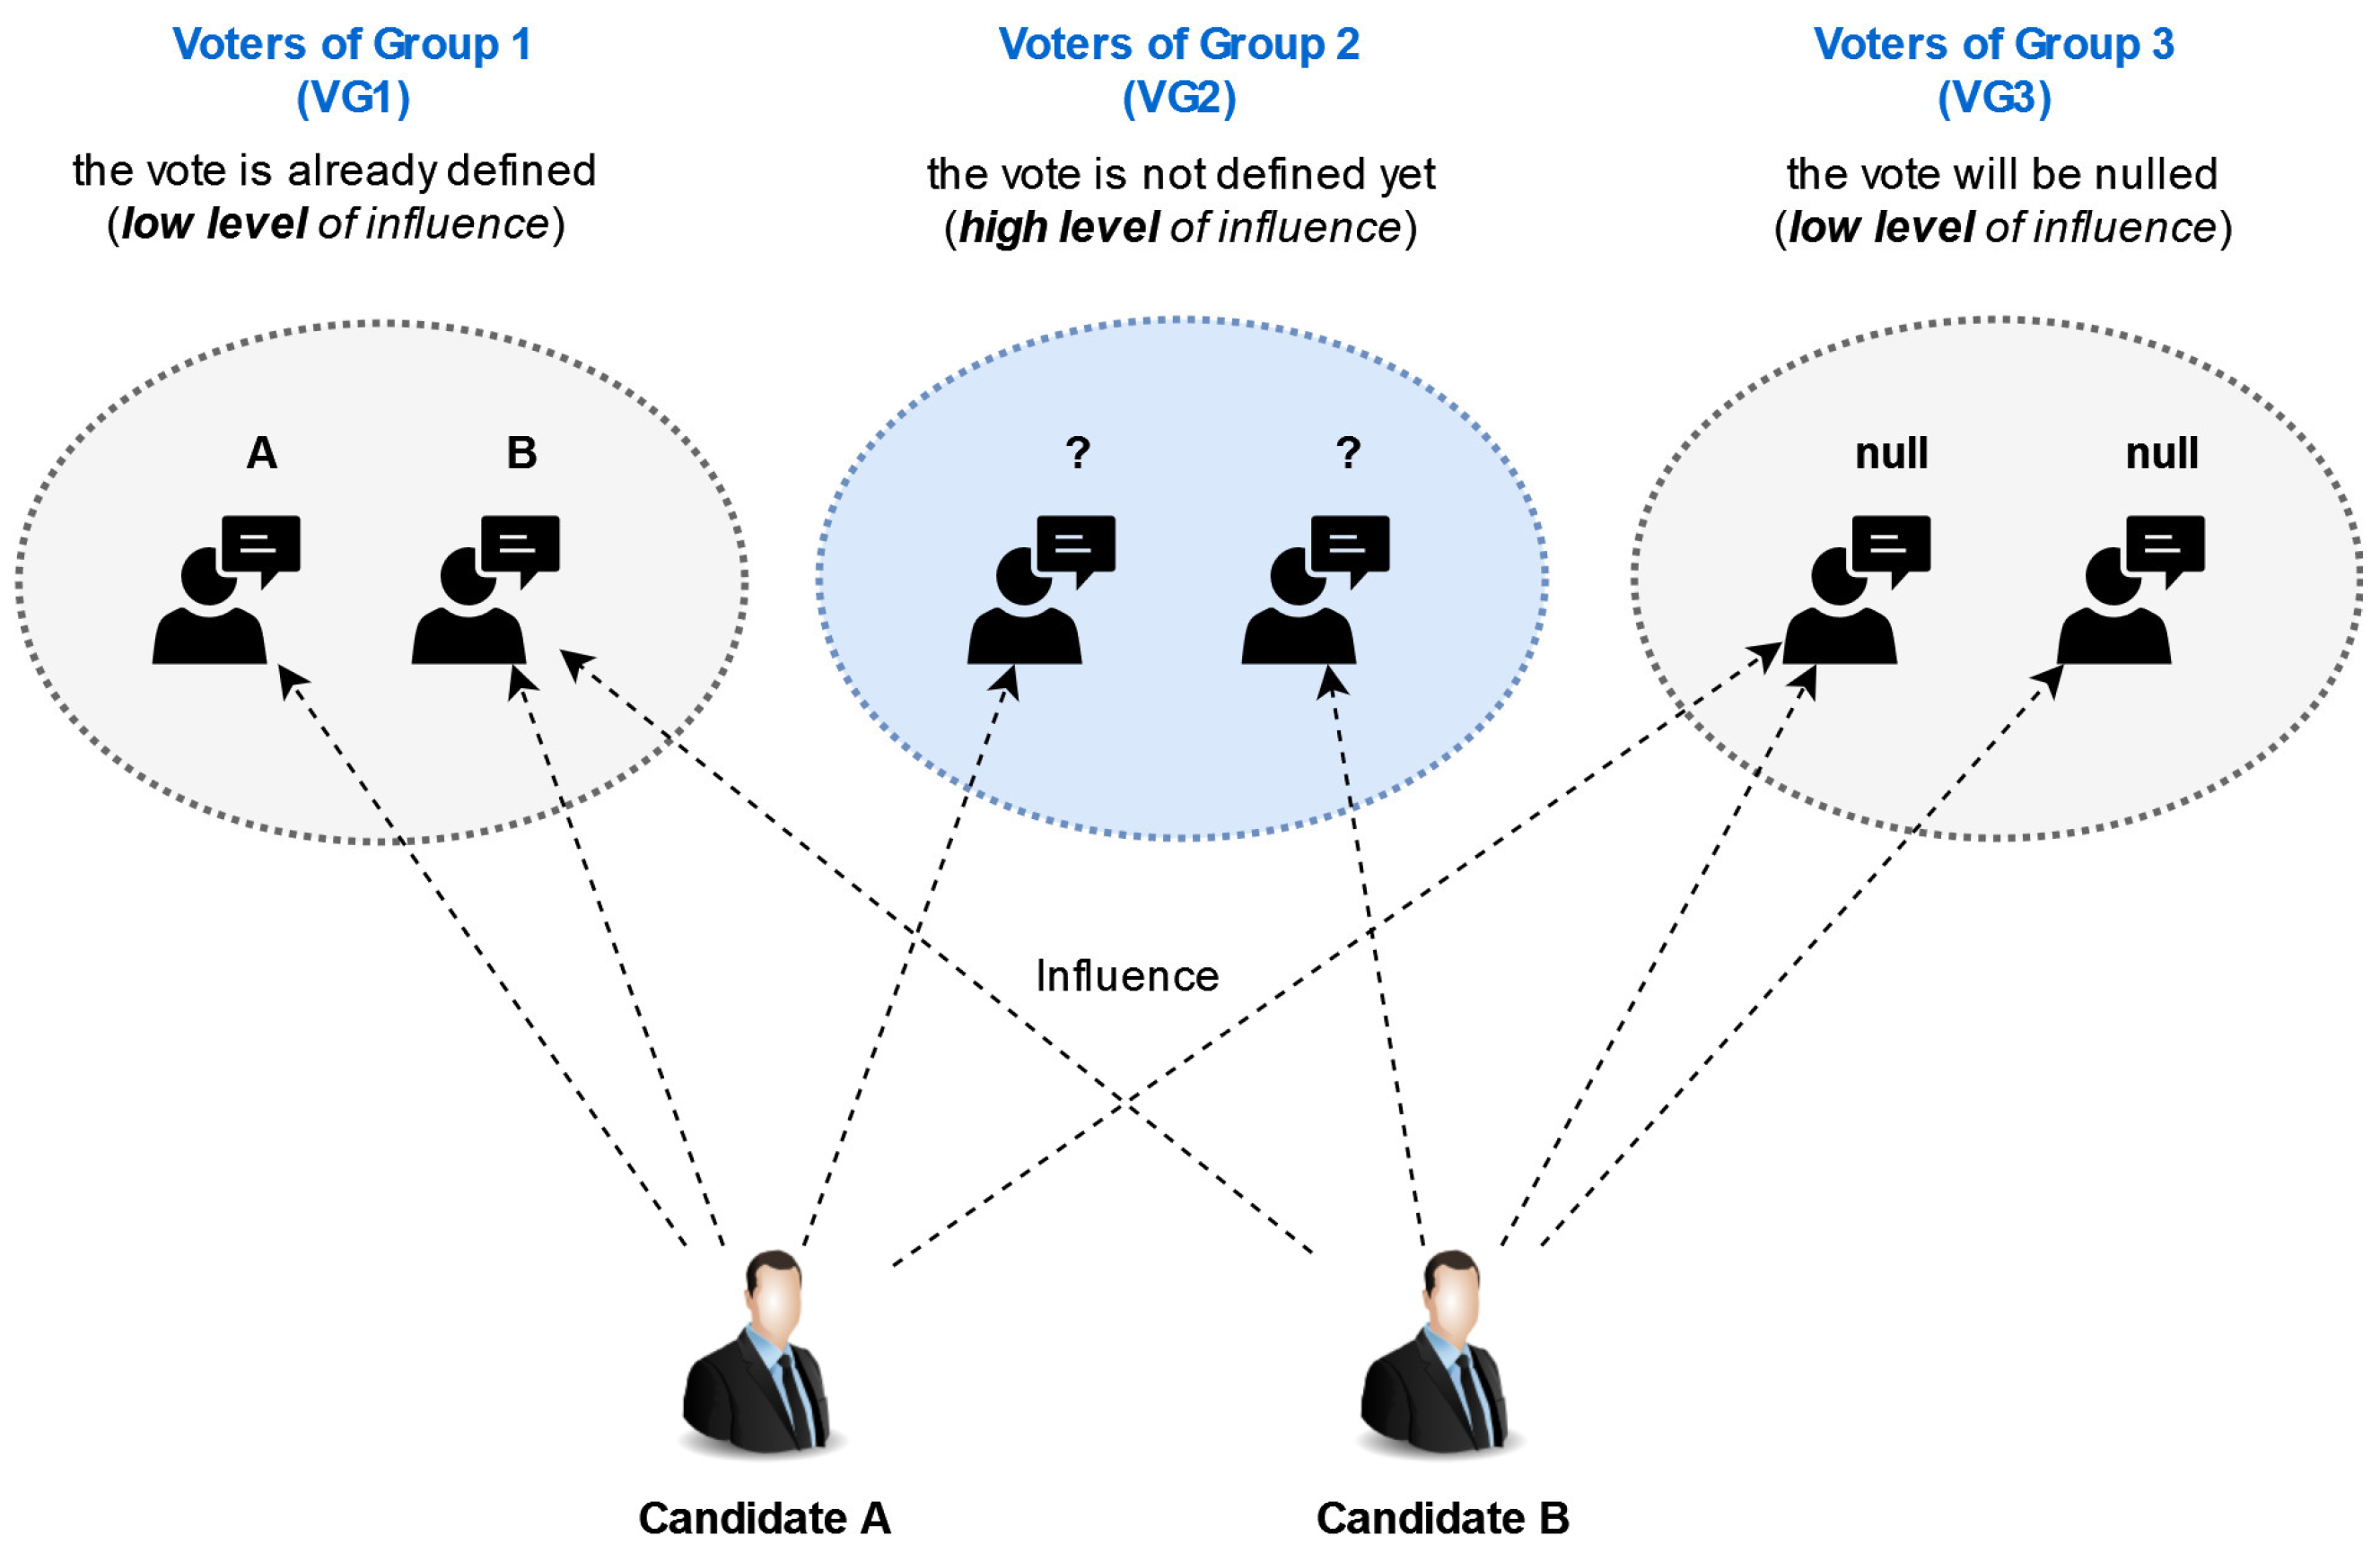
As shown in Figure 2, there are three groups of voters: (1) VG1, those who have already defined their candidate and for whom the factors have little or no influence [31]; (2) VG2, those who have not yet defined their candidate and can be influenced by several factors (the majority of voters); they represent the focus of the electoral campaigns and promises [20,34,35]; and (3) VG3, those who are indifferent and have no interest in any of the candidates, in general, they are those who abstain from participating, taint or annulled their vote [23,36].
Figure 2.
Three groups of voters and their level of influence.
The voter behavior models (VBM) are mainly oriented to the VG2 and, in general, these methods are defined by mathematical and logical formulations that reproduce how a voter perceives the environmental factors (input); how a voter interacts with other voters, and with the environment; and the decision-making process made by the voter expressed in terms of preferences for a specific candidate (output). These models are important because they allow us to understand how the EFs affect voters’ preferences so that candidates can plan electoral campaigns and achieve greater influence on them, that is, influence the electoral results [37]. In addition, these models allow the generation of synthetic data that are essential for the forecasting of PERs [38]. Table 2 shows some VBMs used to address the voter behavior issue.
Table 2.
Voter behavior simulation models.
2.3. Election Results Forecasting Methods
The forecasting of election results can be performed using different methods. Some of these are shown in Table 3. The objective of these methods is to know in advance the final result of the elections with the highest possible degree of certainty. The methods to forecast election results can be categorized based on simulated vote counting, sentiment analysis, fuzzy logic, and regression.
Table 3.
Methods for forecasting election results.
3. Material and Methods
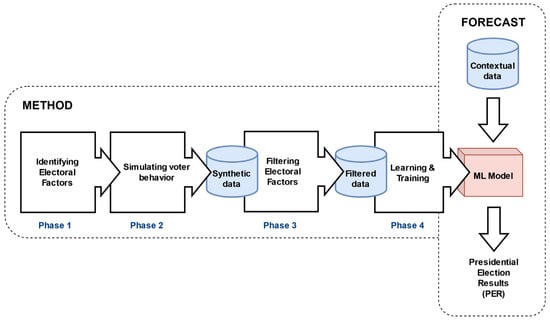
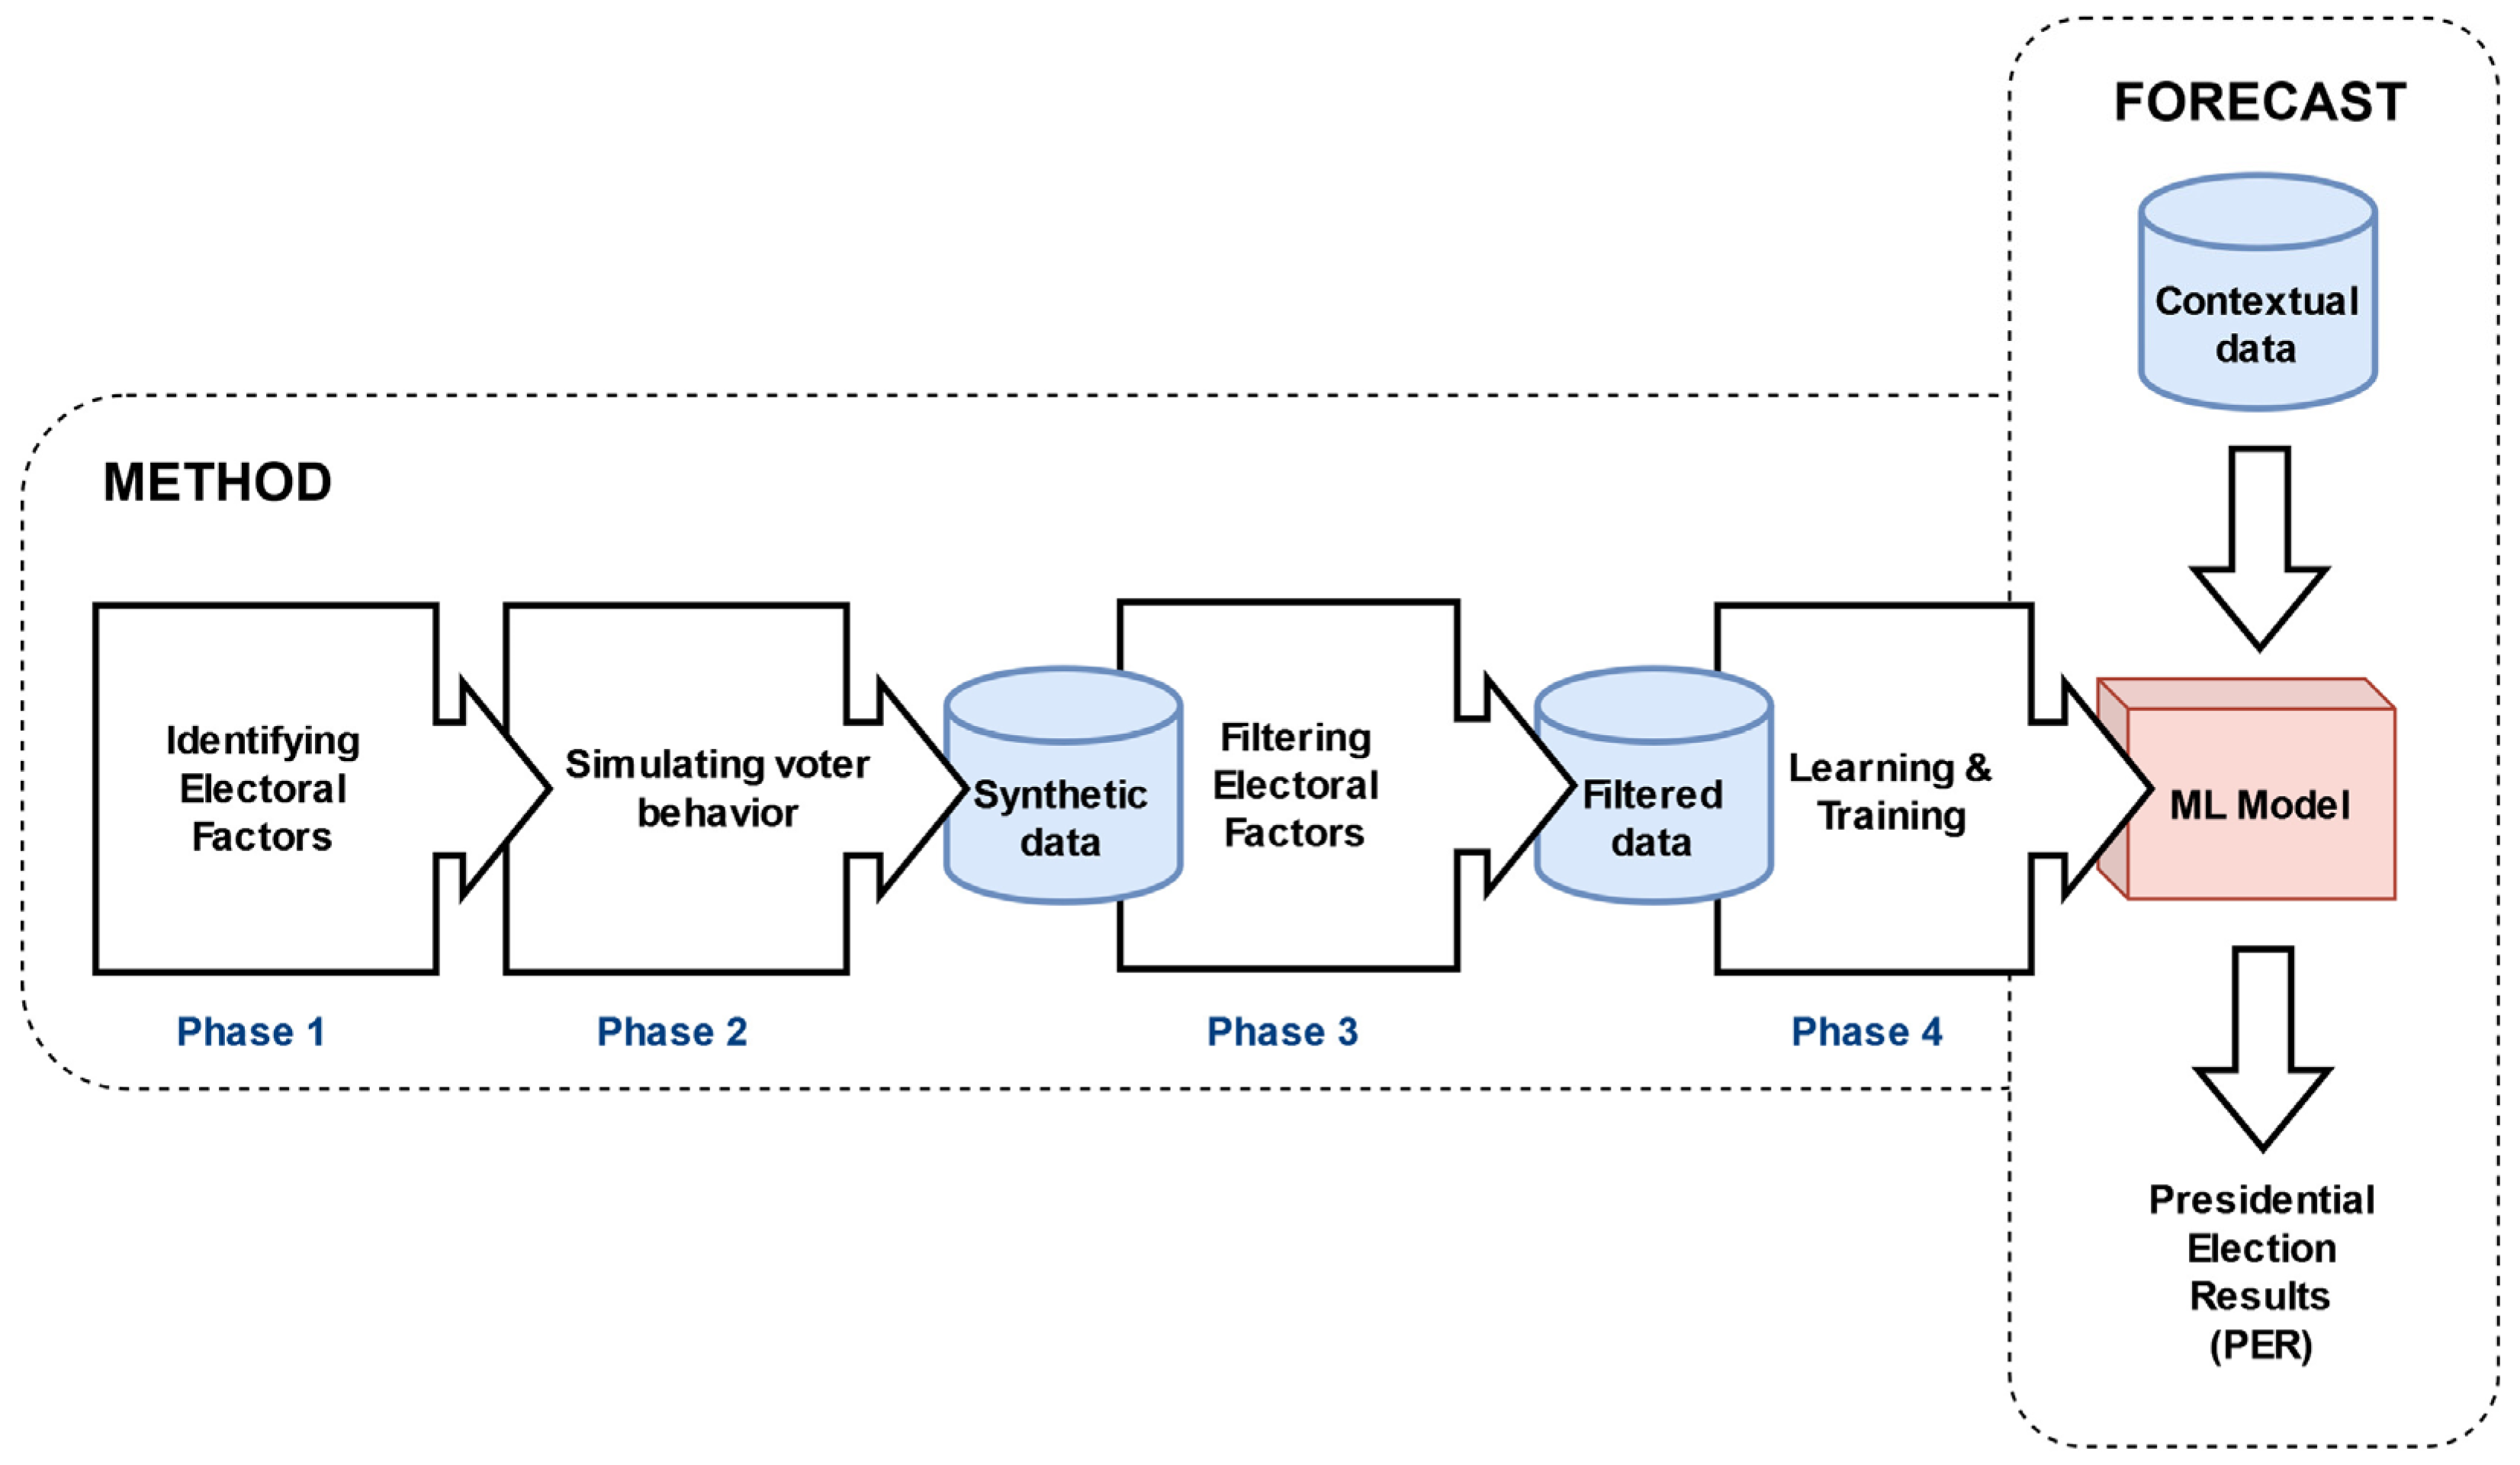
A method to build an ML model to forecast the PERs (first round) is proposed, based on the simulation of the voter behavior (VG2) with which a reliable forecast was achieved. The method consists of 4 phases, as shown in Figure 3: identifying EF, simulating voter behavior, filtering factors, and learning and training.
Figure 3.
The proposed method to build an ML model to forecast the PER.
3.1. Phase 1: Identifying EFs
In this phase, the EFs that affect the voter’s behavior were identified from Table 1. Then, inclusion/exclusion criteria regarding the availability of the data, the scope of the study, and the time of data collection were used to identify the final EF. For example, the religious factor, which has a lot of influence on presidential elections such as in Islamic countries [9], was not considered due to a lack of data availability.
3.2. Phase 2: Simulating Voter Behavior
In this phase, a simulator of voter behavior was built to generate synthetic data because sufficient real data were unavailable. The simulator used both the EF identified in phase 1 and a simulation model. The simulation model was built based on the model of Charcón and Monteiro [1] that considers as simulation parameters the impact of the government’s ideology and the impact of the neighbors’ preferences on each voter, which were calibrated using an analysis of electoral scenarios and numerical experimentation. In addition, eligibility criteria were used for choosing the simulation model which were based on the scope of application (presidential, regional, municipal, and parliamentary), geographic region (Europe, Latin America, Andean Region, Asia, Africa, and North America), precision of results, and complexity of the model.
Synthetic Data
Synthetic data were generated by the simulator of voter behavior; these data included data on the identified factors, the vote prediction, and the simulation parameters. The synthetic data for a given electoral scenario formed one synthetic dataset.
The ML model requires, in its learning process, several synthetic datasets; the larger the dataset, the better results. Therefore, several synthetic datasets were generated, which were obtained considering all possible scenarios and varying the simulation parameters in the simulation model.
3.3. Phase 3: Filtering EFs
In this phase, the EFs identified in Phase 1 were filtered by selecting those that influence the results of the electoral process; therefore, a variable selection process (Pearson correlation coefficient [46], information gain [47], gradual glutton [48], etc.) was applied to the data, with which the filtered data are obtained, that is, the data corresponding to the filtered EF.
Filtered Data
The filtered data were the data obtained from the synthetic data, from which the data corresponding to the eliminated EF in phase 3 were removed. These data were used as the input of the ML model and were subsequently used in the training and validation task of the ML model-building process.
3.4. Phase 4: Learning and Training
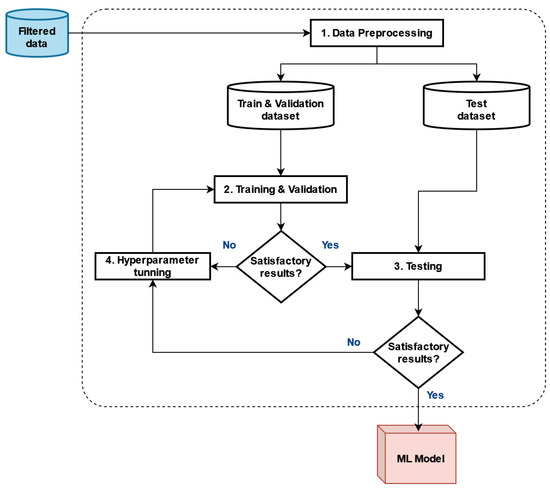
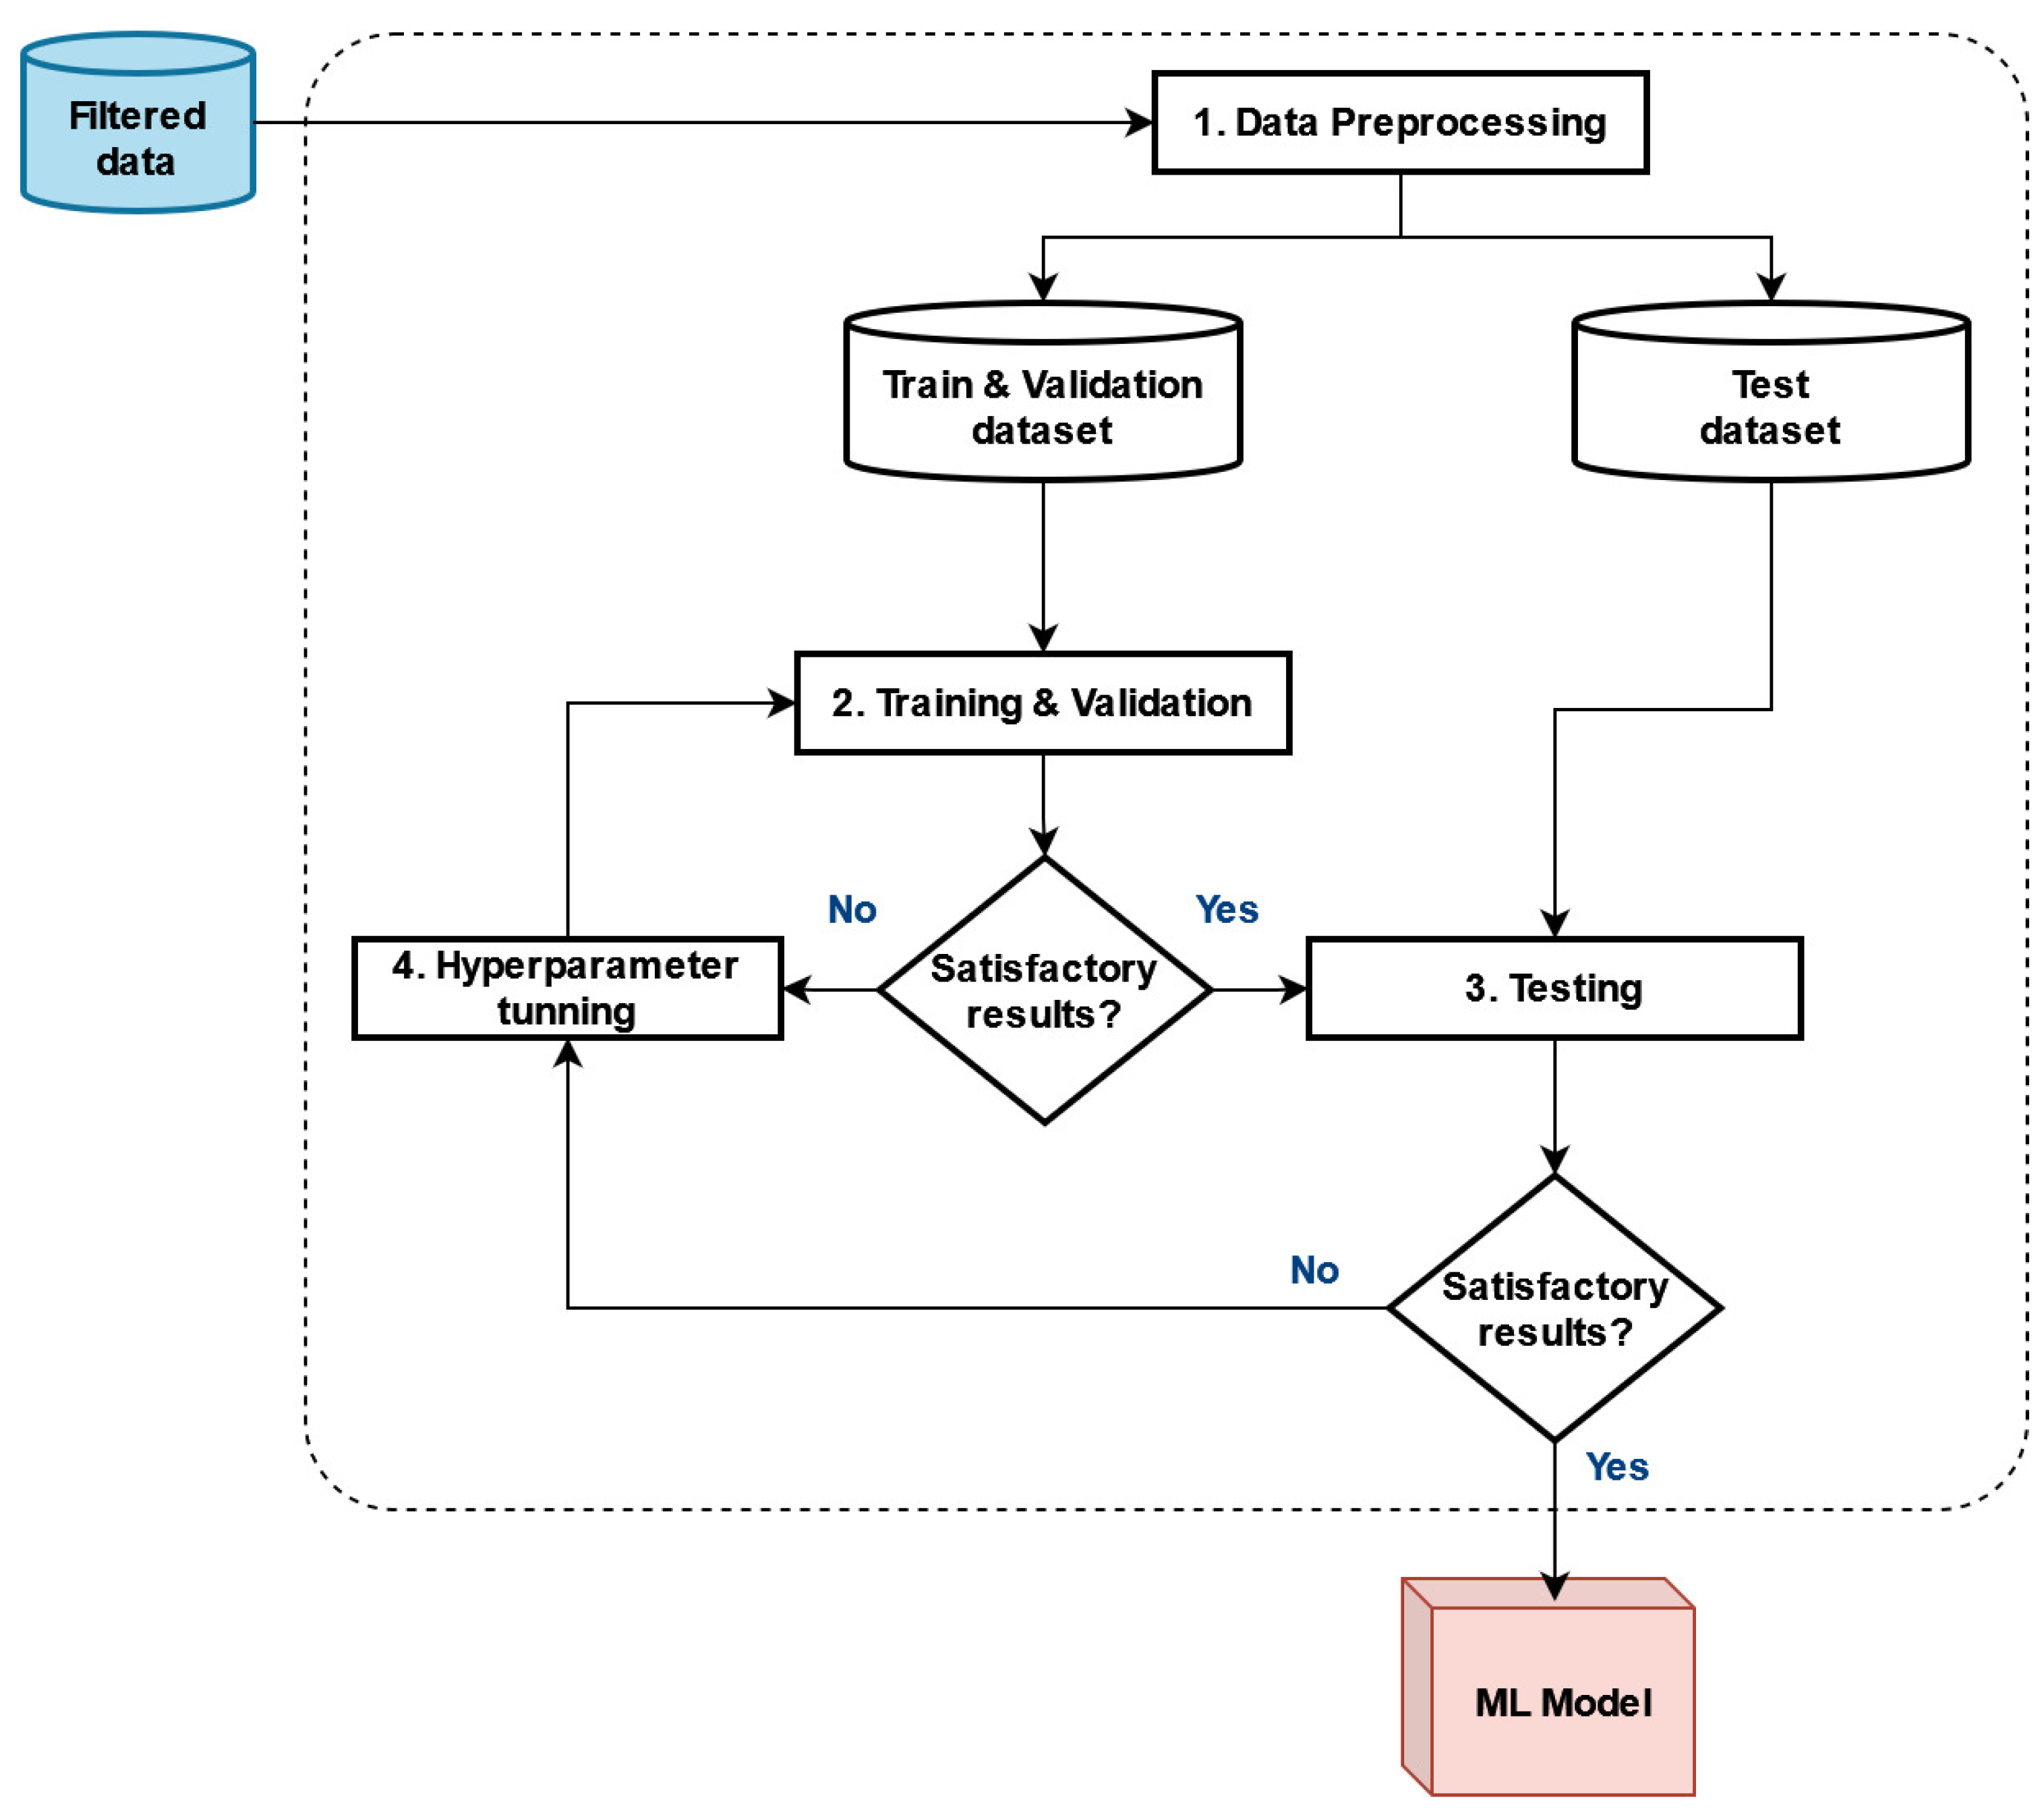
Finally, in this phase, a learning and training process that used the filtered data was applied, and then an ML model to forecast the PER was obtained. The Learning and Training process consisted of four sequential processes, as shown in Figure 4.
Figure 4.
Learning and Training process to build an ML forecasting model.
- First, the filtered data were processed (preprocessing) to obtain the data that could improve results through tasks, such as labeling records, normalizing and imputing data, and eliminating records with anomalies [49,50]. Another important task was data balancing, that is, making the number of records of each PER category equal among them to avoid learning biases, for which an oversampling technique named the Synthetic Minority Oversampling Technique (SMOTE) [51] was used. Next, the preprocessed and balanced data were separated into Train and Validation, and Test datasets.
- Second, the Training and Validation process was performed. During Training, an ML algorithm was applied to the Train and Validation dataset. During Validation, the model’s efficiency was evaluated with the Validation dataset which was not used during Training. To avoid the overfitting phenomena [52] and successfully evaluate the predictive model, the cross-validation technique with k-folds was used. This technique consists of dividing the data into k groups and repeating the training process k times; in each iteration, the training was carried out with k −1 datasets, and the validation of the model was obtained with the remaining k dataset; and in the end, the efficiency of the model was obtained by the average of the efficiency of each iteration.
- If the validation results were satisfactory, then the Testing process was conducted; otherwise, a calibration process was executed and returned to the Training and Validation process with the new hyperparameters obtained by the calibration process. The Training and Validation process was implemented by using libraries, such as TensorFlow [53] and Keras [54].
- Third, the ML model obtained by the previous process was applied to the Test dataset and its results were measured using the error metrics from Table 4. If the results were satisfactory, then the ML model was considered satisfactory to forecast the PER; otherwise, the Calibration process was conducted and returned to the Training and Validation process with the new hyperparameters.
- Fourth, the ML algorithm’s hyperparameters were adjusted to improve results (calibration), which can be performed randomly, systematically, or through a gradient descent technique [55].
Table 4.
Metrics to evaluate the forecasting results.
Contextual Data
To obtain contextual data, opinion surveys and contextual information gathering were used on the perception of each voter about the identified EF and their voting preference, taking into account a mix of scenarios that were approximated by values of the simulation parameters from Table 5.
Table 5.
Variation in the simulation model’s hyperparameters and EF.
4. Case Studies
To test the proposed method, the cases of the presidential elections in Brazil (2010), Uruguay (2019), and Peru (2001 to 2021) were considered.
4.1. Brazil, Uruguay, and Peru Cases
4.1.1. Presidential Elections in Brazil in 2010
More than 136 million Brazilians participated in the presidential elections of 3 October 2010, to choose between nine candidates. The three most voted were Dilma Vana Rousseff (DVR), the candidate from the Workers’ Party, with 46.7% of votes; José Serra, the candidate from the Brazilian Social Democracy Party, with 32.6%; and Marina Silva from the Green Party with 19.4%. None of the other candidates from the other six political parties surpassed the barrier of 1% of votes (PDBA, 2022). In the second round held on Sunday, 31 October, between the two most voted candidates, Rousseff was victorious, with 56.05% of the votes, becoming the first female president of Brazil, and who succeeded Luiz Ignácio Lula da Silva, also from the same party.
4.1.2. Presidential Elections in Uruguay in 2019
Around 2.43 million Uruguayans participated in the presidential elections of 27 October 2019, to choose between seven candidates. The three most voted were Luis Lacalle Pou (LLP), the candidate from the National Party, with 28.62%; Daniel Martínez from the Broad Front with 39.02%; and Ernesto Talvi from the Colorado Party with 12.34% (EP, 2022). In the second round held on Sunday, November 24, 2019, between the two most-voted candidates, Luis Lacalle was victorious with 50.79%.
4.1.3. Presidential Elections in Peru between 2001 and 2021
- Peru 2001. The winner was Alejandro Toledo Manrique (ATM), representative of the “Perú Posible” party, who received the country with the main positive macroeconomic indicators and most negative social indicators. The outgoing president, Alberto Fujimori Fujimori, no longer had popularity due to the proven crimes of corruption, which motivated his escape and resignation, being temporarily replaced by Valentín Paniagua. There was macroeconomic stability, growth recovery, and external solidity due to the existence of international reserves, with an approximate inflation of 3.7% at the end of 2000.
- Peru 2006. The winner was Alan García Pérez (AGP), the candidate from the APRA, who received a country that grew 4.19% on average between 2001 and 2005 and reached an average inflation of 1.94%. The outgoing president ATM presented serious corruption problems, especially from his family group. The boom of mineral exports plus the unprecedented growth of domestic demand due to the rise of private consumption and investment in large projects of public infrastructure generated the highest growth in the region. The prices of essential products had remained stable.
- Peru 2011. The winner was Ollanta Humala Tasso (OHT), the representative of the “Alianza Gana Perú” party. The outgoing president AGP presented serious corruption allegations. However, in the five years of 2006–2010, on an annual average, the GDP grew 7.2% and the inflation was 2.5%, the lowest in the region, reducing poverty indexes; moreover, social programs continued and investment in education grew from USD650 to USD1100 per student.
- Peru 2016. The winner was Pedro Pablo Kuczynsky (PPK), the representative from the “Peruanos por el Cambio” party, who received the country with a very high perception of insecurity, with significant economic growth in the last five years and with an outbreak of Odebrecht corruption cases. He resigned with less than two due to probable cases of corruption and bribery. He was replaced in 2018 by the Vice President Martín Vizcarra Cornejo (MVC), who was vacated by the Congress of the Republic for moral incapacity, which caused the presidency to fall on Manuel Merino de Lama from the “Acción Popular” party and President of the Congress. Merino resigned in less than a week due to the population’s strong rejection, with the presidency being assumed by the new President of the Congress, the engineer Francisco Sagasti Hochhausler (FSH) from the “Morado” party in 2020.
- Peru 2021. The winner was Pedro Castillo Terrones (PCT), who was the representative from the “Perú Libre” party. He received a polarized country due to the corruption of the preceding governments and the country’s general situation caused by COVID-19. The Peruvian economy had been reduced by 11 percentual points and poverty had grown by 10% in the last five-year period.
4.2. Construction of the Forecasting ML Model
Due to the limitation in data availability, a simulation model proposed by Charcon and Monteiro [1] was used due to its good results in the Brazil and Uruguay scenarios and its ease of use.
- The EFs considered were the level of satisfaction with the economic situation (QE), conformity with the level of government-provided services (QS), acceptance of the government’s ethical conduct (QC), and the level of agreement with the government’s political ideology (QI).
- The following parameters were used: level of influence of neighbors (q), number of neighbors (v), weight of ideological influence (σ), and limits to determine vote preference (α and β).
- To generate data for many scenarios, variations in the simulation model’s hyperparameter values and EF were considered (see Table 5), where the QI factor was expressed by a trio that added up to 1 (100%): QIc (agrees), QIin (indifferent), QInc (does not agree).
- The values of QI represent various scenarios; for example: polarized = {0.50, 0.00, 0.50}, balanced = {0.33, 0.33, 0.33}, pro-government = {0.75, 0.00, 0.25}, and pro-opposition = {0.25, 0.00, 0.75}. Furthermore, the same values were used for v and σ (v = 4, and σ = 2) in all scenarios.
With this setup, the PER was determined by using equations from the simulation model, which were coded with values of 1, 2, and 3 for pro-government (G), centrist (M), and opposition (O), respectively, obtaining 6,335,145 scenarios (records). For description purposes, only a sample of three records of the final dataset are shown in Table 6.
Table 6.
A sample of three records of synthetic data.
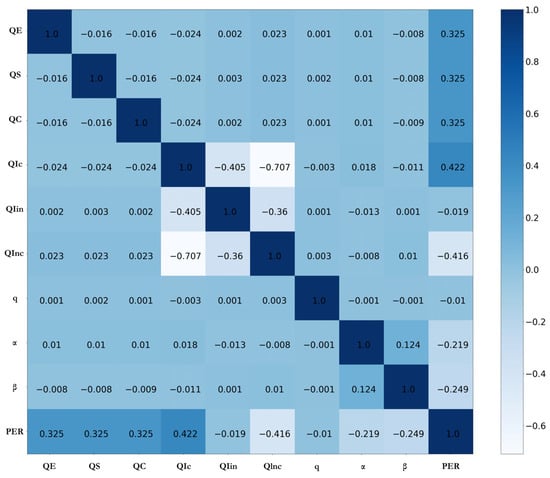
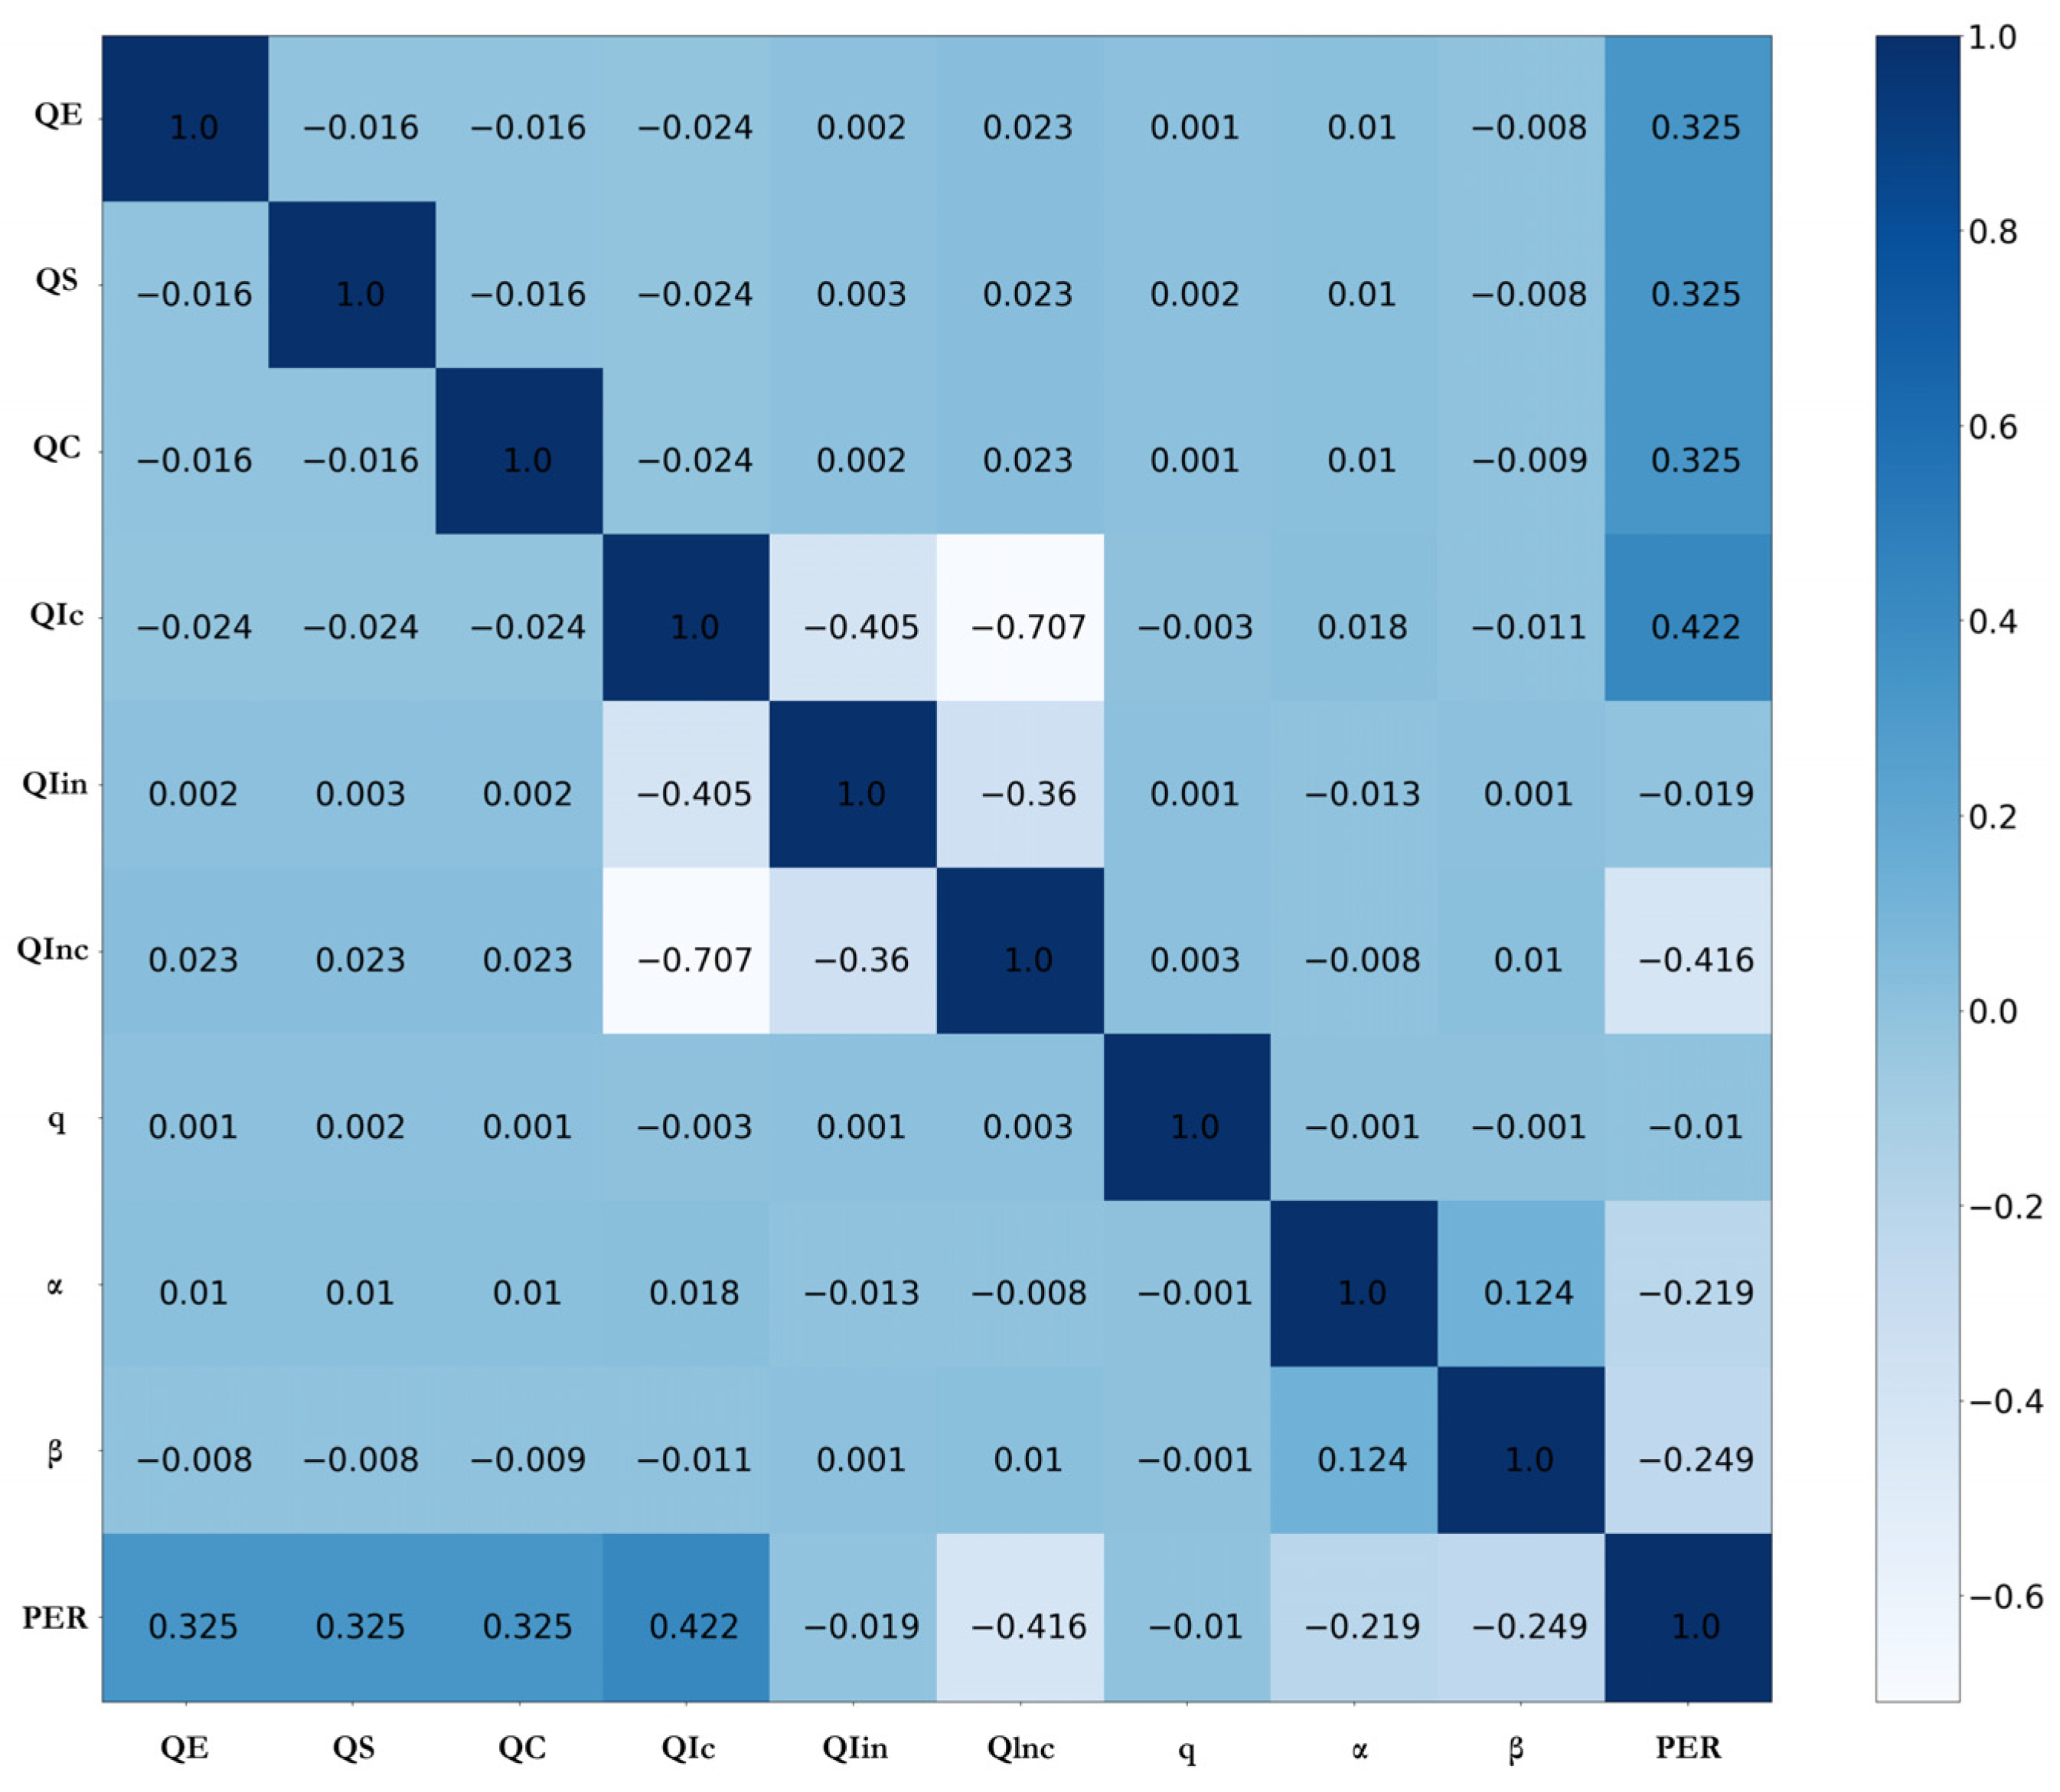
Next, Pearson correlation analysis was applied to the synthetic data (input) and the PER (output) using the NumPy library from Python programming language, as shown in Figure 5.
Figure 5.
Correlation matrix between the EFs and hyperparameters with the result.
The linear correlation coefficients had a value in the [+1, −1] range, with +1 being a perfect positive correlation and −1, being a perfect negative correlation. The negative correlation of −0.707 between QIc and QInc was because QIc, QIin, and QInc values added up to 1. Also, there was a low correlation of QIin and q with the PER, with values of −0.019 and −0.010, respectively; therefore, the QIin and q variables were removed.
Due to the EF and hyperparameter values being in the range of 0 to 1, it was unnecessary to normalize the data.
The dataset was split with an 80:20 ratio, in which 80% of the data was assigned to the Train and Validation dataset and 20% of the remaining data to the Test dataset [56].
Finally, the Train and Validation dataset was balanced using SMOTE since the synthetic data presented 43%, 24%, and 33% of the records (imbalanced) for categories 1, 2, and 3 of PER, respectively, obtaining 6,465,136 records (see Table 7).
Table 7.
Number of records of synthetic data and preprocessed data.
For the Learning and Training process, any ML algorithm could be used, but an ANN model was used because it showed good performance results in similar research [57,58,59,60,61,62] and also in several forecasting problems of different fields such as education [63,64], banking [65,66,67,68], and real estate [69]. The calibration of the ANN to find the optimal hyperparameters was conducted using the Grid Search technique [70], and the metrics from Table 4 were used to measure the performance of all experiments and identify the best ANN model. The set of search values defined for the hyperparameters is given in Table 8.
Table 8.
Search space for tuning hyperparameter values.
Also, a resampling technique was used, in which the Train and Validation dataset was divided into 10 subsets, with 1 set used for validation and 9 for training (10 K-fold). The ANN was implemented using Python within the Google Colab platform, using the Keras and Tensor Flow libraries.
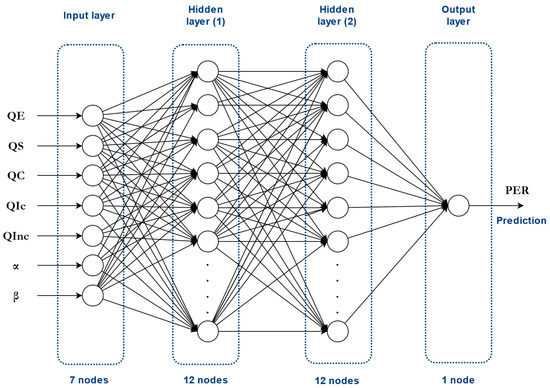
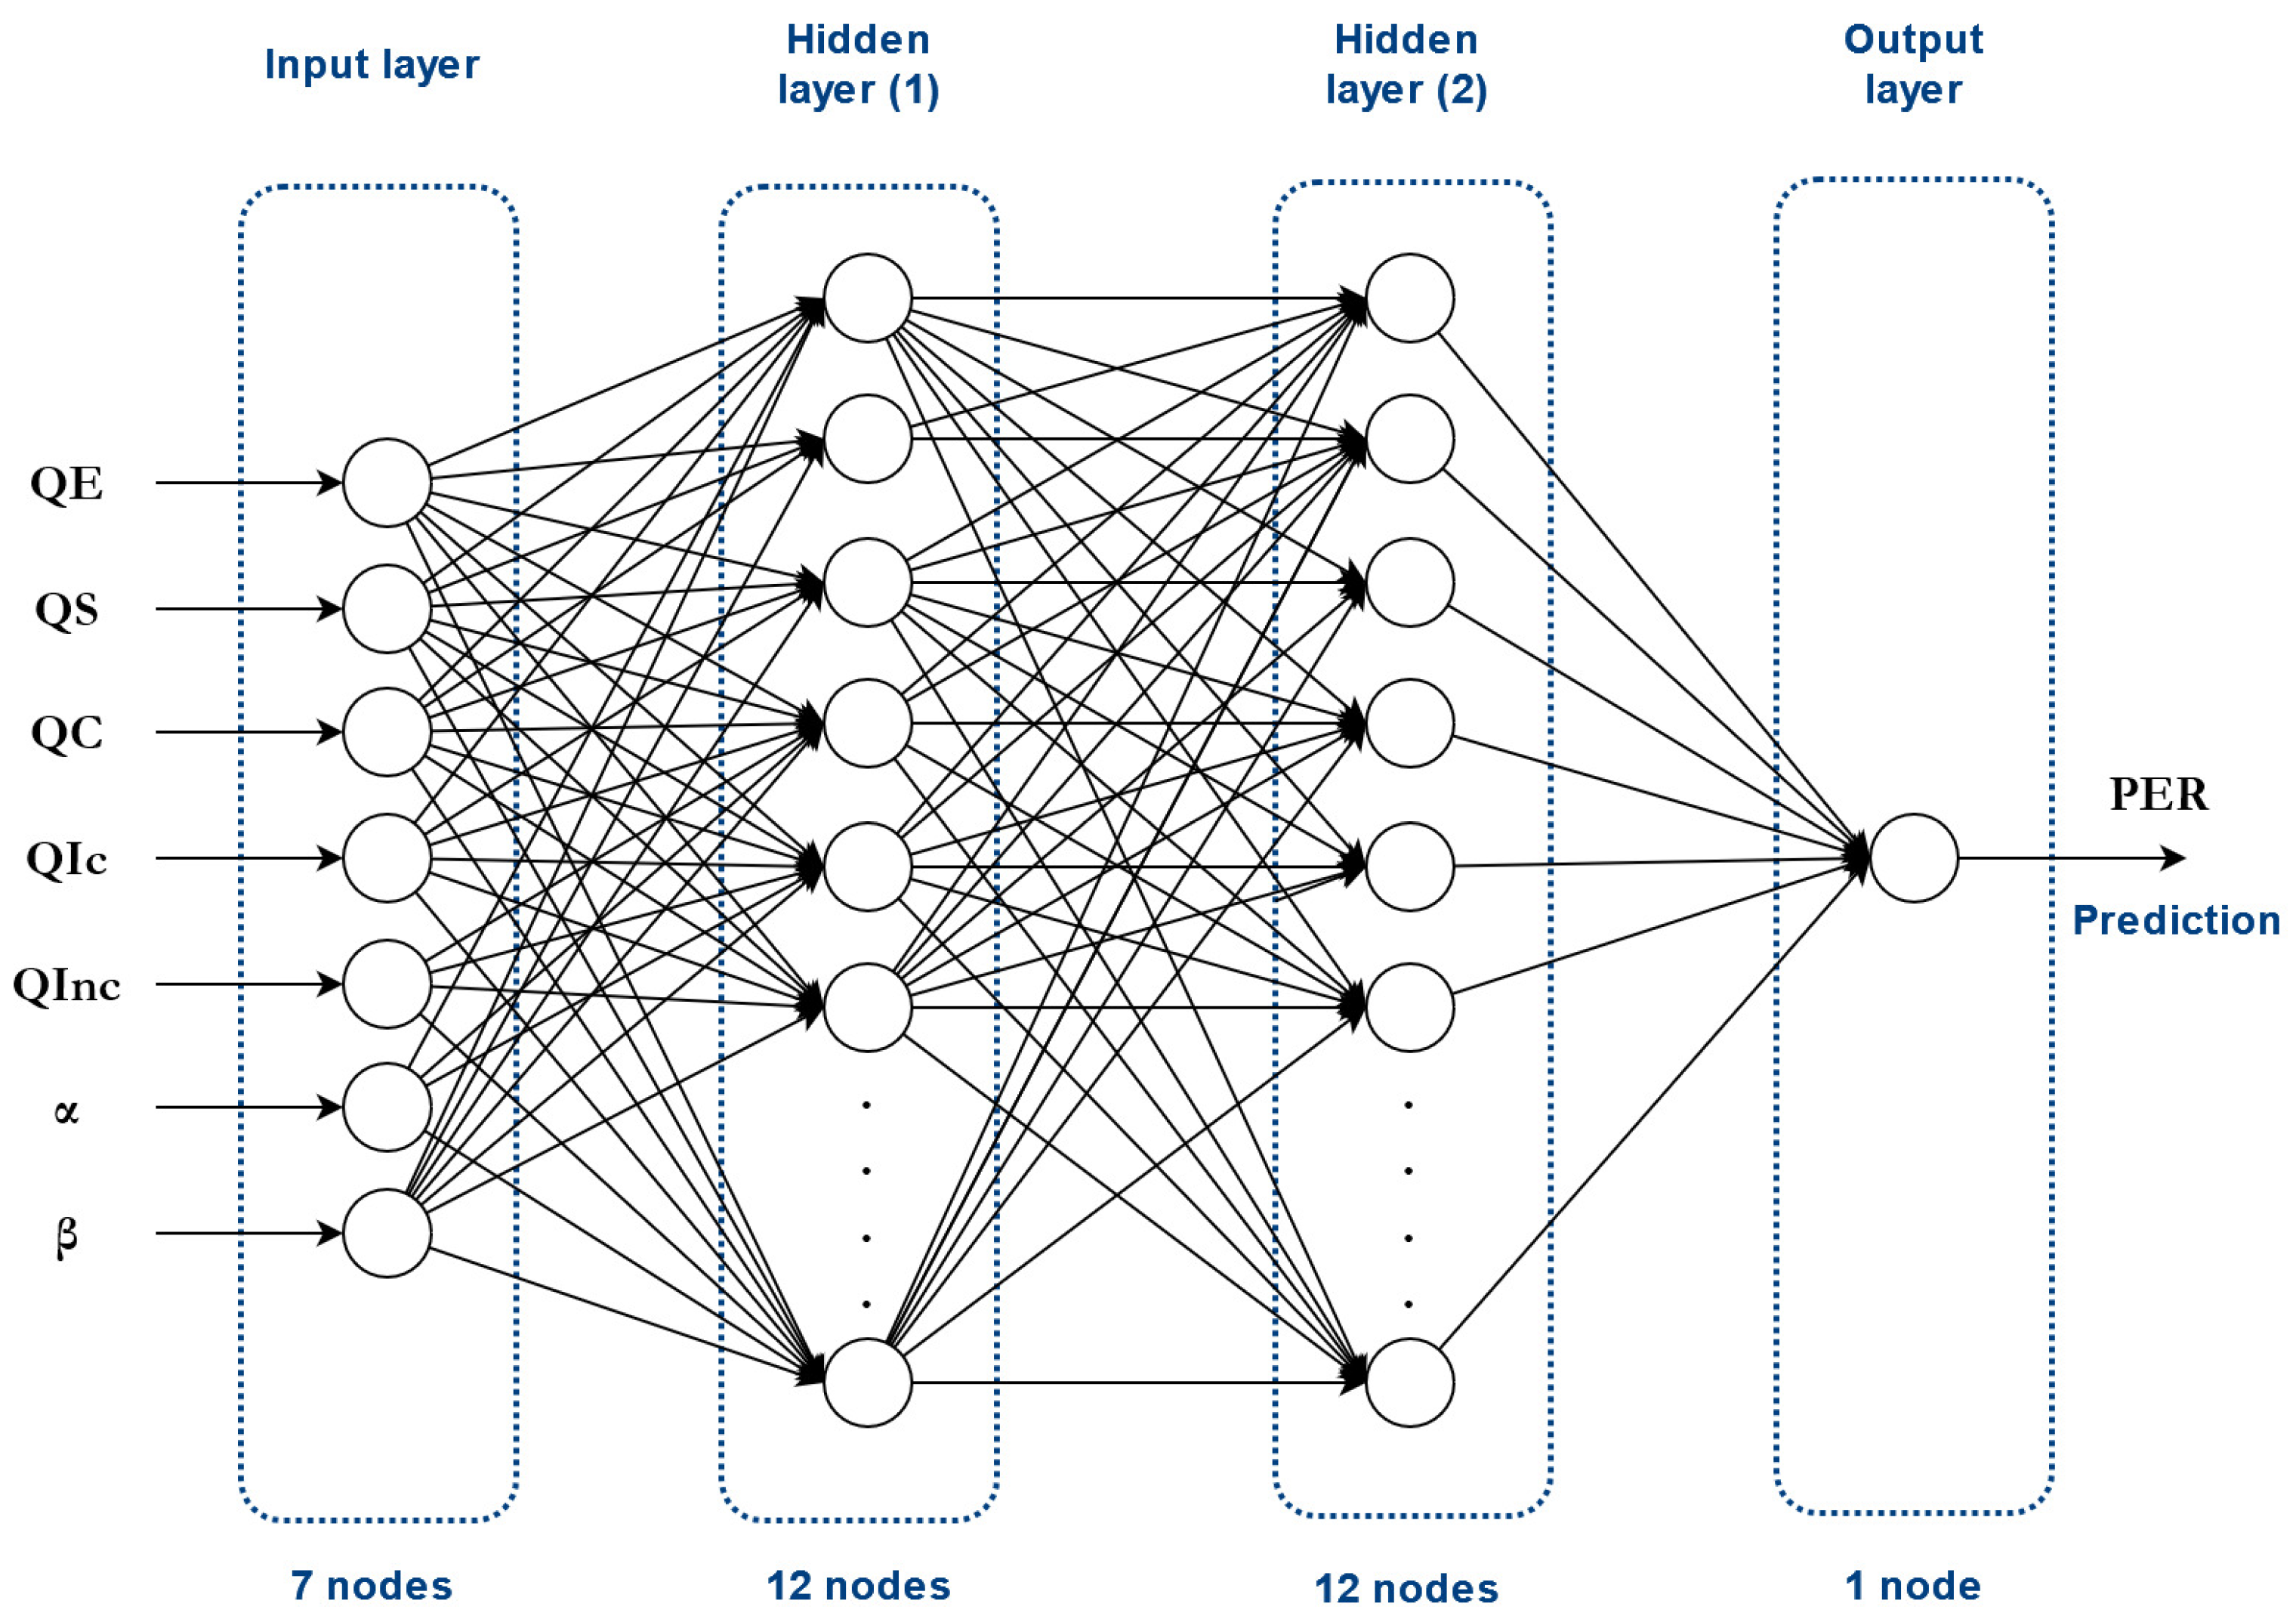
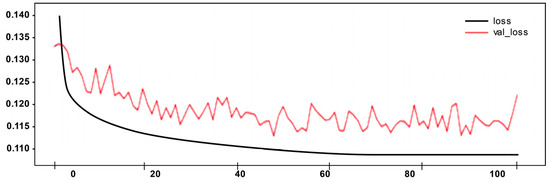
After the experiments and calibration, the final architecture for the ANN was composed of four layers, one input layer of seven nodes, two hidden layers with 10 nodes per layer, one output layer of one node, ‘tanh’ and ‘Adam’ as activation functions, and a batch size of 256 (see Figure 6). Moreover, this ANN model was stabilized in epoch 50, presenting a mean-squared error of 0.0517 (see Figure 7).
Figure 6.
The architecture of the artificial neural network to forecast the PER.
Figure 7.
Variation in the mean squared error or loss according to the epochs.
Table 9 shows that the final ML model achieved a high accuracy rate in both the Train and Validation and Test datasets, being 97.9% and 97.5%, respectively.
Table 9.
Summary of the final ML model’s performance.
4.3. Representation of the Case Studies
The case studies were represented by their parameters in the simulation model, being the same given in the study by Charcon and Monteiro [1] for the Brazil and Uruguay cases. In the case of Peru, the main political organizations and their candidates were grouped considering their discourse, policy plan, and their association with the government of the day (see Table 10), and the parameters were estimated by analyzing the country’s socioeconomic situation, the government-of-the-day policies, and the candidates (see Table 11).
Table 10.
Position of the candidates about the government of the day.
Table 11.
Representation of the parameters in the case studies.
For example, for the case of the presidential elections in Peru in 2011 (PER = 3; the opposition won), the configuration was expressed as 35% of Peruvians were satisfied with the economic situation; 20% were content with the level of government-provided services; and 15% accepted the government’s ethical conduct. A total of 75% did not agree with the government’s political ideology and 25% did agree, with an upper limit of 0.23 (α) for the voting rate of the opposition candidate and a lower limit of 0.28 (β) for the voting rate of the pro-government candidate, whose values were not found in the synthetic data but which did not affect the ML model due to its characteristics of generalization.
4.4. Results
Table 12 shows that the forecasting of PERs using the ML model in the seven case studies (Table 11) matched 100% with the actual PERs (first-round election).
Table 12.
Results of the forecast model for the case studies (first-round election).
In the Brazil 2010 case, the forecasting of PERs using the ML model identified DVR (pro-government; PER = 1) as the winner.
In Uruguay 2019, the forecasting of PERs using the ML model identified LLP (opposition; PER = 3) as the winner.
In the elections of Peru, the forecasting of PER using the ML model for the first round was as follows: in 2001, the opposition candidate ATM (PER = 3); in 2006, the centrist candidate OHT (PER = 2), but in the second round, the opposition candidate AGP won; in 2011, the opposition candidate OHT (PER = 3); in 2016, the opposition candidate KFH (PER = 3), but in the second round, the centrist candidate PPK won; and finally, in 2021, the opposition candidate PCT (PER = 3).
5. Discussion and Conclusions
In this study, a systematic method based on an ML algorithm (named ANN) and Simulation of voter behavior was proposed to build a predictive model of PER and it achieved high precision. Unlike other studies, which have generally focused on one case study, the proposed method is systematic and can be applied to any case, even in the absence of real data.
The proposed method consists of four sequential phases. In phase 1, electoral factors were identified, which were necessary for obtaining real or synthetic data and are determinants in the results for both the simulation of voter behavior and the forecasting. In phase 2, voter behavior was simulated to generate synthetic data; therefore, a simulation model was built based on the electoral factors and parameters that represent the electoral context. In phase 3, the factors were filtered to improve the forecasting results; not doing so could include interdependent factors, which might affect the precision of results. Finally, in phase 4, a four-step process (preprocessing, training–validation, testing, and calibration) was conducted to generate an ML model with high precision. Then, using the obtained model and defining the parameters that represent the contextual situation of the political scenario in each country (case study) through approximated and adjusted parameters, the forecasting of the PER was made.
The proposed method was applied to build a forecasting model of PER in the first round for seven real cases in three countries: Brazil, Uruguay, and Peru. A total of 6′335,145 records of synthetic data, five electoral factors (satisfaction with the economic situation, conformity with the level of government-provided services, acceptance of the government’s ethical conduct, agreement with the government’s political ideology, and non-agreement with the government’s political ideology), and two parameters (upper limits for the vote for the opposition and centrist candidates) were applied. Finally, the built model was an ANN with an input layer of seven nodes (five factors and two parameters), two hidden layers with 12 nodes each, and one output layer with one node (PER), and it achieved an accuracy of 98%.
The model’s results generated by the proposed method showed a 100% match in all cases for the first-round election process, demonstrating that the proposed model is systematic and applicable in various scenarios. In addition, since the forecasting of presidential elections, understood as the declaration of outcomes before they happen, is an important tool for candidates, politicians, and government institutions to build strategic plans regarding the political and economic future of countries, this method could be an excellent means to support the building of such plans.
A limitation of our proposal focuses on the process for estimating the parameters that the model needs to reproduce any political scenario to make correct electoral predictions. Also, the model’s explainability to find the factors that most influence the preferences of voters and ultimately the forecasting results is another found limitation, since this requires the use of techniques that go beyond the predictability used in this research.
Finally, the quality of the results depends on the quality of contextual data and the efficiency of the simulation model; the latter presents difficulties in reproducing the electoral context, which is generally subjective and, consequently, prone to errors.
Author Contributions
Conceptualization, L.Z.-R. and D.M.; methodology, M.J.R.M., L.Z.-R., R.B.-R. and D.M.; software, M.J.R.M., R.B.-R. and N.M.; validation, L.Z.-R., M.J.R.M., R.B.-R. and N.M.; formal analysis, L.Z.-R., R.B.-R., D.M. and M.J.R.M.; investigation, L.Z.-R., M.J.R.M. and N.M.; resources, M.J.R.M. and N.M.; data curation, M.J.R.M., R.B.-R., D.M. and N.M.; writing—original draft preparation, L.Z.-R., D.M., R.B.-R. and N.M.; writing—review and editing, L.Z.-R., M.J.R.M. and D.M.; visualization, M.J.R.M., N.M. and R.B.-R.; supervision, L.Z.-R., D.M. and N.M.; project administration, L.Z.-R., D.M. and N.M. All authors have read and agreed to the published version of the manuscript.
Funding
This research received no external funding.
Data Availability Statement
The data presented in this study are available on request from the corresponding author.
Conflicts of Interest
The authors declare no conflicts of interest.
References
- Charcon, D.Y.; Monteiro, L.H.A. A Multi-Agent System to Predict the Outcome of a Two-Round Election. Appl. Math. Comput. 2020, 386, 125481. [Google Scholar] [CrossRef] [Scilit]
- Lynne, H.; Nigel, G. Social Circles: A Simple Structure for Agent-Based Social Network Models. Available online: https://www.jasss.org/12/2/3.html (accessed on 16 January 2024).
- Sepúlveda, T.A.; Norambuena, B.K. Twitter Sentiment Analysis for the Estimation of Voting Intention in the 2017 Chilean Elections. Intell. Data Anal. 2020, 24, 1141–1160. [Google Scholar] [CrossRef] [Scilit]
- Graefe, A. German Election Forecasting: Comparing and Combining Methods for 2013. Ger. Politics 2015, 24, 195–204. [Google Scholar] [CrossRef] [Scilit]
- Bronner, L.; Ifkovits, D. Voting at 16: Intended and Unintended Consequences of Austria’s Electoral Reform. Elect. Stud. 2019, 61, 102064. [Google Scholar] [CrossRef] [Scilit]
- Stewart, M.C.; Clarke, H.D.; Borges, W. Hillary’s Hypothesis about Attitudes towards Women and Voting in the 2016 Presidential Election. Elect. Stud. 2019, 61, 102034. [Google Scholar] [CrossRef] [Scilit]
- Struber, S. The Effect of Marriage on Political Identification. Inq. J. 2010, 2. Available online: http://www.inquiriesjournal.com/a?id=127 (accessed on 16 January 2024).
- Fujiwara, T.; Müller, K.; Schwarz, C. The Effect of Social Media on Elections: Evidence from the United States. Available online: https://ssrn.com/abstract=3856816 (accessed on 24 January 2024).
- Mujani, S. Religion and Voting Behavior: Evidence from the 2017 Jakarta Gubernatorial Election. Al-Jami’ah J. Islam. Stud. 2020, 58, 419–450. [Google Scholar] [CrossRef] [Scilit]
- Turan, E.; Tıraş, Ö. Family’s Impact on Individual’s Political Attitude and Behaviors. Psycho-Educ. Res. Rev. 2017, 6, 103–110. [Google Scholar]
- Park, B.B.; Shin, J. Do the Welfare Benefits Weaken the Economic Vote? A Cross-National Analysis of the Welfare State and Economic Voting. Int. Political Sci. Rev. 2019, 40, 108–125. [Google Scholar] [CrossRef] [Scilit]
- Parada, J. Voters’ Rationality under Four Electoral Rules: A Simulation Based on the 2010 Colombian Presidential Elections. Rev. Desarro. Soc. 2011, 68, 79–118. [Google Scholar] [CrossRef] [Scilit]
- Burnap, P.; Gibson, R.; Sloan, L.; Southern, R.; Williams, M. 140 Characters to Victory?: Using Twitter to Predict the UK 2015 General Election. Elect. Stud. 2016, 41, 230–233. [Google Scholar] [CrossRef] [Scilit]
- Jiao, Y.; Syau, Y.-R.; Lee, E.S. Fuzzy Adaptive Network in Presidential Elections. Math. Comput. Model. 2006, 43, 244–253. [Google Scholar] [CrossRef] [Scilit]
- Hochreiter, R.; Waldhauser, C. Evolving Accuracy: A Genetic Algorithm to Improve Election Night Forecasts. Appl. Soft Comput. 2015, 34, 606–612. [Google Scholar] [CrossRef] [Scilit]
- Kononovicius, A. Empirical Analysis and Agent-Based Modeling of the Lithuanian Parliamentary Elections. Complexity 2017, 2017, e7354642. [Google Scholar] [CrossRef] [Scilit]
- Kulachai, W.; Lerdtomornsakul, U.; Homyamyen, P. Factors Influencing Voting Decision: A Comprehensive Literature Review. Soc. Sci. 2023, 12, 469. [Google Scholar] [CrossRef] [Scilit]
- Roberts, D.C.; Utych, S. A Delicate Hand or Two-Fisted Aggression? How Gendered Language Influences Candidate Perceptions. Am. Politics Res. 2022, 50, 353–365. [Google Scholar] [CrossRef] [Scilit]
- Kang, W.C.; Sheppard, J.; Snagovsky, F.; Biddle, N. Candidate Sex, Partisanship and Electoral Context in Australia. Elect. Stud. 2021, 70, 102273. [Google Scholar] [CrossRef] [Scilit]
- Werner, A. Voters’ Preferences for Party Representation: Promise-Keeping, Responsiveness to Public Opinion or Enacting the Common Good. Int. Political Sci. Rev. 2019, 40, 486–501. [Google Scholar] [CrossRef] [Scilit]
- Charron, N.; Bågenholm, A. Ideology, Party Systems and Corruption Voting in European Democracies. Elect. Stud. 2016, 41, 35–49. [Google Scholar] [CrossRef] [Scilit]
- Cunow, S.; Desposato, S.; Janusz, A.; Sells, C. Less Is More: The Paradox of Choice in Voting Behavior. Elect. Stud. 2021, 69, 102230. [Google Scholar] [CrossRef] [Scilit]
- Cohen, M.J. Protesting via the Null Ballot: An Assessment of the Decision to Cast an Invalid Vote in Latin America. Polit Behav. 2018, 40, 395–414. [Google Scholar] [CrossRef] [Scilit]
- Langsæther, P.E. Religious Voting and Moral Traditionalism: The Moderating Role of Party Characteristics. Elect. Stud. 2019, 62, 102095. [Google Scholar] [CrossRef] [Scilit]
- Plescia, C. On the Mismeasurement of Sincere and Strategic Voting in Mixed-Member Electoral Systems. Elect. Stud. 2017, 48, 19–29. [Google Scholar] [CrossRef] [Scilit]
- Zingher, J.N. On the Measurement of Social Class and Its Role in Shaping White Vote Choice in the 2016 U.S. Presidential Election. Elect. Stud. 2020, 64, 102119. [Google Scholar] [CrossRef] [Scilit]
- Bahnsen, O.; Gschwend, T.; Stoetzer, L.F. How Do Coalition Signals Shape Voting Behavior? Revealing the Mediating Role of Coalition Expectations. Elect. Stud. 2020, 66, 102166. [Google Scholar] [CrossRef] [Scilit]
- Bytzek, E.; Bieber, I.E. Does Survey Mode Matter for Studying Electoral Behaviour? Evidence from the 2009 German Longitudinal Election Study. Elect. Stud. 2016, 43, 41–51. [Google Scholar] [CrossRef] [Scilit]
- Persson, M. Testing the Relationship between Education and Political Participation Using the 1970 British Cohort Study. Polit Behav. 2014, 36, 877–897. [Google Scholar] [CrossRef] [Scilit]
- Delmar, S.C.; Sajuria, J. Who Cares about Local Candidates? Finding Voters That Use Candidate Localness as a Cue for Their Vote Choices. 2018. Available online: https://osf.io/preprints/socarxiv/j5rpy (accessed on 16 January 2024).
- Remmer, K.L. Stability and Change in Party Preferences: Evidence from Latin America. Elect. Stud. 2021, 70, 102283. [Google Scholar] [CrossRef] [Scilit]
- Burlacu, D. Corruption and Ideological Voting. Br. J. Political Sci. 2020, 50, 435–456. [Google Scholar] [CrossRef] [Scilit]
- Stubager, R.; Seeberg, H.B.; So, F. One Size Doesn’t Fit All: Voter Decision Criteria Heterogeneity and Vote Choice. Elect. Stud. 2018, 52, 1–10. [Google Scholar] [CrossRef] [Scilit]
- He, Q. Issue Cross-Pressures and Time of Voting Decision. Elect. Stud. 2016, 44, 362–373. [Google Scholar] [CrossRef] [Scilit]
- Guardado, J.; Wantchékon, L. Do Electoral Handouts Affect Voting Behavior? Elect. Stud. 2018, 53, 139–149. [Google Scholar] [CrossRef] [Scilit]
- Rodon, T. Caught in the Middle? How Voters React to Spatial Indifference. Elect. Stud. 2021, 73, 102385. [Google Scholar] [CrossRef] [Scilit]
- Ceron, A.; Curini, L.; Iacus, S.M. Using Sentiment Analysis to Monitor Electoral Campaigns: Method Matters—Evidence from the United States and Italy. Soc. Sci. Comput. Rev. 2015, 33, 3–20. [Google Scholar] [CrossRef] [Scilit]
- Stoetzer, L.F.; Neunhoeffer, M.; Gschwend, T.; Munzert, S.; Sternberg, S. Forecasting Elections in Multiparty Systems: A Bayesian Approach Combining Polls and Fundamentals. Political Anal. 2019, 27, 255–262. [Google Scholar] [CrossRef] [Scilit]
- Martínez, M.Á.; Balankin, A.; Chávez, M.; Trejo, A.; Reyes, I. The Core Vote Effect on the Annulled Vote: An Agent-Based Model. Adapt. Behav. 2015, 23, 216–226. [Google Scholar] [CrossRef] [Scilit]
- Fieldhouse, E.; Lessard-Phillips, L.; Edmonds, B. Cascade or Echo Chamber? A Complex Agent-Based Simulation of Voter Turnout. Party Politics 2016, 22, 241–256. [Google Scholar] [CrossRef] [Scilit]
- Sobkowicz, P. Quantitative Agent Based Model of Opinion Dynamics: Polish Elections of 2015. PLoS ONE 2016, 11, e0155098. [Google Scholar] [CrossRef] [Scilit]
- Yin, X.; Wang, H.; Yin, P.; Zhu, H. Agent-Based Opinion Formation Modeling in Social Network: A Perspective of Social Psychology. Phys. A Stat. Mech. Its Appl. 2019, 532, 121786. [Google Scholar] [CrossRef] [Scilit]
- Doucette, J.A.; Tsang, A.; Hosseini, H.; Larson, K.; Cohen, R. Inferring True Voting Outcomes in Homophilic Social Networks. Auton. Agent Multi-Agent Syst. 2019, 33, 298–329. [Google Scholar] [CrossRef] [Scilit]
- Sobkowicz, P.; Kaschesky, M.; Bouchard, G. Opinion Formation in the Social Web: Agent-Based Simulations of Opinion Convergence and Divergence. In Proceedings of the Agents and Data Mining Interaction, Taipei, Taiwan, 2–6 May 2011; Cao, L., Bazzan, A.L.C., Symeonidis, A.L., Gorodetsky, V.I., Weiss, G., Yu, P.S., Eds.; Springer: Berlin/Heidelberg, Germany, 2012; pp. 288–303. [Google Scholar]
- Budiharto, W.; Meiliana, M. Prediction and Analysis of Indonesia Presidential Election from Twitter Using Sentiment Analysis. J. Big Data 2018, 5, 51. [Google Scholar] [CrossRef] [Scilit]
- Lord, D.; Qin, X.; Geedipally, S.R. Chapter 5—Exploratory Analyses of Safety Data. In Highway Safety Analytics and Modeling; Lord, D., Qin, X., Geedipally, S.R., Eds.; Elsevier: Amsterdam, The Netherlands, 2021; pp. 135–177. ISBN 978-0-12-816818-9. [Google Scholar]
- Roobaert, D.; Karakoulas, G.; Chawla, N.V. Information Gain, Correlation and Support Vector Machines. In Feature Extraction: Foundations and Applications; Guyon, I., Nikravesh, M., Gunn, S., Zadeh, L.A., Eds.; Studies in Fuzziness and Soft Computing; Springer: Berlin/Heidelberg, Germany, 2006; pp. 463–470. ISBN 978-3-540-35488-8. [Google Scholar]
- Ament, S.E.; Gomes, C.P. Sparse Bayesian Learning via Stepwise Regression. In Proceedings of the 38th International Conference on Machine Learning, PMLR, Virtual, 1 July 2021; pp. 264–274. [Google Scholar]
- Silaparasetty, N. Machine Learning Concepts with Python and the Jupyter Notebook Environment: Using Tensorflow 2.0; Apress: Berkeley, CA, USA, 2020; ISBN 978-1-4842-5966-5. [Google Scholar]
- Burkov, A. The Hundred-Page Machine Learning Book by Andriy Burkov. Available online: http://themlbook.com/ (accessed on 18 January 2024).
- Zhu, T.; Lin, Y.; Liu, Y. Synthetic Minority Oversampling Technique for Multiclass Imbalance Problems. Pattern Recognit. 2017, 72, 327–340. [Google Scholar] [CrossRef] [Scilit]
- Lever, J.; Krzywinski, M.; Altman, N. Model Selection and Overfitting. Nat. Methods 2016, 13, 703–704. [Google Scholar] [CrossRef] [Scilit]
- Géron, A. Hands-On Machine Learning with Scikit-Learn, Keras, and TensorFlow: Concepts, Tools, and Techniques to Build Intelligent Systems; O’Reilly Media, Inc.: California, CA, USA, 2019; ISBN 978-1-4920-3261-8. [Google Scholar]
- Jakhar, K.; Hooda, N. Big Data Deep Learning Framework Using Keras: A Case Study of Pneumonia Prediction. In Proceedings of the 2018 4th International Conference on Computing Communication and Automation (ICCCA), Greater Noida, India, 14–15 December 2018; pp. 1–5. [Google Scholar]
- Dietrich, D.; Heller, B.; Yang, B. Data Science & Big Data Analytics: Discovering, Analyzing, Visualizing and Presenting Data; Wiley: New Jersey, NJ, USA, 2015; ISBN 978-1-119-18368-6. [Google Scholar]
- Gholamy, A.; Kreinovich, V.; Kosheleva, O. Why 70/30 or 80/20 Relation between Training and Testing Sets: A Pedagogical Explanation. Dep. Tech. Rep. (CS) 2018, 11, 105–111. Available online: https://scholarworks.utep.edu/cs_techrep/1209 (accessed on 16 January 2024).
- Lin, X.; Guo, S.; Ma, Z. Computer Prediction Model of the Election Result through BP Neural Network and Principal Component Analysis. In Proceedings of the 2021 IEEE Conference on Telecommunications, Optics and Computer Science (TOCS), Shenyang, China, 10–11 December 2021; pp. 707–712. [Google Scholar]
- Chan, E.; Krzyzak, A.; Suen, C.Y. Predicting US Elections with Social Media and Neural Networks. In Proceedings of the Pattern Recognition and Artificial Intelligence, Zhongshan, China, 19–23 October 2020; Lu, Y., Vincent, N., Yuen, P.C., Zheng, W.-S., Cheriet, F., Suen, C.Y., Eds.; Springer International Publishing: Cham, Switzerland, 2020; pp. 325–335. [Google Scholar]
- Hidayatullah, A.F.; Cahyaningtyas, S.; Hakim, A.M. Sentiment Analysis on Twitter Using Neural Network: Indonesian Presidential Election 2019 Dataset. IOP Conf. Ser. Mater. Sci. Eng. 2021, 1077, 012001. [Google Scholar] [CrossRef] [Scilit]
- Bilal, M.; Asif, S.; Yousuf, S.; Afzal, U. 2018 Pakistan General Election: Understanding the Predictive Power of Social Media. In Proceedings of the 2018 12th International Conference on Mathematics, Actuarial Science, Computer Science and Statistics (MACS), Karachi, Pakistan, 24–25 November 2018; pp. 1–6. [Google Scholar]
- Zolghadr, M.; Niaki, S.A.A.; Niaki, S.T.A. Modeling and Forecasting US Presidential Election Using Learning Algorithms. J. Ind. Eng. Int. 2018, 14, 491–500. [Google Scholar] [CrossRef] [Scilit]
- Esfandiari, A.; Khaloozadeh, H. Modeling of Parliament Elections Using Artificial Neural Networks. J. Bioinform. Intell. Control 2014, 3, 134–139. [Google Scholar] [CrossRef] [Scilit]
- Shynarbek, N.; Orynbassar, A.; Sapazhanov, Y.; Kadyrov, S. Prediction of Student’s Dropout from a University Program. In Proceedings of the 2021 16th International Conference on Electronics Computer and Computation (ICECCO), Kaskelen, Kazakhstan, 25–26 November 2021; pp. 1–4. [Google Scholar]
- Alban, M.; Mauricio, D. Neural Networks to Predict Dropout at the Universities. IJMLC 2019, 9, 149–153. [Google Scholar] [CrossRef] [Scilit]
- Maniati, M.; Sambracos, E.; Sklavos, S. A Neural Network Approach for Integrating Banks’ Decision in Shipping Finance. Cogent Econ. Financ. 2022, 10, 2150134. [Google Scholar] [CrossRef] [Scilit]
- Zaky, A.; Ouf, S.; Roushdy, M. Predicting Banking Customer Churn Based on Artificial Neural Network. In Proceedings of the 2022 5th International Conference on Computing and Informatics (ICCI), Cairo, Egypt, 9–10 March 2022; pp. 132–139. [Google Scholar]
- Sako, K.; Mpinda, B.N.; Rodrigues, P.C. Neural Networks for Financial Time Series Forecasting. Entropy 2022, 24, 657. [Google Scholar] [CrossRef] [Scilit] [PubMed]
- Gonzales, A.D.C.; Villantoy, F.L.P.; Sanchez, D.S.M. Data Science Model for the Evaluation of Customers of Rural Savings Banks without Credit History. In Proceedings of the 2019 7th International Engineering, Sciences and Technology Conference (IESTEC), Panama, Panama, 9–11 October 2019; pp. 329–334. [Google Scholar]
- Loo, N.; Hernandez, C.; Mauricio, D. Decision Support System for the Location of Retail Business Stores. In Proceedings of the Advances and Applications in Computer Science, Electronics and Industrial Engineering, Ambato, Ecuador October 2020; García, M.V., Fernández-Peña, F., Gordón-Gallegos, C., Eds.; Springer: Singapore, 2021; pp. 67–78. [Google Scholar]
- Bzdok, D.; Altman, N.; Krzywinski, M. Statistics versus Machine Learning. Nat. Methods 2018, 15, 233–234. [Google Scholar] [CrossRef] [Scilit] [PubMed]

Disclaimer/Publisher’s Note: The statements, opinions and data contained in all publications are solely those of the individual author(s) and contributor(s) and not of MDPI and/or the editor(s). MDPI and/or the editor(s) disclaim responsibility for any injury to people or property resulting from any ideas, methods, instructions or products referred to in the content. |
© 2024 by the authors. Licensee MDPI, Basel, Switzerland. This article is an open access article distributed under the terms and conditions of the Creative Commons Attribution (CC BY) license (https://creativecommons.org/licenses/by/4.0/).