Article

Grand Canonical Monte Carlo Simulation of Nitrogen Adsorption in a Silica Aerogel Model

Key Laboratory of Thermo-Fluid Science and Engineering, Ministry of Education, School of Energy and Power Engineering, Xi’an Jiaotong University, Xi’an 710049, China
*
Author to whom correspondence should be addressed.
Computation 2016, 4(2), 18; https://doi.org/10.3390/computation4020018
Submission received: 18 December 2015 / Revised: 14 March 2016 / Accepted: 25 March 2016 / Published: 1 April 2016
(This article belongs to the Special Issue Advances in Modeling Flow and Transport in Porous Media)

Abstract

:
In this paper, the Diffusion Limited Cluster Aggregation (DLCA) method is employed to reconstruct the three-dimensional network of silica aerogel. Then, simulation of nitrogen adsorption at 77 K in silica aerogel is conducted by the Grand Canonical Monte Carlo (GCMC) method. To reduce the computational cost and guarantee accuracy, a continuous-discrete hybrid potential model, as well as an adsorbed layer thickness estimation method, is employed. Four different structures are generated to investigate impacts of specific surface area and porosity on adsorptive capacity. Good agreement with experimental results is found over a wide range of relative pressures, which proves the validity of the model. Specific surface area and porosity mainly affect nitrogen uptake under low pressure and high pressure, respectively.

1. Introduction

Silica aerogels are materials with high porosity, high specific surface area (SSA) and low density. They are promising in many applications, such as in heat insulators [1], drug delivery [2], effluent disposal [3,4] and fuel storage. These applications are based on their extraordinary properties of low thermal conductivity and good absorbability, which is caused by high porosity and nano-scale pores.
Three factors contribute to the thermal conductivity of silica aerogels: solid conductivity, gas transport and radiation. Liu [5] found, in simulation, that gas transport exerts an important effect on temperature response. Lee [6] observed enhanced self-diffusion of adsorbed methanol in silica aerogel in an experiment. Sun [7] found that for gases that could be adsorbed, such as N2 and CH4, flux caused by adsorption is on the order of the direct flux or larger during molecular dynamic simulation of molecular permeation through nanoporous graphene membranes. Adsorption could affect the heat insulation performance. Concerning various applications of silica aerogel, exact determination of the adsorption amount would be meaningful. However, there are few simulation studies on the adsorption in silica aerogels currently. On the other hand, just as in simulations that explored the design principles of metal-organic framework (MOF) [8,9] for certain purposes, molecular simulation may also guide us in surface modification of silica aerogels to achieve better performance in the fields mentioned above.
The grand canonical Monte Carlo (GCMC) method has been proved to be an effective way to simulate the adsorption isotherm and it has been widely used in predicting the uptake capacity of various materials [10,11]. Nitrogen adsorption has been a useful method in characterizing the nanoporous materials for pore size distribution [12,13] and SSA estimation [14] and there is plenty of experimental data for comparison. MacElroy [15] studied properties of methane, such as the Henry constant, in microporous silica with a random micro-sphere system and vitreous state sphere structure, and found results in satisfactory agreement with experimental data, and concluded that with a proper microsphere structure the numerical method could give a reasonable prediction on properties of simple nonpolar gases in silica aerogels. Ulker [16] simulated a nitrogen adsorption isotherm in silica aerogel MOF composite with conventional GCMC and it agrees with the experimental data. However, he treated the composite as a crystal, which may not work for pure silica aerogel. Le [17] constructed a silica cylindrical channel and simulated propane adsorption through the MD method. Only qualitative agreement with experimental results was obtained. Gavalda [18] applied the GCMC method to nitrogen adsorption in carbon aerogels and the results are close to the experimental isotherm in a wide range of relative pressures. In his simulation, carbon aerogels are modeled as a pack of overlapping hard spheres. Considering the structural similarities between carbon and silica aerogels, where they are all random networks consisting of nano-scale particles, it is reasonable to study nitrogen adsorption in silica aerogels with the GCMC method and hard sphere system.
In this paper, an approximate structure of silica aerogel is generated. Then a GCMC simulation of nitrogen adsorption is conducted to verify the model in the hope that it may shed light on heat and mass transport in silica aerogel.

2. Physical and Mathematical Model
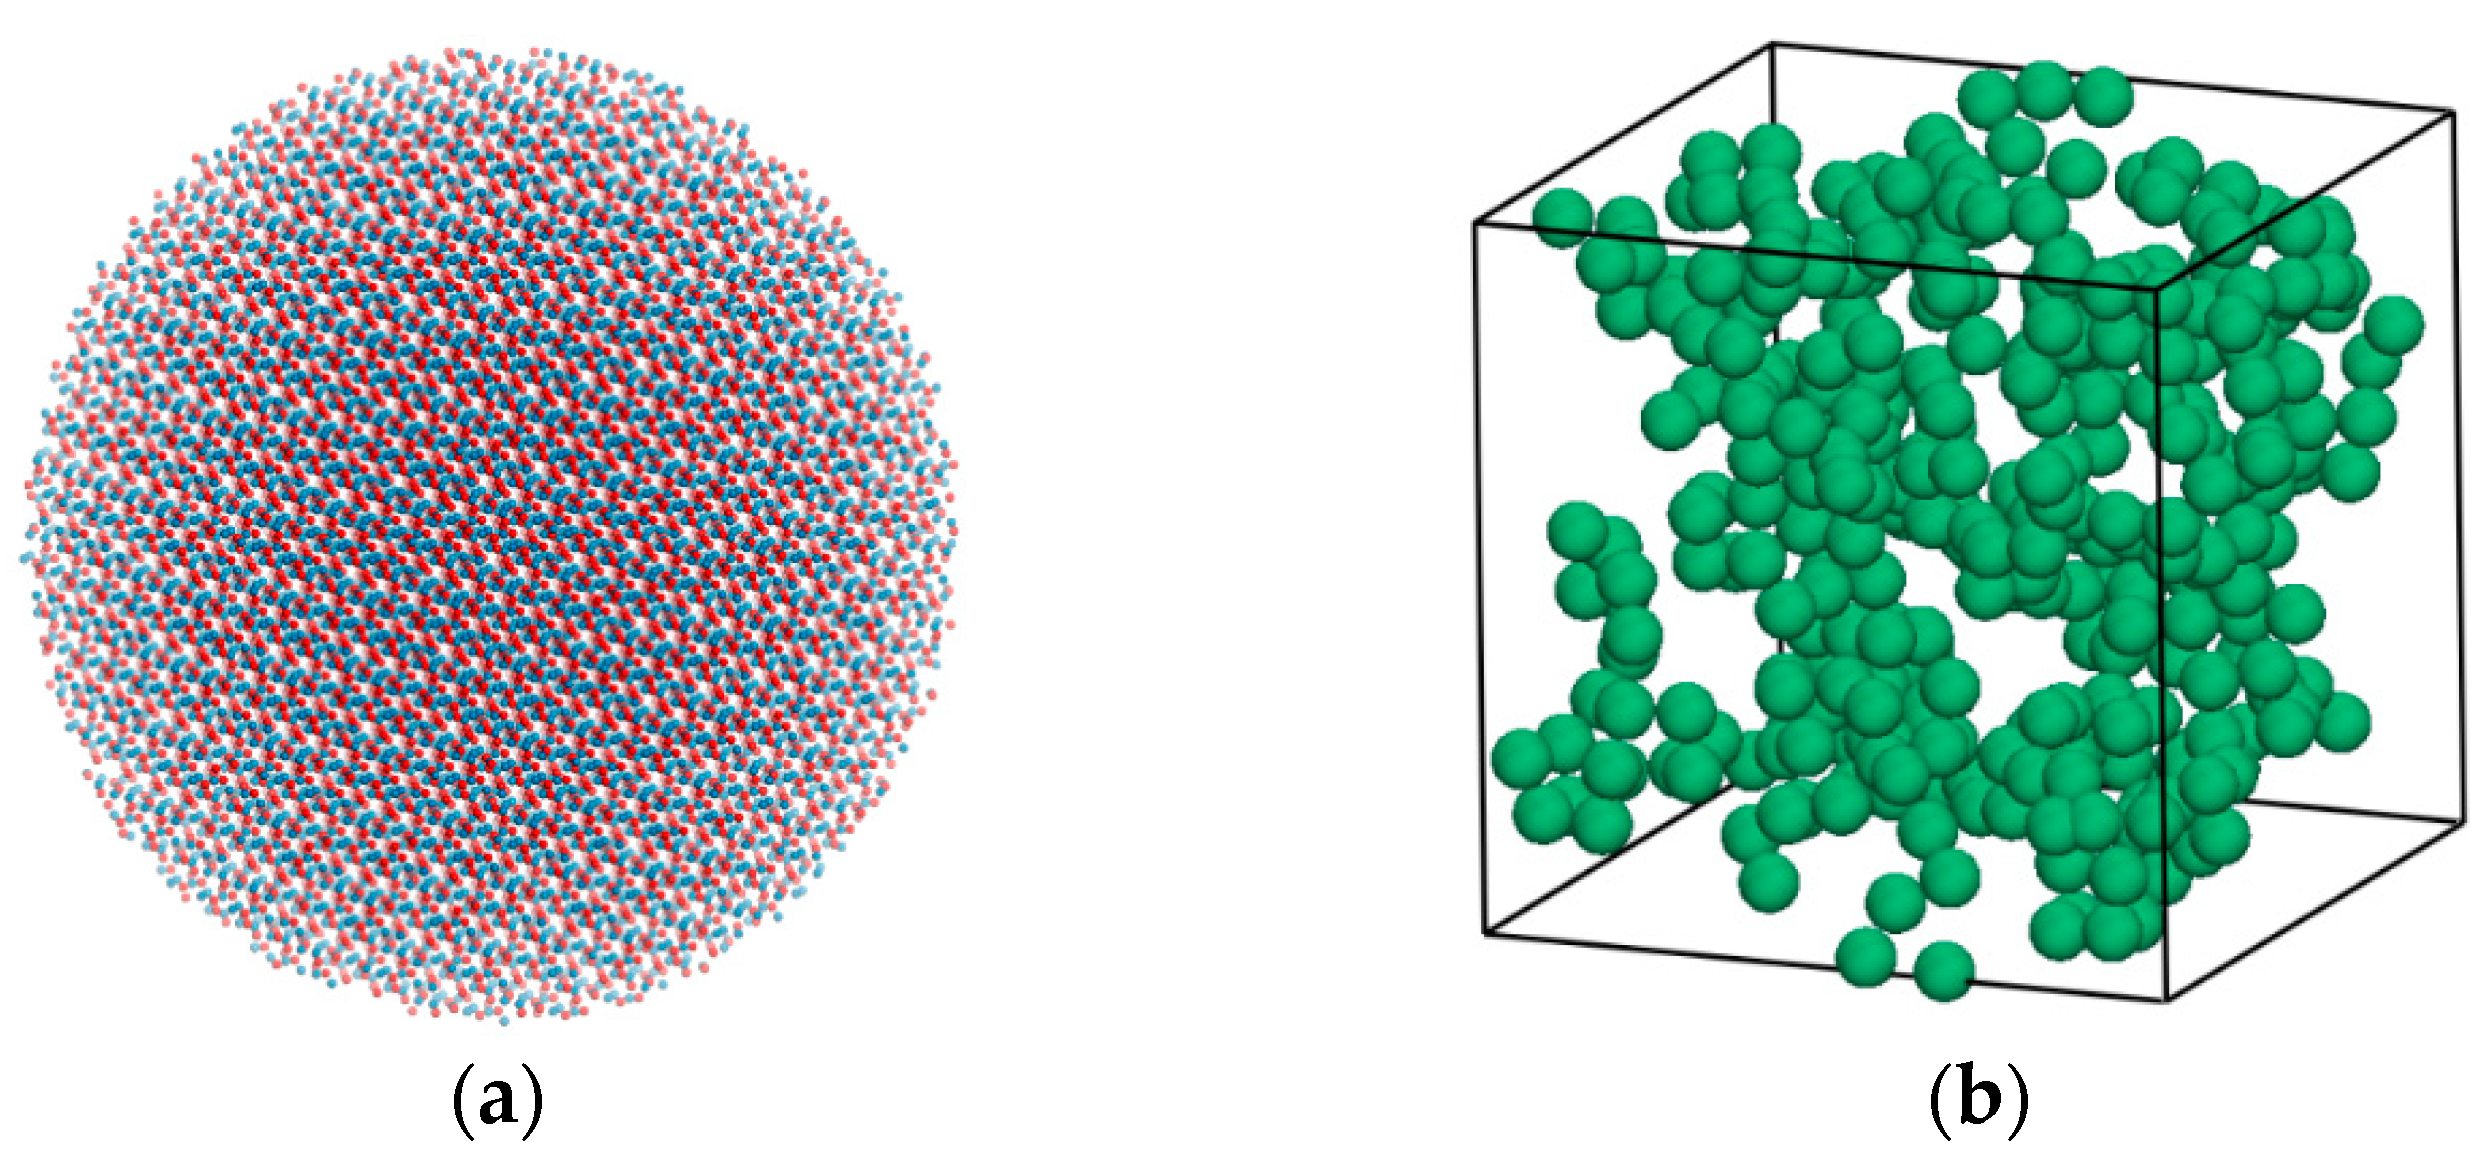
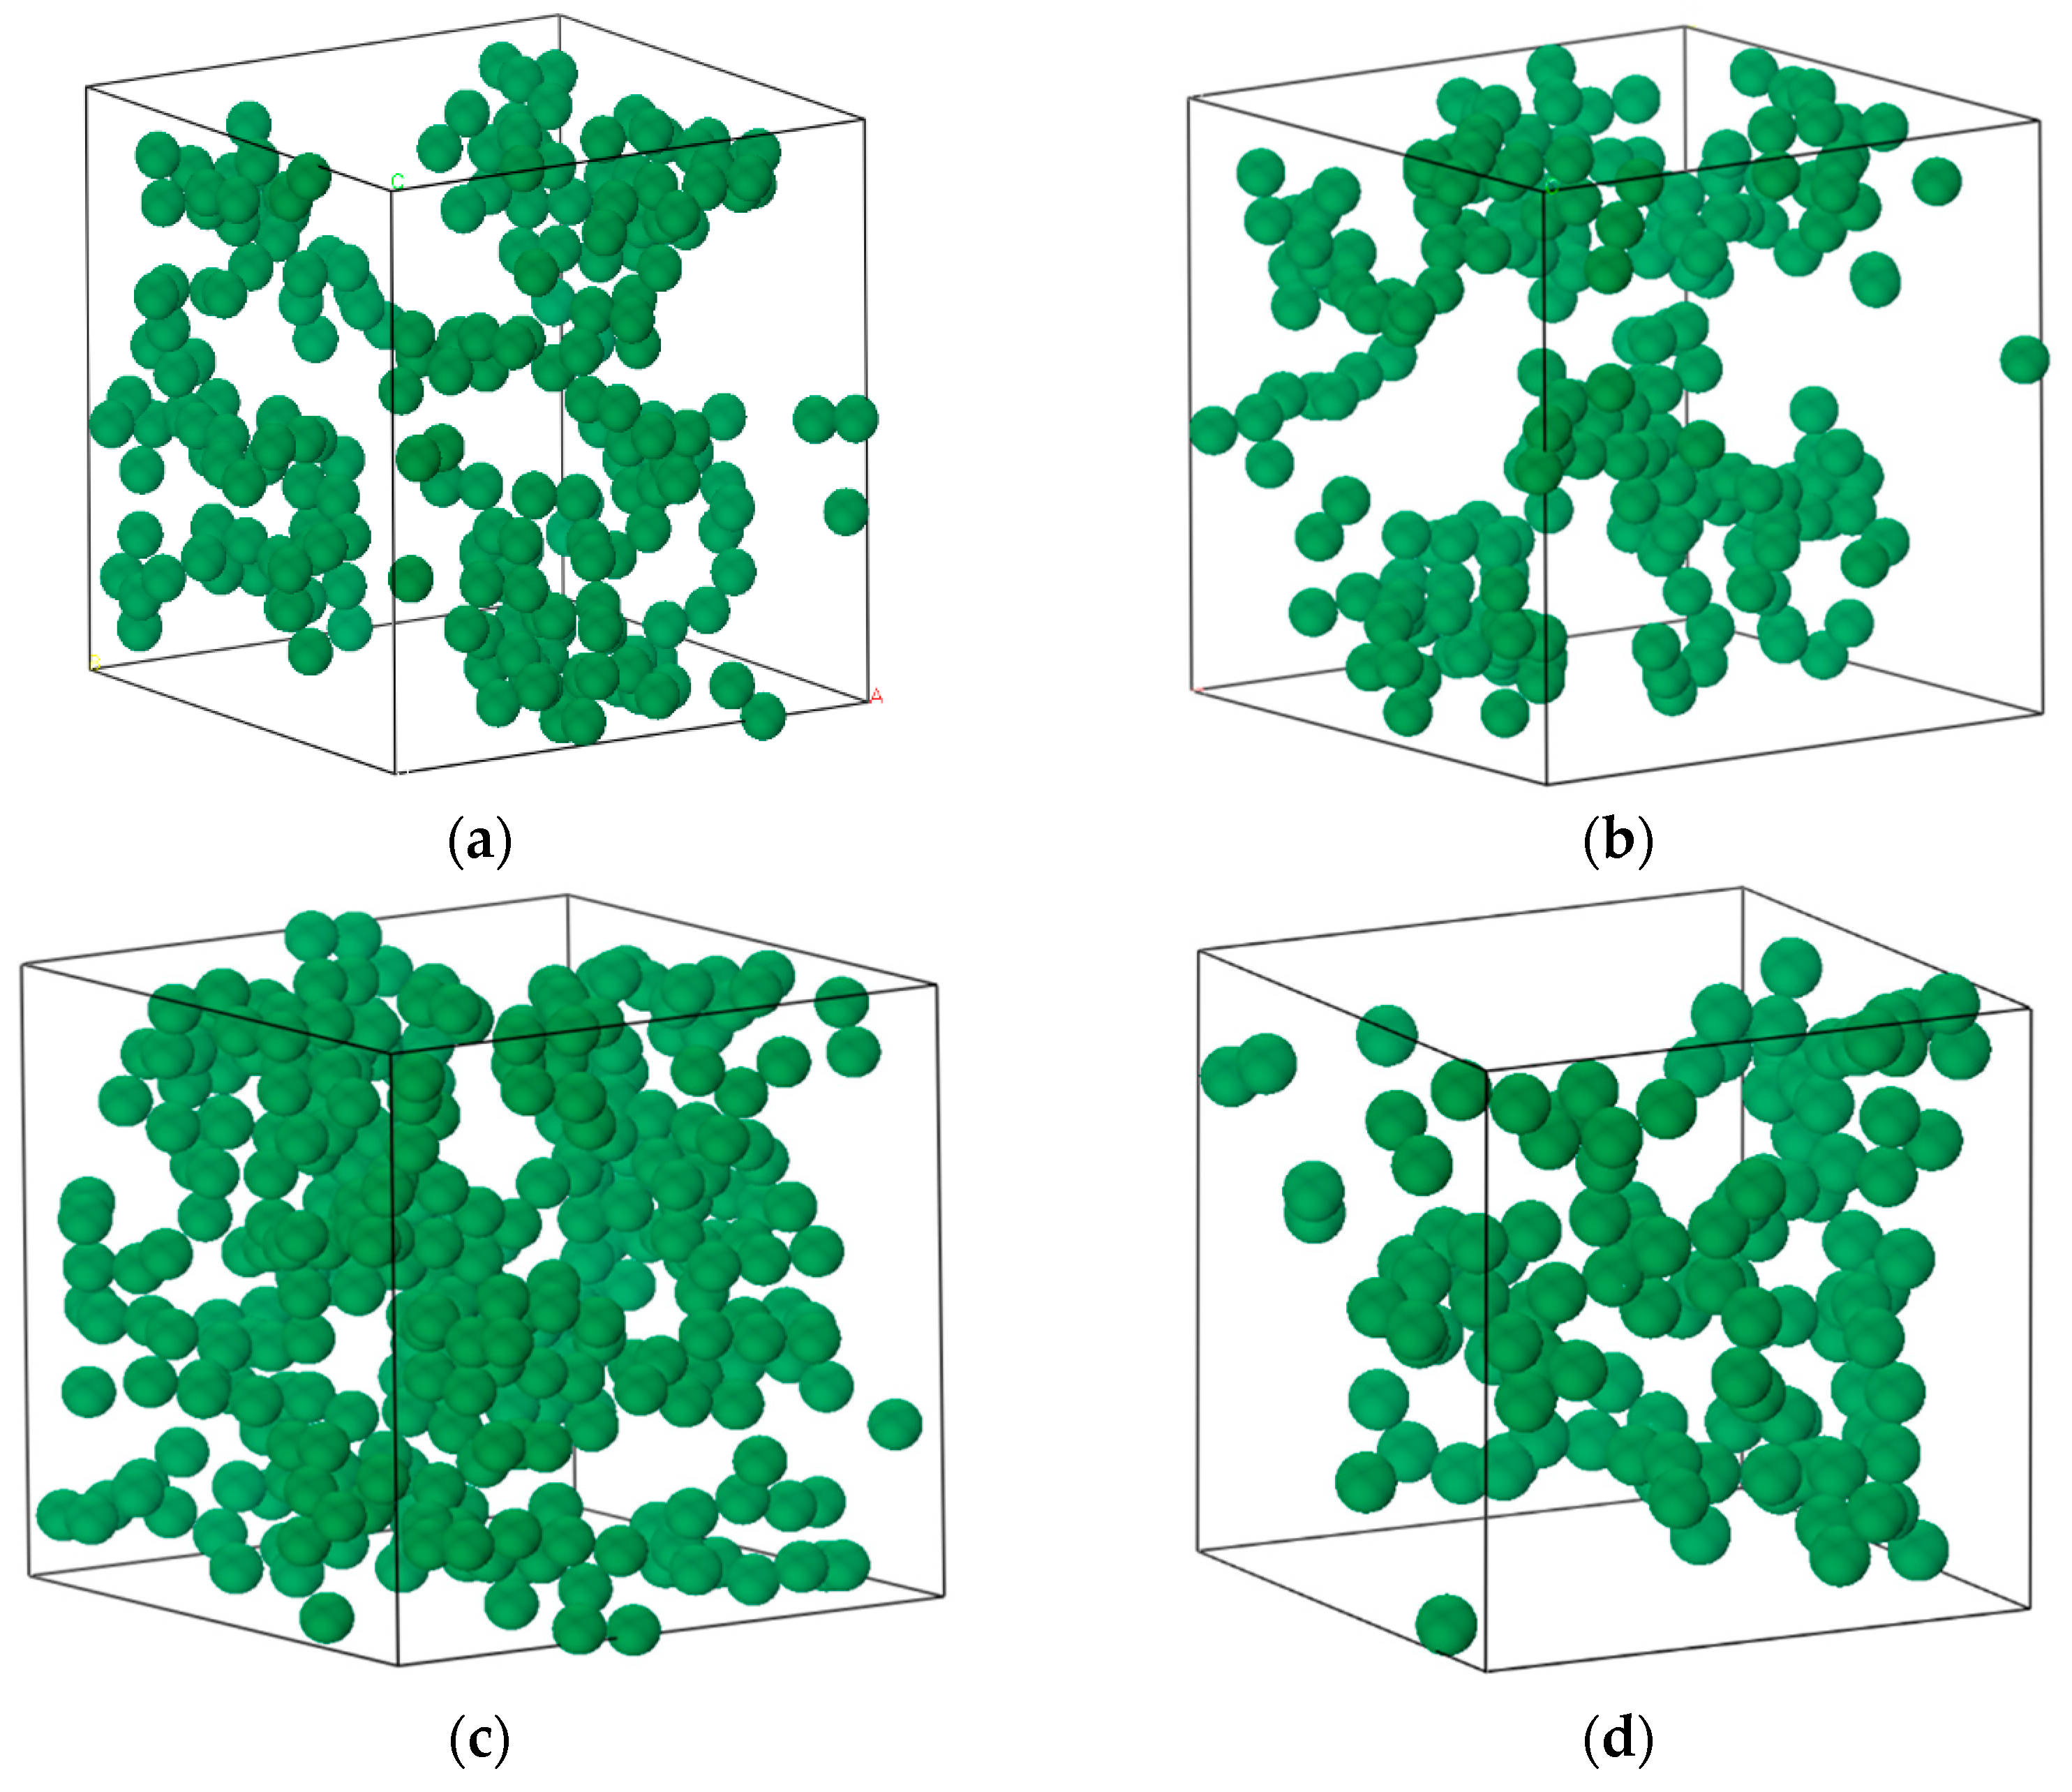
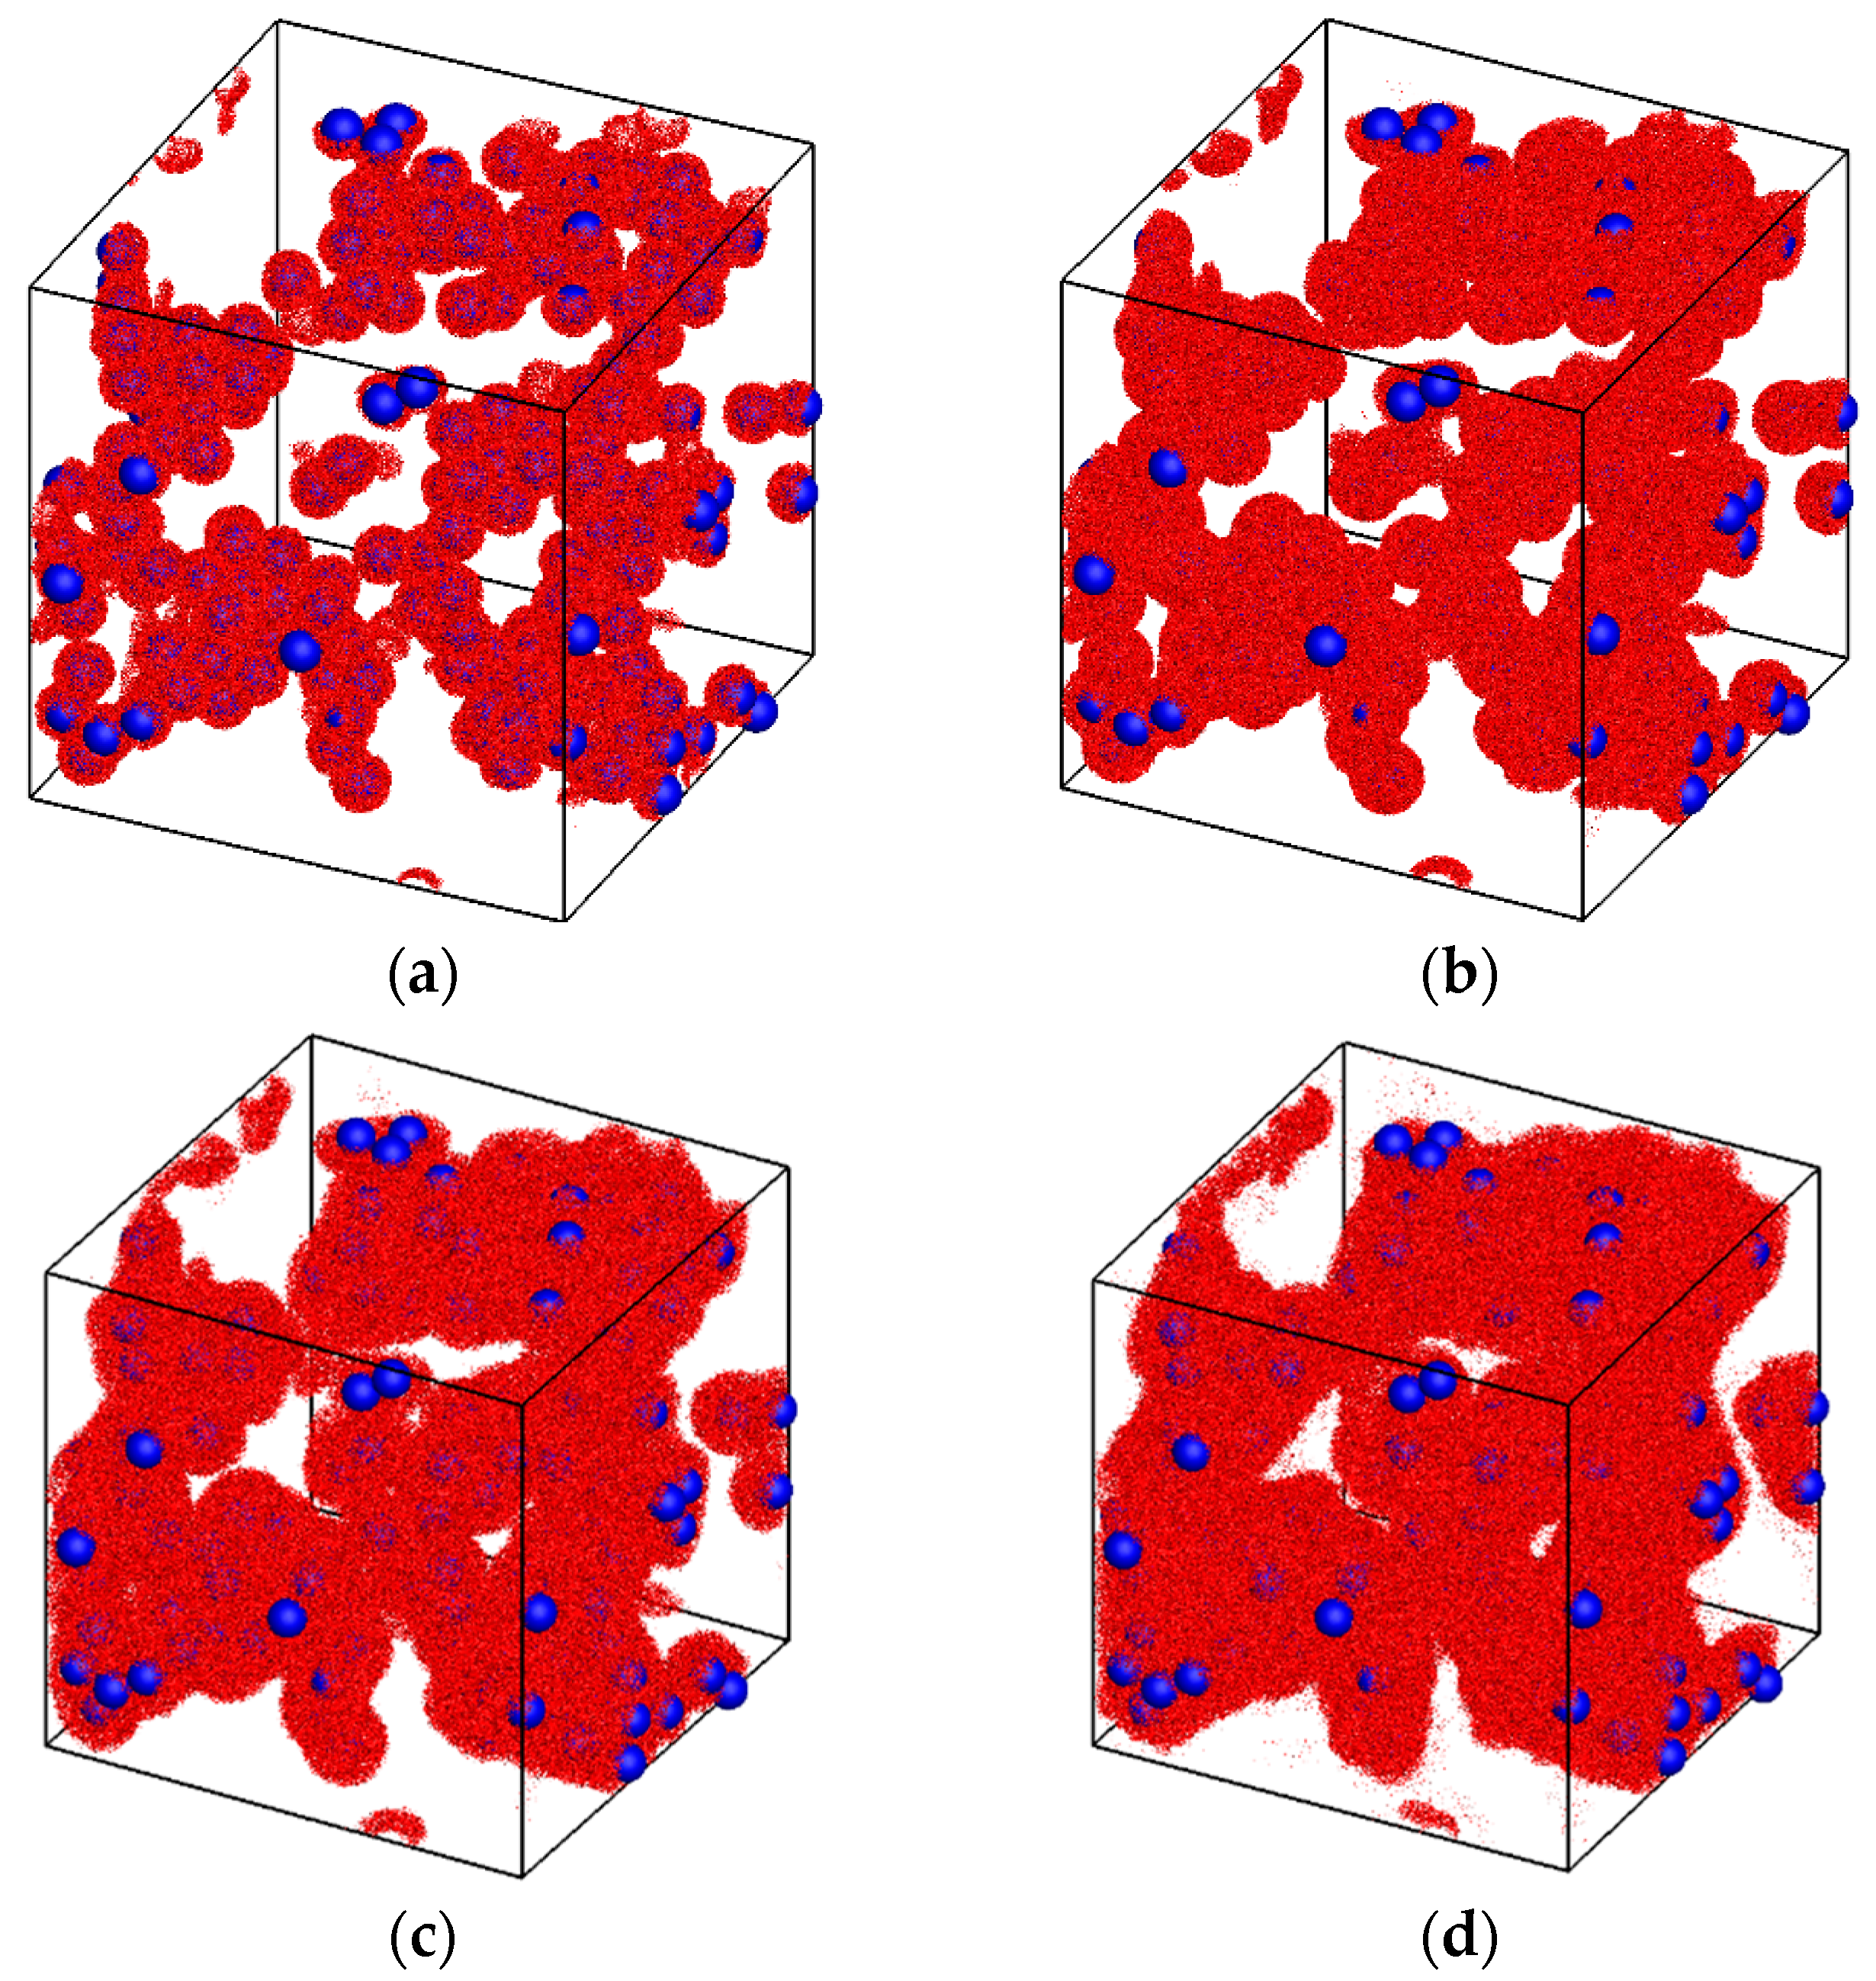
2.1. Physical Model

Silica aerogels are usually synthesized through the sol-gel process. Silica source solution with a catalyst undergoes chemical reactions and turns into a gel consisting of a three-dimensional network of SiO2. After aging and drying, primary particles form and then bond into secondary particles [19], which can be seen as a basic constructional element and constitute the skeleton. Ingredients, concentration and temperature can all influence the reaction rate and in turn affect the final skeleton shape. Thus, it is hard to trace the chemical reaction process to get the microstructure of aerogels. Meanwhile, the skeleton structure is vital to the study of adsorption behavior. Several models have been put forward. Zeng [20] proposed intersecting square rod, cylindrical rod and spherical structures to study thermal conductivity. However, characteristics of the microstructure are neglected for analytical convenience, which makes it not appropriate in adsorption simulation. Park [21] suggested four hard sphere models which are classified by overlappings and connections among these spheres. These models did not take characteristics of the formation process into consideration. Schaefer [22] found this network backbone to be fractal and it could be traced back to polymerization and colloid aggregation, which can be described by the diffusion limited cluster aggregation (DLCA) method [23]. Good [24] modeled the micro-structure of silica aerogel using the DLCA method and found it consistent with experimental observation. So here we adopt the DLCA method to reconstruct the micro-structure of silica aerogels.
The process can be described as follows. Initially, a group of spheres with a uniform radius are well distributed in a 100 nm × 100 nm × 100 nm box. Random walk is conducted for each sphere and then collisions are checked. If the distance between two spheres is within a certain range, they merge into one cluster and move as a whole. The periodic boundary condition is adopted during movement. Finally, a connected none-overlapping sphere system is acquired as shown in Figure 1 and this matrix of spheres is considered to be rigid during the simulation.
The final structure can be influenced by three important factors: number of particles (porosity), sphere radius (specific surface area) and randomness. To investigate the impacts of these factors, four matrixes, named M1, M2, M3 and M4, are generated as shown in Figure 2. M1 and M2 are of the same particle number and sphere radius. They are generated to study whether structural differences caused by randomness during the formation process affect adsorption capacity. The radius of M3 is close to that of M1 and M2, but the porosity is lower. It is intended to investigate the impacts of porosity. M4 is of a different particle number and sphere radius. Since the radius of the secondary particles that constitute silica aerogels usually ranges from 2 nm to 10 nm, and we want the SSA to be close to the experimental conditions, the sphere radius is set between 4 nm and 5 nm. Detailed information is shown in Table 1.

2.2. GCMC Method

Both fluid-fluid and fluid-solid interactions are given by Lennard-Jones 12-6 potential which takes the following form:
U i j = 4 ε ( ( σ i j r ) 12 ( σ i j r ) 6 )
Considering the composition similarities, the model developed by Hou et al. [25] for ITQ-1, a purely silica zeolite, is adopted for silica aerogel. In this model, oxygen and silicon atoms are taken into account, while for nitrogen, the force field parameter given by Gavalda et al., which has been proved effective in their experimental and numerical study of nitrogen adsorption in carbon aerogels, is employed. In this model, the nitrogen molecule is considered as a single rigid Lennard-Jones (L-J) sphere. However, a realistic nitrogen molecule consists of two atoms bonded together. So for cautious reasons, a pairwise model of N2 [26], in which nitrogen consists of two L-J sites at a distance of 0.1085 nm, is also adopted for comparison. Parameters are listed in Table 2. The Lorentz-Berthelot mixing rules are adopted to calculate interaction parameters between different atoms.
In order to reduce computational cost, a continuum model [27] which describes interactions between a single molecular L-J site of nitrogen and a solid sphere is introduced. In this model, the aerogel nanosphere is considered as a continuum of L-J sites with a density ρ . Thus, the potential between a molecular L-J site and the sphere can be written as:
U c s ( d ) = 0 2 π 0 π 0 R ρ u ( d , r , θ , φ ) r 2 sin θ   d r · d θ · d φ
where R is the radius of the sphere, d is the distance between the center of the sphere and the molecular L-J site, and u is the interaction between a molecular L-J site and a tiny part of the sphere defined by relative spherical coordinates ( r , θ , φ ) . By using the L-J 12-6 potential, we get:
u ( d , r , θ , φ ) = 4 ε [ σ 12 ( r 2 2 d r   cos θ + d 2 ) 6 σ 6 ( r 2 2 d r   cos θ + d 2 ) 3 ]
Substitute Equation (2) into Equation (3) and integrate them, and we get:
U c s ( d ) = 16 3 π ρ R 3 ε [ ( d 6 + 21 d 4 R 2 / 5 + 3 d 2 R 4 + R 6 / 3 ) σ 12 ( d 2 R 2 ) 9 σ 6 ( d 2 R 2 ) 3 ]
when d R , Equation (4) turns into the following form:
U c s s i m ( d ) = 16 3 π ρ R 3 [ ( σ d ) 12 ( σ d ) 6 ]
This continuum model may not work well when d is close to R due to the continuous L-J sites assumption of the solid sphere. So when dR is less than 3σN, direct summation of discrete Uij between adsorbent atoms and adsorbate molecules is adopted. Thus, the final form of potential between a sphere and a nitrogen molecule takes the form:
U M S ( d ) = { i = 1 N O U ( d ) + i = 1 N S i U ( d )       R d < R + 3 σ N U C S ( d )     R + 3 σ N d < 10 R U C S s i m ( d )     10 R <   d
where No is the number of oxygen atoms and NSi is the number of silicon atoms in a sphere. In molecule-solid interactions, the minimum image convention is used. As for interactions between nitrogen molecules, simple truncation is applied. The truncation distance in this paper is set as 20 Å, approximately 5σN.
The GCMC method is used in determining the adsorption isotherm. For such a system, it is hard to get equilibrium, especially for points near saturated vapor pressure. To increase the insertion acceptance rate, the Frank-Halsey-Hill (FHH) equation is used to estimate adsorption layer thickness δ (Å):
δ = B ( 1 ln ( p / p 0 ) ) m
To get B and m, we assume each adsorbed molecule occupies the same volume V. Thus, we get:
V = 4 2 3 π σ N 3
N V = 4 3 π [ ( R + δ ) 3 R 3 ]
where N is the number of adsorbed molecules. So we get:
N = ( R + δ ) 3 R 3 2 σ N 3
By fitting experimental data, we get N. Then B and m could be acquired through Equation (10). For R = 4.05 nm, B = 12.02 Å and m = 0.4984. In order to accelerate equilibrium and avoid missing some space where molecules could be adsorbed, B = 20.0 Å is used in the simulation.
Prior to these operations, we first divide the simulation box into 4 nm × 4 nm × 4 nm (two times the truncation distance) grids with coordinates of (x,y,z) (x, y, z are integers from 0 to 24; totally 25 × 25 × 25 grids in a simulation box). Then we divide each grid into eight 2 nm × 2 nm × 2 nm sub-grids with coordinates of (a,b,c) (a, b, c = −1 or 1, totally 2 × 2 × 2 sub-grids in each grid). The creation operation follows the following steps: (1) Randomly choose a solid sphere and insert a molecule within the layer thickness; (2) Check whether the molecule overlaps any solid sphere. If yes, go back to step one. Otherwise, go to step 3; (3) Identify the grid (x,y,z) and sub-grid (a,b,c) location of the molecule and get the contiguous grids of the sub-grid where the molecule is. Then calculate interactions between the inserted molecule and the existing molecules in these eight grids (x ~ x + a, y ~ y + b, z ~ z + c) and the solid spheres. For example, if the grid coordinate is (3,6,9) and the sub-grid coordinate is (−1,1,−1), then the eight grids we need are (2 ~ 3, 6 ~ 7, 8 ~ 9). Through this method, we just need to calculate eight grids instead of 27. The calculation amount is significantly reduced; (4) Decide whether the creation is accepted with probability of
P ( N N + 1 ) = min { 1 , V Λ 3 ( N + 1 ) exp { 1 k B T [ μ U ( N + 1 ) + U ( N ) ] } }
where N is the number of existing molecules, V is the volume of the simulation box, μ is the chemical potential, Λ is the de Broglie wavelength, kB is the Boltzmann constant, U is the potential and T is the temperature. If accepted, go to the displacement operation; otherwise, go back to step 1.
As to the displacement operation, we first randomly choose one from the list of existing molecules with equal probability. Record its original coordinate ( r , θ , φ ) and move it to ( r + Δ r ,   θ + Δ θ ,   φ + Δ φ ) . After that, the spherical coordinate is changed to a rectangular coordinate. Coordinate transformation looks time-consuming. However, as we know, the potential of positions near the surface of the solid sphere is usually lower than that of positions that are far away. Moving in a spherical coordinate ensures the system moves towards a lower potential with more probability compared to a rectangular coordinate system. Then calculate the potential as described in step 3 of creation above and accept the movement with a probability of
P ( s s ) = min { 1 , exp [ U ( s ) U ( s ) k B T ] }
where s is the configuration before movement and s′ is the new configuration. If it is accepted, check whether the molecule is moved to another grid. If yes, add a new molecule at the end of the list of the new grid and delete it from the original grid; if not, record the new position. If it is not accepted, move it back. Then go to operation deletion.
In operation removal, we first randomly choose a molecule from existing ones with equal probability, calculate the potential as described in step 3 of the creation operation, and accept removal with a probability of
P ( N + 1 N ) = min { 1 , Λ 3 N V exp { 1 k B T [ μ + U ( N 1 ) U ( N ) ] } }
A typical step includes all three operations mentioned above and they are performed once respectively in a step. The adsorption amount under pressure from 0.103 to 0.923 is calculated. Then, 100 million steps when P/P0 < 0.6, 300 million steps when 0.6 ≤ P/P0 < 0.8 and 600 million steps when 0.8 ≤ P/P0 are run to get equilibrium and another 100–200 million steps are run for the statistical average. The configuration of lower pressure is used as the primary configuration of the following higher pressure. The simulation is done through self-written code.

3. Results and Discussion

Results of the simulative adsorption isotherm compared to the experiment [28] are shown in Figure 3. All exhibit a type IV isotherm. Good agreement with experimental data is found during middle pressure.
First, there is a little gap between the adsorption isotherms of the two nitrogen models. In the dimer model, electrostatic potential is not taken into consideration due to limited computational resources, which is responsible for the overall lower adsorption amount. The systematic underestimation of gas sorption is not caused by gas models.
There is little discrepancy between M1 and M2, which indicates that structural differences caused by randomness during the formation process do not notably affect the adsorption capacity. Simulation results of M1 and M2 are the closest to the experimental thanks to parameter likeness, while M3 and M4 have a lower adsorption amount compared to the experimental isotherm due to less specific surface area or less porosity. Several reasons might be responsible for differences between the isotherms of M1 and the experiment: (1) The first reason is microstructural differences of the sphere. There are various groups, such as methyl and oxhydryl, on the surface of realistic particles. However, only oxygen and silicon atoms are considered in the model. Additionally, surface atom density plays an important role in determining adsorptive capacity, but in the model it may not agree with the realistic surface density. Lastly, realistic particles may overlap nearby particles. However, they are simply modeled as non-overlapping spheres in the simulation. (2) The second reason is pore size distribution. Though the porosity is close, the pore size distribution may not be. (3) The third reason is neglected adsorption sites. This simulation only pays attention to adsorption on the surface of spheres and in the pores among them. Possible adsorption which takes place in the microchannels within the sphere is neglected.
Under low pressure, specific surface area affects the adsorption amount. A structure with more SSA takes in more nitrogen, but discrepancies are not significant. When it comes to high pressure (P/P0 ≥ 0.72), porosity plays a dominant role in determining the adsorption capacity. The nitrogen uptake of M1 and M4 is similar due to similar porosity, though the SSA is different. In contrast, M1 and M3 are of similar SSA, but there are significant differences in their nitrogen load.
Snapshots of adsorption at different relative pressures in M1 are shown in Figure 4. At first, molecules are mainly absorbed on the surface of the spheres. As the relative pressure increases, multiple layers of adsorbed molecules form. Under high pressure, nitrogen molecules gradually fill the pores among the spheres. The number density distribution (Figure 5) shows that the adsorbed molecule exhibits an intermediate state between gas and liquid.

4. Conclusions

Through the comparison of simulative results and the experimental data, validity of the combination of the sphere system generated through the DLCA method and the continuous-discrete hybrid potential model is proved. The simulative isotherm corresponds to type IV. Adsorption takes place on the surface of spheres under low pressure. As pressure increases, nitrogen molecules gradually fill the pores among the spheres. Specific surface area affects the adsorption capacity under low pressure, while porosity controls the adsorptive capacity under high pressure.
The model did not take possible adsorption sites within the sphere into consideration, which might be the main reason for the discrepancies between the simulative and experimental data. The interior structure of the sphere needs to be improved for a better prediction. Surface atoms could be altered to study the impacts of surface modification on adsorbability. The thickness of the adsorbed layer grows rapidly with relative pressure and could reach a few nanometers, to the scale of pores, which could significantly affect the mass and energy transport in silica aerogel. Exact determination of the amount of the adsorbed gas molecules could help the multi-scale simulation of the transport process in the future.

Acknowledgments

This work is supported by the National Natural Science Foundation of China (51276138).

Author Contributions

Li conceived and designed the simulation and edited the manuscript. Xie carried out the simulation and wrote the manuscript with Chen. Tao provided algorithm guidance. All of the authors have read and approved the final manuscript.

Conflicts of Interest

The authors declare no conflict of interest.

References

  1. Baetens, R.; Jelle, B.P.; Gustavsen, A. Aerogel insulation for building applications: A state-of-the-art review. Energy Build. 2011, 19, 761–769. [Google Scholar] [CrossRef]
  2. Smirnova, I.; Mamic, J.; Arlt, W. Adsorption of drugs on silica aerogels. Langmuir 2003, 19, 8521–8525. [Google Scholar] [CrossRef]
  3. Standeker, S.; Novak, Z.; Knez, Z. Adsorption of toxic organic compounds from water with hydrophobic silica aerogels. J. Colloid Interface Sci. 2007, 310, 362–368. [Google Scholar] [CrossRef] [PubMed]
  4. Adebajo, M.O.; Frost, R.L.; Kloprogge, J.T.; Carmody, O.; Kokot, S. Porous materials for oil spill cleanup: A review of synthesis and absorbing properties. J. Porous Mater. 2003, 10, 159–170. [Google Scholar] [CrossRef] [Green Version]
  5. Liu, H.; Li, Z.Y.; Zhao, X.P.; Tao, W.Q. Investigation of the effect of the gas permeation induced by pressure gradient on transient heat transfer in silica aerogel. Int. J. Heat Mass Transf. 2016, 95, 1026–1037. [Google Scholar] [CrossRef]
  6. Lee, J.A.; Mounce, A.M.; Oh, S.; Zimmerman, A.M.; Halperin, W.P. Enhanced self-diffusion of adsorbed methanol in silica aerogel. Phys. Rev. B 2014, 90, 174501. [Google Scholar] [CrossRef]
  7. Sun, C.; Boutilier, M.S.; Au, H.; Poesio, P.; Bai, B.; Karnik, R.; Hadjiconstantinou, N.G. Mechanisms of molecular permeation through nanoporous graphene membranes. Langmuir 2014, 30, 675–682. [Google Scholar] [CrossRef] [PubMed]
  8. Han, S.S.; Deng, W.Q.; Goddard, W.A. Improved designs of metal-organic frameworks for hydrogen storage. Angew. Chem. 2007, 119, 6405–6408. [Google Scholar] [CrossRef]
  9. Düren, T.; Bae, Y.S.; Snurr, R.Q. Using molecular simulation to characterise metal-organic frameworks for adsorption applications. Chem. Soc. Rev. 2009, 38, 1237–1247. [Google Scholar] [CrossRef] [PubMed]
  10. Mpourmpakis, G.; Froudakis, G.E.; Lithoxoos, G.P.; Samios, J. SiC nanotubes: A novel material for hydrogen storage. Nano. Lett. 2006, 6, 1581–1583. [Google Scholar] [CrossRef] [PubMed]
  11. Chen, L.; Grajciar, L.; Nachtigall, P.; Düren, T. Accurate prediction of methane adsorption in a metal-organic framework with unsaturated metal sites by direct implementation of an ab initio derived potential energy surface in GCMC simulation. J. Phys. Chem. C 2011, 115, 23074–23080. [Google Scholar] [CrossRef]
  12. Ravikovitch, P.I.; Vishnyakov, A.; Russo, R.; Neimark, A.V. Unified approach to pore size characterization of microporous carbonaceous materials from N2, Ar, and CO2 adsorption isotherms. Langmuir 2000, 16, 2311–2320. [Google Scholar] [CrossRef]
  13. Ravikovitch, P.I.; Wei, D.; Chueh, W.T.; Haller, G.L.; Neimark, A.V. Evaluation of pore structure parameters of MCM-41 catalyst supports and catalysts by means of nitrogen and argon adsorption. J. Phys. Chem. B 1997, 101, 3671–3679. [Google Scholar] [CrossRef]
  14. Ohba, T.; Kaneko, K. Internal surface area evaluation of carbon nanotube with GCMC simulation-assisted N2 adsorption. J. Phys. Chem. B 2002, 106, 7171–7176. [Google Scholar] [CrossRef]
  15. MacElroy, J.M.D.; Raghavan, K. Adsorption and diffusion of a Lennard-Jones vapor in microporous silica. J. Chem. Phys. 1990, 93, 2068–2079. [Google Scholar] [CrossRef]
  16. Ulker, Z.; Erucar, I.; Keskin, S.; Erkey, C. Novel nanostructured composites of silica aerogels with a metal organic framework. Microporous Mesop. Mater. 2013, 170, 52–358. [Google Scholar] [CrossRef]
  17. Le, T.; Striolo, A.; Cole, D.R. Propane simulated in silica pores: Adsorption isotherms, molecular structure, and mobility. Chem. Eng. Sci. 2015, 121, 292–299. [Google Scholar] [CrossRef]
  18. Gavalda, S.; Gubbins, K.E.; Hanzawa, Y.; Kaneko, K.; Thomson, K.T. Nitrogen adsorption in carbon aerogels: A molecular simulation study. Langmuir 2002, 18, 2141–2151. [Google Scholar] [CrossRef]
  19. Zhang, G.; Dass, A.; Rawashdeh, A.M.M.; Thomas, J.; Counsil, J.A.; Sotiriou-Leventis, C.; Fabrizio, E.F.; Ilhan, F.; Vassilaras, P.; Scheiman, D.A.; et al. Isocyanate-crosslinked silica aerogel monoliths: Preparation and characterization. J. Non-Cryst. Solids 2004, 350, 152–164. [Google Scholar] [CrossRef]
  20. Zeng, S.Q.; Hunt, A.; Greif, R. Geometric structure and thermal conductivity of porous medium silica aerogel. J. Heat Transf. 1995, 117, 1055–1058. [Google Scholar] [CrossRef]
  21. Park, I.-A.; MacElroy, J.M.D. Simulation of a hard-sphere fluid in bicontinuous random media. Mol. Simul. 1989, 2, 105–145. [Google Scholar] [CrossRef]
  22. Schaefer, D.W.; Keefer, K.D. Structure of random porous materials: Silica aerogel. Phys. Rev. Lett. 1986, 56, 2199–2202. [Google Scholar] [CrossRef] [PubMed]
  23. Paul, M. Formation of fractal clusters and networks by irreversible diffusion-limited aggregation. Phys. Rev. Lett. 1983, 51, 1119–1122. [Google Scholar]
  24. Good, B. Structure and thermal conductivity of silica aerogels from computer simulations. MRS Proc. 2005, 885. [Google Scholar] [CrossRef]
  25. Hou, T.J.; Zhu, L.L.; Li, Y.Y.; Xu, X.J. The localization and adsorption of benzene and propylene in ITQ-1 zeolite: Grand canonical Monte Carlo simulations. J. Mol. Struct. Theochem 2001, 535, 9–23. [Google Scholar] [CrossRef]
  26. Makrodimitris, K.; Papadopoulos, G.K.; Theodorou, D.N. Prediction of permeation properties of CO2 and N2 through silicalite via molecular simulations. J. Phys. Chem. B 2001, 105, 777–788. [Google Scholar] [CrossRef]
  27. Kaminsky, R.D.; Monson, P.A. The influence of adsorbent microstructure upon adsorption equilibria: Investigations of a model system. J. Phys. Chem. 1991, 95, 2936–2948. [Google Scholar] [CrossRef]
  28. El Rassy, H.; Buisson, P.; Bouali, B.; Perrard, A.; Pierre, A.C. Surface characterization of silica aerogels with different proportions of hydrophobic groups, dried by the CO2 supercritical method. Langmuir 2003, 19, 358–363. [Google Scholar] [CrossRef]
Figure 1. Silica aerogel structure. (a) A single nanosphere; (b) The reconstructed spherical cluster system.
Computation 04 00018 g001
Figure 2. Sphere system with different porosity and SSA. (a) M1; (b) M2; (c) M3; (d) M4.
Computation 04 00018 g002
Figure 3. Comparison of nitrogen adsorption amount.
Computation 04 00018 g003
Figure 4. Nitrogen adsorption at different relative pressure: (a) P/P0 = 0.10; (b) P/P0 = 0.51; (c) P/P0 = 0.82; (d) P/P0 = 0.92.
Computation 04 00018 g004
Figure 5. Adsorbed molecules’ number density distribution.
Computation 04 00018 g005
Table 1. Parameters of microstructures.
CharacteristicsValue
Experimental Study [13]M1M2M3M4
Porosity (%)9494.0094.0089.7093.46
Specific Surface (m2/g)837930930895547
Sphere Radius (nm)/4.054.054.155.00
Number of Particles/216216343125
Table 2. Lennard-Jones (L-J) parameters.
Atom σ ( n m ) ε / k B ( K )
N20.37595.20
N2 (dimer)0.33036.20
O0.33082.98
Si0.42023.61

