Article

Pore-Network Modeling of Water and Vapor Transport in the Micro Porous Layer and Gas Diffusion Layer of a Polymer Electrolyte Fuel Cell

by
Chao-Zhong Qin
*,
S. Majid Hassanizadeh
and
Lucas M. Van Oosterhout
Integrated Experimental and Computational Laboratory for Porous Media Research, Department of Earth Sciences, University of Utrecht, Princetonplein 9, P.O. Box 80021, 3508 TA Utrecht, The Netherlands
*
Author to whom correspondence should be addressed.
Computation 2016, 4(2), 21; https://doi.org/10.3390/computation4020021
Submission received: 11 January 2016 / Revised: 16 May 2016 / Accepted: 23 May 2016 / Published: 30 May 2016
(This article belongs to the Special Issue Advances in Modeling Flow and Transport in Porous Media)

Abstract

:
In the cathode side of a polymer electrolyte fuel cell (PEFC), a micro porous layer (MPL) added between the catalyst layer (CL) and the gas diffusion layer (GDL) plays an important role in water management. In this work, by using both quasi-static and dynamic pore-network models, water and vapor transport in the MPL and GDL has been investigated. We illustrated how the MPL improved water management in the cathode. Furthermore, it was found that dynamic liquid water transport in the GDL was very sensitive to the built-up thermal gradient along the through-plane direction. Thus, we may control water vapor condensation only along GDL-land interfaces by properly adjusting the GDL thermal conductivity. Our numerical results can provide guidelines for optimizing GDL pore structures for good water management.

Graphical Abstract

1. Introduction

Water management plays a critical role in the performance and durability of low-temperature polymer electrolyte fuel cells (PEFCs). A delicate water balance in the system must be maintained in order to keep the membrane hydrated, and meanwhile avoid liquid water flooding in porous components and flow fields, i.e., gas channels [1]. Over the past two decades, numerous studies have been conducted for improving our understanding of water transport mechanisms within the PEFC [2,3,4,5,6,7,8,9,10]. Compared to the anode side, water transport in the cathode has usually attracted more attention. This is because the cathode is prone to being flooded first, and the oxygen reduction reaction (ORR) is very sluggish.
Many efforts have been made to improve water management by optimizing the porous structure of gas diffusion layer (GDL). Particularly, it was found that in the cathode adding one/multiply micro porous layers (MPLs) between the catalyst layer (CL) and the GDL can dramatically improve the cell performance at high current densities. This improvement was primarily attributed to a better water management [6]. The MPL is typically consisted of carbon power bound with a hydrophobic polymer (e.g., PTFE). It has much smaller pore sizes than those in the GDL. Besides assisting in water management, the MPL performs several other roles in improving the GDL function such as providing a smooth surface in contact with the CL, preventing catalyst migration into the GDL substrate and losing contact with the membrane, and enhancing electronic transport to the bipolar plates [7].
Over the past few years, many studies have been dedicated to understating the mechanisms of the MPL in regulating water transport in the PEFC. These include in situ and ex situ experiments and continuum-scale and pore-scale numerical simulations [8,9,10,11,12,13,14]. In ex situ experiments, by analyzing water balance measurements and polarization curves, several typical mechanisms were proposed such as enhancing back diffusion of water to the anode [15] and preventing condensed water from accumulating and blocking oxygen access to the cathode CL [10]. Due to the strong coupling between heat and phase change, some observations may be controversial to each other under versatile operating conditions. Non-invasive visualization techniques were also employed to gain insights into the MPL function in the water management. It was found that the presence of an MPL significantly reduced the water content at the CL-GDL interfacial region [9]. In Deevanhaxay et al.’s [8] in situ observations, it was found that liquid water was transported to the GDL mainly through the cracks in the MPL; and the water content in the MPL was low near the CL and high towards the GDL side.
On the other hand, the pore-scale modeling has been playing an important role in supplementing laboratory experiments for understating water movement in the cell. In the literature, there have been many pore-scale numerical studies of liquid water transport in the GDL ([2,16,17,18] many thereof) and gas channels (GCs) [19]. Recently, evaporation was also included in the pore-network modeling [2,20] for understating its role in water management. However, up to now, only a few studies of pore-scale modeling of the bi-layer porous medium (i.e., the GDL and MPL) are conducted [13,14,16]. According to our best knowledge, none of them considered water vapor transport and its coupling with liquid water. It is worth nothing that, due to the build-up of thermal gradient in the through-plane direction, water vapor transport may play a dominant role in the MPL’s and GDL’s functionalities of water management, particularly at a high operating temperature (e.g., 80 °C). This has been illustrated by our pore-scale studies.
In this work, we have modeled the cotransport of liquid water and vapor in the MPL and GDL using our previously developed dynamic pore-network model [2]. To consider the effect of a built-up thermal gradient on water transport, a linear temperature distribution along the through-plane direction was assumed, instead of solving the pore-scale heat transfer. Furthermore, we improved the numerical algorithm for updating liquid water saturation such that the computational effort has been considerably reduced. In addition, we employed new pore-network structures of the GDL and MPL. In comparison with those in previous studies, they may better represent realistic porous structures. More detail is given in Section 2. Based on several case studies, the objective of this work is two-fold. One is to illustrate the mechanisms of the MPL in mitigating liquid water flooding in the cathode; the other one is to show the effects of GDL thermal conductivity, cell operating temperature, and operating current density on liquid water transport in the GDL.

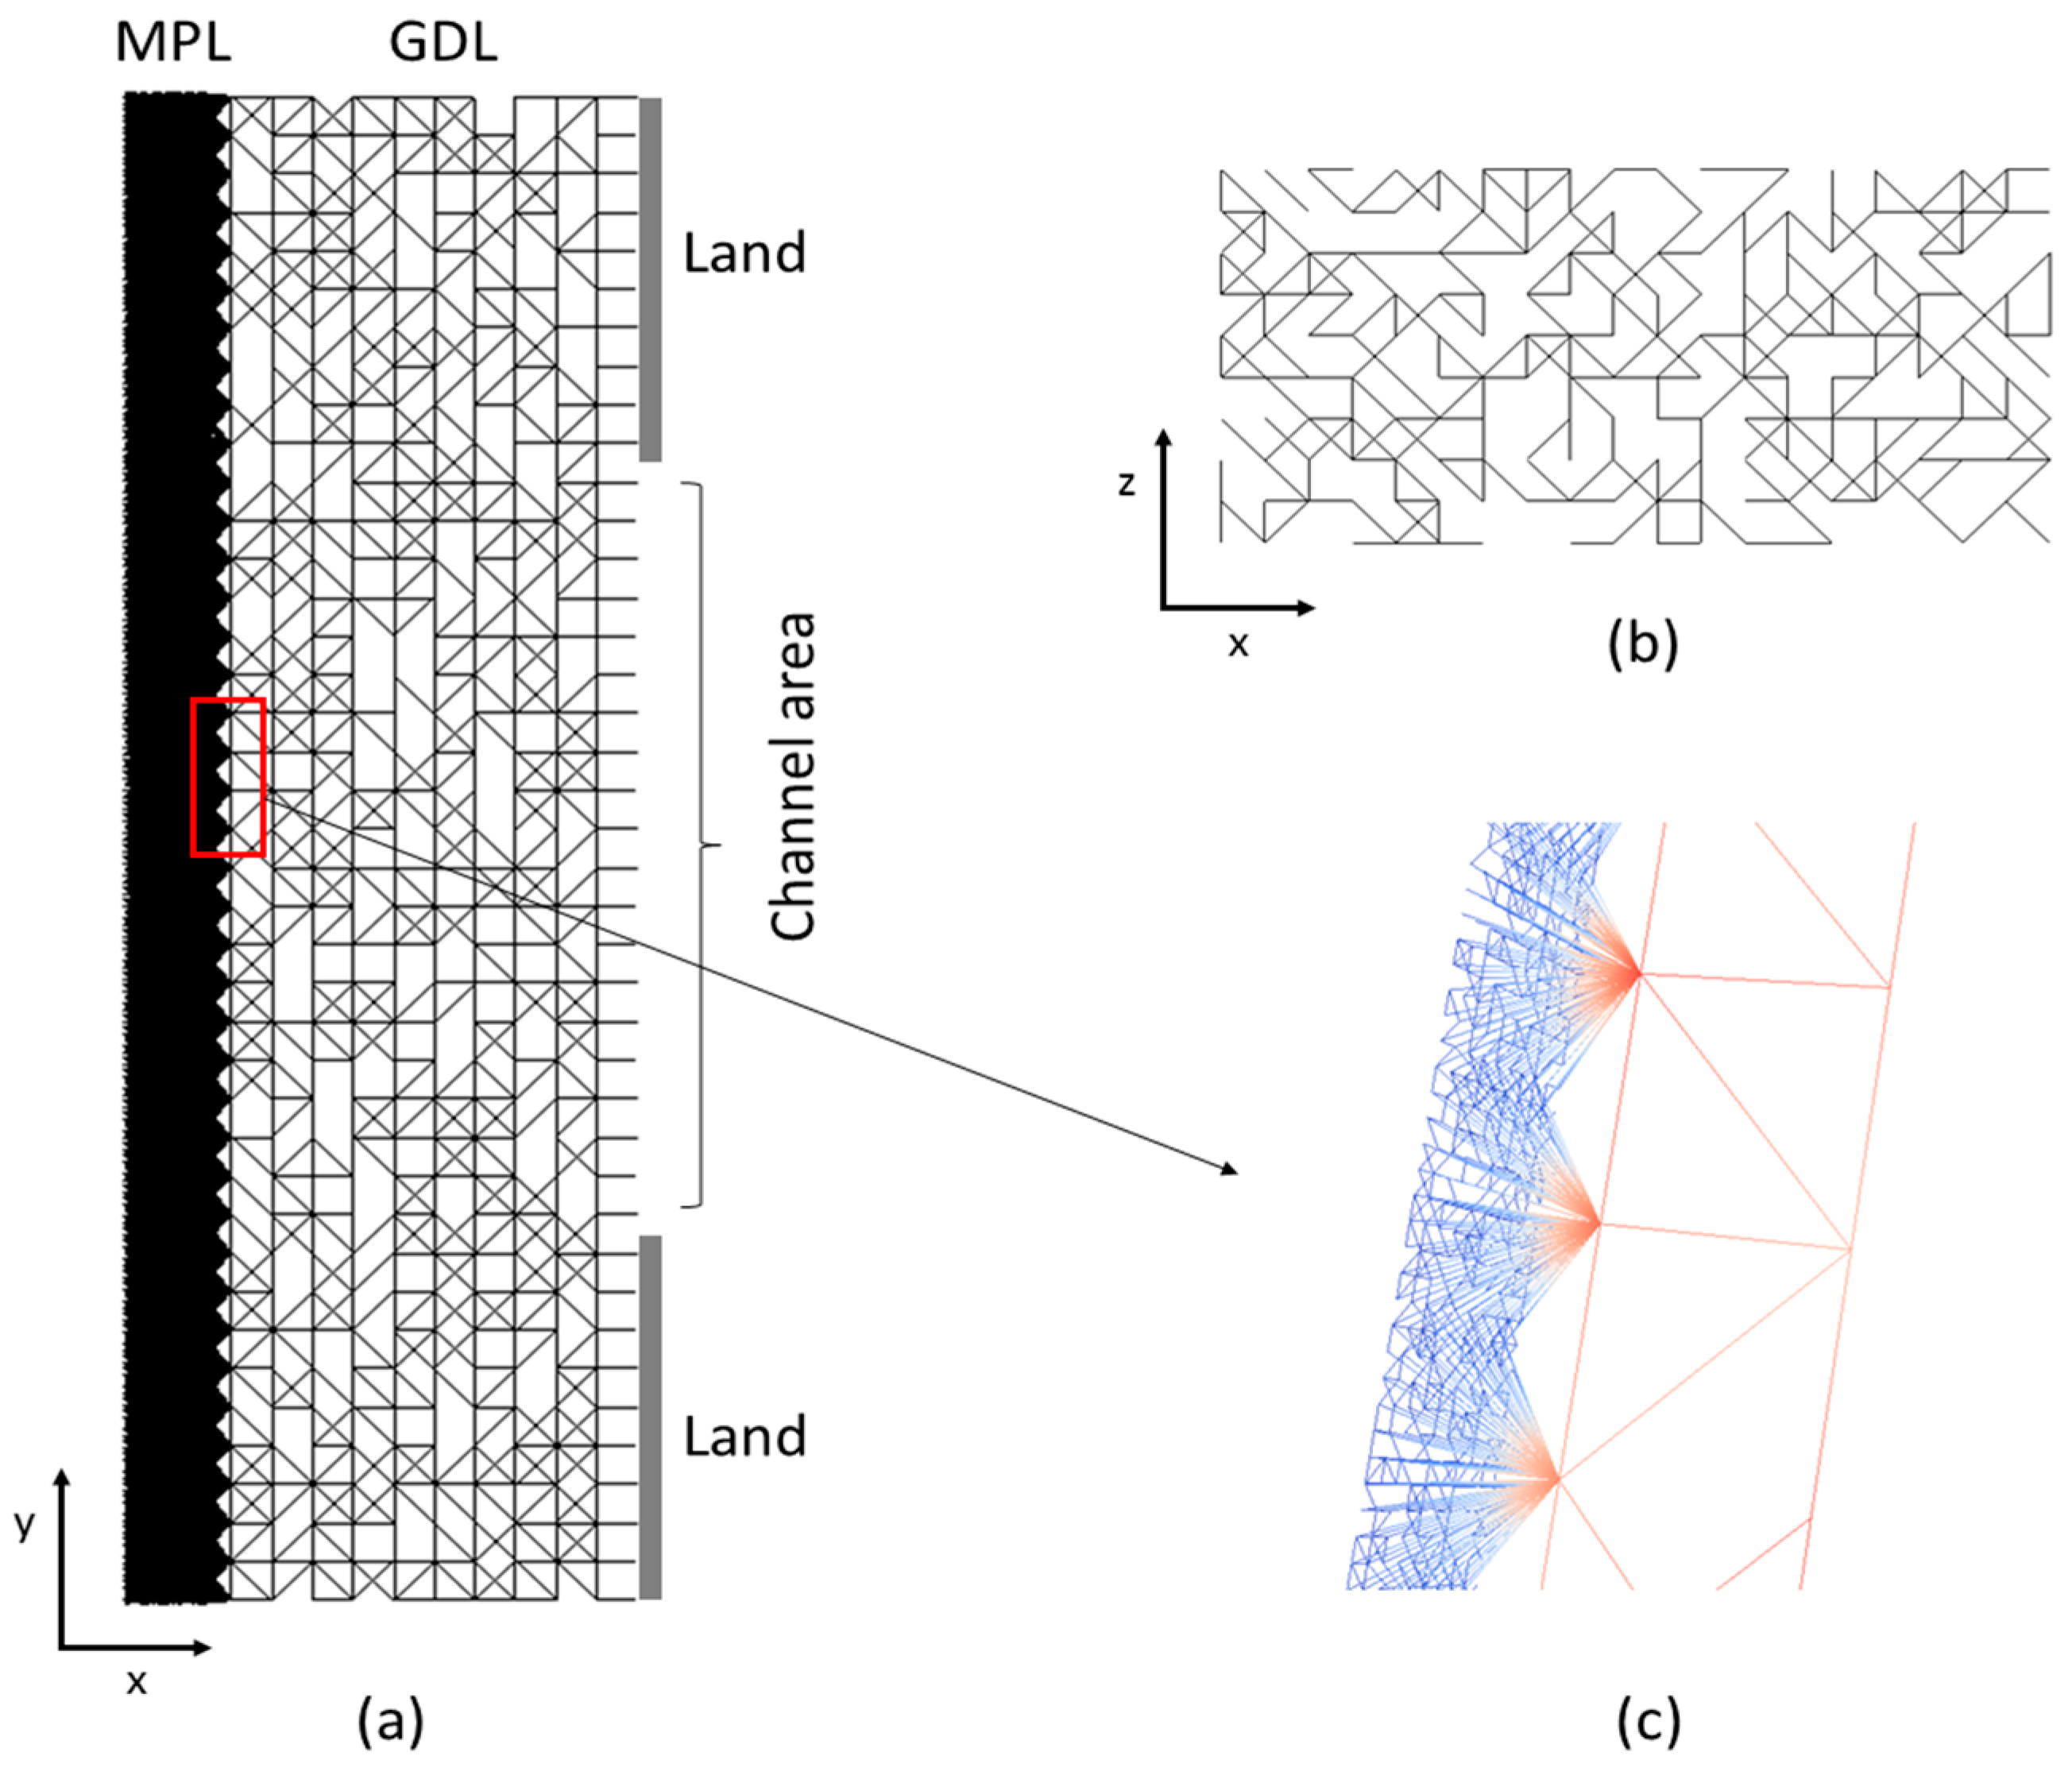
2. Pore-Network Representations of the GDL and MPL

A novel pore-network generator was developed. By employing a probability-controlled elimination process for pore throats, we can calibrate the network generation by the coordination-number distribution, which is one important material property of porous media. In addition, an anisotropic porous medium can be constructed. This has been done to the carbon-paper GDL network structure in this work.
Figure 1 shows the GDL and MPL pore-network structures. According to available literature data [2,21,22], we generated the GDL and MPL networks with their inscribed pore-body radius distributions shown in Figure 2. The pore bodies are cubic and the pore throats have square cross sections. The pore-throat size was determined by the method given in [2]. We further calibrated the networks in terms of porosity, permeability, and average coordination number. Table 1 lists the information of the generated pore networks for the GDL and MPL. The constructed GDL has an anisotropy factor of 1.4 for the intrinsic permeability. For making the present pore-scale modeling feasible, the mean pore size of the constructed MPL is a few times larger than several available MPL materials [7,10]. Finally, the GDL and MPL were combined to form the bi-layer medium by constructing layer-layer interface pore throats.

3. Dynamic Pore-Network Model

The basic idea of a pore-network model is to first construct a network of idealized pore elements, which can adequately represent the porous medium of interest; then, flow and transport are solved in the constructed network, usually with the help of some local rules. In such a way, the computational effort will be reduced considerably.
The detail of the developed model was presented in [2]. Here, we only introduce the governing equations of air-water two phase flow and water vapor transport in the network.
First, the mixture pressure equation is given as:
j = 1 N i ( K i j g + K i j l ) ( p ¯ i p ¯ j ) = j = 1 N i { [ K i j l ( 1 s i l ) K i j g s i l ] p i c + [ K i j g s j l K i j l ( 1 s j l ) ] p j c } + ( 1 / ρ l 1 / ρ g ) r i l
where the superscripts g and l denote the gas and liquid phases, respectively, the subscripts i and i j denote the pore body and pore throat, respectively, p c is the capillary pressure, p ¯ is the mixture pressure, K is the flow conductance, s is the saturation, ρ is the mass density, r i l is the phase change rate between liquid water and water vapor, N i is the number of pore throats connected to the pore body i . Once the mixture pressure in a pore body is known, the individual gas and liquid pressures are calculated by:
p i g = p ¯ i s i l p i c
p i l = p ¯ i + ( 1 s i l ) p i c
Second, the volumetric conservation of liquid water is written as:
V i d s i l d t = j = 1 N i [ K i j l K i j t o t Q i j t o t + K i j g K i j l K i j t o t ( p i c p j c ) ] + r i l ρ l
where the total flux through the pore throat is defined by Q i j t o t = Q i j g + Q i j l , the total conductance of the pore throat is defined by K i j t o t = K i j g + K i j l , and V i is the pore-body volume.
Finally, the water vapor mass conservation is given as:
d ( V i g C i w v ) d t = C i w v j = 1 N i max ( Q i j g , 0 ) j = 1 N i C j w v min ( Q i j g , 0 ) j = 1 N i D i j w v A i j g C i w v C j w v L i j r i l
where C i w v is the water vapor concentration in the pore body, Q i j g is the gas flux through the pore throat, D i j w v is the water vapor diffusivity, and A i j g is the flow area for gas phase. The phase change rate between water and vapor is modeled by:
r i l = k a g l ( C i s a t C i w v )
where k is the phase change rate coefficient, C i s a t is the saturated water vapor concentration calculated as a function of local temperature (see Equation (22) in [3]), and a g l is the interfacial area between gas and liquid phases. All supplementary constitutive relationships, such as phase conductance, air-water interfacial area, and pore-scale capillary pressure saturation relationship, can be found in [2]. They are not repeated here for simplicity.

4. Numerical Implementation and Description of Case Studies

The numerical discretization of Equations (1), (3), and (4) was given in detail in [2]. A semi-implicit scheme was used in liquid water transport Equation (3); and a fully implicit scheme was used in water vapor transport Equation (4). Given the fact that the time for filling a pore body is much larger than the time for water vapor transport, in this work, we decoupled water vapor transport from liquid water dynamics. We used a relatively large time step t w v for water vapor transport (Equation (4)). Liquid water transport (Equation (3)) was updated every a few time steps of water vapor calculation. This reduced the computational effort considerably. Note that when liquid water transport was updated, the time step was determined by Equation (A16) in [2].
It was assumed that water went into the MPL in the vapor form. A uniform water vapor flux was specified corresponding to a given current density. No-flux boundary condition was specified for water vapor and liquid water under the land areas. Under the channel area, a constant vapor concentration was specified, which was equal to the saturated water vapor concentration for a given cell operating temperature. In addition, under the channel area, zero capillary pressure was assumed [2].
Besides the dynamic pore-network modeling of the GDL and MPL, we also conducted the quasi-static pore-network modeling to illustrate the mechanism of the MPL in reducing the coverage of liquid water on the CL surface under the assumption of pure liquid water capillary movement [9]. When water vapor transport under non-isothermal condition was involved, we used the dynamic pore-network model. The aim is to illustrate the role of the MPL in preventing condensed liquid water blocking the CL interface. In this work, we did not model liquid water condensation in the MPL for simplicity.
With the dynamic pore-network model, we conducted four case studies. We considered fully-saturated water vapor condition in the GC. Case 1 was set to the base case, in which the operating temperature (i.e., the GDL-GC interface temperature) was set to 80 °C. For simplicity, we did not explicitly solve heat transfer, but assumed a linear distribution of temperature along the through-plane direction. The distribution was calculated by the GDL and MPL thermal conductivities and heat flux from the MEA (membrane electrode assemble). It was assumed that half of the generated heat was removed from the cathode side; and the generated heat was assumed to be ( 1.48 U ) I [10]. In addition, the thermal gradient of the GDL along the in-plane direction was neglected, given the fact that its in-plane thermal conductivity is much larger than the through-plane one [23]. Table 2 lists all physical and operating parameters used in the base case study. In case 2, the thermal conductivity of the GDL was reduced by half, while the remaining parameters were kept the same as in case 1. In case 3, the operating temperature was set to 60 °C, which was used in many in situ observations. In case 4, a low current density of 0.6 A/cm2 was considered.

5. Results

5.1. Quasi-Static Modeling of Liquid Water Pathways

We used the quasi-static pore-network modeling to illustrate the mechanism of the MPL in reducing liquid water coverage on the CL surface. Pure liquid water movement under the capillary action and crack-free MPL were assumed. The algorithm for the quasi-static model is the same as in [17]. We considered the condition of severe liquid water flooding in the cathode. Figure 3 shows the liquid water pathways (red lines) in the MPL, the GDL, and the bi-layer. The boundary condition of uniform liquid water flux was assumed at the MPL-CL interface. Due to the capillary fingering of liquid water, only a few breakthrough points were observed at the outlet. Without the MPL (Figure 3b), there was a full coverage of liquid water on the CL surface. This situation would shut down the cell operation [10]. When the MPL was placed between the CL and the GDL, it is clearly seen that around half of the MPL-GDL interface was free of liquid water as shown in Figure 3c. However, the water pathways inside the GDL were not affected at all. This may be in part due to the two-dimensional simplification of the GDL, which needs to be confirmed in further studies.
Second, the effect of cracks in the MPL on liquid water pathways in the GDL was explored. Based on the distribution density of cracks in the MPL [25], two crack locations were assumed along the MPL-GDL interface. Liquid water from the CL mainly moves through the cracks into the GDL. Three realizations of the crack locations were generated. Figure 4 shows their water pathways in the GDL. It was found that liquid water flooding in the GDL was dramatically mitigated, because the cracks in the MPL restricted water invading sources at the MPL-GDL interface. Similar results were seen in Medici and Allen’s pore-network modeling [26]. In addition, in Figure 4 it is seen that the isolated water clusters did not expand too much in the in-plane directions.

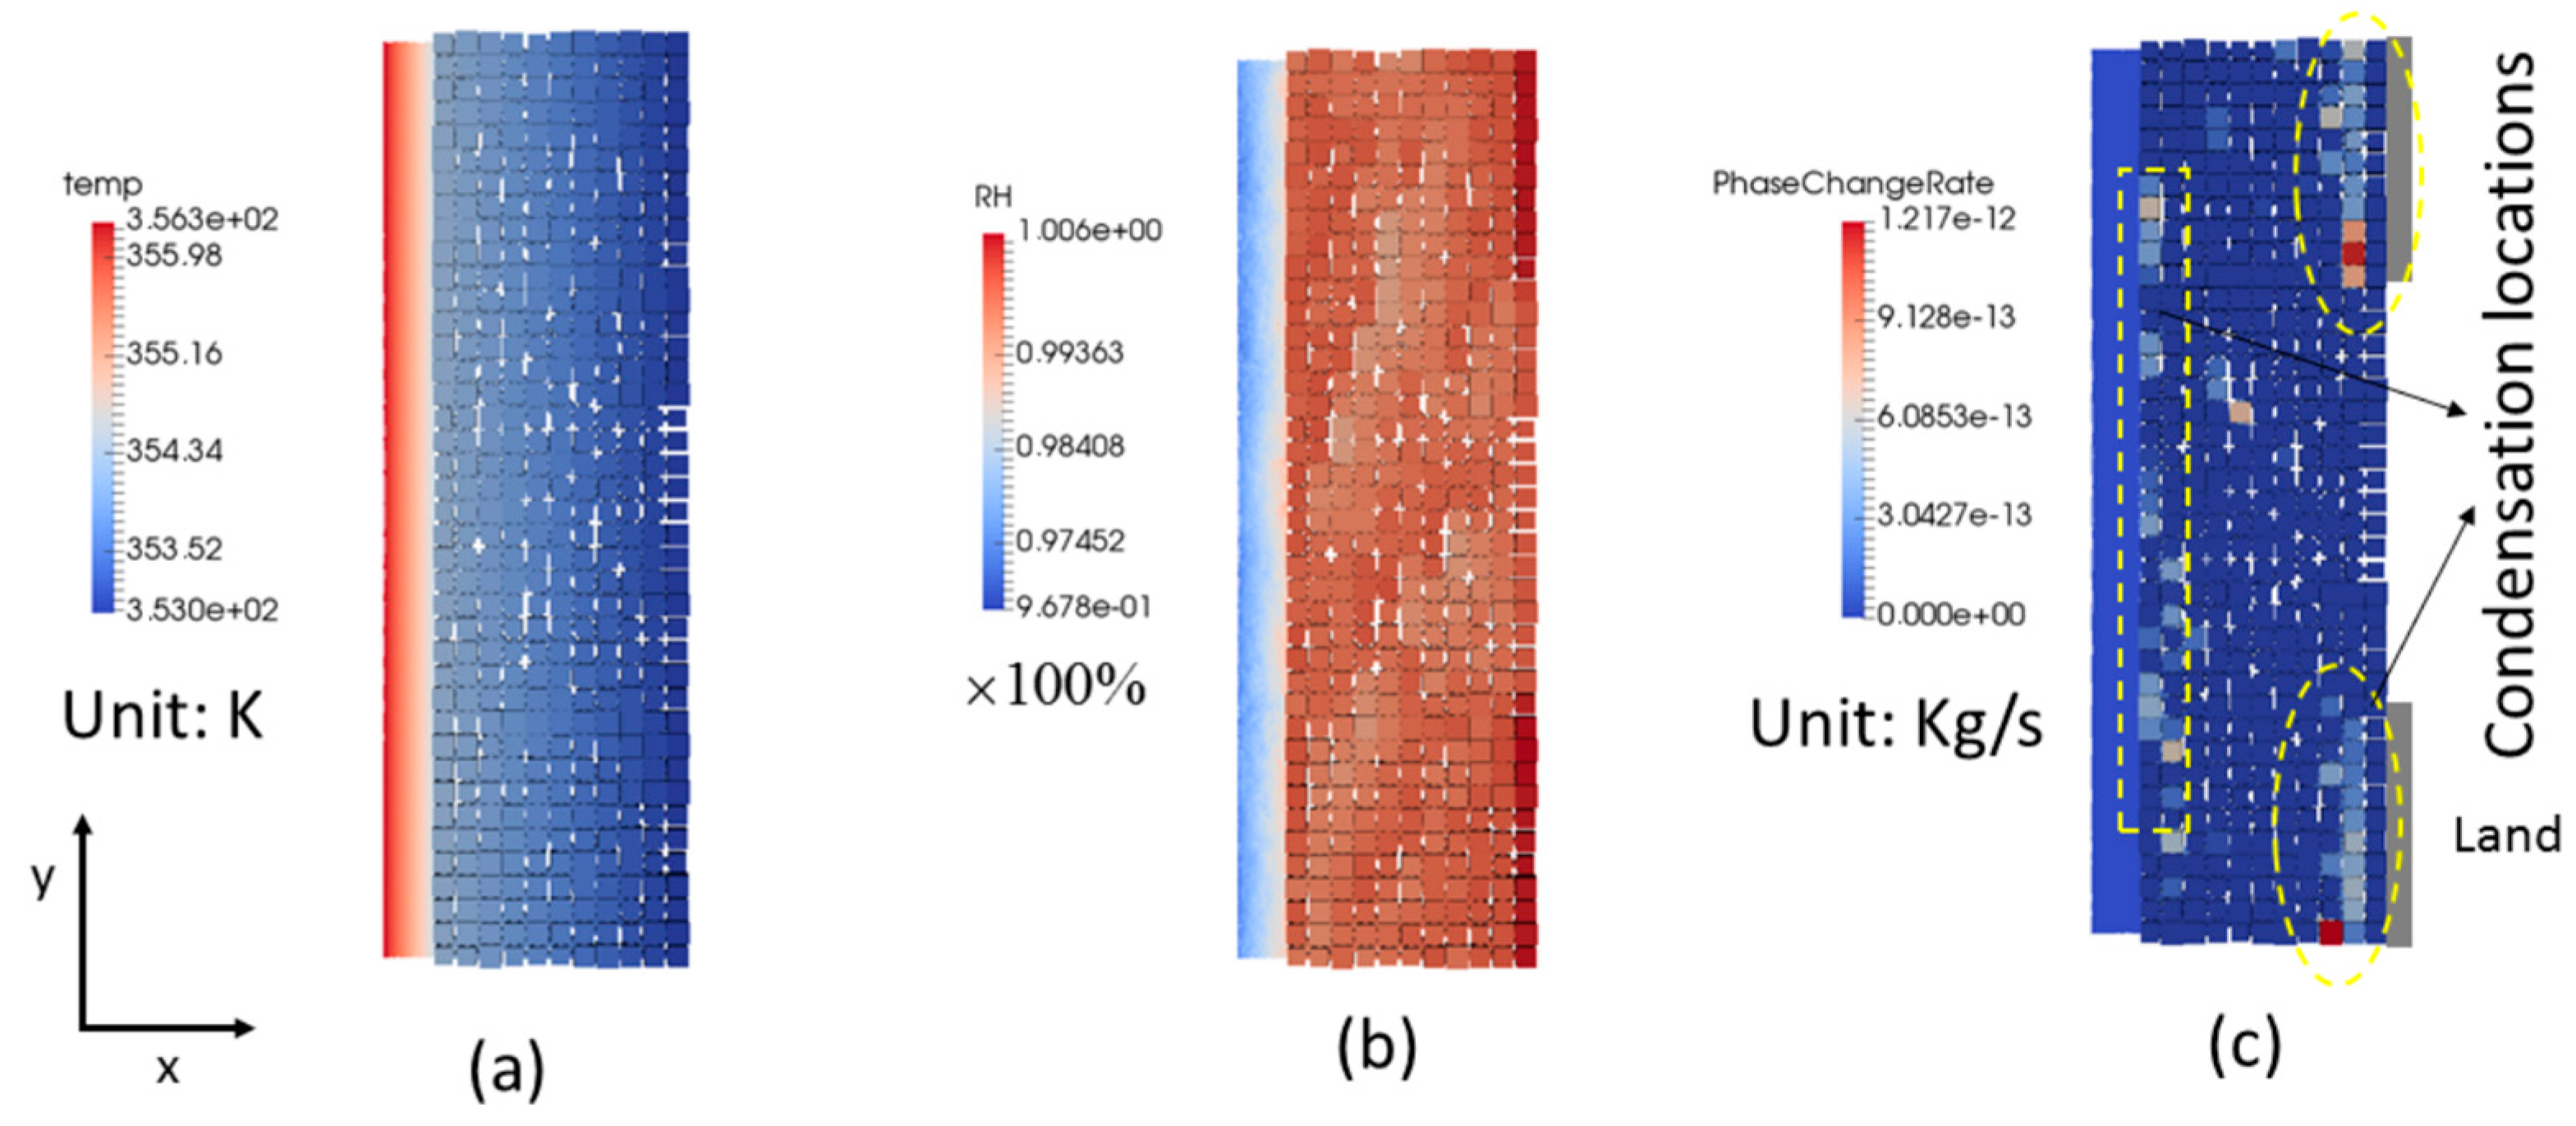
5.2. Dynamic Pore-Network Modeling of Water and Vapor Transport

With the physical and operating parameters given in Table 2, the temperature distribution in the MPL and GDL for case 1 is shown in Figure 5a. The temperature difference was around 3.3 K along the through-plane direction. The temperature gradient in the MPL was seven times as large as in the GDL calculated by their thermal conductivity ratio. As a result, the MPL transported all generated water in pure water vapor form. No condensation occurred in the MPL as shown in Figure 5b. Because we used the nonequilibrium phase change model (Equation (5)), in the GDL pore elements with RH values greater than 100% indicated that water vapor condensation occurred there. Figure 5c shows water condensation rates in the GDL. It is seen that liquid water preferred to accumulate under the land areas due to the mass transfer limitation and relatively low temperature there. Note that condensation can be even enhanced when the land length is larger, for instance, 1 mm as used in many previous studies [8,9].
Figure 6 shows the temporal evolution of liquid water in the GDL. Initially, high water saturation was observed at the GDL-land interface and the MPL-GDL interface [27]. Note that the phase change rate coefficient, k , is set to 1 m/s for all case studies, in order to approach the mass equilibrium condition between water vapor and liquid water. As liquid water accumulation in the GDL, it extensively moved to dry areas under the capillary action (see Figure 6b,c). Figure 6d shows the water distribution and pathways at 150 s. It is seen that the liquid water clusters were in the capillary-fingering pattern. Liquid water did not go further into the MPL because of its much fine pore structures.
Figure 7 shows the distributions of cross-sectional (y-z) averaged water saturation along the through-plane direction at four time instants. Similar to the information obtained from Figure 6, it is seen that at the beginning liquid water accumulated at the bottom and top of the GDL. Then, under the capillary action, liquid water moved to the middle part of the GDL. Finally, cross-sectional averaged water saturation was more or less uniform along the through-plane direction, except for the high water saturation at the MPL-GDL interface. Relatively high water saturation values of the whole GDL (around 0.6 at 150 s) were due to the two-dimensional simplification of the GDL [2].
In case 2, the thermal conductivity of the GDL was reduced by half, in order to enhance its water vapor transport. Figure 8 shows the temporal evolution of water saturation and liquid water clusters in the GDL. Note that the MPL was not modeled here, because it was free of liquid water in case 2. It was found that initially liquid water appeared only at the GDL-land interface (see Figure 8a). As its accumulation, liquid water moved backward to the MPL-GDL interface, primarily underneath the land areas (Figure 8b,c). Figure 8d shows the steady-state distribution of liquid water in the GDL. It is seen that the pore spaces under the channel area were free of liquid water.
To estimate whether the MPL can remove all cathode water by water vapor diffusion, the following empirical equation is used [10]:
f w v = 2 F ( 1 + 2 a ) D e f f R T ( d p s a t d T ) f q ( 1.23 U ) λ
where f w v is the fraction of cathode water ( ( 1 + 2 a ) I / 2 F ) transferred by water vapor diffusion, F is the Faraday constant, a is the net water transfer coefficient from the anode to the cathode, D e f f is the layer-scale effective diffusivity of water vapor for the MPL, R is the universal gas constant, T is the cell operating temperature in Kelvin, p s a t is the saturated water vapor pressure, f q is the fraction of released heat transported by the cathode, and U is the cell voltage. Assuming the net water transfer coefficient is zero, and the MPL effective diffusivity can be calculated by 0.5 × ε 1.5 D w v ( T / 333 ) 1.75 [3], in case 1 and 2, the value of f w v is 1.54. This means that the MPL has the ability of removing all cathode water in water vapor form, which was also confirmed in our pore-network modeling (see Figure 5). When the operating temperature is set to 60 °C, the value of f w v reduces to be 0.71. This indicates that liquid water flooding occurs in the MPL. However, in case 3, we did not model liquid water condensation in the MPL for two reasons. First, cracks (>5 µm) of the MPL may be the main pathways for liquid water migration which were not included in our MPL generation. Second, the computational effort is heavy for a crack-free MPL. Therefore, we assumed that all water went into the GDL in the vapor form. Figure 9 shows the temporal evolution of water saturation and liquid water clusters in the GDL in case 3. In contrast to the results in case 1, water vapor condensed primarily in the pore spaces along the MPL-GDL interface (Figure 9a). Afterwards, liquid water moved towards the top of GDL under the capillary action. Figure 9d shows the finally formed water pathways at 150 s. Slightly more pore spaces were flooded by liquid water than in case 1.
In case 4, the current density is 0.6 A/cm2, with the cell voltage of 0.73 V [10]. According to Equation (6), the value of f w v is 1.22, indicating that the MPL was free of liquid water. If we use Equation (6) for the GDL by assuming that it is a one-dimensional problem, it can be seen that reducing current density would decrease the fraction of cathode water transferred by water vapor diffusion in the GDL. Figure 10 shows the temporal water distributions in the GDL. It was found that there was no significant difference in the formation of liquid water pathways, expect that in case 4 it took much longer time to accumulate a certain amount of water content in the GDL.

6. Discussion and Conclusions

With the quasi-static pore-network modeling of liquid water pathways in the MPL and GDL, we show that a crack-free MPL considerably reduced liquid water coverage on the CL surface. However, water pathways in the GDL were not affected significantly. Gostick et al. [28] reported that breakthrough saturation in the GDL was dramatically reduced with a MPL. This is probably because the boundary condition of pressure head was used in their experiment. In our work, the water flux boundary condition was used [2,29]. Furthermore, it was found that cracks in the MPL could reduce water flooding in the GDL significantly. This is attributed to the fact that cracks in the MPL restricted water invading sources at the MPL-GDL interface, which was much stronger than the restriction from the MPL percolation process.
Phase change between water vapor and liquid water plays an important role in water removal process at a relatively high operating temperature. At a high operating temperature of 80 °C, water transport in the MPL is in the form of vapor diffusion (refer to case 1, case 2, and case 4). This considerably reduces liquid water coverage on the CL surface. As a result, the cell performance can be improved dramatically at high current densities. When the operating temperature is reduced to 60 °C (refer to case 3), liquid water flooding occurs in the MPL. Condensed liquid water enters the MPL from the CL-MPL interface. In such conditions, cracks in the MPL may be beneficial to liquid water removal in the MPL and GDL for two reasons. First, cracks are the main pathways for liquid water, while leaving fine pore spaces for reactants transport. Second, as mentioned above, cracks in the MPL restricted water invading sources into the GDL. Thus, this reduces water flooding in the GDL.
Due to the land (i.e., rib) effect and a relatively high thermal conductivity, liquid water flooding in the GDL cannot be avoided in the condition of wet GC. Water vapor prefers to condense along the GDL-land and MPL-GDL interfaces (refer to case 1). By decreasing the GDL thermal conductivity, we can constrain the condensation only along the GDL-land interface (refer to case 2). Meanwhile, to prevent liquid water moving back the MPL-GDL interface, we may design multi-layered GDL with decreased pore sizes towards the MPL. In addition, under the wet GC condition, steady-state water distribution in the GDL is not sensitive to the operating current density (refer to case 4). However, it is expected that increasing current density would increase water flooding in the GC [8], which was not modeled in this work.
For simplicity, in this work, we assumed a linear temperature distribution along the through-plane direction. Although the effect of temperature gradient on water transport was considered (i.e., water evaporates in a high-temperature region, and then condenses in a low-temperature region), latent heat by phase change was not allowed to feed back the temperature distribution. In other words, we did not considered the heat pipe effect [30], because heat transfer was not explicitly solved in the current pore-network model. We notice that neglecting the heat pipe effect would exaggerate water vapor transport and leads to an overestimated temperature gradient in the GDL. In near future, energy balance equation will be included in our pore-network model for studying non-isothermal water and vapor transport in the MPL and GDL.

Acknowledgments

This research was supported by the Dutch Technology Foundation STW, which is part of the Netherlands Organization for Scientific Research (NOW), and which is partly funded by the Ministry of Economic Affairs. In addition, this research has received funding from the European Research Council under the European Union’s Seventh Framework Programme (FP/2007-2013)/ERC Grant Agreement No. 341225.

Author Contributions

C.-Z. Qin initialized and coordinated the work. C.-Z. Qin, S.M. Hassanizadeh, and L.M. van Oosterhout contributed to the development of pore-network model. L.M. van Oosterhout contributed to the development of pore-network generator.

Conflicts of Interest

The authors declare no conflict of interest.

References

  1. Hoogers, G. Fuel Cell Technology Handbook; CRC Press: Boca Raton, FL, USA, 2002. [Google Scholar]
  2. Qin, C.Z. Water transport in the gas diffusion layer of a polymer electrolyte fuel cell: Dynamic pore-network modeling. J. Electrochem. Soc. 2015, 162, F1036–F1046. [Google Scholar] [CrossRef]
  3. Qin, C.Z.; Rensink, D.; Fell, S.; Hassanizadeh, S.M. Two-phase flow modeling for the cathode side of a polymer electrolyte fuel cell. J. Power Sources 2012, 197, 136–144. [Google Scholar] [CrossRef]
  4. Qin, C.Z.; Hassanizadeh, S.M. A new approach to modelling water flooding in a polymer eletrolyte fuel cell. Int. J. Hydrog. Energy 2015, 40, 3348–3358. [Google Scholar] [CrossRef]
  5. Qin, C.Z.; Hassanizadeh, S.M. Multiphase flow through multilayers of thin porous media: General balance equations and constititive relationships for a solid-gas-liquid three-phase system. Int. J. Heat Mass Transf. 2014, 70, 693–708. [Google Scholar] [CrossRef]
  6. Nam, J.H.; Lee, K.J.; Hwang, G.S.; Kim, C.J.; Kaviany, M. Microporous layer for water morphology control in PEMFC. Int. J. Heat Mass Transf. 2009, 52, 2779–2791. [Google Scholar] [CrossRef]
  7. Morgan, J.M.; Datta, R. Understanding the gas diffusion layer in proton exchange membrane fuel cells. I. How its structural characteristics affect diffusion and performance. J. Power Sources 2014, 251, 269–278. [Google Scholar] [CrossRef]
  8. Deevanhxay, P.; Sasabe, T.; Tsushima, S.; Hirai, S. Observation of dynamic liquid water transport in the microporous layer and gas diffusion layer of an operating PEM fuel cell by high-resolution soft X-ray radiography. J. Power Sources 2013, 230, 38–43. [Google Scholar] [CrossRef]
  9. Lee, J.; Yip, R.; Antonacci, P.; Ge, N.; Kotaka, T.; Tabuchi, Y.; Bazylak, A. Synchrotron investigation of microporous layer thickness on liquid water distribution in a PEM fuel cell. J. Electrochem. Soc. 2015, 162, F669–F676. [Google Scholar] [CrossRef]
  10. Owejan, J.P.; Owejan, J.E.; Gu, W.; Trabold, T.A.; Tighe, T.W.; Mathias, M.F. Water transport mechanisms in PEMFC gas diffusion layers. J. Electrochem. Soc. 2010, 157, B1456–B1464. [Google Scholar] [CrossRef]
  11. Atiyeh, H.K.; Karan, K.; Peppley, B.; Phoenix, A.; Halliop, E.; Pharoah, J. Experimental investigation of the role of a microporous layer on the water transport and performance of a PEM fuel cell. J. Power Sources 2007, 170, 111–121. [Google Scholar] [CrossRef]
  12. Pasaogullari, U.; Wang, C.Y. Two-phase transport and the role of micro-porous layer in polymer electrolyte fuel cells. Electrochim. Acta 2004, 49, 4359–4369. [Google Scholar] [CrossRef]
  13. Kim, K.N.; Kang, J.H.; Lee, S.G.; Nam, J.H.; Kim, C.J. Lattice Boltzmann simulation of liquid water transport in microporous and gas diffusion layers of polymer electrolyte membrane fuel cells. J. Power Sources 2015, 278, 703–717. [Google Scholar] [CrossRef]
  14. Wu, R.; Zhu, X.; Liao, Q.; Wang, H.; Ding, Y.D.; Li, J.; Ye, D.D. A pore network study on the role of micro-porous layer in control of liquid water distribution in gas diffusion layer. Int. J. Hydrog. Energy 2010, 35, 7588–7593. [Google Scholar] [CrossRef]
  15. Spernjak, D.; Prasad, A.K.; Advani, S.G. Experimental investigation of liquid water formation and transport in a transparent single-serpentine PEM fuel cell. J. Power Sources 2007, 170, 334–344. [Google Scholar] [CrossRef]
  16. Mukherjee, P.P.; Wang, C.Y.; Kang, Q.J. Mesoscopic modeling of two-phase behaviour and flooding phenomena in polymer electrolyte fuel cells. Electrochim. Acta 2009, 54, 6861–6875. [Google Scholar] [CrossRef]
  17. Lee, K.J.; Kang, J.H.; Nam, J.H. Liquid water distribution in hydrophobic gas-diffusion layers with interconnect rib geometry: An invasion-percolation pore network analysis. Int. J. Hydrog. Energy 2014, 39, 6646–6656. [Google Scholar] [CrossRef]
  18. Lee, K.J.; Nam, J.H.; Kim, C.J. Steady saturation distribution in hydrophobic gas-diffusion layers of polymer electrolyte membrane fuel cells: A pore-network study. J. Power Sources 2010, 195, 130–141. [Google Scholar] [CrossRef]
  19. Qin, C.Z.; Rensink, D.; Hassanizadeh, S.M.; Fell, S. Direct Simulation of Liquid Water Dynamics in the Gas Channel of a Polymer Electrolyte Fuel Cell. J. Electrochem. Soc. 2012, 159, B434–B443. [Google Scholar] [CrossRef]
  20. Médici, E.F.; Allen, J.S. Evaporation, two phase flow, and thermal transport in porous media with application to low-temperature fuel cells. Int. J. Heat Mass Transf. 2013, 65, 779–788. [Google Scholar] [CrossRef]
  21. Sinha, P.K.; Wang, C.Y. Pore-network modeling of liquid water transport in gas diffusion layer of a polymer electrolyte fuel cell. Electrochim. Acta 2007, 52, 7936–7945. [Google Scholar] [CrossRef]
  22. Ji, Y.; Luo, G.; Wang, C.Y. Pore-level liquid water transport through composite diffusion media of PEMFC. J. Electrochem. Soc. 2012, 157, B1753–B1761. [Google Scholar] [CrossRef]
  23. Sadeghi, E.; Djilali, N.; Bahrami, M. A novel approach to determine the in-plane thermal conductivity of gas diffusion layers in proton exchange membrane fuel cells. J. Power Sources 2011, 196, 3565–3571. [Google Scholar] [CrossRef]
  24. Radhakrishnan, A. Thermal Conductivity Measurement of Gas Diffusion Layer Used in PEMFC. Master’s Thesis, Rochester Institute of Technology, Rochester, NY, USA, 2009. [Google Scholar]
  25. Hizir, F.E.; Ural, S.O.; Kumbur, E.C.; Mench, M.M. Characterization of interfacial morphology in polymer electrolyte fuel cells: Micro-porous layer and catalyst layer surfaces. J. Power Sources 2010, 195, 3463–3471. [Google Scholar] [CrossRef]
  26. Médici, E.F.; Allen, J.S. The effect of morphological and wetting properties of porous transport layers on water movement in PEM fuel cells. J. Electrochem. Soc. 2010, 157, B1505–B1514. [Google Scholar] [CrossRef]
  27. Straubhaar, B.; Pauchet, J.; Prat, M. Water transport in gas diffusion layer of a polymer electrolyte fuel cell in the presence of a temperature gradient. Phase change effect. Int. J. Hydrog. Energy 2015, 40, 11668–11675. [Google Scholar] [CrossRef] [Green Version]
  28. Gostick, J.T.; Ioannidis, M.A.; Fowler, M.W.; Pritzker, M.D. On the role of the microporous layer in PEMFC operation. Electrochem. Commun. 2009, 11, 576–579. [Google Scholar] [CrossRef]
  29. Fazeli, M.; Hinebaugh, J.; Bazylak, A. Investigating inlet condition effects on PEMFC GDL liquid water transport through pore network modeling. J. Electrochem. Soc. 2015, 162, F661–F668. [Google Scholar] [CrossRef]
  30. Wang, Y.; Wang, C.Y. A nonisothermal, two-phase model for polymer electrolyte fuel cells. J. Electrochem. Soc. 2006, 153, A1193–A1200. [Google Scholar] [CrossRef]
Figure 1. (a) x-y view of the GDL and MPL pore-network structures; (b) one x-z slice of the MPL; and (c) a snapshot of the interface between the GDL and MPL. The MPL is three-dimensional, while the connected GDL has only one layer along the z direction.
Computation 04 00021 g001
Figure 2. Pore-size distributions of the GDL and MPL networks.
Computation 04 00021 g002
Figure 3. Liquid water pathways (denoted by read lines) in the MPL (a); in the GDL (b); and in the bi-layer (c) using the quasi-static pore-network modeling. The white areas denote the uninvaded pore spaces. The boundary condition of uniform liquid water flux at the inlet was assumed.
Computation 04 00021 g003
Figure 4. Liquid water pathways (denoted by read lines) in the GDL under three realizations of the crack locations at the MPL-GDL interface. There are two assumed crack locations at the ML-GDL interface. The MPL was not modeled. (a) Realization 1; (b) Realization 2; (c) Realization 3.
Computation 04 00021 g004
Figure 5. Contours of temperature (a), relative humidity (b), and liquid water generation rate (c) initially in case 1. The operating parameters are given in Table 1.
Computation 04 00021 g005
Figure 6. Temporal evolution of water saturation and liquid water clusters in the GDL in case 1.
Computation 04 00021 g006
Figure 7. Cross-sectional averaged distributions of liquid water saturation along the through-plane direction in the GDL at different time instants in case 1.
Computation 04 00021 g007
Figure 8. Temporal evolution of water saturation and liquid water clusters in the GDL in case 2. In comparison to the parameters used in case 1, the thermal conductivity of the GDL was set to 0.7 W/m·K.
Computation 04 00021 g008
Figure 9. Temporal evolution of water saturation and liquid water clusters in the GDL in case 3. In comparison to the parameters used in case 1, the operating temperature was set to 60 °C.
Computation 04 00021 g009
Figure 10. Temporal evolution of water saturation and liquid water clusters in the GDL in case 4. In comparison to the parameters used in case 1, the current density was set to 0.6 A/cm2.
Computation 04 00021 g010
Table 1. Information of the generated pore networks for the uncompressed carbon-paper GDL and MPL.
ParameterThe GDLThe MPL (Crack-Free)
Pore-network dimensions, x × y × z250 µm × 1000 µm × 25 µm
Dimension of the channel area500 µm (refer to Figure 1a)
Lattice distance/lattice numbers, x × y × z25 µm/10 × 40 × 12.5 µm/20 × 391 × 10
Number of pore bodies/pore throats (including inlet and outlet)480/107785,712/265,892
Porosity0.680.38
Permeability1.1 × 10−11 m2 (through-plane)/1.5 × 10−11 m2 (in-plane)1.8 × 10⁻¹⁴ m2
Minimum and maximum sizes of pore bodies (inscribed radius)9 µm and 12.5 µm0.25 µm and 1.25 µm
Mean size of pore bodies11 µm0.7 µm
Average coordination number5.46.8
Table 2. Physical and operating parameters used in the base case, i.e., case 1.
ParameterValue + UnitsSource
Operating temperature, T 80 °C-
Current density, I 1.5 A/cm2-
Operating voltage, U 0.6 V[10]
Thermal conductivity of the GDL, λ g d l /the MPL, λ m p l 1.4/0.2 W/m·K[24]
Contact angle of diffusion layers for liquid water180°[2]
Phase change rate coefficent, k 1.0 m/s-
Water vapor diffusivity at reference condition, D w v 3.0 × 10⁻⁵ m2/s[3]
Relative humidity in the GC, R H 100%-

