
Detecting Perturbed Subpathways towards Mouse Lung Regeneration Following H1N1 Influenza Infection

 ,
, 


Abstract
:1. Introduction
2. Materials and Methods
- Gene expression data have N samples, in which the expression of p genes is measured.
- Each sample’s expression profile forms a row of the matrix X (N × p) (each of sample’s expression comes from one of K classes (e.g., disease or normal state) belonging to the set G).
- Bayes rule provides an expression for the class posteriors ,where is the class-conditional density of X, x is a particular instance of the values in a gene expression profile, is the prior probability of class k.
- The class-conditional density can be modeled as a multivariate Gaussian:where and is mean and covariance respectively.
- Then, linear discriminant analysis (LDA) is applied based on the assumption that the covariance matrix is the same for each class (). The log-ratio of class posteriors P (G|X), provides a measure of the relative likelihood of classifying to those classes. Hence, the log ratio of classifying to classes κ and l is formulated as:where, is πk, is the class mean, andit is assumed that both classes have the same covariance matrix, Σ (, , , where is a row from the data matrix X.
- Finally, the orientation of the separating hyper-plane (between classes k and l) is defined by the normal p-vector, in the third term on the right hand side, that we label b,
| Algorithm 1. Pseudocode of PerSubs Algorithm |
| Input: NoI, G, α1, α2 |
| Output: final subpathway S |
| I. S = {NoI} // initialize |
| II. For each v in S // inclusion step |
| a. Find neighbors N(v) |
| b. Keep not included neighbors: N(v) = N(v) − S |
| c. For every u in N(v) |
| i. Calculate NINT, NEXT, NWINT, NWEXT |
| ii. If u∈N(NoI) |
| 1. Evaluate if Criterion1 > α1 |
| iii. Else |
| 1. Evaluate if Criterion1 > α2 |
| iv. Evaluate Criterion2 |
| v. if Criterion1 = true AND Criterion2 = true |
| 1. Include u: S = S∪u |
| III. For each v in S ordered by increasing Criterion1 // pruning step |
| a. if DW(S − v) > DW(S) |
| i. Remove v: S = S − v |
| IV. Repeat steps II and III until no new nodes added |
3. Results
Author Contributions
Conflicts of Interest
References
- Barabási, A.L.; Gulbahce, N.; Loscalzo, J. Network medicine: A network-based approach to human disease. Nat. Rev. Genet. 2011, 12, 56–68. [Google Scholar] [CrossRef] [PubMed]
- Wang, L.; Jia, P.; Wolfinger, R.D.; Chen, X.; Zhao, Z. Gene set analysis of genome-wide association studies: methodological issues and perspectives. Genomics 2011, 98, 1–8. [Google Scholar]
- Khatri, P.; Sirota, M.; Butte, A.J. Ten years of pathway analysis: Current approaches and outstanding challenges. PLoS Comput. Biol. 2012, 8, e1002375. [Google Scholar] [CrossRef] [PubMed]
- Jin, L.; Zuo, X.-Y.; Su, W.-Y.; Zhao, X.-L.; Yuan, M-Q.; Han, L.-Z.; Zhao, X.; Chen, Y.-D.; Rao, S.-Q. Pathway-based analysis tools for complex diseases: A review. Genom. Proteom. Bioinform. 2014, 12, 210–220. [Google Scholar] [CrossRef] [PubMed]
- Wang, K.; Li, M.; Bucan, M. Pathway-based approaches for analysis of genomewide association studies. Am. J. Hum. Genet. 2007, 81, 1278–1283. [Google Scholar] [CrossRef] [PubMed]
- Shi, J.; Walker, M.G. Gene set enrichment analysis (GSEA) for interpreting gene expression profiles. Curr. Bioinform. 2007, 2, 133–137. [Google Scholar] [CrossRef]
- Tarca, A.L.; Draghici, S.; Khatri, P.; Hassan, S.S.; Mittal, P.; Kim, J.S.; Kim, C.J.; Kusanovic, J.P.; Romero, R. A novel signaling pathway impact analysis. Bioinformatics 2009, 25, 75–82. [Google Scholar] [CrossRef] [PubMed]
- Rahnenfuhrer, J.; Domingues, F.S.; Maydt, J.; Lengauer, T. Calculating the statistical significance of changes in pathway activity from gene expression data. Stat. Appl. Genet. Mol. Biol. 2004, 3, 1055. [Google Scholar] [CrossRef] [PubMed]
- Chen, X.; Xu, J.; Huang, B.; Li, J.; Wu, X.; Ma, L.; Jia, X.; Bian, X.; Tan, F.; Liu, L.; et al. A sub-pathway-based approach for identifying drug response principal network. Bioinformatics 2011, 27, 649–654. [Google Scholar] [CrossRef] [PubMed]
- Judeh, T.; Johnson, C.; Kumar, A.; Zhu, D. TEAK: Topology enrichment analysis framework for detecting activated biological subpathways. Nucleic Acids Res. 2013, 41, 1425–1437. [Google Scholar] [CrossRef] [PubMed]
- Vrahatis, A.G.; Dimitrakopoulou, K.; Balomenos, P.; Tsakalidis, A.K.; Bezerianos, A. CHRONOS: A time-varying method for microRNA-mediated sub-pathway enrichment analysis. Bioinformatics 2016, 32, 884–892. [Google Scholar] [CrossRef] [PubMed]
- Vrahatis, A.G.; Balomenos, P.; Tsakalidis, A.K.; Bezerianos, A. DEsubs: An R package for flexible identification of differentially expressed subpathways using RNA-seq experiments. Bioinformatics 2016, 32, 3844–3846. [Google Scholar] [CrossRef] [PubMed]
- Dimitrakopoulos, G.N.; Balomenos, P.; Vrahatis, A.G.; Sgarbas, K.; Bezerianos, A. Identifying disease network perturbations through regression on gene expression and pathway topology analysis. In Proceedings of the 2016 IEEE 38th Annual International Conference of the Engineering in Medicine and Biology Society (EMBC), Lake Buena Vista (Orlando), FL, USA, 17–20 August 2016; pp. 5969–5972. [Google Scholar]
- Vrahatis, A.G.; Dimitrakopoulos, G.N.; Tsakalidis, A.K.; Bezerianos, A. Identifying miRNA-mediated signaling subpathways by integrating paired miRNA/mRNA expression data with pathway topology. In Proceedings of the 2015 37th Annual International Conference of the IEEE Engineering in Medicine and Biology Society (EMBC), Milan, Italy, 25–29 August 2015; pp. 3997–4000. [Google Scholar]
- Nam, S.; Chang, H.R.; Kim, K.T.; Kook, M.C.; Hong, D.; Kwon, C.H.; Jung, H.R.; Park, H.S.; Powis, G.; Liang, H.; et al. PATHOME: An algorithm for accurately detecting differentially expressed subpathways. Oncogene 2014, 33, 4941–4951. [Google Scholar] [CrossRef] [PubMed]
- Li, C.; Li, X.; Miao, Y.; Wang, Q.; Jiang, W.; Xu, C.; Li, J.; Han, J.; Zhang, F.; Gong, B.; Xu, L. SubpathwayMiner: A software package for flexible identification of pathways. Nucleic Acids Res. 2009, 37, e131. [Google Scholar] [CrossRef] [PubMed]
- Vrahatis, A.G.; Rapti, A.; Sioutas, S.; Tsakalidis, A.K. PerSubs: A graph-based algorithm for the identification of perturbed subpathways caused by complex diseases. In Proceedings of the Genetics, Geriatrics and Neurodegenerative Diseases Research, Sparta, Greece, 20–23 October 2016. [Google Scholar]
- Kumar, P.A.; Hu, Y.; Yamamoto, Y.; Hoe, N.B.; Wei, T.S.; Mu, D.; Sun, Y.; Joo, L.S.; Dagher, R.; Zielonka, E.M.; et al. Distal airway stem cells yield alveoli in vitro and during lung regeneration following H1N1 influenza infection. Cell 2011, 147, 525–538. [Google Scholar] [CrossRef] [PubMed]
- Maraziotis, I.A.; Dimitrakopoulou, K.; Bezerianos, A. Growing functional modules from a seed protein via integration of protein interaction and gene expression data. BMC Bioinform. 2007, 8, 408. [Google Scholar] [CrossRef] [PubMed]
- Clark, N.R.; Hu, K.S.; Feldmann, A.S.; Kou, Y.; Chen, E.Y.; Duan, Q.; Ma’ayan, A. The characteristic direction: A geometrical approach to identify differentially expressed genes. BMC Bioinform. 2014, 15, 79. [Google Scholar] [CrossRef] [PubMed]
- Kanehisa, M.; Goto, S. KEGG: Kyoto encyclopedia of genes and genomes. Nucleic Acids Res. 2000, 28, 27–30. [Google Scholar] [CrossRef] [PubMed]
- Tan, K.S.; Choi, H.; Jiang, X.; Yin, L.; Seet, J.E.; Patzel, V.; Engelward, B.P.; Chow, V.T. Micro-RNAs in regenerating lungs: An integrative systems biology analysis of murine influenza pneumonia. BMC Genom. 2014, 15, 587. [Google Scholar] [CrossRef] [PubMed]
- Chen, Y.; Zhou, J.; Cheng, Z.; Yang, S.; Chu, H.; Fan, Y.; Li, C.; Wong, B.H.; Zheng, S.; Zhu, Y.; et al. Functional variants regulating LGALS1 (Galectin 1) expression affect human susceptibility to influenza A (H7N9). Sci. Rep. 2015, 5, 8517. [Google Scholar] [CrossRef] [PubMed]
- Li, Y.; Zhou, H.; Wen, Z.; Wu, S.; Huang, C.; Jia, G.; Chen, H.; Jin, M. Transcription analysis on response of swine lung to H1N1 swine influenza virus. BMC Genom. 2011, 12, 398. [Google Scholar] [CrossRef] [PubMed]
- Furuya, Y.; Furuya, A.K.; Roberts, S.; Sanfilippo, A.M.; Salmon, S.L.; Metzger, D.W. Prevention of Influenza Virus-Induced Immunopathology by TGF-β Produced during Allergic Asthma. PLoS Pathog. 2015, 11, e1005180. [Google Scholar] [CrossRef] [PubMed]
- Carlson, C.M.; Turpin, E.A.; Moser, L.A.; O’Brien, K.B.; Cline, T.D.; Jones, J.C.; Tumpey, T.M.; Katz, J.M.; Kelley, L.A.; Gauldie, J.; et al. Transforming growth factor-β: Activation by neuraminidase and role in highly pathogenic H5N1 influenza pathogenesis. PLoS Pathog. 2010, 6, e1001136. [Google Scholar] [CrossRef] [PubMed]
- Croasdell, A.; Duffney, P.F.; Kim, N.; Lacy, S.H.; Sime, P.J.; Phipps, R.P. PPARγ and the Innate Immune System Mediate the Resolution of Inflammation. PPAR Res. 2015, 2015, 549691. [Google Scholar] [CrossRef] [PubMed]
- Pociask, D.A.; Scheller, E.V.; Mandalapu, S.; McHugh, K.J.; Enelow, R.I.; Fattman, C.L.; Kolls, J.K.; Alcorn, J.F. IL-22 is essential for lung epithelial repair following influenza infection. Am. J. Pathol. 2013, 182, 1286–1296. [Google Scholar] [CrossRef] [PubMed]
- Nourshargh, S.; Alon, R. Leukocyte migration into inflamed tissues. Immunity 2014, 41, 694–707. [Google Scholar] [CrossRef] [PubMed]

| Pathway Names | Subpathway Members | References |
|---|---|---|
| ECM-receptor interaction | Gp1ba, Gp5, Itga2b, Itgav, Itgb3, Gp9, Vwf | [23,24] |
| TGF-beta signaling | Acvr2a, Acvr2b, Inhba, Nodal | [25,26] |
| Cytokine-cytokine receptor interaction | Tgfbr1, Tgfbr2, Tgfb2 | [24] |
| PPAR signaling | Cpt-1, Cpt-2, Mcad, Aco, Ucp-1, Pparα | [24,27] |
| Leukocyte transendothelial migration | Itgal, Itgb2, Icam1, Rhoa | [28,29] |
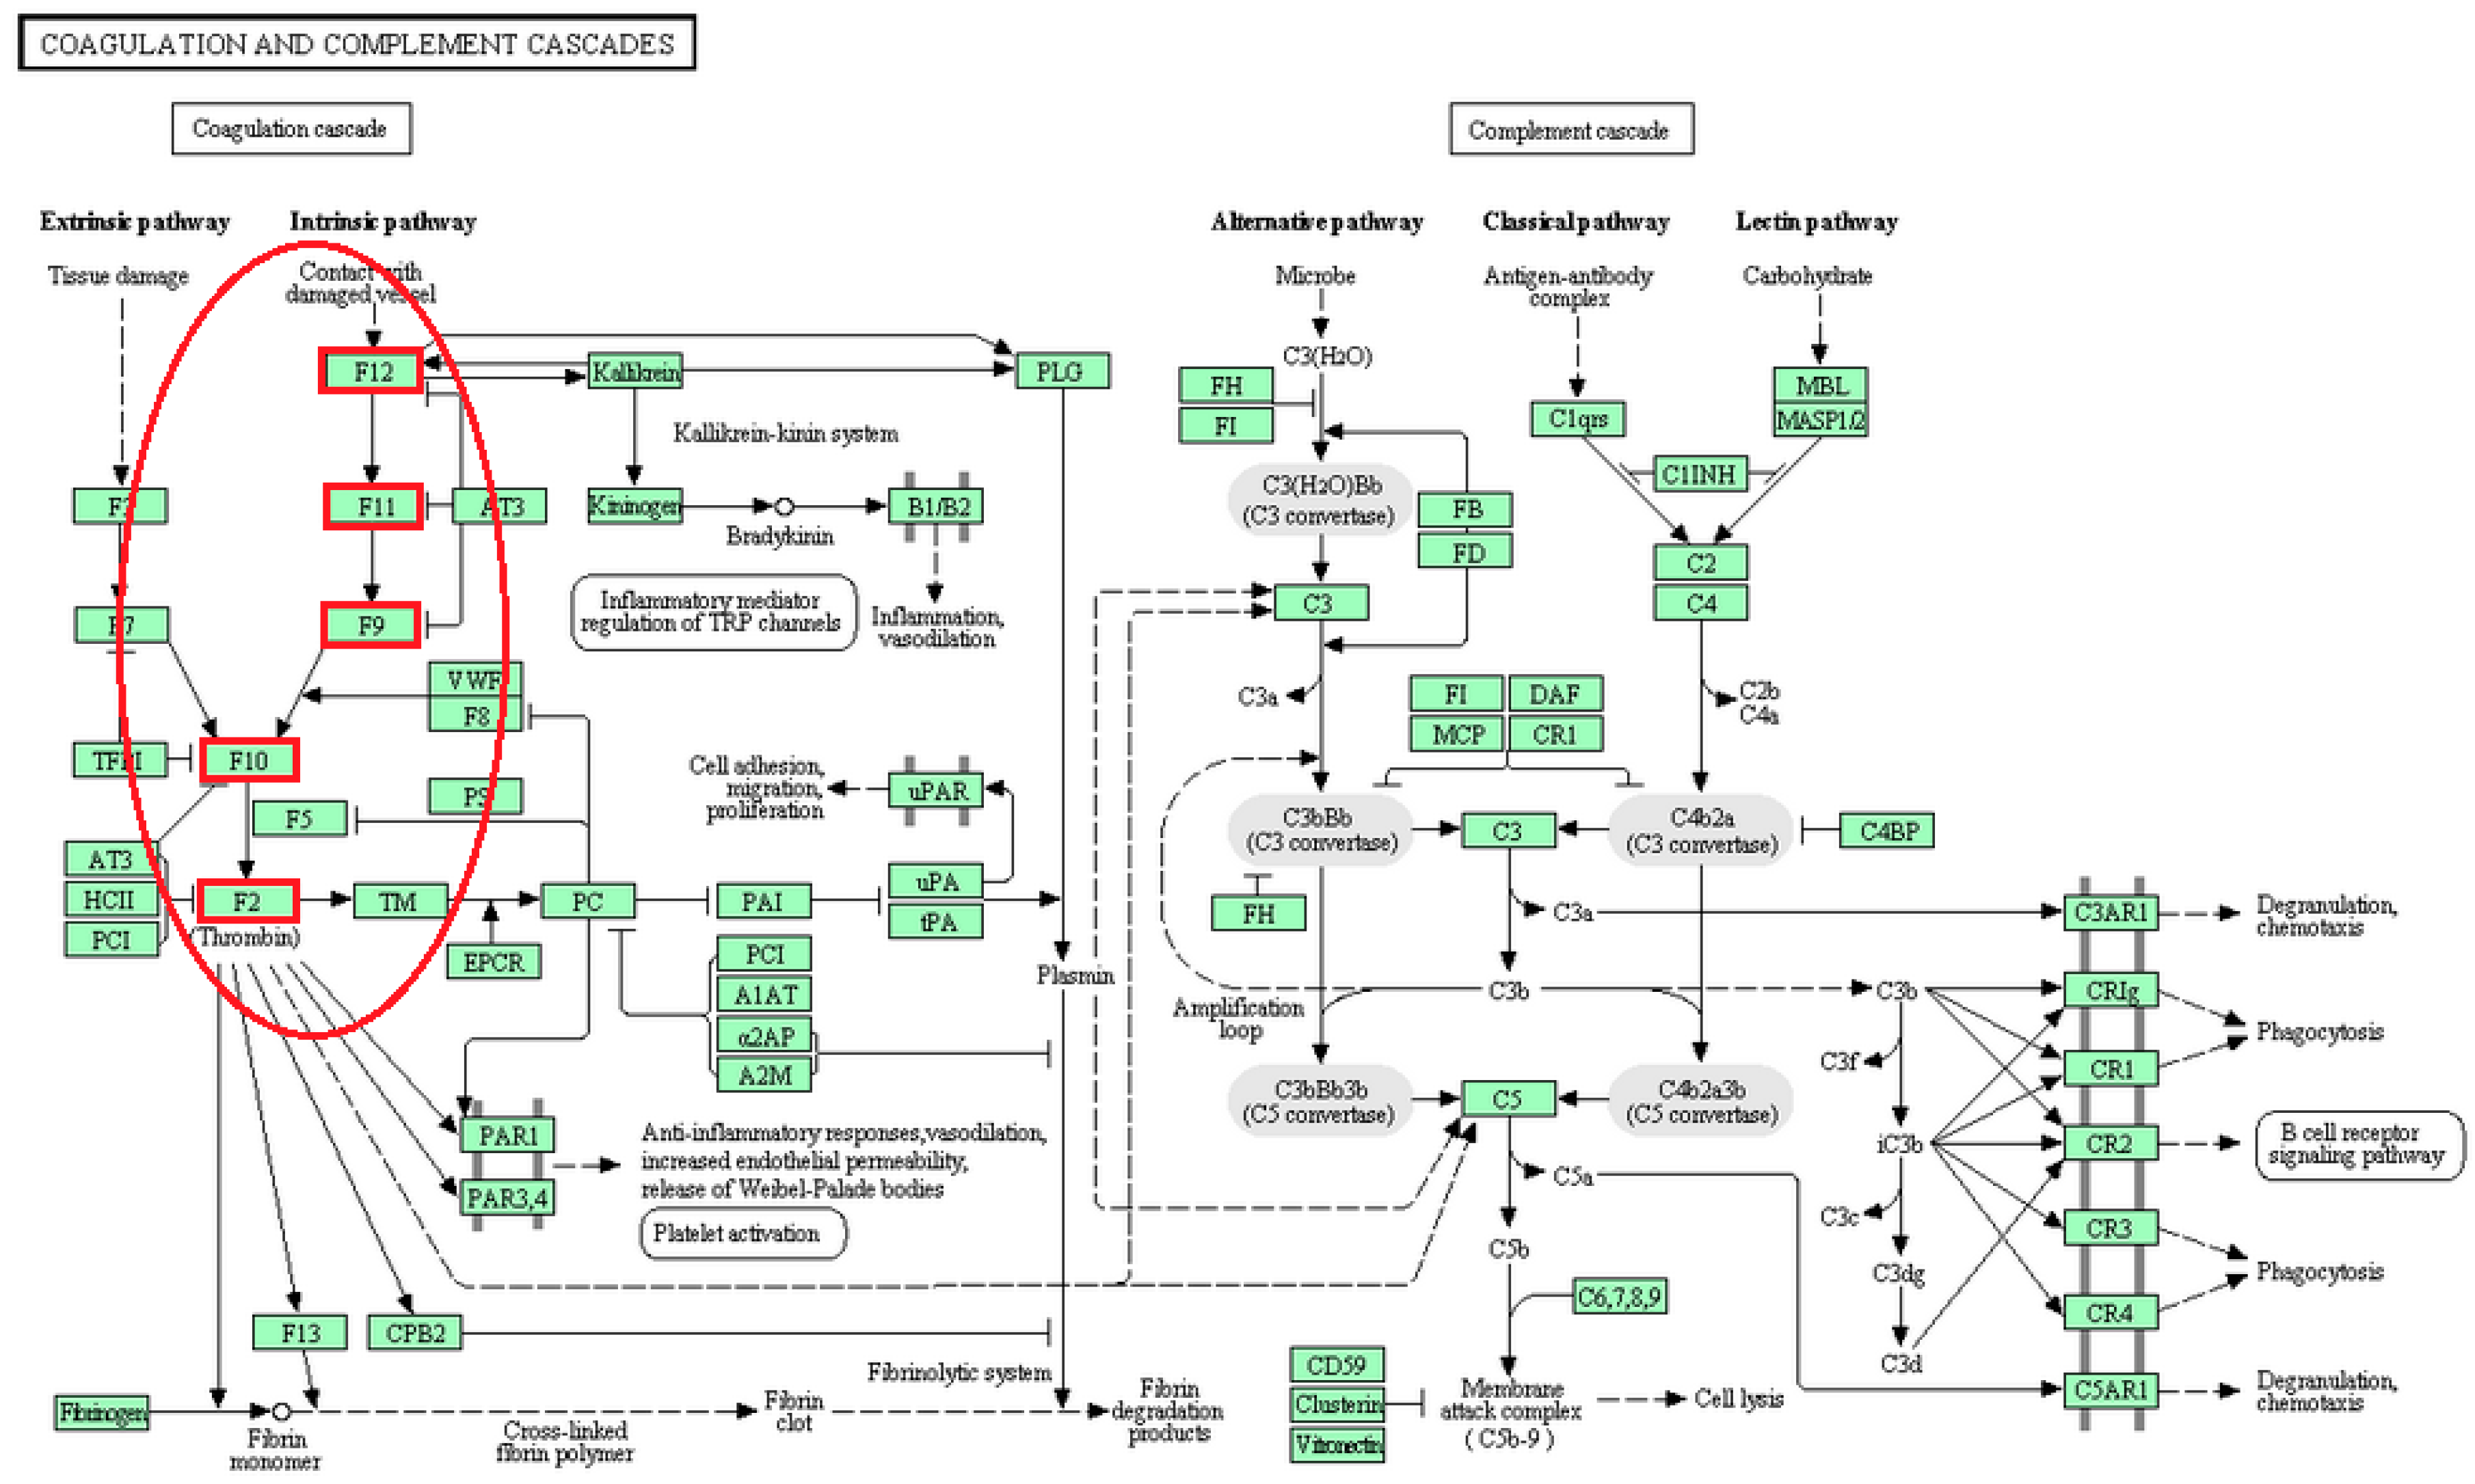
| Coagulation and complement cascades | F12, F11, F9, F10, F2 | [24] |
© 2017 by the authors. Licensee MDPI, Basel, Switzerland. This article is an open access article distributed under the terms and conditions of the Creative Commons Attribution (CC BY) license (http://creativecommons.org/licenses/by/4.0/).
Share and Cite
Vrahatis, A.G.; Dimitrakopoulou, K.; Kanavos, A.; Sioutas, S.; Tsakalidis, A. Detecting Perturbed Subpathways towards Mouse Lung Regeneration Following H1N1 Influenza Infection. Computation 2017, 5, 20. https://doi.org/10.3390/computation5020020
Vrahatis AG, Dimitrakopoulou K, Kanavos A, Sioutas S, Tsakalidis A. Detecting Perturbed Subpathways towards Mouse Lung Regeneration Following H1N1 Influenza Infection. Computation. 2017; 5(2):20. https://doi.org/10.3390/computation5020020
Chicago/Turabian StyleVrahatis, Aristidis G., Konstantina Dimitrakopoulou, Andreas Kanavos, Spyros Sioutas, and Athanasios Tsakalidis. 2017. "Detecting Perturbed Subpathways towards Mouse Lung Regeneration Following H1N1 Influenza Infection" Computation 5, no. 2: 20. https://doi.org/10.3390/computation5020020
APA StyleVrahatis, A. G., Dimitrakopoulou, K., Kanavos, A., Sioutas, S., & Tsakalidis, A. (2017). Detecting Perturbed Subpathways towards Mouse Lung Regeneration Following H1N1 Influenza Infection. Computation, 5(2), 20. https://doi.org/10.3390/computation5020020