Article

Impact of Reaction Parameters and Water Matrices on the Removal of Organic Pollutants by TiO2/LED and ZnO/LED Heterogeneous Photocatalysis Using 365 and 398 nm Radiation

1
Department of Inorganic and Analytical Chemistry, University of Szeged, Dóm tér 7, H-6720 Szeged, Hungary
2
Department of Physical Chemistry and Materials Science, University of Szeged, Rerrich Béla tér 1, H-6720 Szeged, Hungary
*
Author to whom correspondence should be addressed.
Nanomaterials 2022, 12(1), 5; https://doi.org/10.3390/nano12010005
Submission received: 5 November 2021 / Revised: 13 December 2021 / Accepted: 15 December 2021 / Published: 21 December 2021
(This article belongs to the Special Issue Latest Developments in Photocatalytic Materials and Processes)

Abstract

:
In this work, the application of high-power LED365nm and commercial, low-price LED398nm for heterogeneous photocatalysis with TiO2 and ZnO photocatalysts are studied and compared, focusing on the effect of light intensity, photon energy, quantum yield, electrical energy consumption, and effect of matrices and inorganic components on radical formation. Coumarin (COU) and its hydroxylated product (7-HC) were used to investigate operating parameters on the OH formation rate. In addition to COU, two neonicotinoids, imidacloprid and thiacloprid, were also used to study the effect of various LEDs, matrices, and inorganic ions. The transformation of COU was slower for LED398nm than for LED365nm, but r07-HC/r0COU ratio was significantly higher for LED398nm. The COU mineralization rate was the same for both photocatalysts using LED365nm, but a significant difference was observed using LED398nm. The impact of matrices and their main inorganic components Cl and HCO3 were significantly different for ZnO and TiO2. The negative effect of HCO3 was evident, however, in the case of high-power LED365nm and TiO2, and the formation of CO3•− almost doubled the r07-HC and contributes to the conversion of neonicotinoids by altering the product distribution and mineralization rate.

Graphical Abstract

1. Introduction

Advanced Oxidation Processes (AOPs) may offer a solution to remove trace amounts of organic pollutants from aqueous and gaseous media [1]. In the case of AOPs, in addition to efficiency, energy demand is also important, and the light source in photochemical processes determines both. Heterogeneous photocatalysis based on the irradiation of the appropriate semiconductor photocatalysts is a widely investigated method. The absorption of photons having higher energy than the bandgap of the photocatalyst leads to the formation of excited conduction band electrons (eCB) and valence band holes (hVB+) [2]. In addition to recombination [3], the photogenerated charge carriers initiate the transformation of organic compounds via direct charge transfer on the surface of the catalysts or lead to the formation of various reactive oxygen species (ROS) [4]. The most important ROS is the hydroxyl radical (OH) thanks to its high reactivity and low selectivity, resulting in fast transformation and adequate mineralization of organic pollutants during heterogeneous photocatalysis [2,5,6].
The two most widespread commercially available photocatalysts are TiO2 and ZnO, having relatively wide bandgaps; therefore, UV light is needed for their effective excitation. The bandgap reported for TiO2 is 3.0 eV for rutile and 3.2 eV for anatase phase; this value also varies between 3.1−3.3 for ZnO [7,8]. TiO2 has gained popularity due to its high activity, stability, chemical and biological inactivity, and relatively low price. ZnO is also widely investigated, as it has similar properties to TiO2, and lower production cost. The higher electronic conductivity of ZnO results in a faster charge transfer with the species on the surface and, consequently, lower recombination rates than TiO2 [9,10]. However, the photocatalytic properties of ZnO depend on the morphology and particle size [11,12,13], and its susceptibility to photo-corrosion limits its application [14,15].
Excitation of TiO2 and ZnO catalysts has traditionally been performed using different UV lamps (black lights, mercury vapor lamps, xenon lamps) [16]. Recently, Light Emitting Diodes (LEDs) have gained popularity thanks to new LEDs emitting in the UV-A region with high intensity, good electric efficiency [17], and several advantages compared to traditional UV sources, such as narrow wavelength ranges, which allow the construction of specialized photoreactors [17,18,19]. The UV-LED can be considered a quasi-monochromatic light source since the output energy is narrowly (λmax ± 10 nm) distributed around the maximum of the wavelength. Depending on the wavelength used, they can have better electrical efficiency than traditional UV sources [20,21]. LEDs are also available at an affordable price while being compact and robust—thus, flexible and efficient photochemical setups can be constructed [16], and they have a significantly longer lifetime (>10,000 h). The application of UV-LEDs offers an alternative solution for the excitation of photocatalysts and has been employed for heterogeneous photocatalysis in recent years [20,22,23]. It is challenging to find the best design for photoreactors, such as optimizing the distribution and number of LEDs and light intensity [24].
For heterogeneous photocatalysis, the most important factors affecting the transformation rate of a given organic substrate and photocatalyst are the concentration of the substrate, the photocatalysts’ load, and the light intensity. In addition to these factors, the interaction between the substrate and photocatalysts’ surface, the properties of the photocatalysts, and the reactivity of the target substance towards possibly formed various reactive species are also significant [25]. The formation rate of photogenerated charges primarily depends on the light intensity and the absorption properties of the photocatalyst at the given wavelength [26,27,28]. The transformation rate of the target substances depends on the number of photogenerated charges migrated to the surface, which is highly limited by their recombination in bulk, which reduces the availability of photogenerated charges for redox reactions on the surface. It is found that the intensity (the photon flux or photon density) has a substantial impact on the lifetime of charge carriers [28,29,30]. The authors found that at low photon flux there is a linear relationship between the transformation rate and photon flux, while at high photon flux, the transformation rate exhibited a square root dependency on the light intensity [27,31]. However, the role and significance of wavelength [31,32,33,34] and “extra energy” of photons (the difference between the photon energy and bandgap energy) [10] for charge separation and recombination rate efficiency is rarely studied, and the results reported are relatively diffuse.
The efficiency of heterogeneous photocatalysis also depends on the properties of the treated water (e.g., pH, ionic content, dissolved organic matter). The matrix components may affect the surface properties of the photocatalyst, such as the surface charge and the adsorption of target pollutants, or act may as radical scavengers reacting with the photogenerated charges and ROS [35,36,37,38,39]. The role of inorganic ions is often discussed as radical scavengers [35,36,37]; their reaction with photogenerated charges is examined less frequently [38,40]. The fate of the radicals and/or radical ions originated from these inorganic ionic components of matrices, and their role and contribution to the transformation of target organic components during heterogeneous photocatalysis are not yet fully clarified. Our knowledge on the effect of matrices during AOPs is still limited; despite the high number of papers published on the topic, only a small fraction worked with actual wastewaters and even less investigated the effect of each matrix component in detail [41]. Another important shortcoming is that the publications focus on the effect on the conversion rate of the starting compound. However, the effect of the individual matrix components can balance each other, and the effects are manifested in the change of product distribution or the mineralization rate [41,42].
Coumarin (COU) and two neonicotinoids are used as target substances in this work. COU is used to compare OH formation rate in the case of heterogeneous photocatalysis [5,43,44,45,46,47,48,49,50,51]. Neonicotinoids are a class of insecticides causing severe environmental problems, the most well-known being their harmful effect on pollinators [52,53]. They can also have other adverse effects, such as toxicity on non-target organisms [54] or endocrine disruptive effects [55]. The use of several neonicotinoids, such as acetamiprid, imidacloprid (IMIDA), and thiacloprid (THIA) has been restricted by the European Union [56], but they are still extensively used worldwide. The efficiency of their photolytic removal varies; therefore, several AOPs have already been employed to treat neonicotinoid-containing waters, including homogeneous and heterogeneous photocatalysis [57,58,59,60].
This research aimed to compare the efficiency of commercial TiO2 and ZnO photocatalysts irradiated with a high-power UV-A LED (HP LED365nm) having a maximum emission of 365 nm and cheap, commercial LEDs with lower electric power consumption (LED398nm) having a maximum emission of 398 nm. The formation rate of the OH, the essential reactive species, was compared based on the formation rate of the hydroxylated product (7-hydroxy-coumarin (7-HC)) of coumarin (COU). The effect of photon flux, catalyst dosage, and COU concentration was investigated, and reaction parameters were optimized based on the rate and quantum yield of 7-HC formation. Two neonicotinoid pesticides, IMIDA and THIA, as environmentally relevant target substances, were chosen to compare the application of the TiO2 and ZnO photocatalysts and LEDs emitting 365 ± 10 nm and 398 ± 10 nm light. The transformation and mineralization rate, photonic efficiency, and electric power consumption required for the transformation were determined. The formation of organic products, inorganic ions, and change in the ecotoxicity during treatment was also measured. AOPs, including heterogeneous photocatalysis, can be used as an effective tertiary treatment for removing micropollutants, which remain in the water after the conventional physical-biological processes. The oxidation rate is affected by the dissolved organic matter and inorganic species of the water matrix. Accordingly, two water matrices were used in this work, biologically treated domestic wastewater with relatively high ionic and low organic content and tap water having lower ionic and organic content. Special attention was paid to studying the effect of Cl and HCO3, and their combined effect as the main inorganic components of both matrices.

2. Materials and Methods

2.1. Photochemical Reactors and Light Sources

One of the photoreactors was equipped with high-power UV-A LEDs (Vishay; Malvern, USA; VLMU3510-365-130; LED365nm) emitting light from 355–380 nm, with UV-emission maximum at 365 nm. The 12 SMD diodes were soldered on metal core printed circuit boards (Meodex, Narbonne, France) and fixed on aluminum heat sinks (Fischer Elektronik; Lüdenscheid, Germany 0.70 K W−1). A laboratory power supply (Axiomet, Malmö, Sweden; AX-3005DBL-3; maximum output 5.0 A/30.0 V) was used to provide and control the electrical power needed to operate the light sources (Pelmax = 21 W). The 200 cm3 solutions were irradiated in a cylindrical borosilicate [61] glass reactor, and the suspension was bubbled with gas (N2 (99.995%) or synthetic air) (Figure S1).
The other photoreactor was equipped with UV-Vis LEDs (LED398nm) emitting light from 385–420 nm, with an emission maximum at 398 nm. The cheap, commercial LED398nm tape (LEDmaster, Szeged, Hungary; Pelmax = 4.6 W; 60 LED m−1) was fixed on the inner side of a water-cooled aluminum tube. The 100 cm3 solution was irradiated in a cylindrical borosilicate glass reactor (Figure S1). The electrical power of the LEDs was regulated by the power supply (100%, 50%, or 25% of Pradiantmax).
The emission spectra of the used light sources were measured using a two-channel fiber-optic CCD spectrometer (AvaSpec-FT2048, Avantes, The Netherlands) operated in the 180–880 nm wavelength range. The electric power consumption of LED398nm was determined with a digital multimeter (Maxwell 25331; Oakland, CA, USA).

2.2. Photochemical Experiments and Analytical Methods

The photon flux of the light sources was measured by potassium-ferrioxalate actinometry, a standard one recommended by IUPAC [62] that is widely investigated and applied in the literature [62,63,64,65,66,67,68,69]. The 1.0 × 10⁻² M Fe3+-oxalate solutions were irradiated, the released Fe2+ was measured after complexation with 1,10-phenanthroline. The absorbance of the Fe2+-phenanthroline complex was measured at 510 nm using UV-Vis spectrophotometry (Agilent 8453, Santa Clara, CA, USA) in a quartz cuvette with a 0.20 cm optical path length. The quantum yields applied for the calculation of the photon flux were slightly different: 1.21 for LED365nm and 1.14 for LED398nm [63].
During photocatalytic experiments, two commercially available photocatalysts were used, TiO2 Aeroxide P25® (Acros Organics) and ZnO (d < 100 nm, Sigma Aldrich; St. Louis, MO, USA). Diffuse reflectance spectroscopy (DRS) was performed using an Ocean Optics USB4000 detector and Ocean Optics DH-2000 light source. The bandgap energy values of the photocatalysts were evaluated by the Kubelka–Munk approach and the Tauc plot.
The initial transformation rate of COU (r0COU) and the initial formation rate of 7-HC (r07-HC) were determined from the linear part of the kinetic curves, up to 15% transformation of COU. Before analysis, the samples were centrifuged (Dragonlab; Beijing, China 15000 RPM) and filtered using syringe filters (FilterBio Nantong, China; PVDF-L; 0.22 µm). The COU concentration was measured using UV-Vis spectrophotometry at 277 nm (ε277nm = 10293 M−1 cm−1). The concentration of COU in the treated sample was also determined by spectrophotometry and HPLC measurements. The difference between the determined concentrations for the same samples was less than 10%, so spectrophotometric determination was used for further experiments. The UV-Vis absorption and emission spectra of the model compounds are summarized in Figure S2. The concentration of the formed 7-HC was determined using fluorescence spectroscopy (Hitachi F-4500; Tokyo, Japan); the excitation and emission wavelengths were 345 nm and 455 nm, respectively.
The concentration of IMIDA and THIA were determined by HPLC-DAD (Agilent; Santa Clara, CA, USA 1100, column: Lichrosphere 100, RP-18; 5 μm). The eluent consisted of 40 v/v% methanol (MeOH) and 60 v/v% water, the flow rate was 1.0 cm3 min−1, the temperature was set to 30 °C. Detection of IMIDA and THIA was performed at 270 nm and 242 nm, respectively; their retention time was 5.1 min and 9.1 min. The determination of the products was carried out by HPLC-MS measurements, with an Agilent LC/MSD VL mass spectrometer (Agilent, Santa Clara, CA, USA) coupled to the HPLC. The measurements were performed using an APCI ion source and a triple quadruple analyzer in positive mode (4000 V capillary voltage, 60 V fragmentor voltage, and 4.0 μA corona current). The flow rate of the drying gas was 4.0 dm3 min−1, and its temperature was 200 °C. The scanned mass range was between 50–500 AMU.
Total Organic Carbon (TOC) concentration was determined using an Analytik Jena (Jena, Germany) N/C 3100 analyzer. The formation of inorganic ions (Cl, NO2, NO3, SO42− and NH4+) was measured using ion chromatography (Shimadzu, Kyoto, Japan) Prominence LC-20AD, Shodex 5U-YS-50 column for cation detection, and Shodex NI-424 5U for anion detection). The eluent for cations and anions was 4.0 mM methanesulfonic acid and a mixture of 2.5 mM phthalic acid and 2.3 mM aminomethane, respectively. The flow rate of the mobile phase was 1.0 cm3 min−1.
Ecotoxicity tests (LCK480, Hach Lange GmbH, Düsseldorf, Germany) were based on the bioluminescence inhibition of the marine bacteria Vibrio fischeri. H2O2, which form during the transformation of organic substances, was decomposed in the samples by adding catalase enzyme before starting the ecotoxicity tests. The catalase concentration in the samples was 0.20 mg dm−3. The bioluminescence of the test organism was measured using a Lumistox 300 (Hach Lange) luminometer after 30 min incubation time.

2.3. Chemicals and Solvents Used

Two commercial photocatalysts, TiO2 Aeroxid® P25 (Sigma Aldrich; St. Louis, MO, USA) and ZnO (Sigma Aldrich; St. Louis, MO, USA, <100 nm) were used. The used TiO2 photocatalysts consist of 76–78% anatase phase and 10–16% rutile phase. The presence of amorphous TiO2 was also reported [70,71,72]. ZnO contains only wurtzite phase. The list of used chemicals can be found in Table S1. The water matrices used were tap water (Szeged, Hungary) and biologically treated domestic wastewater (Szeged, Hungary); their parameters are summarized in Table S2.

3. Results and Discussion

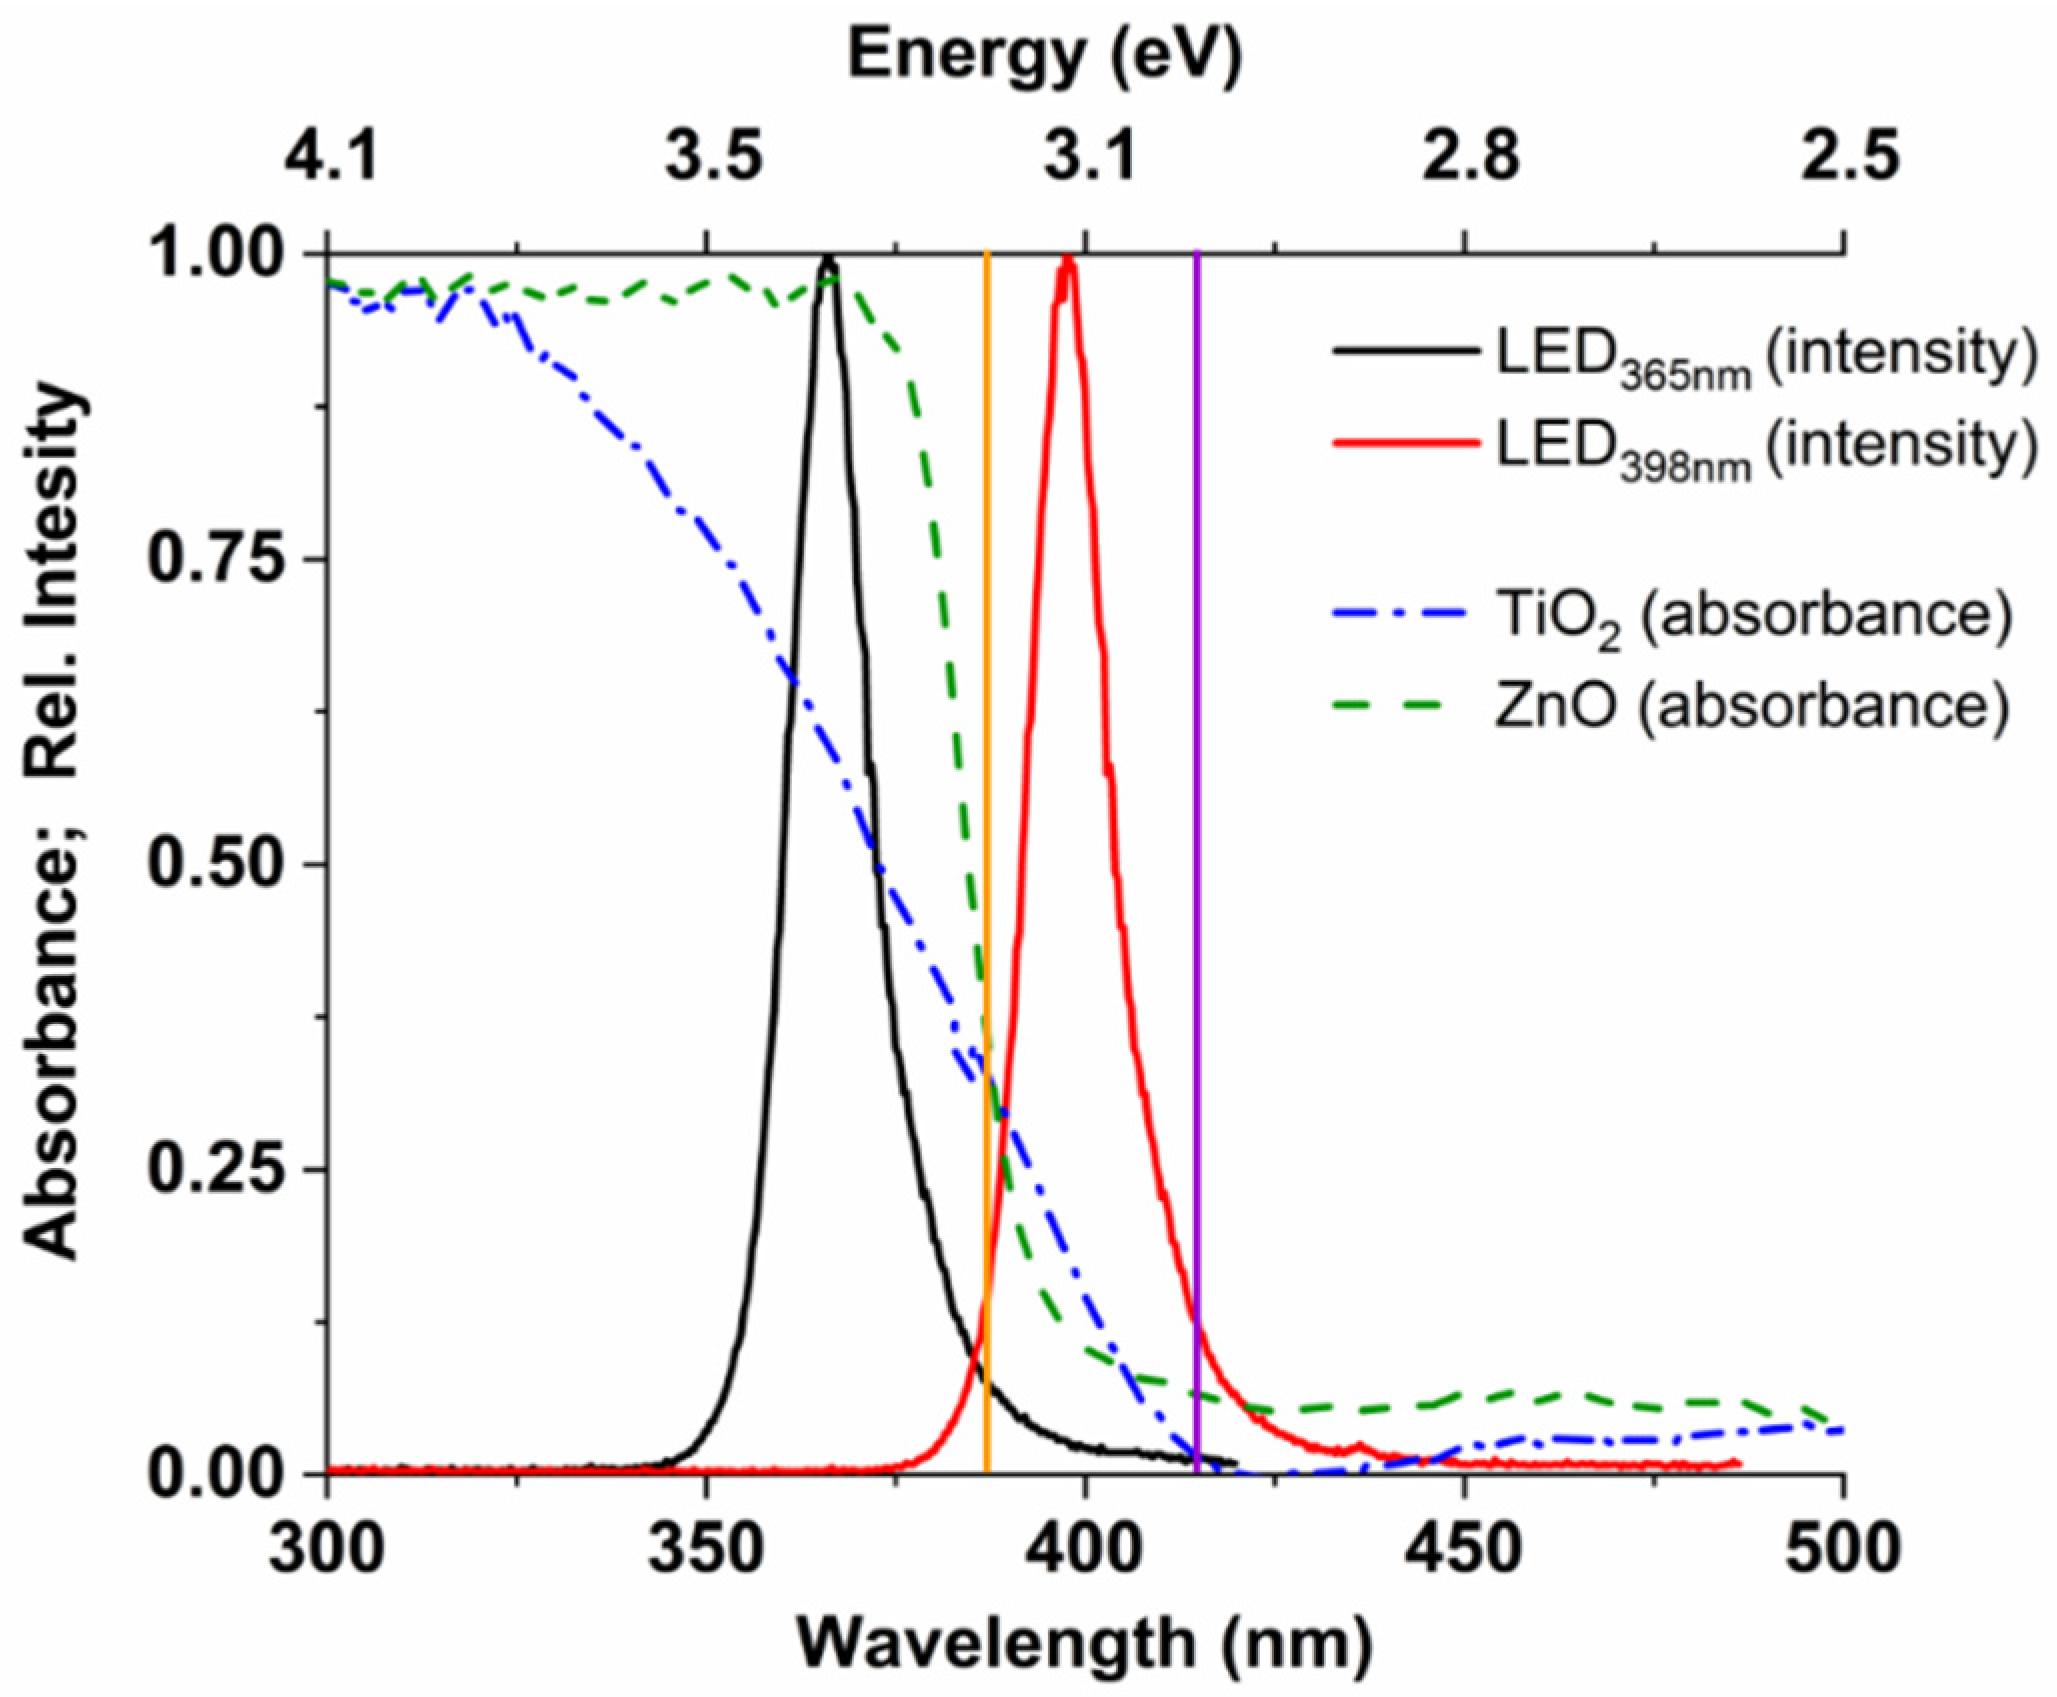
3.1. Photon Flux and Electrical Efficiency of the LEDs

The photon flux of both LEDs changes linearly with the electric power consumption (Figure S3) in the investigated range. For the photoreactor equipped with 12 pieces of LED365nm, the photon flux changed from 2.83 × 10⁻⁶ to 1.71 × 10⁻⁵ molphoton s−1 when electric power increased from 3.4 W to 20.8 W. For LED398nm, the change of electric power from 0.96 W to 4.68 W increased the photon flux from 1.2 × 10⁻⁶ to 4.6 × 10⁻⁶ molphoton s−1. In this case, 60 pieces of LEDs irradiated the reactor volume. The obtained electrical efficiencies (Pradiant/Pelectric) were 27% for LED365nm regardless of the photon flux, and 30–37% for LED398nm, decreasing with the increase of the photon flux (Table S3).

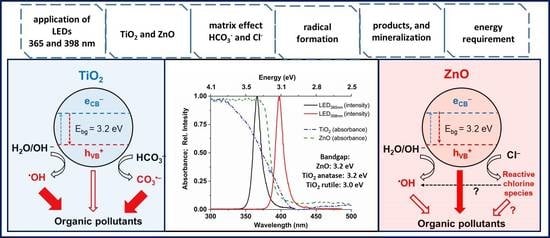
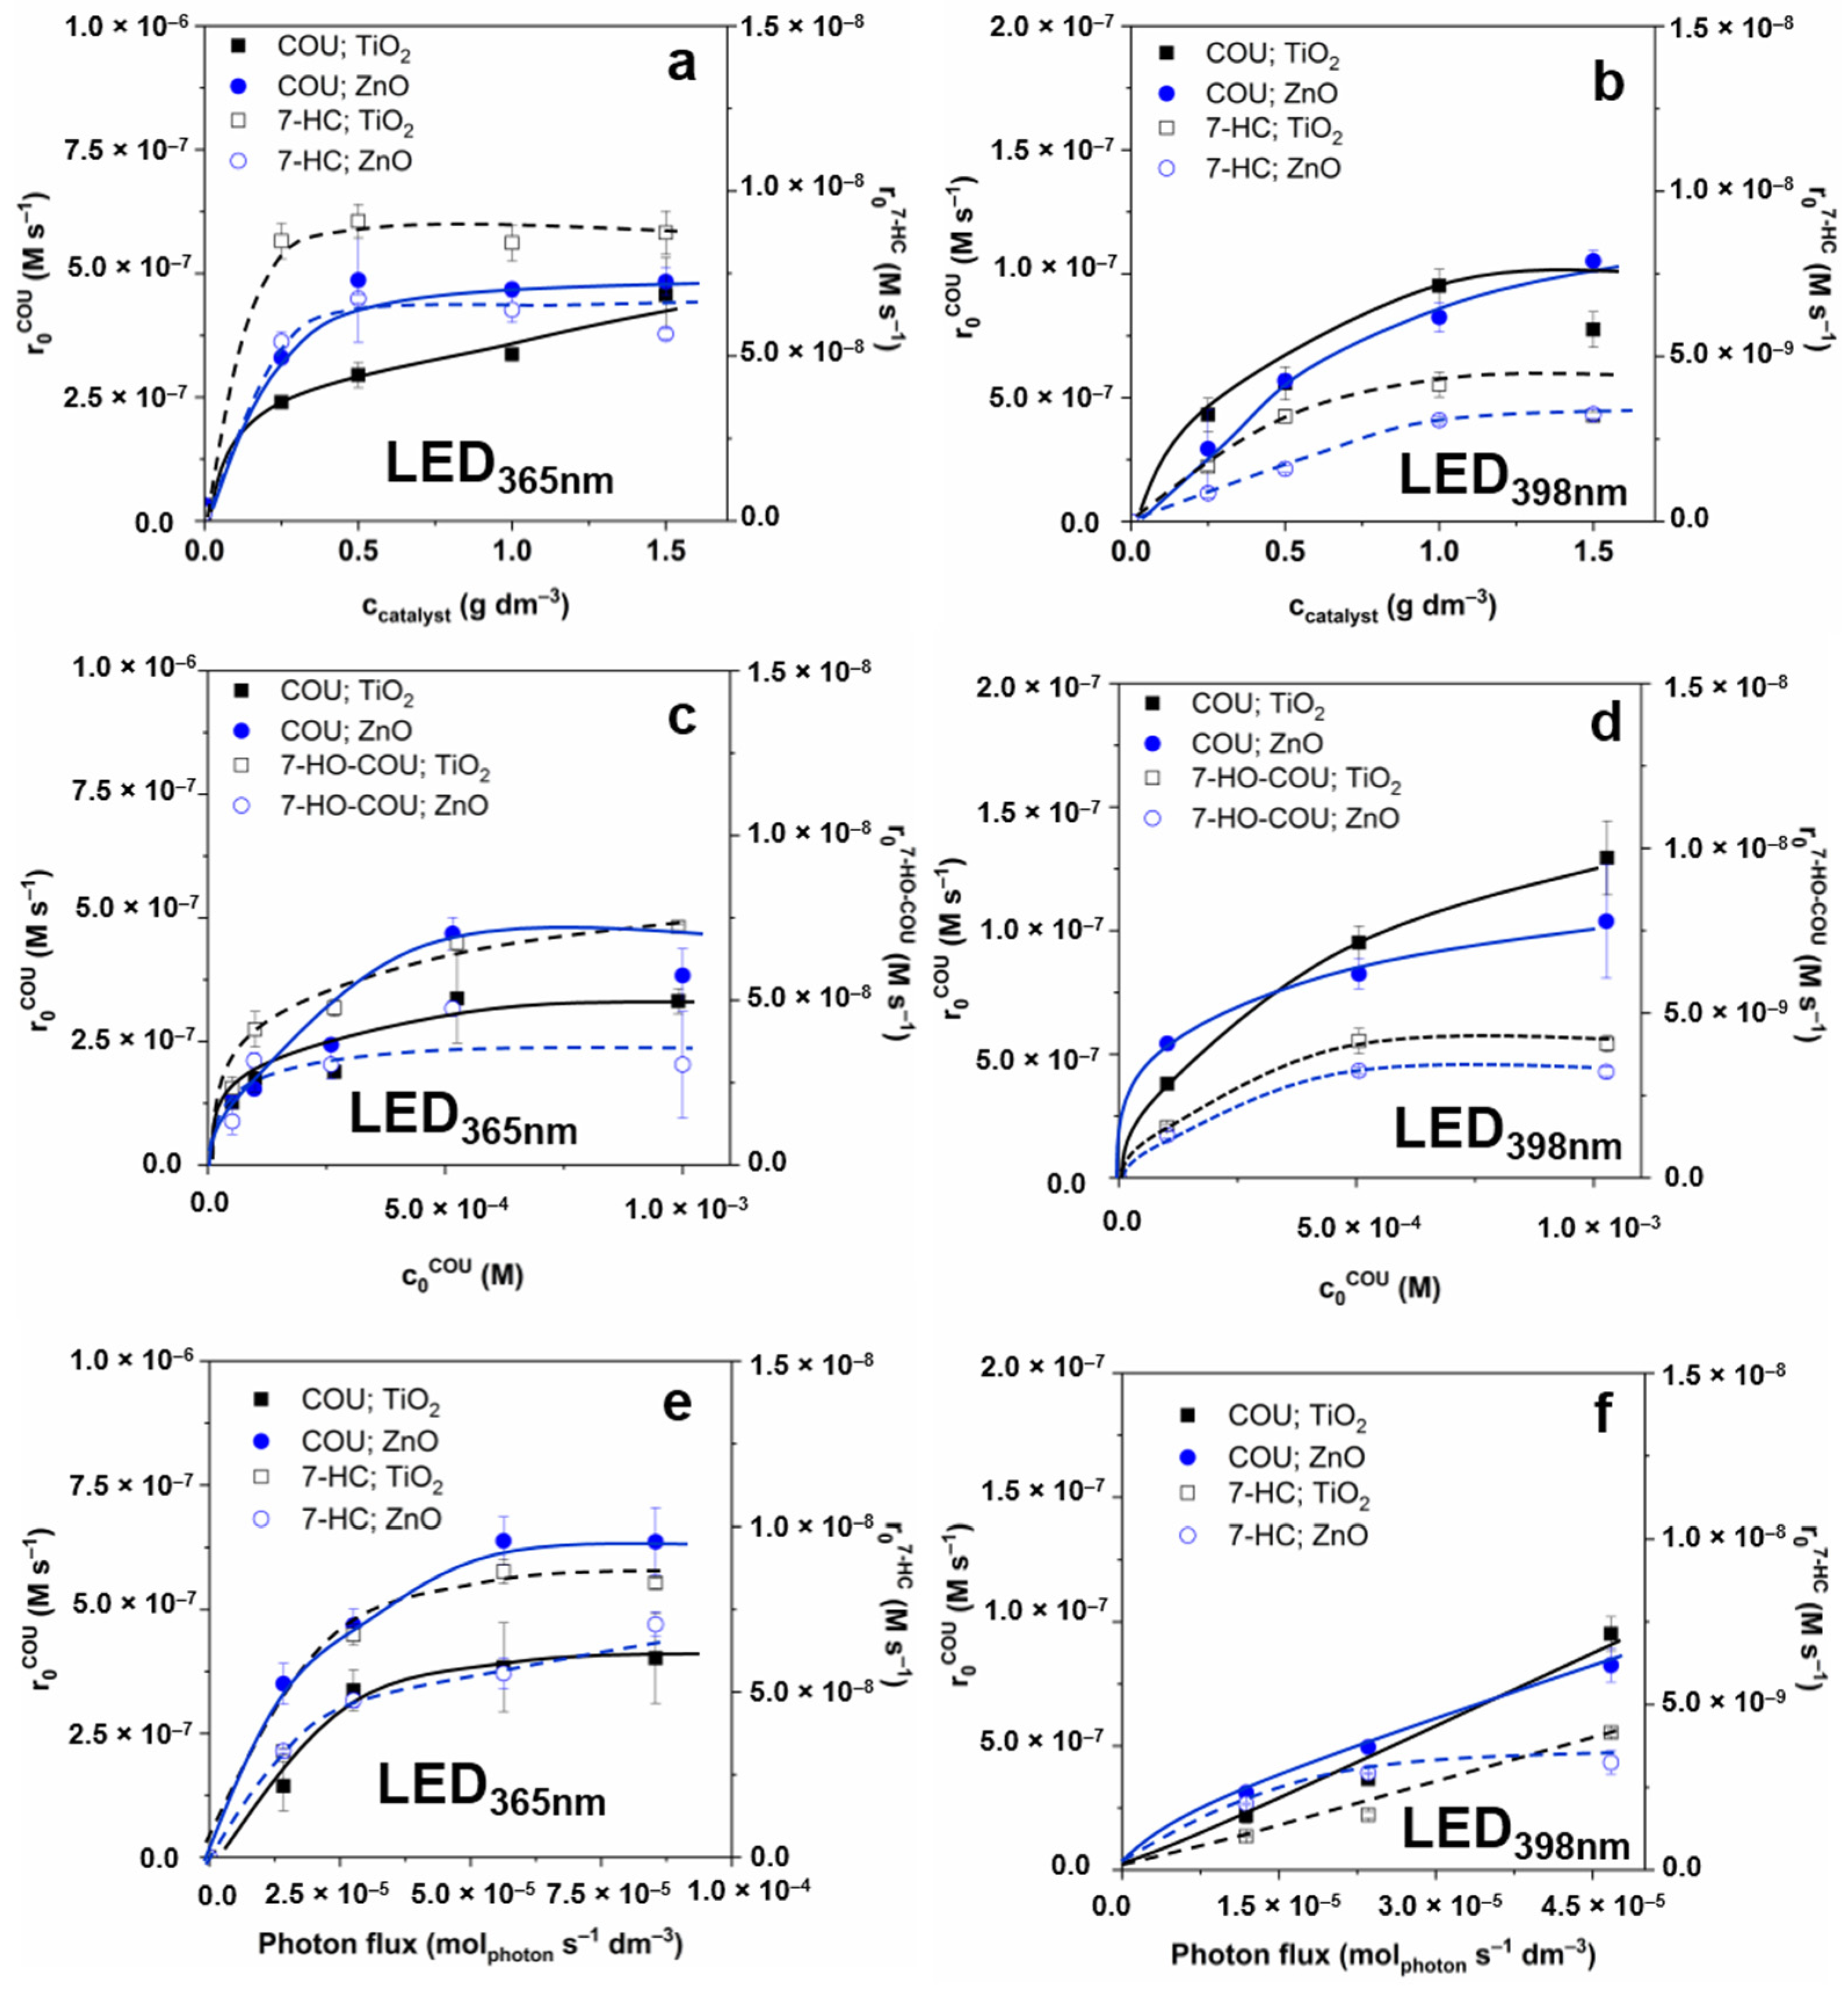
3.2. Effect of Reaction Parameters on the OH Formation

The reaction between COU and OH (kCOU+•OH = 6.9 × 10⁹ M−1 s−1 [73]) radicals results in a highly fluorescent molecule, 7-hydroxycoumarin (7-HC). This method is fast and adequate with sufficient sensitivity, and it has been applied for detecting OH radicals produced in a photocatalytic system by many authors [5,43,44,45,46,47,48,49,50,51,73,74,75]. Thus, the optimization of reaction parameters was based on the formation rate and quantum yield of 7-HC formation for both light sources (LED365nm and LED398nm) and photocatalysts (TiO2 and ZnO). The effect of the fundamental parameters, such as photocatalyst and COU concentration, and the photon flux was investigated. The relative adsorbed amount of COU and 7-HC was less than <1.0% in each case.
The photon flux was adjusted to a similar value (5.52 × 10⁻⁶ molphoton s−1 for LED365nm and 4.68 × 10⁻⁶ molphoton s−1 for LED398nm) when the effect of the initial COU concentration and catalyst dosage were studied. The effect of photocatalyst dosage (0–1.5 g dm−3) was determined at 5.0 × 10⁻⁴ M COU concentration. For LED365nm, over 0.5 g dm−3, the transformation rate of COU (r0COU) slightly increased or did not change significantly (Figure 1a). The r0COU values determined for ZnO exceeded that determined for TiO2; however, the 7-HC formation (r07-HC) was faster for TiO2 than for ZnO, indicating a more efficient OH formation. A plausible explanation of this fact can be the relatively higher contribution of the direct charge transfer to the COU transformation for ZnO than for TiO2. The r07-HC value became constant above 0.5 g dm−3 for both photocatalysts (6.4 × 10⁻⁹ mol dm−3 s−1 and 4.7 × 10⁻⁹ mol dm−3 s−1 for TiO2 and ZnO, respectively). When LED398nm was applied, the r0COU and r07-HC increased to 1.0 g dm−3 (Figure 1b). Consequently, for further experiments, 1.0 g dm−3 photocatalyst concentration was used.
Applying LED365nm, r0COU and r07-HC reached the maximum at 5.0 × 10⁻⁴ M COU concentration and did not change significantly with the further increase (Figure 1c). In the case of LED398nm, a similar trend was observed; the r07-HC reached the maximum value at 5.0 × 10⁻⁴ M COU (Figure 1d), although the r0COU slightly increased. Consequently, for further experiments, 5.0 × 10⁻⁴ M COU and 1.0 g dm−3 catalyst concentrations were used to maximize the r07-HC.
At constant photocatalyst (1.0 g dm−3) and COU (5.0 × 10⁻⁴ M) concentrations, the formation rate of photogenerated charges depends on the photon flux. Therefore, experiments were performed at different light intensities (Figure 1e,f). Since increasing the photon flux can be achieved by increasing the electrical energy investment, these results are also crucial in optimizing the operation cost of heterogeneous photocatalysis. Using LED365nm, high values of ΦappCOU and Φapp7-HC were obtained at relatively low photon fluxes; the apparent quantum efficiency significantly decreases with the photon flux increase (Table 1), while r0 values change according to a saturation curve. Doubling the electrical power (6.55 → 13.60 W) and the photon flux in this way, the r0 values increased by only 20–30%, and the further increases (13.60 → 20.77 W) did not change that significantly for both photocatalysts. For LED398nm the r0 values increased, and there was no significant change of the apparent quantum yield within the photon flux range applied in the case of TiO2. A similar trend was observed for ZnO for both LEDs (Table 1) than for TiO2 and LED365nm; the Φapp value (especially the Φapp7-HC) decreased with the intensity increase.
At a given wavelength, the absorption properties and the bandgap of the photocatalyst determine the excitation efficiency primarily. In addition to these factors, the recombination rate of the photogenerated charge carriers also determines the transformation efficiency of organic substances and the radical generation rate. Based on the spectrum of the light sources and the absorbance of the catalysts (Figure 2), it can be stated that the photons of the LED365nm (radiating between 355–380 nm) can be wholly absorbed by ZnO, while about 80% of photons are absorbed by TiO2 due to its less favorable optical properties. According to the bandgaps (3.0 eV for rutile, 3.2 eV for anatase and ZnO), both photocatalysts can be excited using this light source. Nevertheless, ZnO and TiO2 can absorb no more than ~20% of the emitted photons when LED398nm (radiating between 385–420 nm) is used (Figure 2). The difference between absorbance of the photocatalysts at 365 and 398 nm is well reflected by the ΦappCOU values for LED365nm and LED398nm (Table 1).
Another critical difference is that, for TiO2, the photons emitted by the LED398nm can primarily excite the rutile phase (Figure 2). Tang et al. [76] reported a quantum efficiency dependence on the photon flux according to a maximum curve, which correlates well with our results for LED365nm (Table 1). Probably, above a given value, which value depends on electron mobility, the further increase of the photon flux enhances the recombination of the photogenerated charges, while several factors limit the redox reactions on the surface. However, Sachs et al. [77] reported that the rutile shows faster but less intensity-dependent recombination of photogenerated charges than anatase, which can be the reason for similar Φapp values measured at different intensities of 398 nm light, as mainly the rutile phase is excited in this case.
The effect of irradiation wavelength is moderated when r07-HC and Φapp7-HC values are compared (Table 1). It indicates that despite the lower transformation rates of COU due to the less efficient absorption of 398 nm than 365 nm photons (Figure 2), the relative contribution of OH to the transformation of COU is probably greater at 398 nm irradiation. The yield of 7-HC (r07-HC/r0COU) is 0.02 for TiO2, 0.01 for ZnO when LED365nm is used, and significantly higher values, 0.045 for TiO2 and 0.06 for ZnO, are obtained when LED398nm is applied (Table 1). Presumably, due to the lower efficiency of the excitation of photocatalysts and consequently the number of photogenerated charges, the probability of eCB–hVB+ recombination also decreases, and the quantum yield of OH formation increases. For further experiments, 6.56 W for the LED365nm, and 4.68 W for the LED398nm were used, where the apparent quantum yields and transformation rates were relatively high.

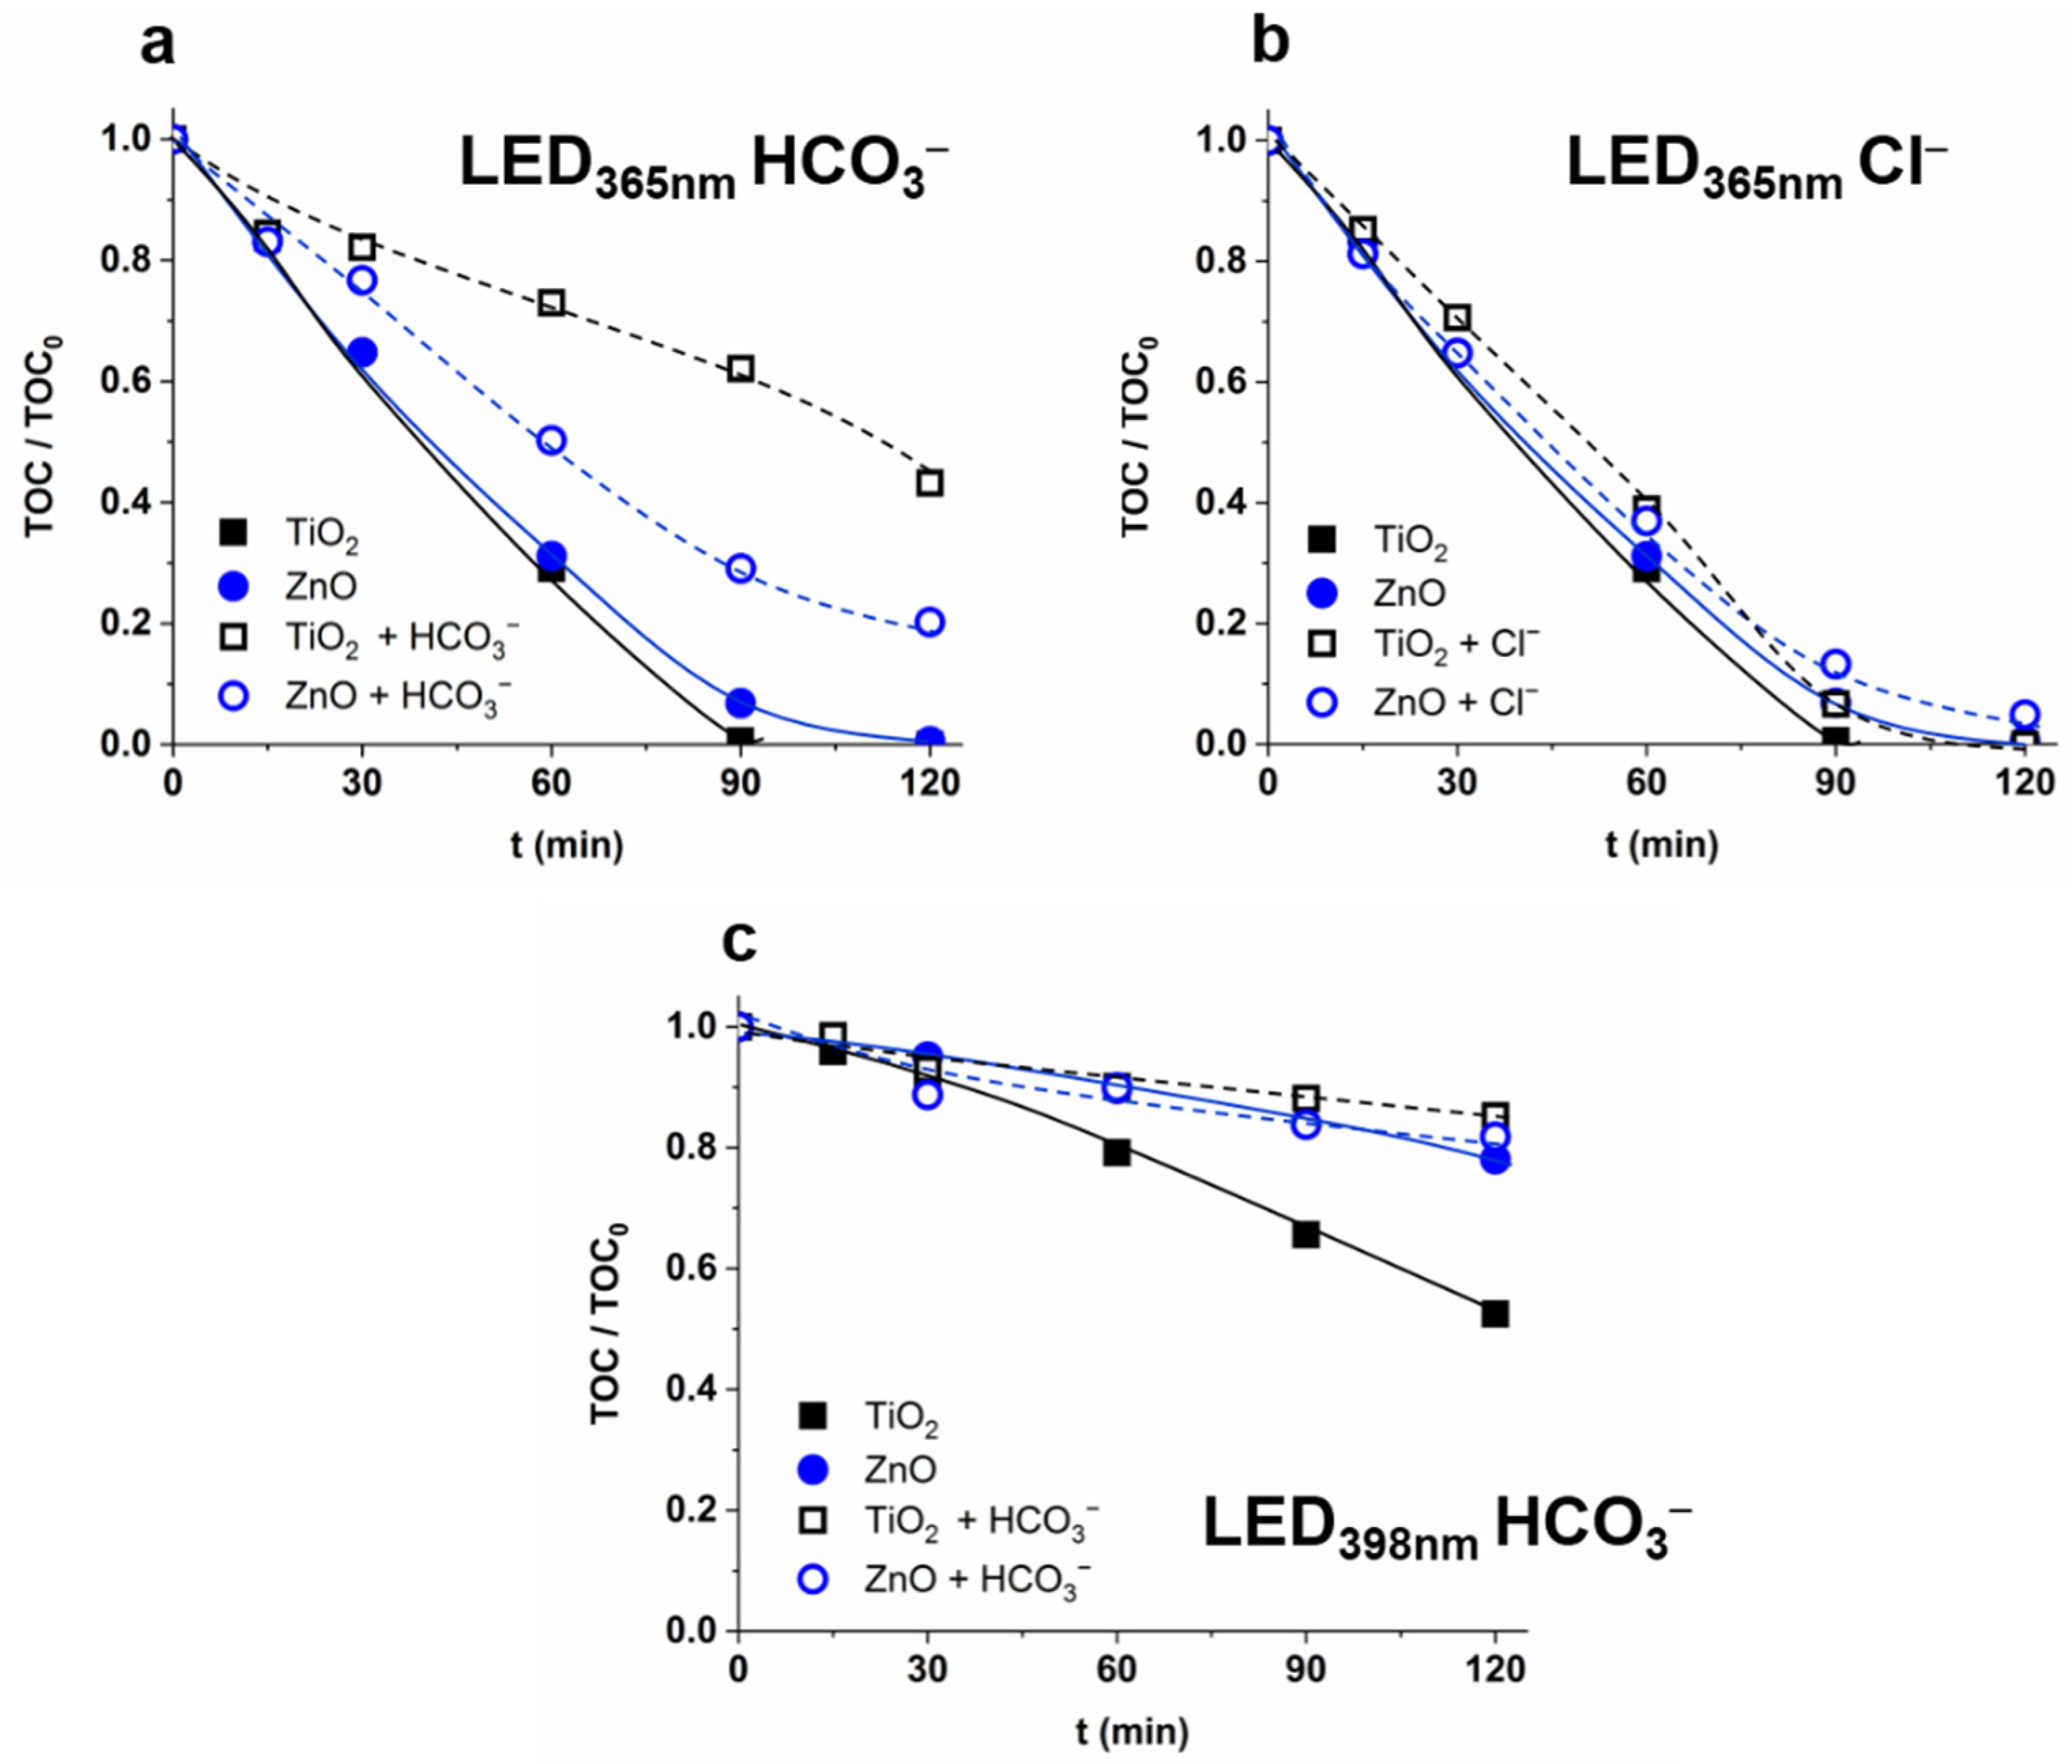
3.3. The Effect of Matrices and Matrix Components on the OH Formation

The components of the treated water have a crucial role during heterogeneous photocatalysis, and their effect can be complex. The ionic components can change the surface properties of the photocatalyst (surface charge and potential), and in this way, they affect the interaction between the surface of the photocatalyst and the target compounds and the formation rate of ROS [36,37,78,79,80]. The generally negative effect of matrices is usually attributed to the scavenging of OH, the occupation of adsorption sites by the well-adsorbed inorganic and organic matrix components, or the aggregation of photocatalyst particles at higher ionic strength. Two real water matrices, tap water and biologically treated domestic wastewater (Table S2), were used in this work to study the matrix effect on the transformation rate of COU and OH formation rate and characteristic differences between TiO2 and ZnO were observed. In the case of TiO2, both matrices reduced the r0COU and the r07-HC significantly and to a similar extent (Figure 3a,b). For ZnO, the transformation of COU was only slightly inhibited, while the r07-HC increased, especially in the case of LED365nm (Figure 3a,b).
Due to the significant difference observed between TiO2 and ZnO, first, the effect of 5.0 × 10⁻³ M methanol (MeOH) as a non-absorbed OH-scavenger (kMeOH+•OH = 9.7 × 10⁸ mol−1 dm3 s−1 [81]) was investigated. MeOH has a similar effect using both catalysts and LEDs (Figure S4). The inhibition effect on COU transformation and 7-HC formation (decrease by 45–55%) is similar and reflects well the calculated OH scavenging capacity of MeOH (about 40% of the OH reacts with MeOH at the given initial concentrations). All this suggests that the difference observed for TiO2 and ZnO cannot be attributed solely to the OH scavenging effect of the organic matter content of the matrices (0.79 mg dm−3 and 6.9 mg dm−3 TOC content for tap water and biologically treated domestic wastewater, respectively) (Table S2).
The effect of the two most abundant anions of matrices, Cl and HCO3, was investigated in suspensions containing one or both anions. Their concentrations were set to the same value as the biologically treated domestic wastewater (120 mg dm−3 Cl and 525 mg dm−3 HCO3 (Table S2)). In the case of LED365nm, Cl did not affect the r0COU and the r07-HC for TiO2, but increased the r07-HC for ZnO by 63% with unchanged r0COU (Figure 3c). Cl is reported to react with OH with a high reaction rate (k•OH + Cl− = 3.0 × 10⁹ M−1 s−1 [81]); consequently, an inhibition is expected. The backward reaction reforming OH can occur at the pH values used in the current work (6.0 for TiO2 and 7.5 for ZnO) [36]. However, this does not explain the difference observed between the two catalysts. The adsorption of ions, the change of surface charge, and reaction with photogenerated charges also must be considered. The very slow conversion [82] and its negligible hVB+ scavenging effect of Cl in TiO2 suspensions were reported [38]. Opposite to the TiO2, the Cl are adsorbed well on the ZnO surface, having a positive charge [83,84,85] and enhancing the formation rate of ROS due to the hindered recombination of photoinduced eCB and hVB+ [83]. Significant conversion of Cl by hVB+ to HClO has been reported in some cases [82,86,87]. The degradation of HClO via reaction with eCB, or superoxide radical anions (O2•−) also results in the formation of OH [87,88], which may explain the increased r07-HC for ZnO. Active chlorine species formation and photocatalytic reactions are complex, depending on many parameters [88,89,90], and require further investigation. Moreover, the positive effect of Cl was observed only in the case of 365 nm radiation. This suggests that the excess energy of the photons or the concentration of photogenerated charges can have a role in the manifestation of the Cl effect in the case of ZnO.
The HCO3 reduced the r0COU and r07-HC by the same extent (by about 30%) when ZnO and LED365nm were used. For TiO2, the r0COU was reduced by 50%, but r07-HC was more than doubled (Figure 3c). Due to the relatively low reactivity of HCO3 with OH (k•OH + HCO3− = 1.0 × 10⁷ M−1 s−1 [81]), the inhibition of COU transformation cannot be attributed solely to its OH scavenging role (~5% of OH reacts with HCO3); its reaction with hVB+ is also essential. The reaction between HCO3 and hVB+ results in CO3•− formation only in the case of TiO2, not in the case of ZnO [38,40]. The formed CO3•− is a selective and less reactive reaction partner than OH, but its reaction with aromatic compounds results mainly in hydroxylated products [91,92,93], similar to OH. Thus, the formation of CO3•− instead of OH can be responsible for the r0COU decrease and probably for the r07-HC increase. These results also indicate that r07-HC is unsuitable for determining the OH formation rate when CO3•− forms in the system. Comparing the effect of HCO3 in the 365 and 398 nm irradiated TiO2 suspensions, the inhibition of the COU transformation is more pronounced in the case of 398 nm radiation, likely because of the less efficient excitation; consequently, there is a lower concentration of both photogenerated charges and OH. The difference between the two light sources is exciting, as additives have a characteristic effect on the formation of 7-HC in the case of LED365nm.
The change of the mineralization rate confirmed the enhanced formation rate of less reactive CO3•− instead of OH. In the case of 365 nm radiation, the mineralization rate was the same for TiO2 and ZnO, and significantly reduced by HCO3 to a much greater extent for TiO2 than for ZnO (Figure 4a). The reaction between HCO3 and hVB+, and the formation of CO3•−, is likely to play a significant role only in the case of TiO2. In the case of ZnO, the HCO3 primarily acts as an OH scavenger, while in the case of TiO2 it also reacts with OH and the hVB+. The formed CO3•− is less efficient for mineralization than OH. Thus, mineralization is inhibited by HCO3 to a greater extent for TiO2 than for ZnO. The Cl enhanced the r07-HC for ZnO but had no significant effect on the r0COU (Figure 3c) and mineralization (Figure 4b). One possible interpretation is that the radical scavenging effect of Cl and its positive effect on charge separation and/or regeneration of OH from Cl-containing species compensate for each other.
A significant difference was observed between mineralization rates for ZnO, and TiO2 determined in the suspensions irradiated with 398 nm light, although there was no difference in the case of 365 nm irradiation. However, 398 nm light excites only the rutile phase, and the TiO2 is much more effective in mineralization than ZnO having slightly better optical properties at a longer wavelength range. Moreover, the inhibition effect of HCO3 is manifested only for TiO2 (Figure 4c).
In suspensions containing both Cl and HCO3, the synergistic effect of the anions was not observed. In the case of 365 nm radiation, the negative effect of HCO3 on r0COU was dominant. At the same time, for ZnO, the Cl effect while for TiO2 the HCO3 effect was dominant on the r07-HC (Figure 3c). The extent of the effect depended on the wavelength; in the case of LED398nm, only a slight reduction of reaction rates was observed (Figure 3d). Comparing the effect of anions and their mixtures to the tap water and biologically treated domestic wastewater (Figure 3a,b), the reduction of photocatalytic activity in these matrices cannot be solely responsible for the presence of inorganic anions, especially for TiO2. For ZnO, the inhibition effect matrices are similar to that of the Cl and HCO3 mixture; the r0COU slightly decreased, in the case of both LEDs, while r07-HC increased, especially for 365 nm radiation. However, for TiO2, the transformation is much more inhibited and cannot be explained by the effect of Cl and HCO3 and the relatively low organic content of the matrices.

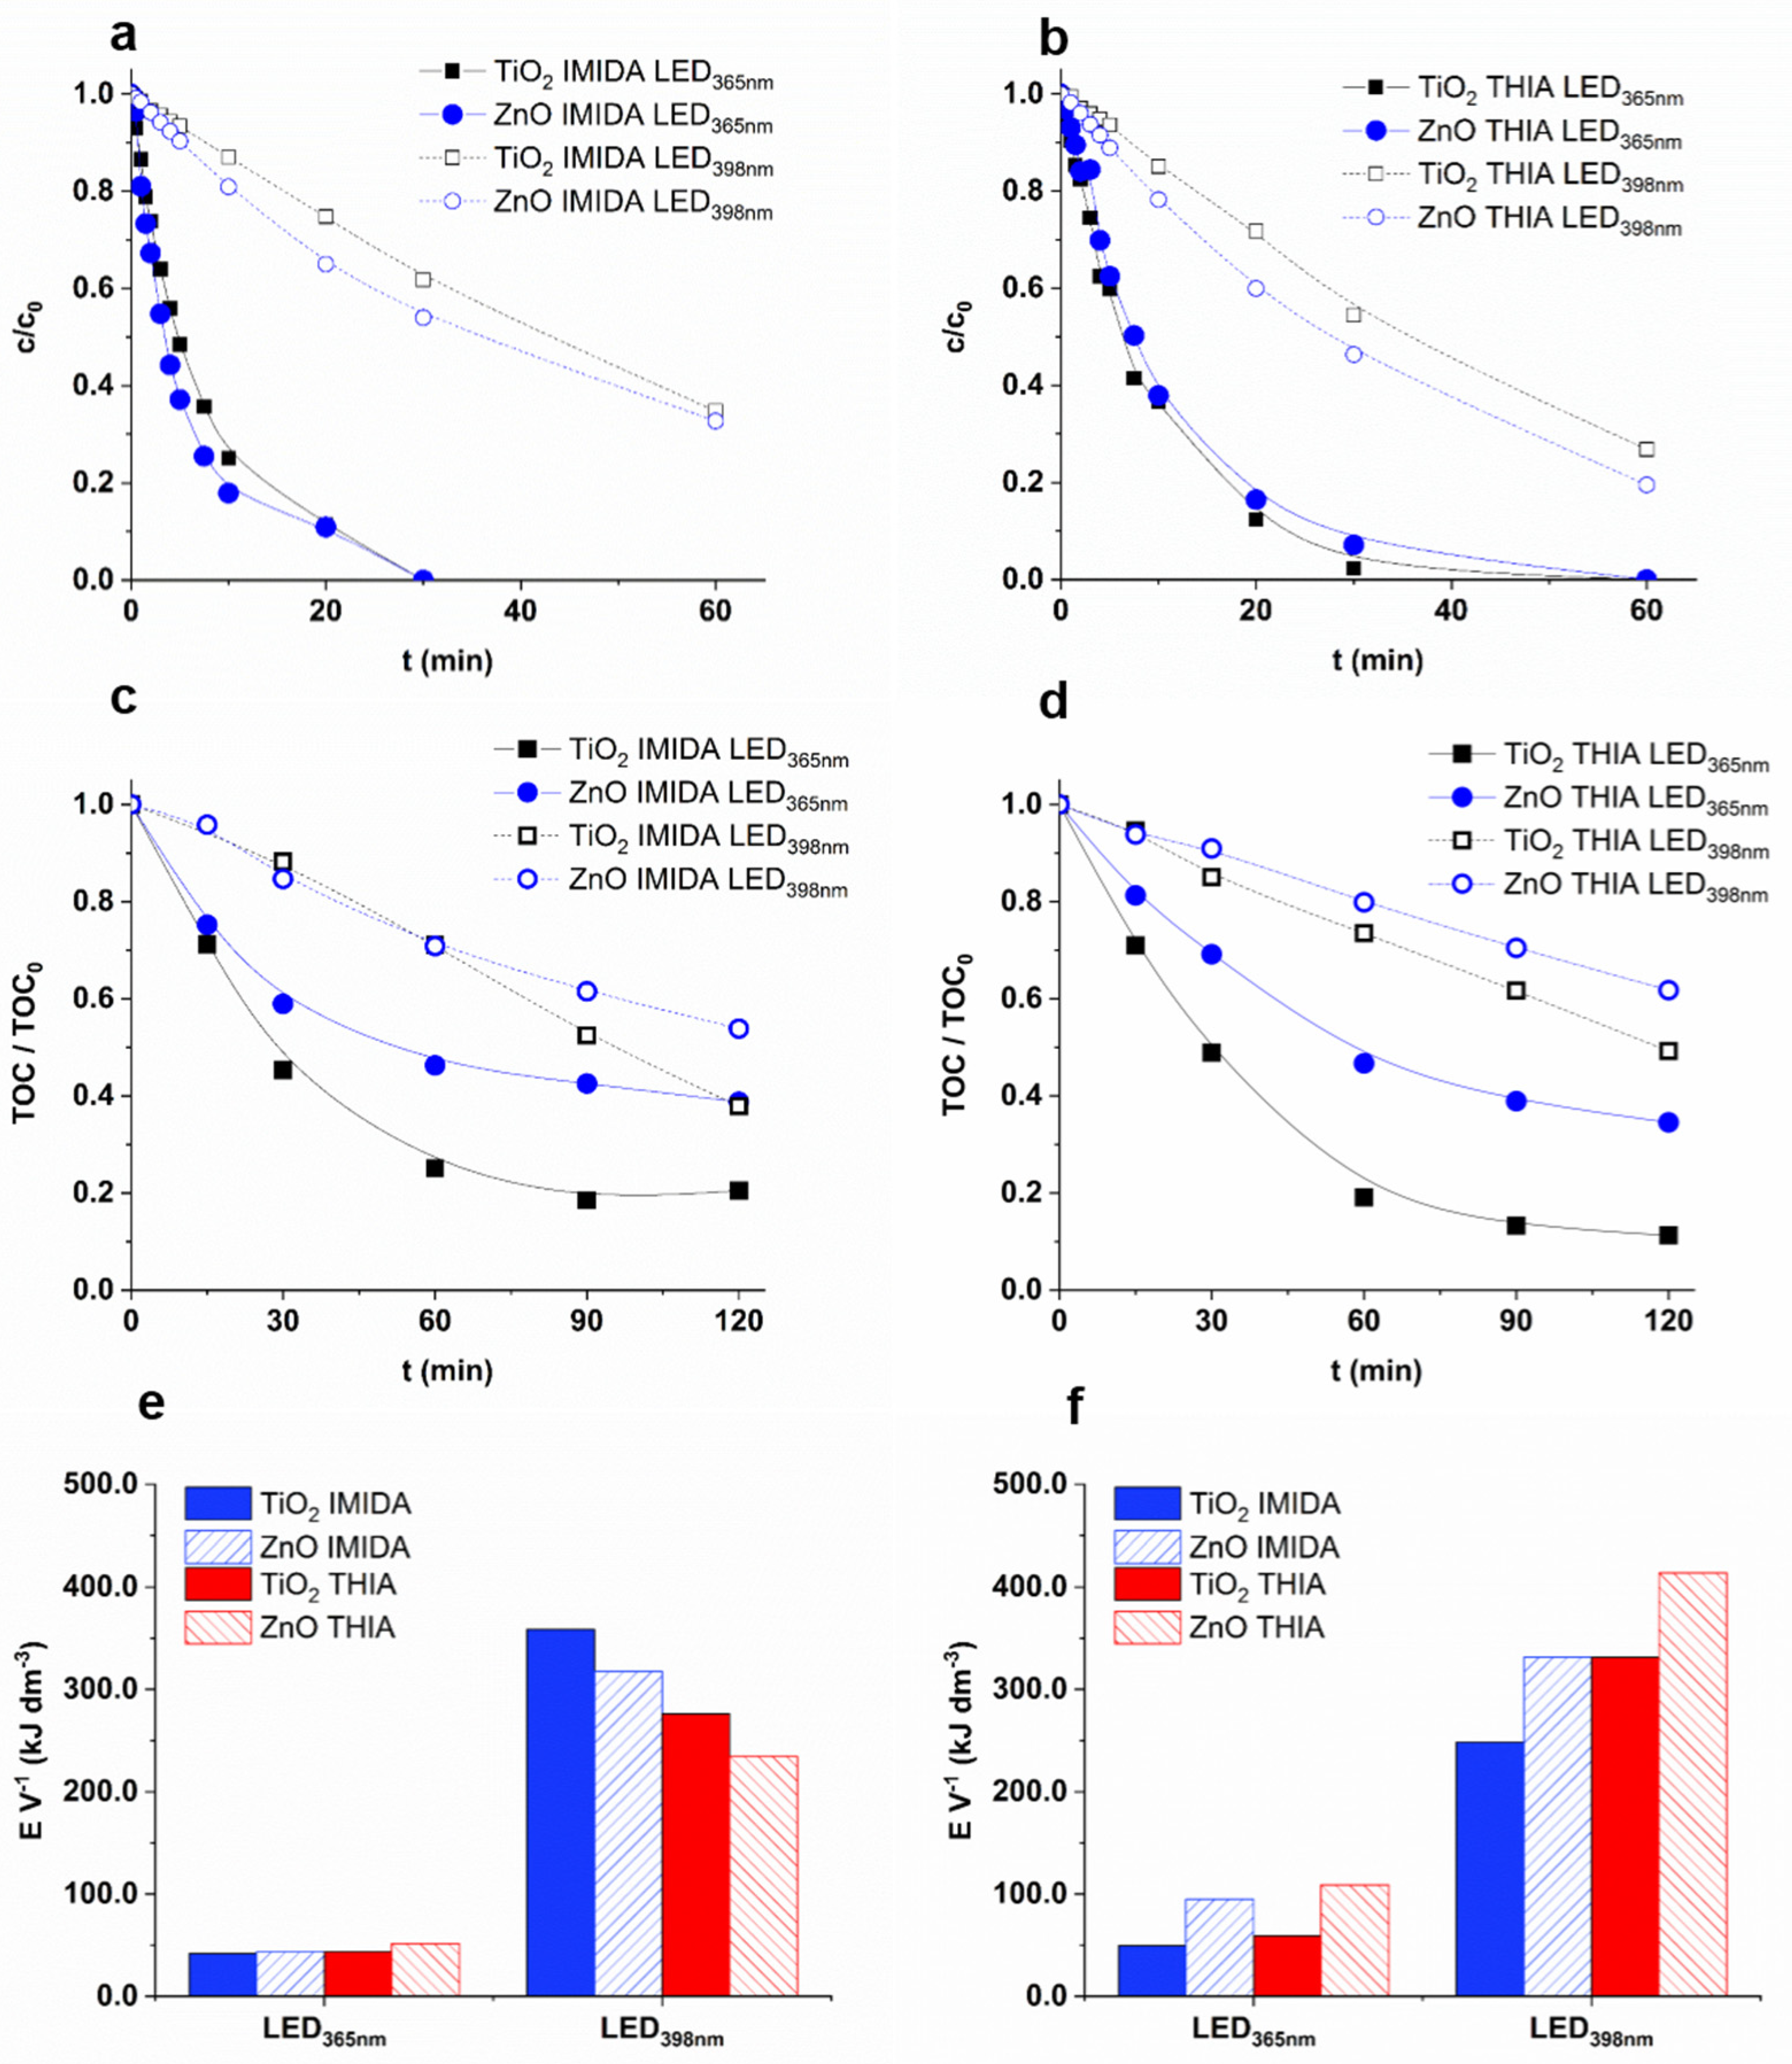
3.4. Removal Efficiency of Neonicotinoids

The photocatalytic removal of two neonicotinoid pesticides, IMIDA and THIA, with severe environmental impact was also investigated. As expected, the LED365nm was much more effective; nearly complete removal (>90%) was achieved within 30 min for both pesticides while using LED398nm this time increased to 90–120 min (Figure 5a,b). A slightly higher transformation rate was observed for ZnO than TiO2 using LED398nm (Figure 5a,b). The apparent quantum efficiency of LED398nm (5.3–7.9 × 10⁻⁴) was only 10–20% of the values determined for LED365nm (4.8–8.5 × 10⁻³), with a good agreement of the number of absorbed photons, estimated from the absorption of the catalysts and the emission spectra of the LEDs (Figure 1).
The main goal of AOPs is generally the complete removal of harmful organic compounds and their degradation products. While in the case of COU, there was no difference between the efficiency of the two catalysts using LED365nm, faster mineralization of both neonicotinoids was observed for TiO2 than for ZnO (Figure 5c,d). Using LED365nm, 10–20% of TOC could not be removed even after 120 min, which indicates the formation of degradation products resistant to photocatalytic treatment. These products most likely formed in more significant amounts in the case of ZnO, when more than 40% of TOC remained in the suspension after 60 min and decreased very slowly during further treatment. The observed difference can be interpreted by the higher OH formation rate for TiO2 and probably by the higher contribution of the direct charge transfer to the transformation of neonicotinoids and their intermediates for ZnO. In addition, opposite to the neonicotinoids, TOC decreased linearly during the whole treatment of COU (Figure 4 and Figure 5c,d).
Since one of the main arguments in favor of LEDs is their better consumption of electric power, the energy required to treat a unit volume of IMIDA and THIA suspension was compared. In the case of LED398nm (4.68 W), the energy needed to reduce the concentration by 90% [94] was 5–6 times higher for THIA, and 7–9 times higher for IMIDA than in the case of LED365nm (6.56 W) (Figure 5e). Comparing the electrical energy required to eliminate the 50% of TOC content, the difference between the two LEDs was moderate; for ZnO about four times higher, and TiO2 about five times higher energy was needed (Figure 5f). Despite the higher power usage and slightly lower electrical efficiency (Table 1 and Table S3), the higher energy of the emitted photons made the LED365nm economically more favorable due to the better optical properties of both photocatalysts at 365 nm than at 398 nm.
For IMIDA, four degradation products were identified (Figure 6); IM/1 (m/z = 230.0) resulted by the opening of imidazolidine ring [95], while the attack of the OH to the imidazolidine and –CH2– moiety led to the formation of IM/2 (m/z = 272.1), IM/4 (m/z = 270.1), and IM/3 (m/z = 288.0). The products distribution differed for TiO2 and ZnO; IM/1 and IM/2 formed significantly faster using ZnO (Figure S5), confirming a different relative contribution of OH based reactions and direct charge transfer to IMIDA transformation for TiO2 and ZnO. For THIA, the hydroxylation of the thiazolidine ring and –CH2– moiety led to the formation of T3 (m/z = 269.1) and T/4 (m/z = 269.1) (Figure 6). Their further transformation resulted in carbonylated T/2 (m/z = 267.0) and hydroxylated T/5 (m/z = 285.1) products. In the case of THIA, the product distribution was similar for both photocatalysts (Figure S6).
The mineralization results in inorganic ions depend on the chemical structure of the pollutants [96]. The dechlorination was complete with both photocatalysts after 60 min using LED365nm and reached 90% using LED398nm after 120 min (Figure 7a). The S-content was converted to SO42−, and its accumulation was much slower than that of Cl, as it required the ring-opening process of the thiazolidine ring. Less than 50% of S-content was converted to SO42− after 60 min and reached 74% at 120 min treatment using LED365nm. This value only reached 20–30% using LED398nm (Figure 7b), following the slower TOC removal.
The fate of organic N-content depends on the oxidation state of the N atom in the molecule, on its chemical environment, and the reaction parameters [96,97]. N-containing moiety can transform into NO3, NH4+ and N2 as final products. Toxic NO2 may also form but is usually oxidized to NO3 by OH (k•OH + NO2− = 6.0 × 10⁻⁹ M−1 s−1 [98]), while oxidizing NH4+ to NO3 is very slow. The conversion of N-content of THIA to NH4+ (24%) exceeded that determined for IMIDA (14%), and TiO2 resulted in significantly higher concentrations of NH4+ compared to ZnO (Figure 7c). IMIDA produces significantly higher NO3 concentrations than THIA, as the –NO2 group is likely to be easily converted to NO3 (Figure 7d). The NO2 concentration is negligible for TiO2, but 5–8% and 3–4% of the total N-content can be detected as NO2 during the transformation of IMIDA and THIA, respectively, when ZnO was used (Figure 7e). Park et al. reported the reduction of NO3 on ZnO, which does not occur on TiO2 [99]. This can explain the presence of NO2 but also points out that it can be a disadvantage in removing N-containing organic impurities with ZnO. The NO2 is hazardous to the environment and human health, even in low concentrations (1–3 mg dm−3).

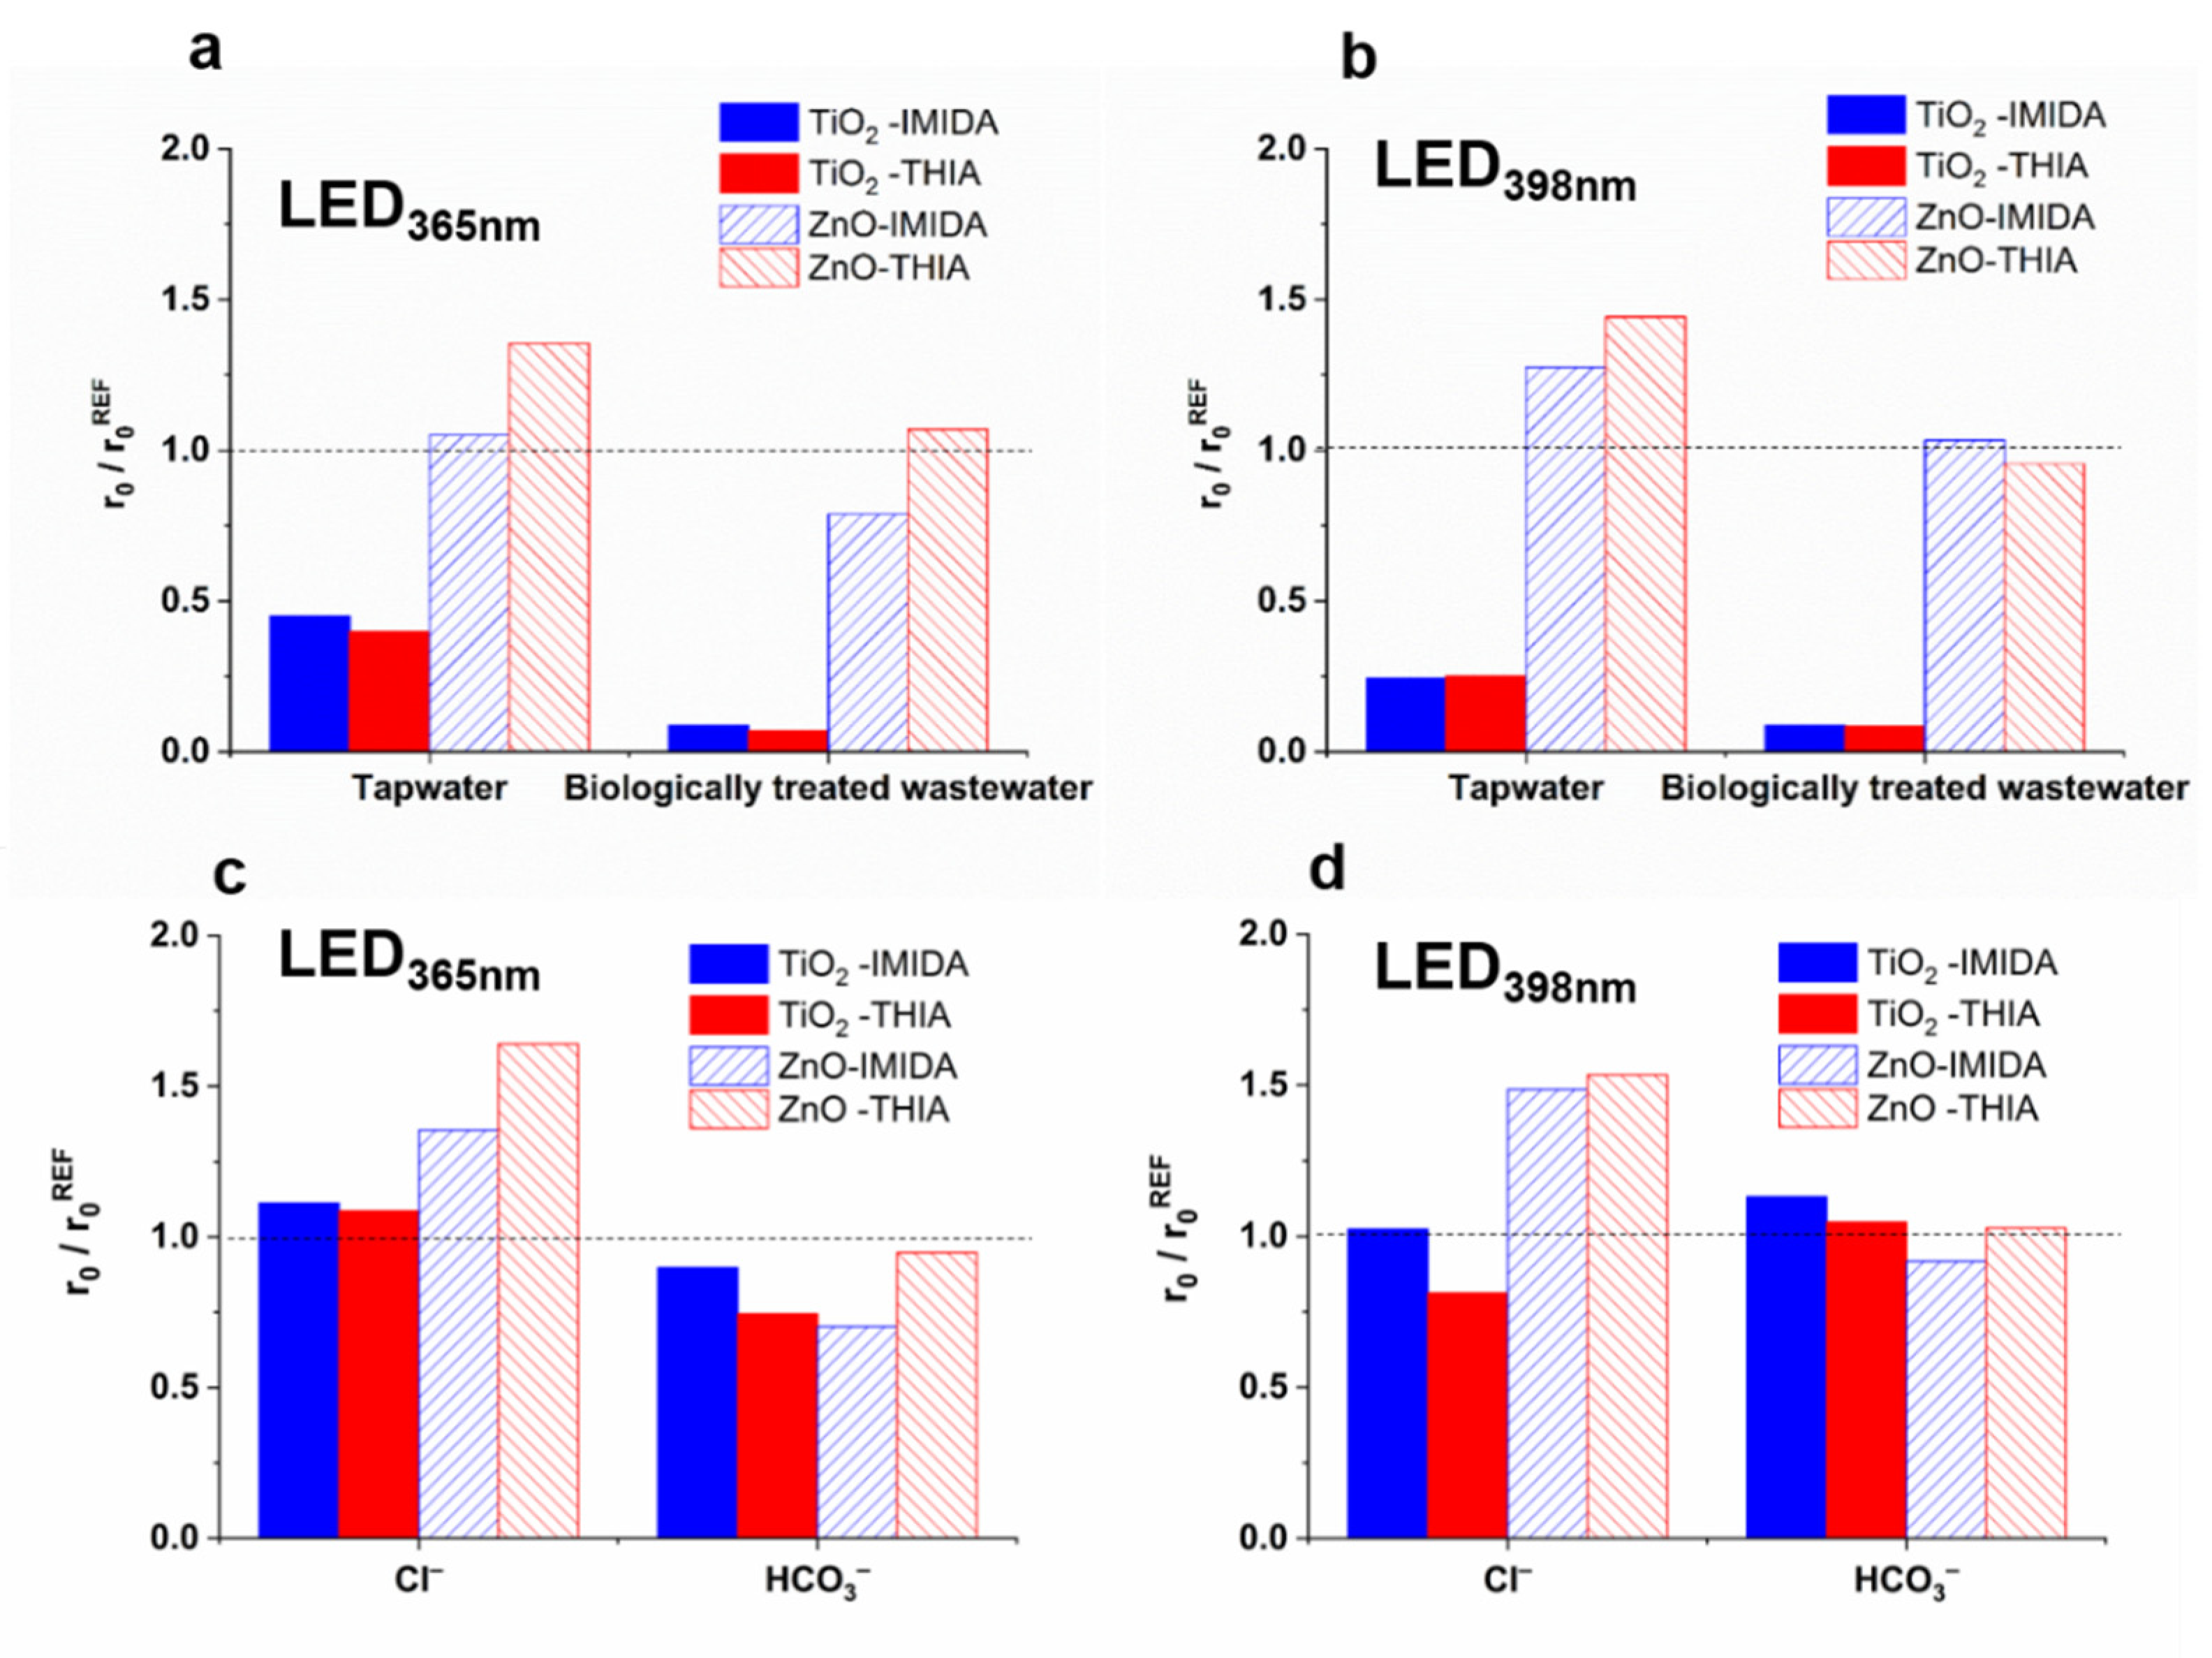
3.5. Effect of Matrices on the Removal of IMIDA and THIA

For TiO2, the transformation rates of both IMIDA and THIA were significantly reduced in real matrices using both light sources, while for ZnO, the matrices did not affect the removal rates or even increase them (Figure 8a,b). Cl had no effect in the case of TiO2, but enhanced the transformation rate significantly when ZnO was used (Figure 8c,d). In the case of COU transformation, the positive effect on r07-HC was explained by the enhanced charge separation or the formation of reactive Cl-containing species, but the unchanged COU mineralization rate did not confirm the enhanced OH production. In the case of neonicotinoids, the positive effect can be explained by the direct reaction of neonicotinoids with formed reactive chlorine species, as Yin et al. [100] reported a significant reactivity of IMIDA and THIA towards various reactive chlorine species. However, the effect of HCO3 is remarkably different for COU and neonicotinoids: HCO3 inhibited the COU transformation (Figure 3c,d), but it had no significant effect on the transformation rates of IMIDA and THIA (Figure 8c,d), even in the case of TiO2.
To gain a deeper understanding, we examined the effect of inorganic ions on the formation of intermediates, and significant differences were observed, despite the minor effect on the removal rates. In the case of IMIDA, the Cl significantly increased the formation rate of the hydroxylated product (IM/3) using both photocatalysts (Figure S5), while HCO3 increased the formation of IM/1 and IM/2 products. Dell’Arciprete et al. studied the reactions of IMIDA with CO3•− and presented hydroxylated products and products formed via the opening of the imidazolidine ring [92]. For THIA, Cl had no effect, but HCO3 inhibited the formation of T/2 and T/4 (Figure S6). It should be mentioned that CO3•− reacts significantly more slowly with neonicotinoids (kIMIDA + CO3•− = 4.0 × 10⁶ M−1 s−1; kTHIA+ CO3•− = 2.8 × 10⁵ M−1 s−1 [92]) than OH (kIMIDA+•OH = 7.0 × 10⁹ M−1 s−1; kTHIA+•OH = 4.8 × 10⁹ M−1 s−1 [101,102]), but due to the longer lifetime and selectivity, CO3•− may be present at higher concentration, and in the case of TiO2 it can contribute significantly to the transformation [103].
The potential of the valence band of TiO2 and ZnO creates the possibility of highly reactive radical formation due to the reaction with hVB+. The effect of inorganic ions is complex during heterogeneous photocatalysis and often depends on pH via acid–base equilibrium processes. Ions adsorbed on the surface can change the surface charge and potential of valance and conduction band edge [104]. Moreover, they can react directly with the photogenerated charges—which means a competition for their reaction with H2O/HO resulting in OH. The selectivity and reactivity of the formed radicals or radical ions are different. The electrode potential of the inorganic radical ions is a powerful indicator of their reactivity; thus, it is worth comparing their standard potentials [105] (Table S4). Comparing these values, we can state that the CO3•− forms easily, while competition can occur between the formation of OH and Cl, which is influenced by pH. Because of the complexity of the processes, the correct interpretation of the effect of various inorganic ions on the radical set requires further investigations, even in the case of TiO2 and ZnO suspensions.

3.6. Ecotoxicity Change

The toxicity change was investigated during photocatalytic treatment using Vibrio fischeri as a test organism (Figure 9). The toxicity of THIA solution (44% inhibition) was significantly higher than IMIDA (20–25% inhibition). Using LED365nm, the toxicity of THIA quickly reduced; after 90% TOC removal, no inhibition of bioluminescence was detected. For IMIDA, the toxicity slightly increased during the first 30 min, then slowly decreased, but remained significant even after 80% reduction of TOC (Figure 5a,c). Using LED398nm, the toxicity changed more slowly, as expected based on the less effective transformation and mineralization rates (Figure 5b,d); however, the trends were similar to those observed for LED365nm. During the transformation of IMIDA, toxic products form [106], despite the 90% removal of TOC. The significant difference between the conversions of these neonicotinoids is the formation of NO3, which is characteristic only of IMIDA. The formation of nitro products during the treatment of N-containing organic contaminants is generally a consequence of the reaction with reactive nitrogen species formed from NO2 or NO3. The nitro-derivatives are often more toxic compounds than the primary pollutants, which could be the reason for increased toxicity in IMIDA transformation.
Although ZnO is less effective in removing TOC than TiO2 at 365 nm irradiation (Figure 5), there is no significant difference in the time dependence of the toxicity change, especially for THIA (Figure 9). It is worth mentioning that while in the case of LED365nm the toxicity of the THIA solution disappears after 90 min, in the case of LED398nm the toxicity just slightly decreases and practically does not change after 60 min treatment, opposite that during 120 min treatment almost 50% of TOC eliminated (Figure 5).

4. Conclusions

During the last decades, the intensive development of LED technology, especially high-intensity LEDs, created an opportunity to replace traditional UV light sources in water treatment processes. In this work, we compared the efficiency of a high-power LED365nm and a commercial, low-cost LED398nm in the case of heterogeneous photocatalysis using TiO2 and ZnO photocatalysts. The comparison was based on the rate of transformation and mineralization of various organic substances, the OH formation rate, the energy consumption, and the matrix effect, with particular attention to the effect of its inorganic components such as Cl and HCO3.
The application of high-power LED365nm was more economical at the lower electrical power and light intensity; the apparent quantum yield decreased with increasing light intensity, while the conversion rate varied according to the saturation curve. Mainly because of the optical properties of the photocatalysts, the transformation of COU was significantly slower for LED398nm than for LED365nm, but the yield of 7-HC (r07HC/r0COU) was significantly higher when LED398nm was applied. The mineralization rate of COU was the same for both catalysts at 365 nm irradiation but differed significantly at 398 nm irradiation.
The impact of matrices Cl and HCO3 was completely different for ZnO and TiO2. For ZnO, the Cl significantly increased the formation rate of r07-HC, but no change of r0COU was observed. The negative effect of HCO3 as radical scavenger and hole trapping species was evident for both catalysts; however, in the case of TiO2, the formation of CO3•− is almost double the 7-HC formation rate. The inhibitory effect of real matrices was much more significant for TiO2 and cannot be interpreted by the combined effect of these ions even in tap water with low organic matter content. However, for ZnO, the effect of matrices was negligible or even positive.
Two relevant environmental pollutants, IMIDA and THIA, showed similar transformation rates for TiO2 and ZnO, but TiO2 was more favorable in mineralization. In both cases, hardly oxidizable products were formed, but to a significantly greater extent for ZnO, most likely because of the higher contribution of the direct charge transfer to the transformation. The formed CO3•− likely contributes to the conversion of these compounds, especially in the case of TiO2. In the case of IMIDA, the increased toxicity is presumably due to reactions with N-containing reactive species formed from the NO2/NO3.
The better absorption properties of TiO2 and ZnO photocatalysts at 365 nm made the LED365nm economically more favorable than LED398nm. However, the application of these catalysts modified to absorb a higher percentage of the 398 nm photons may greatly increase the efficiency of LED398nm. The significantly lower price, slightly higher electrical efficiency of LED398nm, and relatively good OH generation ability of 398 nm light, may provide an alternative for using LED398nm to eliminate the hazardous organic matter by heterogeneous photocatalysis. Our results showed that the two most commonly used catalysts, TiO2 and ZnO, react differently with the inorganic ions, affecting the efficiency in a complex way in a real matrix. The secondary reactive species formation from inorganic ions and their role and effect depend on the target compound and the photocatalyst. In addition to changing the conversion rate of the starting compound, the analysis of the products formed also provides essential information about the processes taking place.

Supplementary Materials

The following are available online at https://www.mdpi.com/article/10.3390/nano12010005/s1, Figure S1. The schematic figures and photos of the photoreactors (left: LED365nm, right: LED398nm), Figure S2. UV-Vis absorption and emission spectra of COU and 7-HC (a), and the UV-Vis absorption spectra of IMIDA and THIA (b), Table S1. The list of used chemicals, their distributors and purity, Table S2. The parameters of the matrices, Figure S3. The photon flux of the LEDs as a function of electric power input, Table S3. The photon flux of the light sources and the calculated electric efficiencies, Figure S4. The effect of 5.0 × 10⁻³ M MeOH on the transformation rate of COU and the formation rate of 7-HC, Figure S5. The effect of inorganic ions on the products of IMIDA detected by HPLC-DAD during treatment using LED365nm, Figure S6. The effect of inorganic ions on the products of THIA detected by HPLC-DAD during treatment using LED365nm.

Author Contributions

T.A.: Conceptualization, ideas; formulation or evolution of overarching research goals and aims, writing—review and editing; M.N.: visualization, investigation, preparation, creation and/or presentation of the published work, writing the initial draft; G.B. and C.J.: performing the experiments (ion chromatography). All authors have read and agreed to the published version of the manuscript.

Funding

This work was supported by the János Bolyai Research Scholarship of the Hungarian Academy of Sciences, and the New National Excellence Program of the Ministry for Innovation and Technology (ÚNKP-21-4-SZTE-494 and ÚNKP-20-5-SZTE 639). This work was sponsored by the National Research, Development and Innovation Office—NKFI Fund OTKA, project number FK132742.

Institutional Review Board Statement

Not applicable.

Informed Consent Statement

Not applicable.

Data Availability Statement

The data is included in the article or supplementary material.

Conflicts of Interest

The authors declare no conflict of interest.

References

  1. Stefan, M.I. Advanced Oxidation Processes for Water Treatment-Fundamentals and Applications; IWA Publishing: London, UK, 2017; Volume 16, ISBN 9781780407180. [Google Scholar]
  2. Schneider, J.; Matsuoka, M.; Takeuchi, M.; Zhang, J.; Horiuchi, Y.; Anpo, M.; Bahnemann, D.W. Understanding TiO2 Photocatalysis: Mechanisms and Materials. Chem. Rev. 2014, 114, 9919–9986. [Google Scholar] [CrossRef]
  3. Colinge, J.P.; Colinge, C.A. Physics of Semiconductor Devices; Kluwer Academic Publishers-Springer International Publishing: Berlin/Heidelberg, Germany, 2002; ISBN 1-40207-018-7. [Google Scholar]
  4. Gaya, U.I. Heterogeneous Photocatalysis Using Inorganic Semiconductor Solids; Springer: Berlin, Germany, 2014; Volume 9789400777, ISBN 9789400777750. [Google Scholar]
  5. Nosaka, Y.; Nosaka, A.Y. Generation and Detection of Reactive Oxygen Species in Photocatalysis. Chem. Rev. 2017, 117, 11302–11336. [Google Scholar] [CrossRef] [PubMed]
  6. Ibhadon, A.O.; Fitzpatrick, P. Heterogeneous Photocatalysis: Recent Advances and Applications. Catalysts 2013, 3, 189–218. [Google Scholar] [CrossRef] [Green Version]
  7. Srikant, V.; Clarke, D.R. On the Optical Band Gap of Zinc Oxide. J. Appl. Phys. 1998, 83, 5447–5451. [Google Scholar] [CrossRef]
  8. Ahmed, S.N.; Haider, W. Heterogeneous Photocatalysis and Its Potential Applications in Water and Wastewater Treatment: A Review. Nanotechnology 2018, 29, 342001. [Google Scholar] [CrossRef] [Green Version]
  9. Baxter, J.B.; Schmuttenmaer, C.A. Conductivity of ZnO Nanowires, Nanoparticles, and Thin Films Using Time-Resolved Terahertz Spectroscopy. J. Phys. Chem. B 2006, 110, 25229–25239. [Google Scholar] [CrossRef]
  10. Meulenkamp, E.A. Electron Transport in Nanoparticulate ZnO Films. J. Phys. Chem. B 1999, 103, 7831–7838. [Google Scholar] [CrossRef]
  11. Lee, K.M.; Lai, C.W.; Ngai, K.S.; Juan, J.C. Recent Developments of Zinc Oxide Based Photocatalyst in Water Treatment Technology: A Review. Water Res. 2016, 88, 428–448. [Google Scholar] [CrossRef]
  12. Yusoff, N.A.; Ho, L.N.; Ong, S.A.; Wong, Y.S.; Khalik, W.F. Photocatalytic Activity of Zinc Oxide (ZnO) Synthesized through Different Methods. Desalin. Water Treat. 2016, 57, 12496–12507. [Google Scholar] [CrossRef]
  13. Kumar, S.G.; Rao, K.S.R.K. Zinc Oxide Based Photocatalysis: Tailoring Surface-Bulk Structure and Related Interfacial Charge Carrier Dynamics for Better Environmental Applications. RSC Adv. 2015, 5, 3306–3351. [Google Scholar] [CrossRef]
  14. Spathis, P.; Poulios, I. The Corrosion and Photocorrosion of Zinc and Zinc Oxide Coatings. Corros. Sci. 1995, 37, 673–680. [Google Scholar] [CrossRef]
  15. Kositzi, M.; Poulios, I.; Samara, K.; Tsatsaroni, E.; Darakas, E. Photocatalytic Oxidation of Cibacron Yellow LS-R. J. Hazard. Mater. 2007, 146, 680–685. [Google Scholar] [CrossRef] [PubMed]
  16. Tokode, O.; Prabhu, R.; Lawton, L.A.; Robertson, P.K.J. UV LED Sources for Heterogeneous Photocatalysis. Handb. Environ. Chem. 2015, 35, 159–179. [Google Scholar] [CrossRef] [Green Version]
  17. Bloh, J.Z. Intensification of Heterogeneous Photocatalytic Reactions Without Efficiency Losses: The Importance of Surface Catalysis. Catal. Lett. 2021, 151, 3105–3113. [Google Scholar] [CrossRef]
  18. Kuipers, J.; Bruning, H.; Yntema, D.; Rijnaarts, H. Wirelessly Powered Ultraviolet Light Emitting Diodes for Photocatalytic Oxidation. J. Photochem. Photobiol. A Chem. 2015, 299, 25–30. [Google Scholar] [CrossRef]
  19. Bertagna Silva, D.; Buttiglieri, G.; Babić, S. State-of-the-Art and Current Challenges for TiO2/UV-LED Photocatalytic Degradation of Emerging Organic Micropollutants. Environ. Sci. Pollut. Res. 2021, 28, 103–120. [Google Scholar] [CrossRef] [PubMed]
  20. Sergejevs, A.; Clarke, C.T.; Allsopp, D.W.E.; Marugan, J.; Jaroenworaluck, A.; Singhapong, W.; Manpetch, P.; Timmers, R.; Casado, C.; Bowen, C.R. A Calibrated UV-LED Based Light Source for Water Purification and Characterisation of Photocatalysis. Photochem. Photobiol. Sci. 2017, 16, 1690–1699. [Google Scholar] [CrossRef]
  21. Eskandarian, M.R.; Choi, H.; Fazli, M.; Rasoulifard, M.H. Effect of UV-LED Wavelengths on Direct Photolytic and TiO2 Photocatalytic Degradation of Emerging Contaminants in Water. Chem. Eng. J. 2016, 300, 414–422. [Google Scholar] [CrossRef]
  22. Khademalrasool, M.; Farbod, M.; Talebzadeh, M.D. The Improvement of Photocatalytic Processes: Design of a Photoreactor Using High-Power LEDs. J. Sci. Adv. Mater. Devices 2016, 1, 382–387. [Google Scholar] [CrossRef] [Green Version]
  23. Natarajan, K.; Natarajan, T.S.; Bajaj, H.C.; Tayade, R.J. Photocatalytic Reactor Based on UV-LED/TiO2 Coated Quartz Tube for Degradation of Dyes. Chem. Eng. J. 2011, 178, 40–49. [Google Scholar] [CrossRef]
  24. Tapia-Tlatelpa, T.; Buscio, V.; Trull, J.; Sala, V. Performance Analysis and Methodology for Replacing Conventional Lamps by Optimized LED Arrays for Photocatalytic Processes. Chem. Eng. Res. Des. 2020, 156, 456–468. [Google Scholar] [CrossRef]
  25. Ahmed, S.; Rasul, M.G.; Brown, R.; Hashib, M.A. Influence of Parameters on the Heterogeneous Photocatalytic Degradation of Pesticides and Phenolic Contaminants in Wastewater: A Short Review. J. Environ. Manag. 2011, 92, 311–330. [Google Scholar] [CrossRef] [Green Version]
  26. Al-Sayyed, G.; D’Oliveira, J.C.; Pichat, P. Semiconductor-Sensitized Photodegradation of 4-Chlorophenol in Water. J. Photochem. Photobiol. A Chem. 1991, 58, 99–114. [Google Scholar] [CrossRef]
  27. Ollis, D.F. Solar-Assisted Photocatalysis for Water Purification: Issues, Data, Questions. In Photochemical Conversion and Storage of Solar Energy; Pelizzetti, E., Schiavello, M., Eds.; Springer: Dordrecht, The Netherlands, 1991. [Google Scholar] [CrossRef]
  28. Herrmann, J.M. Heterogeneous Photocatalysis: Fundamentals and Applications to the Removal of Various Types of Aqueous Pollutants. Catal. Today 1999, 53, 115–129. [Google Scholar] [CrossRef]
  29. Ohtani, B. Titania Photocatalysis beyond Recombination: A Critical Review. Catalysts 2013, 3, 942–953. [Google Scholar] [CrossRef] [Green Version]
  30. Nosaka, Y.; Nosaka, A.Y. Langmuir-Hinshelwood and Light-Intensity Dependence Analyses of Photocatalytic Oxidation Rates by Two-Dimensional-Ladder Kinetic Simulation. J. Phys. Chem. C 2018, 122, 28748–28756. [Google Scholar] [CrossRef]
  31. Torimoto, T.; Aburakawa, Y.; Kawahara, Y.; Ikeda, S.; Ohtani, B. Light Intensity Dependence of the Action Spectra of Photocatalytic Reactions with Anatase Titanium(IV) Oxide. Chem. Phys. Lett. 2004, 392, 220–224. [Google Scholar] [CrossRef] [Green Version]
  32. Wong, C.C.; Chu, W. The Direct Photolysis and Photocatalytic Degradation of Alachlor at Different TiO2 and UV Sources. Chemosphere 2003, 50, 981–987. [Google Scholar] [CrossRef]
  33. Zhu, X.; Yuan, C.; Bao, Y.; Yang, J.; Wu, Y. Photocatalytic Degradation of Pesticide Pyridaben on TiO2 Particles. J. Mol. Catal. A Chem. 2005, 229, 95–105. [Google Scholar] [CrossRef]
  34. McMurray, T.A.; Dunlop, P.S.M.; Byrne, J.A. The Photocatalytic Degradation of Atrazine on Nanoparticulate TiO2 Films. J. Photochem. Photobiol. A Chem. 2006, 182, 43–51. [Google Scholar] [CrossRef]
  35. Tao, Y.; Cheng, Z.; Ting, K.E.; Yin, X.J. Studies of Photocatalytic Kinetics on the Degradation of Bisphenol A (BPA) by Immobilized ZnO Nanoparticles in Aerated Photoreactors. J. Environ. Sci. Eng. A 2012, 1, 187–194. [Google Scholar]
  36. Bouanimba, N.; Laid, N.; Zouaghi, R.; Sehili, T. A Comparative Study of the Activity of TiO2 Degussa P25 and Millennium PCs in the Photocatalytic Degradation of Bromothymol Blue. Int. J. Chem. React. Eng. 2018, 16, 1–19. [Google Scholar] [CrossRef]
  37. Šojić Merkulov, D.V.; Lazarević, M.J.; Despotović, V.N.; Banić, N.D.; Finčur, N.L.; Maletić, S.P.; Abramović, B.F. The Effects of Inorganic Anions and Organic Matter on Mesotrione (Callisto®) Removal from Environmental Waters. J. Serb. Chem. Soc. 2017, 82, 343–355. [Google Scholar] [CrossRef]
  38. Farner Budarz, J.; Turolla, A.; Piasecki, A.F.; Bottero, J.Y.; Antonelli, M.; Wiesner, M.R. Influence of Aqueous Inorganic Anions on the Reactivity of Nanoparticles in TiO2 Photocatalysis. Langmuir 2017, 33, 2770–2779. [Google Scholar] [CrossRef]
  39. Lair, A.; Ferronato, C.; Chovelon, J.M.; Herrmann, J.M. Naphthalene Degradation in Water by Heterogeneous Photocatalysis: An Investigation of the Influence of Inorganic Anions. J. Photochem. Photobiol. A Chem. 2008, 193, 193–203. [Google Scholar] [CrossRef]
  40. Kaabeche, O.N.E.H.; Zouaghi, R.; Boukhedoua, S.; Bendjabeur, S.; Sehili, T. A Comparative Study on Photocatalytic Degradation of Pyridinium-Based Ionic Liquid by TiO2 and ZnO in Aqueous Solution. Int. J. Chem. React. Eng. 2019, 17, 1–14. [Google Scholar] [CrossRef]
  41. Lado Ribeiro, A.R.; Moreira, N.F.F.; Li Puma, G.; Silva, A.M.T. Impact of Water Matrix on the Removal of Micropollutants by Advanced Oxidation Technologies. Chem. Eng. J. 2019, 363, 155–173. [Google Scholar] [CrossRef] [Green Version]
  42. Tufail, A.; Price, W.E.; Mohseni, M.; Pramanik, B.K.; Hai, F.I. A Critical Review of Advanced Oxidation Processes for Emerging Trace Organic Contaminant Degradation: Mechanisms, Factors, Degradation Products, and Effluent Toxicity. J. Water Process. Eng. 2021, 40, 101778. [Google Scholar] [CrossRef]
  43. Zhang, J.; Nosaka, Y. Generation of OH Radicals and Oxidation Mechanism in Photocatalysis of WO3 and BiVO4 Powders. J. Photochem. Photobiol. A Chem. 2015, 303–304, 53–58. [Google Scholar] [CrossRef]
  44. Zhang, J.; Nosaka, Y. Quantitative Detection of OH Radicals for Investigating the Reaction Mechanism of Various Visible-Light TiO2 Photocatalysts in Aqueous Suspension. J. Phys. Chem. C 2013, 117, 1383–1391. [Google Scholar] [CrossRef]
  45. Ishibashi, K.I.; Fujishima, A.; Watanabe, T.; Hashimoto, K. Detection of Active Oxidative Species in TiO2 Photocatalysis Using the Fluorescence Technique. Electrochem. Commun. 2000, 2, 207–210. [Google Scholar] [CrossRef]
  46. Nagarajan, S.; Skillen, N.C.; Fina, F.; Zhang, G.; Randorn, C.; Lawton, L.A.; Irvine, J.T.S.; Robertson, P.K.J. Comparative Assessment of Visible Light and UV Active Photocatalysts by Hydroxyl Radical Quantification. J. Photochem. Photobiol. A Chem. 2017, 334, 13–19. [Google Scholar] [CrossRef] [Green Version]
  47. Černigoj, U.; Štangar, U.L.; Trebše, P.; Sarakha, M. Determination of Catalytic Properties of TiO2 Coatings Using Aqueous Solution of Coumarin: Standardization Efforts. J. Photochem. Photobiol. A Chem. 2009, 201, 142–150. [Google Scholar] [CrossRef]
  48. Kakuma, Y.; Nosaka, A.Y.; Nosaka, Y. Difference in TiO2 Photocatalytic Mechanism between Rutile and Anatase Studied by the Detection of Active Oxygen and Surface Species in Water. Phys. Chem. Chem. Phys. 2015, 17, 18691–18698. [Google Scholar] [CrossRef]
  49. Nosaka, Y.; Nosaka, A.Y. Comment on “Coumarin as a Quantitative Probe for Hydroxyl Radical Formation in Heterogeneous Photocatalysis”. J. Phys. Chem. C 2019, 123, 20682–20684. [Google Scholar] [CrossRef] [Green Version]
  50. Czili, H.; Horváth, A. Applicability of Coumarin for Detecting and Measuring Hydroxyl Radicals Generated by Photoexcitation of TiO2 Nanoparticles. Appl. Catal. B Environ. 2008, 81, 295–302. [Google Scholar] [CrossRef]
  51. Wafi, A.; Szabó-Bárdos, E.; Horváth, O.; Makó, É.; Jakab, M.; Zsirka, B. Coumarin-Based Quantification of Hydroxyl Radicals and Other Reactive Species Generated on Excited Nitrogen-Doped TiO2. J. Photochem. Photobiol. A Chem. 2021, 404. [Google Scholar] [CrossRef]
  52. Wood, T.J.; Goulson, D. The Environmental Risks of Neonicotinoid Pesticides: A Review of the Evidence Post 2013. Environ. Sci. Pollut. Res. 2017, 24, 17285–17325. [Google Scholar] [CrossRef]
  53. Arce, A.N.; Rodrigues, A.R.; Yu, J.; Colgan, T.J.; Wurm, Y.; Gill, R.J. Foraging Bumblebees Acquire a Preference for Neonicotinoid-Treated Food with Prolonged Exposure. Proc. R. Soc. B Biol. Sci. 2018, 285, 20180655. [Google Scholar] [CrossRef] [PubMed]
  54. Pisa, L.W.; Amaral-Rogers, V.; Belzunces, L.P.; Bonmatin, J.M.; Downs, C.A.; Goulson, D.; Kreutzweiser, D.P.; Krupke, C.; Liess, M.; Mcfield, M.; et al. Effects of Neonicotinoids and Fipronil on Non-Target Invertebrates. Environ. Sci. Pollut. Res. 2014, 22, 68–102. [Google Scholar] [CrossRef] [Green Version]
  55. Caron-Beaudoin, E.; Viau, R.; Hudon-Thibeault, A.A.; Vaillancourt, C.; Sanderson, J.T. The Use of a Unique Co-Culture Model of Fetoplacental Steroidogenesis as a Screening Tool for Endocrine Disruptors: The Effects of Neonicotinoids on Aromatase Activity and Hormone Production. Toxicol. Appl. Pharmacol. 2017, 332, 15–24. [Google Scholar] [CrossRef] [PubMed]
  56. European Commission. Commission Implementing Regulation (EU) 2017/1925 of 12 October 2017 amending Annex I to Council Regulation (EEC) No 2658/87 on the tariff and statistical nomenclature and on the Common Customs Tariff. Off. J. Eur. Union 2018, 282, 1–958. [Google Scholar]
  57. Berberidou, C.; Kitsiou, V.; Lambropoulou, D.A.; Michailidou, D.; Kouras, A.; Poulios, I. Decomposition and Detoxification of the Insecticide Thiacloprid by TiO2-Mediated Photocatalysis: Kinetics, Intermediate Products and Transformation Pathways. J. Chem. Technol. Biotechnol. 2019, 94, 2475–2486. [Google Scholar] [CrossRef]
  58. Akbari Shorgoli, A.; Shokri, M. Photocatalytic Degradation of Imidacloprid Pesticide in Aqueous Solution by TiO2 Nanoparticles Immobilized on the Glass Plate. Chem. Eng. Commun. 2017, 204, 1061–1069. [Google Scholar] [CrossRef]
  59. Yari, K.; Seidmohammadi, A.; Khazaei, M.; Bhatnagar, A.; Leili, M. A Comparative Study for the Removal of Imidacloprid Insecticide from Water by Chemical-Less UVC, UVC/TiO2 and UVC/ZnO Processes. J. Environ. Heal. Sci. Eng. 2019, 17, 337–351. [Google Scholar] [CrossRef]
  60. Abramović, B.F.; Banić, N.D.; Krstić, J.B. Degradation of Thiacloprid by ZnO in a Laminar Falling Film Slurry Photocatalytic Reactor. Ind. Eng. Chem. Res. 2013, 52, 5040–5047. [Google Scholar] [CrossRef]
  61. Murillo-Acevedo, Y.; Bernal-Sanchez, J.; Giraldo, L.; Sierra-Ramirez, R.; Moreno-Piraján, J.C. Initial Approximation to the Design and Construction of a Photocatalysis Reactor for Phenol Degradation with TiO2 Nanoparticles. ACS Omega 2019, 4, 19605–19613. [Google Scholar] [CrossRef] [Green Version]
  62. Braslavsky, S.E. IUPAC Glossary of Terms Used in Photochemistry, 3rd Edition. Pure Appl. Chem. 2007, 79, 293–465. [Google Scholar] [CrossRef]
  63. Hatchard, C.G.; Parker, C.A. A New Sensitive Chemical Actinometer-II. Potassium Ferrioxalate as a Standard Chemical Actinometer. Proc. R. Soc. London. Ser. A. Math. Phys. Sci. 1956, 235, 518–536. [Google Scholar] [CrossRef]
  64. Goldstein, S.; Rabani, J. The Ferrioxalate and Iodide-Iodate Actinometers in the UV Region. J. Photochem. Photobiol. A Chem. 2008, 193, 50–55. [Google Scholar] [CrossRef]
  65. Bolton, J.R.; Stefan, M.I.; Shaw, P.S.; Lykke, K.R. Determination of the Quantum Yields of the Potassium Ferrioxalate and Potassium Iodide-Iodate Actinometers and a Method for the Calibration of Radiometer Detectors. J. Photochem. Photobiol. A Chem. 2011, 222, 166–169. [Google Scholar] [CrossRef]
  66. Kuhn, H.J.; Braslavsky, S.E.; Schmidt, R. ORGANIC AND BIOMOLECULAR CHEMISTRY DIVISION * ( IUPAC Technical Report ) Chemical Actinometry (IUPAC Technical Report). Pure Appl. Chem. 2004, 76, 2105–2146. [Google Scholar] [CrossRef]
  67. Lehóczki, T.; Józsa, É.; Osz, K. Ferrioxalate Actinometry with Online Spectrophotometric Detection. J. Photochem. Photobiol. A Chem. 2013, 251, 63–68. [Google Scholar] [CrossRef]
  68. Aillet, T.; Loubiere, K.; Dechy-Cabaret, O.; Prat, L. Accurate Measurement of the Photon Flux Received inside Two Continuous Flow Microphotoreactors by Actinometry. Int. J. Chem. React. Eng. 2014, 12, 257–269. [Google Scholar] [CrossRef] [Green Version]
  69. Rabani, J.; Mamane, H.; Pousty, D.; Bolton, J.R. Practical Chemical Actinometry—A Review. Photochem. Photobiol. 2021, 97, 873–902. [Google Scholar] [CrossRef]
  70. Jiang, X.; Manawan, M.; Feng, T.; Qian, R.; Zhao, T.; Zhou, G.; Kong, F.; Wang, Q.; Dai, S.; Pan, J.H. Anatase and Rutile in Evonik Aeroxide P25: Heterojunctioned or Individual Nanoparticles? Catal. Today 2018, 300, 12–17. [Google Scholar] [CrossRef]
  71. Ohtani, B.; Prieto-Mahaney, O.O.; Li, D.; Abe, R. What Is Degussa (Evonic) P25? Crystalline Composition Analysis, Reconstruction from Isolated Pure Particles and Photocatalytic Activity Test. J. Photochem. Photobiol. A Chem. 2010, 216, 179–182. [Google Scholar] [CrossRef] [Green Version]
  72. Tobaldi, D.M.; Pullar, R.C.; Seabra, M.P.; Labrincha, J.A. Fully Quantitative X-ray Characterisation of Evonik Aeroxide TiO2 P25®. Mater. Lett. 2014, 122, 345–347. [Google Scholar] [CrossRef]
  73. Náfrádi, M.; Farkas, L.; Alapi, T.; Hernádi, K.; Kovács, K.; Wojnárovits, L.; Takács, E. Application of Coumarin and Coumarin-3-Carboxylic Acid for the Determination of Hydroxyl Radicals during Different Advanced Oxidation Processes. Radiat. Phys. Chem. 2020, 170. [Google Scholar] [CrossRef]
  74. Nosaka, Y.; Nishikawa, M.; Nosaka, A.Y. Spectroscopic Investigation of the Mechanism of Photocatalysis. Molecules 2014, 19, 18248–18267. [Google Scholar] [CrossRef]
  75. Nosaka, Y.; Nosaka, A. Understanding Hydroxyl Radical (•OH) Generation Processes in Photocatalysis. ACS Energy Lett. 2016, 1, 356–359. [Google Scholar] [CrossRef] [Green Version]
  76. Tang, J.; Durrant, J.R.; Klug, D.R. Mechanism of Photocatalytic Water Splitting in TiO2. Reaction of Water with Photoholes, Importance of Charge Carrier Dynamics, and Evidence for Four-Hole Chemistry. J. Am. Chem. Soc. 2008, 103, 13885–13891. [Google Scholar] [CrossRef]
  77. Sachs, M.; Pastor, E.; Kafizas, A.; Durrant, J.R. Evaluation of Surface State Mediated Charge Recombination in Anatase and Rutile TiO2. J. Phys. Chem. Lett. 2016, 7, 3742–3746. [Google Scholar] [CrossRef] [PubMed] [Green Version]
  78. Lin, J.; Li, Y. The Influence of Inorganic Anions on Photocatalytic CO2 Reduction. Catal. Sci. Technol. 2020, 10, 959–966. [Google Scholar] [CrossRef]
  79. Rioja, N.; Zorita, S.; Peñas, F.J. Effect of Water Matrix on Photocatalytic Degradation and General Kinetic Modeling. Appl. Catal. B Environ. 2016, 180, 330–335. [Google Scholar] [CrossRef]
  80. Hwang, J.Y.; Moon, G.; Kim, B.; Tachikawa, T.; Majima, T.; Hong, S.; Cho, K.; Kim, W.; Choi, W. Crystal Phase-Dependent Generation of Mobile OH Radicals on TiO2: Revisiting the Photocatalytic Oxidation Mechanism of Anatase and Rutile. Appl. Catal. B Environ. 2021, 286, 119905. [Google Scholar] [CrossRef]
  81. Buxton, G.V.; Greenstock, C.L.; Helman, W.P.; Ross, A.B. Critical Review of Rate Constants for Reactions of Hydrated Electrons, Hydrogen Atoms and Hydroxyl Radicals (⋅OH/⋅O− in Aqueous Solution. J. Phys. Chem. Ref. Data 1988, 17, 513–886. [Google Scholar] [CrossRef] [Green Version]
  82. Reichman, B.; Byvik, C.E. Photoproduction of I2, Br2, and Cl2 on n-Semiconducting Powder. J. Phys. Chem. 1981, 85, 2255–2258. [Google Scholar] [CrossRef]
  83. Maji, T.K.; Bagchi, D.; Kar, P.; Karmakar, D.; Pal, S.K. Enhanced Charge Separation through Modulation of Defect-State in Wide Band-Gap Semiconductor for Potential Photocatalysis Application: Ultrafast Spectroscopy and Computational Studies. J. Photochem. Photobiol. A Chem. 2017, 332, 391–398. [Google Scholar] [CrossRef]
  84. Nguyen, V.N.H.; Amal, R.; Beydoun, D. Effect of Formate and Methanol on Photoreduction/Removal of Toxic Cadmium Ions Using TiO2 Semiconductor as Photocatalyst. Chem. Eng. Sci. 2003, 58, 4429–4439. [Google Scholar] [CrossRef]
  85. Cao, Z.; Zhang, T.; Ren, P.; Cao, D.; Lin, Y.; Wang, L.; Zhang, B.; Xiang, X. Doping of Chlorine from a Neoprene Adhesive Enhances Degradation Efficiency of Dyes by Structured TiO2-Coated Photocatalytic Fabrics. Catalysts 2020, 10, 69. [Google Scholar] [CrossRef] [Green Version]
  86. Iguchi, S.; Teramura, K.; Hosokawa, S.; Tanaka, T. Effect of the Chloride Ion as a Hole Scavenger on the Photocatalytic Conversion of CO2 in an Aqueous Solution over Ni-Al Layered Double Hydroxides. Phys. Chem. Chem. Phys. 2015, 17, 17995–18003. [Google Scholar] [CrossRef] [PubMed] [Green Version]
  87. Pang, R.; Miseki, Y.; Okunaka, S.; Sayama, K. Photocatalytic Production of Hypochlorous Acid over Pt/WO3 under Simulated Solar Light. ACS Sustain. Chem. Eng. 2020, 8, 8629–8637. [Google Scholar] [CrossRef]
  88. Long, C.A.; Blelski, B.H.J. Rate of Reaction of Superoxide Radical with Chloride-Containing Species. J. Phys. Chem. 1980, 84, 555–557. [Google Scholar] [CrossRef]
  89. Serrà, A.; Philippe, L.; Perreault, F.; Garcia-Segura, S. Photocatalytic Treatment of Natural Waters. Reality or Hype? The Case of Cyanotoxins Remediation. Water Res. 2021, 188, 116543. [Google Scholar] [CrossRef]
  90. Cheng, Z.; Ling, L.; Wu, Z.; Fang, J.; Westerhoff, P.; Shang, C. Novel Visible Light-Driven Photocatalytic Chlorine Activation Process for Carbamazepine Degradation in Drinking Water. Environ. Sci. Technol. 2020, 54, 11584–11593. [Google Scholar] [CrossRef]
  91. Mazellier, P.; Busset, C.; Delmont, A.; De Laat, J. A Comparison of Fenuron Degradation by Hydroxyl and Carbonate Radicals in Aqueous Solution. Water Res. 2007, 41, 4585–4594. [Google Scholar] [CrossRef] [PubMed]
  92. Dell’Arciprete, M.L.; Soler, J.M.; Santos-Juanes, L.; Arques, A.; Mártire, D.O.; Furlong, J.P.; Gonzalez, M.C. Reactivity of Neonicotinoid Insecticides with Carbonate Radicals. Water Res. 2012, 46, 3479–3489. [Google Scholar] [CrossRef]
  93. Liu, Y.; He, X.; Duan, X.; Fu, Y.; Fatta-Kassinos, D.; Dionysiou, D.D. Significant Role of UV and Carbonate Radical on the Degradation of Oxytetracycline in UV-AOPs: Kinetics and Mechanism. Water Res. 2016, 95, 195–204. [Google Scholar] [CrossRef] [PubMed]
  94. Bolton, J.R.; Bircher, K.G.; Tumas, W.; Tolman, C.A. Figures-of-Merit for the Technical Development and Application of Advanced Oxidation Technologies for Both Electric- and Solar-Driven Systems. Pure Appl. Chem. 2001, 73, 627–637. [Google Scholar] [CrossRef]
  95. Bourgin, M.; Violleau, F.; Debrauwer, L.; Albet, J. Ozonation of Imidacloprid in Aqueous Solutions: Reaction Monitoring and Identification of Degradation Products. J. Hazard. Mater. 2011, 190, 60–68. [Google Scholar] [CrossRef] [PubMed]
  96. Bamba, D.; Coulibaly, M.; Robert, D. Nitrogen-Containing Organic Compounds: Origins, Toxicity and Conditions of Their Photocatalytic Mineralization over TiO2. Sci. Total Environ. 2017, 580, 1489–1504. [Google Scholar] [CrossRef]
  97. Piccinini, P.; Minero, C.; Vincenti, M.; Pelizzetti, E. Photocatalytic Mineralization of Nitrogen-Containing Benzene Derivatives. Catal. Today 1997, 39, 187–195. [Google Scholar] [CrossRef]
  98. Løgager, T.; Sehested, K. Formation and Decay of Peroxynitric Acid: A Pulse Radiolysis Study. J. Phys. Chem. 1993, 97, 10047–10052. [Google Scholar] [CrossRef]
  99. Park, S.; Kim, H.J.; Kim, J.S.; Yoo, K.; Lee, J.C.; Anderson, W.A.; Lee, J.H. Photocatalytic Reduction of Nitrate in Wastewater Using ZnO Nanopowder Synthesized by Solution Combustion Method. J. Nanosci. Nanotechnol. 2007, 7, 4069–4072. [Google Scholar] [CrossRef] [PubMed]
  100. Yin, K.; Deng, Y.; Liu, C.; He, Q.; Wei, Y.; Chen, S.; Liu, T.; Luo, S. Kinetics, Pathways and Toxicity Evaluation of Neonicotinoid Insecticides Degradation via UV/Chlorine Process. Chem. Eng. J. 2018, 346, 298–306. [Google Scholar] [CrossRef]
  101. Rózsa, G.; Náfrádi, M.; Alapi, T.; Schrantz, K.; Szabó, L.; Wojnárovits, L.; Takács, E.; Tungler, A. Photocatalytic, Photolytic and Radiolytic Elimination of Imidacloprid from Aqueous Solution: Reaction Mechanism, Efficiency and Economic Considerations. Appl. Catal. B Environ. 2019, 250, 429–439. [Google Scholar] [CrossRef] [Green Version]
  102. Rózsa, G.; Szabó, L.; Schrantz, K.; Takács, E.; Wojnárovits, L. Mechanistic Study on Thiacloprid Transformation: Free Radical Reactions. J. Photochem. Photobiol. A Chem. 2017, 343, 17–25. [Google Scholar] [CrossRef] [Green Version]
  103. Patra, S.G.; Mizrahi, A.; Meyerstein, D. The Role of Carbonate in Catalytic Oxidations. Acc. Chem. Res. 2020, 53, 2189–2200. [Google Scholar] [CrossRef]
  104. Chen, S.; Wang, L.W. Thermodynamic Oxidation and Reduction Potentials of Photocatalytic Semiconductors in Aqueous Solution. Chem. Mater. 2012, 24, 3659–3666. [Google Scholar] [CrossRef] [Green Version]
  105. Armstrong, D.A.; Huie, R.E.; Koppenol, W.H.; Lymar, S.V.; Merenyi, G.; Neta, P.; Ruscic, B.; Stanbury, D.M.; Steenken, S.; Wardman, P. Standard Electrode Potentials Involving Radicals in Aqueous Solution: Inorganic Radicals (IUPAC Technical Report). Pure Appl. Chem. 2015, 87, 1139–1150. [Google Scholar] [CrossRef]
  106. Dell’Arciprete, M.L.; Santos-Juanes, L.; Sanz, A.A.; Vicente, R.; Amat, A.M.; Furlong, J.P.; Mártire, D.O.; Gonzalez, M.C. Reactivity of Hydroxyl Radicals with Neonicotinoid Insecticides: Mechanism and Changes in Toxicity. Photochem. Photobiol. Sci. 2009, 8, 1016–1023. [Google Scholar] [CrossRef] [PubMed]
Figure 1. The effect of catalyst load (a,b), COU initial concentration (c,d), and photon flux (e,f) on the initial transformation rate of COU and 7-HC.
Nanomaterials 12 00005 g001
Figure 2. The emission spectra of the LEDs (black and red line), and the absorption spectra of the TiO2 and ZnO photocatalysts (blue and green interrupted line). The bandgap of the ZnO and TiO2 anatase (3.2 eV) with a vertical orange line, and the bandgap of TiO2 rutile (3.0 eV) with a vertical purple line).
Nanomaterials 12 00005 g002
Figure 3. Effect of matrices (a,b), Cl (120 mg dm−3), and HCO3 (525 mg dm−3) (c,d) on the relative transformation rate of COU and formation rate of 7-HC.
Nanomaterials 12 00005 g003
Figure 4. The effect of HCO3 (525 mg dm−3) (a,c) and Cl (120 mg dm−3) (b) on the mineralization of COU (c0 = 5.0 × 10⁻⁴ M; TOC0 = 55 mg dm−3).
Nanomaterials 12 00005 g004
Figure 5. The relative concentration (a: IMIDA; b: THIA), and the relative TOC content (TOC0 = 12 mg dm−3) (c: IMIDA; d: THIA) as a function of irradiation time, and the electric energy required to remove 90% of the neonicotinoid (e) and 50% of initial TOC content (f).
Nanomaterials 12 00005 g005
Figure 6. The products of IMIDA and THIA detected by HPLC-MS.
Nanomaterials 12 00005 g006
Figure 7. The conversion of organic Cl-, S-, and N-content of IMIDA and THIA to Cl (a), SO42− (b), NH4+ (c), NO3 (d) and NO2(e).
Nanomaterials 12 00005 g007
Figure 8. The relative initial transformation rates of IMIDA and THIA measured in different water matrices (a,b), and in the presence of Cl and HCO3 (c,d).
Nanomaterials 12 00005 g008
Figure 9. The ecotoxicity of IMIDA and THIA suspensions as a function of treatment time ((a): LED365nm, (b): LED398nm).
Nanomaterials 12 00005 g009
Table 1. The apparent quantum yields (Φapp) of the transformation of COU and the formation of 7-HC (c0COU = 5.0 × 10⁻⁴ M and 1.0 g dm−3 ZnO or TiO2).
LEDPel (W)TiO2ZnO
r0COU
(×10−7)
ΦappCOU
(×10−2)
r07-HC
(×10−9)
Φapp7-HC
(×10−4)
r07-HC/r0COUr0COU
(×10−7)
ΦappCOU
(×10−2)
r07-HC
(×10−9)
Φapp7-HC
(×10−4)
r07-HC/r0COU
LED365nm3.391.491.013.42.30.0233.502.473.222.30.009
6.563.031.226.402.40.0214.681.704.751.70.010
13.603.830.688.251.50.0226.211.135.571.00.009
20.774.020.478.301.00.0216.200.756.250.80.011
LED398nm0.960.220.181.020.850.0440.310.262.001.70.039
2.160.470.191.970.820.0450.500.212.931.30.059
4.680.950.204.150.890.0470.830.183.250.70.064
Φapp: the transformation (r0COU) or formation rate (r07HC) divided by the incoming photon flux.
Publisher’s Note: MDPI stays neutral with regard to jurisdictional claims in published maps and institutional affiliations.

