Article

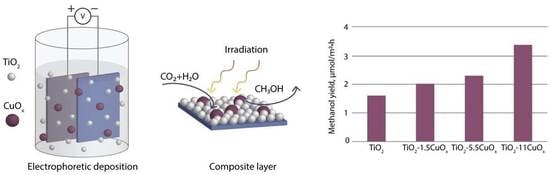
The Composite TiO2–CuOx Layers Formed by Electrophoretic Method for CO2 Gas Photoreduction

by
Larisa I. Sorokina
1,*,
Andrey M. Tarasov
1,
Anastasiya I. Pepelyaeva
1,
Petr I. Lazarenko
1,
Alexey Yu. Trifonov
1,2,
Timofey P. Savchuk
1,
Artem V. Kuzmin
1,
Aleksey V. Tregubov
3,
Elena N. Shabaeva
3,
Ekaterina S. Zhurina
3,
Lidiya S. Volkova
4,
Sergey V. Dubkov
1,
Dmitry V. Kozlov
3 and
Dmitry Gromov
1,5,*
1
Institute of Advanced Materials and Technologies, National Research University of Electronic Technology—MIET, Bld. 1, Shokin Square, Zelenograd, 124498 Moscow, Russia
2
Scientific Research Institute of Physical Problems Named after F.V. Lukin, Pass. 4806, Bld., Zelenograd, 124498 Moscow, Russia
3
S.P. Kapitsa Scientific Technological Research Institute, Ulyanovsk State University, 42 Leo Tolstoy Street, 432017 Ulyanovsk, Russia
4
Institute of Nanotechnology of Microelectronics RAS, 32A Leninsky Prospekt, 119991 Moscow, Russia
5
Institute for Bionic Technologies and Engineering, I.M. Sechenov First Moscow State Medical University, Bolshaya Pirogovskaya 2, 119435 Moscow, Russia
*
Authors to whom correspondence should be addressed.
Nanomaterials 2023, 13(14), 2030; https://doi.org/10.3390/nano13142030
Submission received: 11 June 2023 / Revised: 5 July 2023 / Accepted: 6 July 2023 / Published: 8 July 2023
(This article belongs to the Special Issue Composite Photocatalysts Based on Nanomaterials)

Abstract

:
This study demonstrates the ability to control the properties of TiO2–CuOx composite layers for photocatalytic applications by using a simple electrophoretic deposition method from isopropanol-based suspension. To obtain uniform layers with a controlled composition, the surfactant sodium lauryl sulfate was used, which influenced the electrophoretic mobility of the particles and the morphology of the deposited layers. The TiO2–CuOx composite layers with different CuOx contents (1.5, 5.5, and 11 wt.%) were obtained. It is shown that the optical band gap measured by UV–VIS–NIR diffuse reflectance spectra. When CuOx is added to TiO2, two absorption edges corresponding to TiO2 and CuOx are observed, indicating a broadening of the photosensitivity range of the material relative to pure TiO2. An open-circuit potential study shows that by changing the amount of CuOx in the composite material, one can control the ratio of free charge carriers (n and p) and, therefore, the catalytic properties of the material. As a result, the TiO2–CuOx composite layers have enhanced photocatalytic activity compared to the pure TiO2 layer: methanol yield grows with increasing CuOx content during CO2 photoreduction.

Graphical Abstract

1. Introduction

The search for strategies to promote the formation of heterostructured photocatalysts is an urgent task to improve the environmental situation in the world through the production of renewable fuels (such as hydrogen, methanol, and methane) and the decomposition of toxic pollutants [1,2,3]. The development of hybrid photocatalytic systems based on TiO2 in combination with other semiconductors with a narrower band gap is one of the most economical and reasonable ways to increase the efficiency [4,5,6,7]. Improved photocatalytic characteristics of TiO2- and CuOx-based composites, which demonstrate activity in the visible radiation range, are presented in [8,9,10]. The TiO2/CuOx heterostructure promotes a more efficient photon collection and separation of electrons and holes through the interfacial charge transfer process [11]. To date, there is a wide variety of methods for the formation of photocatalytic layers on a solid surface, including chemical vapor deposition (CVD), pulsed laser deposition (PLD), spray pyrolysis, electrochemical deposition, anodic oxidation, hydrothermal method, magnetron sputtering, sol–gel, electrophoretic deposition (EPD), and others.
Electrophoretic deposition technology is an appealing manufacturing method. Its principle of operation is based on the movement of charged particles in a suspension under the influence of an electric field. This EPD technology does not require expensive equipment and allows for the formation of composites with complex compositions on large-area substrates while accurately controlling geometric and stoichiometric parameters. It is also worth noting that the EPD technology allows for the use of commercially available powders, such as TiO2 P25, whose effectiveness has been demonstrated in numerous papers [12,13,14,15]. The papers [16,17] present specific features of TiO2 P25 layer formation by the EPD method.
The formation of composite layers by electrophoretic deposition is noticeably more complicated since particles of different compositions differ in zeta potential in the same solvent. Heterogeneous particles can migrate to the electrode individually with different electrophoretic mobility or coagulate with each other, forming heteroaggregates [18]. To stabilize the multi-component suspension, various charging, binding, and dispersing agents are used, which prevent the formation of large aggregates and provide a high surface charge of particles. Many studies focus on the selection of optimal additives for electrophoretic deposition of composites with TiO2 [19,20,21].
In this work, the surfactant sodium lauryl sulfate (SDS) was used as a stabilizing additive for the deposition of TiO2 (P25) and TiO2–CuOx composite layers. The main goal of the study was to develop a simple and efficient technique for forming composite layers based on TiO2 and CuOx with controlled composition for potential application as photocatalysts. Optical band gap, open-circuit potential, and photocatalytic activity of the developed composite photocatalysts were investigated. The enhanced photocatalytic CO2 conversion to methanol by TiO2–CuOx composites, as compared to pure TiO2, is explained by the broadening of the spectral range of photoactivity, improved charge carrier separation, and increased redox capacity.

2. Materials and Methods

2.1. Materials and Electrophoretic Deposition Process

CuO nanopowder with an average particle size of 50–100 nm containing a small amount of Cu2O phase (Advanced Powder Technologies LLC, Tomsk, Russia), TiO2 P25 nanopowder (Evonik, Hanau, Germany) with an average particle size of 25 nm, sodium lauryl sulfate, and chemically pure isopropyl alcohol were used for the suspension preparation. The loading of TiO2 and TiO2/CuOx nanopowders in all cases was 1 g/L. The 50 mL suspension was processed using a 100 watt ultrasonic homogenizer for 1 h at a temperature not exceeding 22 °C. Titanium foil was used as a substrate. Stainless steel foil was used as a counter-electrode. Preliminarily titanium foil was etched in HF:HNO3:H2O solution (1:1:4 by volume) to remove the impurities and titanium oxide layer. Then the foil was washed in deionized water and dried in vapor of isopropyl alcohol. The EPD process was carried out in a potentiometric mode at an electric field strength from 30 to 130 V/cm.

2.2. Material Characterization

Surface morphology and composition of received TiO2–CuOx layers were investigated by scanning electron microscopy Helios G4 CX (FEI, Hillsboro, Oregon, USA) and energy-dispersive X-ray (EDX) analysis. The study of suspension particle aggregates was carried out using Tecnai G2 20 electron microscope (FEI, Hillsboro, Oregon, USA), at an accelerating voltage of 200 kV. The microscope is equipped with a system for energy-dispersive X-ray analysis.
The phase composition of the obtained TiO2–CuOx layers was studied using X-ray diffraction. Diffraction wide-angle spectra were recorded by Miniflex 600 (Rigaku, Tokyo, Japan) under the following conditions:
  • Scanning speed 10 °C·min−1;
  • Scan range from 3° to 90°;
  • Radiation Cu Kα;
  • The voltage on the tube 20 Kv;
  • The anode current 7 mA.

2.3. Optical Band Gap Investigation

The optical band gap (Eg) was estimated from UV–VIS–NIR diffuse reflectance spectra. The diffuse reflectance spectra of the powder samples of TiO2–CuOx were measured using a spectrophotometer Agilent Cary 5000 (Santa Clara, California, USA) with an integrating sphere. Reflectance spectra were recorded in the range from 200 to 800 nm with a spectral resolution of 1 nm. The diffuse reflectance data have been transformed into an absorbance according to the Kubelka–Munk Equation (1) [22,23,24,25,26]:
F R d = ( 1 R d ) 2 2 R d
where Rd is the diffuse reflectance and F(Rd) is the function, which is proportional to the absorbance.
To estimate the optical band gap (Egopt), we used Equation (2) [26,27,28]:
F R d · h · ν = A · ( h · ν E g o p t ) n
where n is a factor characterizing the type of transition in the forbidden zone. We used n = 2, which is typical for the indirect allowed transition [24]. The optical band gap values were obtained from the linear fits to (F(Rd) · hν)1/2 versus hν (frequently called Tauc plot) [29,30,31,32].

2.4. Photoelectrochemical Measurements

The dependence of open-circuit potential (OCP) on time was recorded using an Electrochemical Instruments P-45X potentiostat (Chernogolovka, Russia). The open-circuit potential was measured relative to the Ag/AgCl (3 M) reference electrode in a 0.1 M aqueous Na2SO4 solution. A platinum sheet with a total area of 2 cm2 was used as a counter-electrode. Measurements were performed under the full-spectrum illumination of a xenon lamp. The Newport 67005 Sun complex with Xe 150 W lamp (Irvine, CA, USA) was used as a light source. The power of the incident light on the sample was approximately 100 mW/cm2, and the illuminated area was approximately 0.63 cm2. We waited until the OCPdark value reached a stable state before illuminating the samples. The samples were illuminated for 200 s.

2.5. Photocatalytic Activity Study

For photocatalytic studies, TiO2–CuOx layers with 7 cm2 area and specific mass of 1 mg/cm2 were deposited on a titanium foil substrate. The photocatalytic studies of CO2 reduction were conducted in a 25 cm3 flow reactor equipped with a heating element and a quartz window. Two 35 W xenon lamps were used as the light source. The process conditions were as follows: the reactor temperature was 40 °C, the reaction mixture consisted of 40 vol.% CO2 and 60 vol.% H2O, and the gas flow rate was 3.0 mL/min. Prior to injecting CO2 into the reaction chamber, the gas line was purged with helium. Subsequently, the sample was illuminated for 12 h in a gas flow consisting of 40 vol.% He and 60 vol.% H2O to decompose the adsorbed organics. Analysis of reaction products was performed on the gas chromatograph Crystal 5000 (Chromatec, Yoshkar-Ola, Russia) equipped with an Agilent HP PLOT Q capillary column and a flame ionization detector. Identification of reaction products and measurement of their concentration were carried out based on the exit time and peak area, respectively. Control measurements without light irradiation were performed after changing the He gas flow to CO2. For all samples, three control measurements of the methanol yield without light were performed, and the average value was calculated, which was considered as the baseline value. All presented methanol yield values were obtained by subtracting the baseline methanol yield value in the dark. The methanol yield concentration (mg/m3) was calculated from the calibration curve. To construct the curve, mixtures with different concentrations of methanol were prepared and the peak area of methanol (mV·min) was calculated as a function of concentration. The final methanol yield (μmol/m2·h) of the sample was calculated according to Equation (3):
Y i e l d ( μ m o l / m 2 · h ) = C ( m g / m 3 ) · Q ( m 3 / h ) M ( m g / μ m o l ) · A ( m 2 )
where C—concentration, Q—flow rate, M—molar mass, and A—sample area.

3. Results

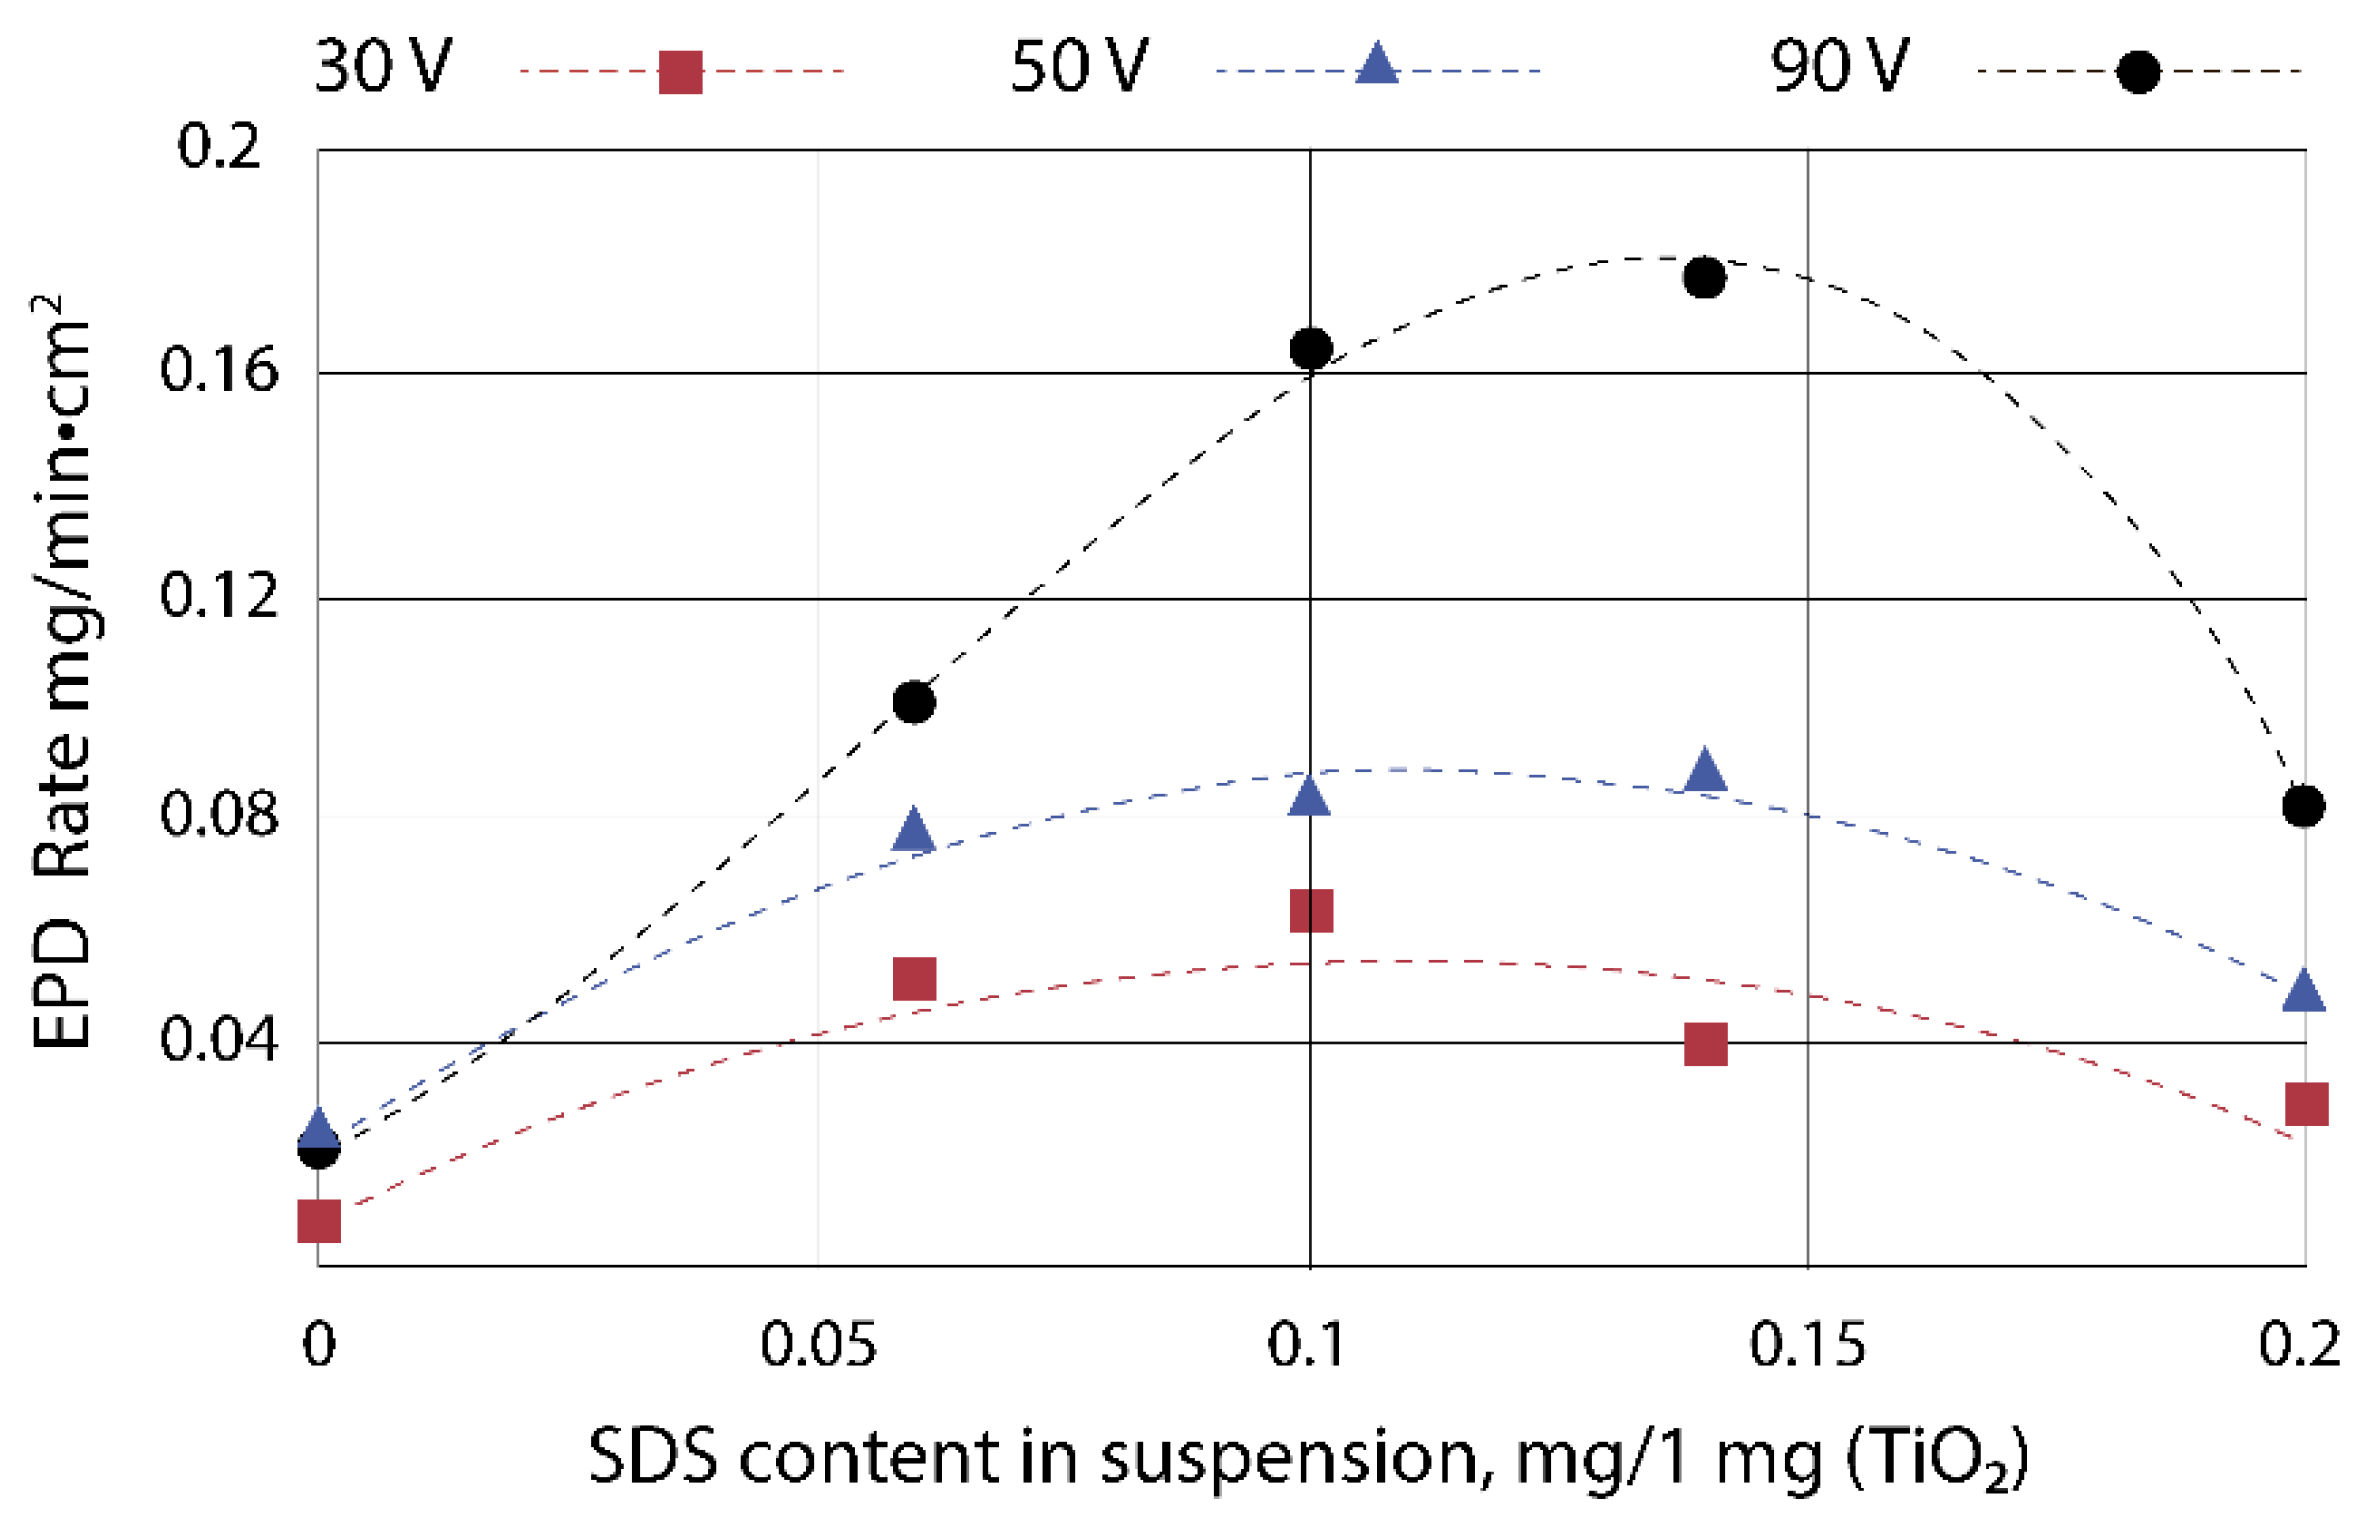
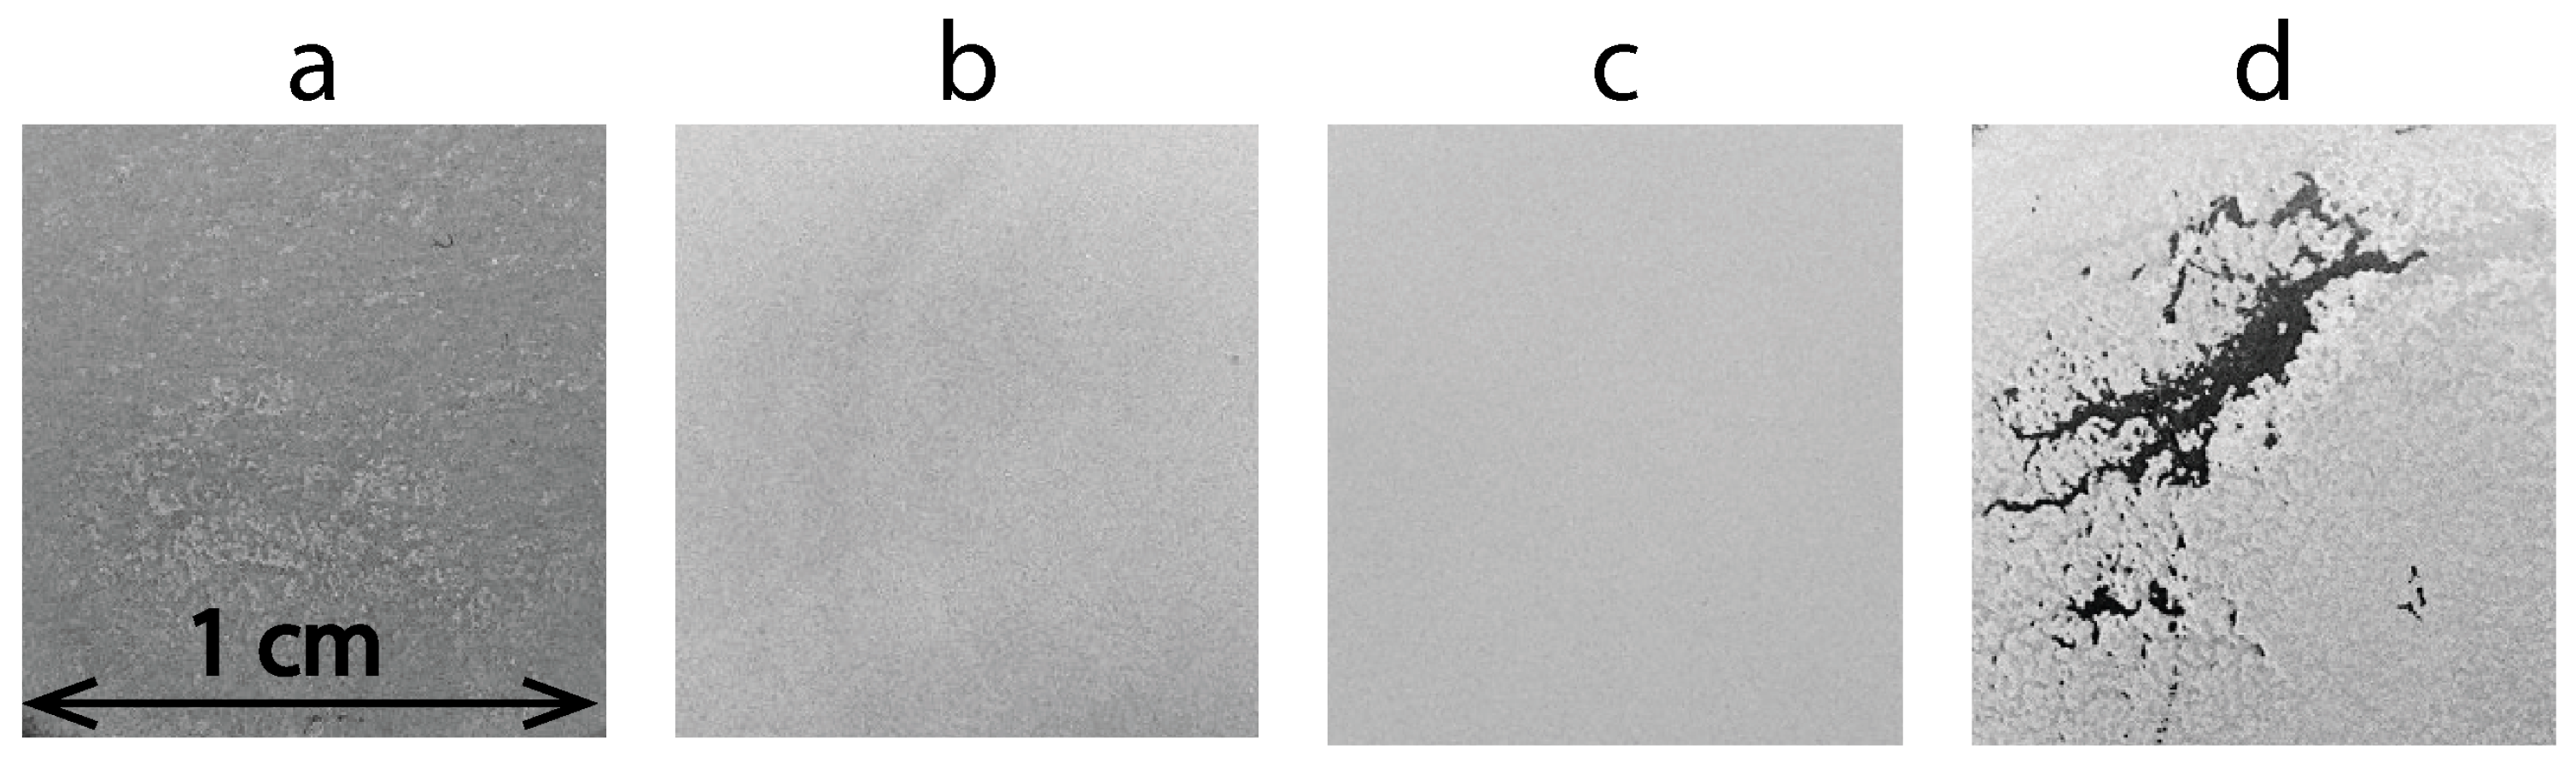
3.1. Electrophoretic Deposition of TiO2 Layers

The suspension based on isopropanol and TiO2 particles demonstrates high stability: the particles remain suspended for one day. However, electrophoretic deposition from this suspension practically does not occur. This indicates the low surface charge of the particles, despite the fact that the particles are sterically stabilized. To optimize the EPD process, the effect of the surfactant sodium lauryl sulfate on the electrophoretic deposition rate of TiO2 particles and on the morphology of the deposited layers was studied. The correlation between the particle electrophoretic deposition rate and the SDS content in the suspension is shown in Figure 1.
With an increase in SDS content in the suspension, the electrophoretic deposition rate of TiO2 particles reaches a certain maximum value and then decreases. The maximum deposition rate is observed at contents in the range of 0.1–0.14 mg of SDS per 1 mg of TiO2 in an isopropyl alcohol-based suspension. The maximum deposition rate is observed at a content of 0.1 and 0.14 mg SDS per 1 mg TiO2 in a suspension based on isopropyl alcohol. With an SDS content of 0.2 mg per 1 mg of TiO2, a critical concentration of surfactants in a colloidal solution is achieved. As a result, the particles coagulate and the deposition rate decreases, since it is more difficult for larger aggregates to migrate to the electrode. The comparison of the deposited layers at 90 V/cm for 5 min from suspensions with different SDS contents is shown in Figure 2.
Uniform TiO2 layers were obtained from suspensions that demonstrated the highest rate of electrophoretic particle deposition. When the SDS content is less than 0.1 mg per 1 mg of TiO2, deposition occurs with agglomerates (Figure 2a). At SDS content greater than 0.14 mg per 1 mg of TiO2, the layer forms unevenly and with low adhesion (Figure 2d). Taking into account the deposition rate and uniformity of the deposited layers, favorable ratios are within the range of 0.1 mg to 0.14 mg of SDS per 1 mg of TiO2. In this case, we consider the ratio of 0.1 mg SDS per 1 mg TiO2 for the formation of titanium-dioxide-based layers to be more preferable. This choice is based on the belief that a lower content of SDS will introduce fewer impurities into the formed layers.

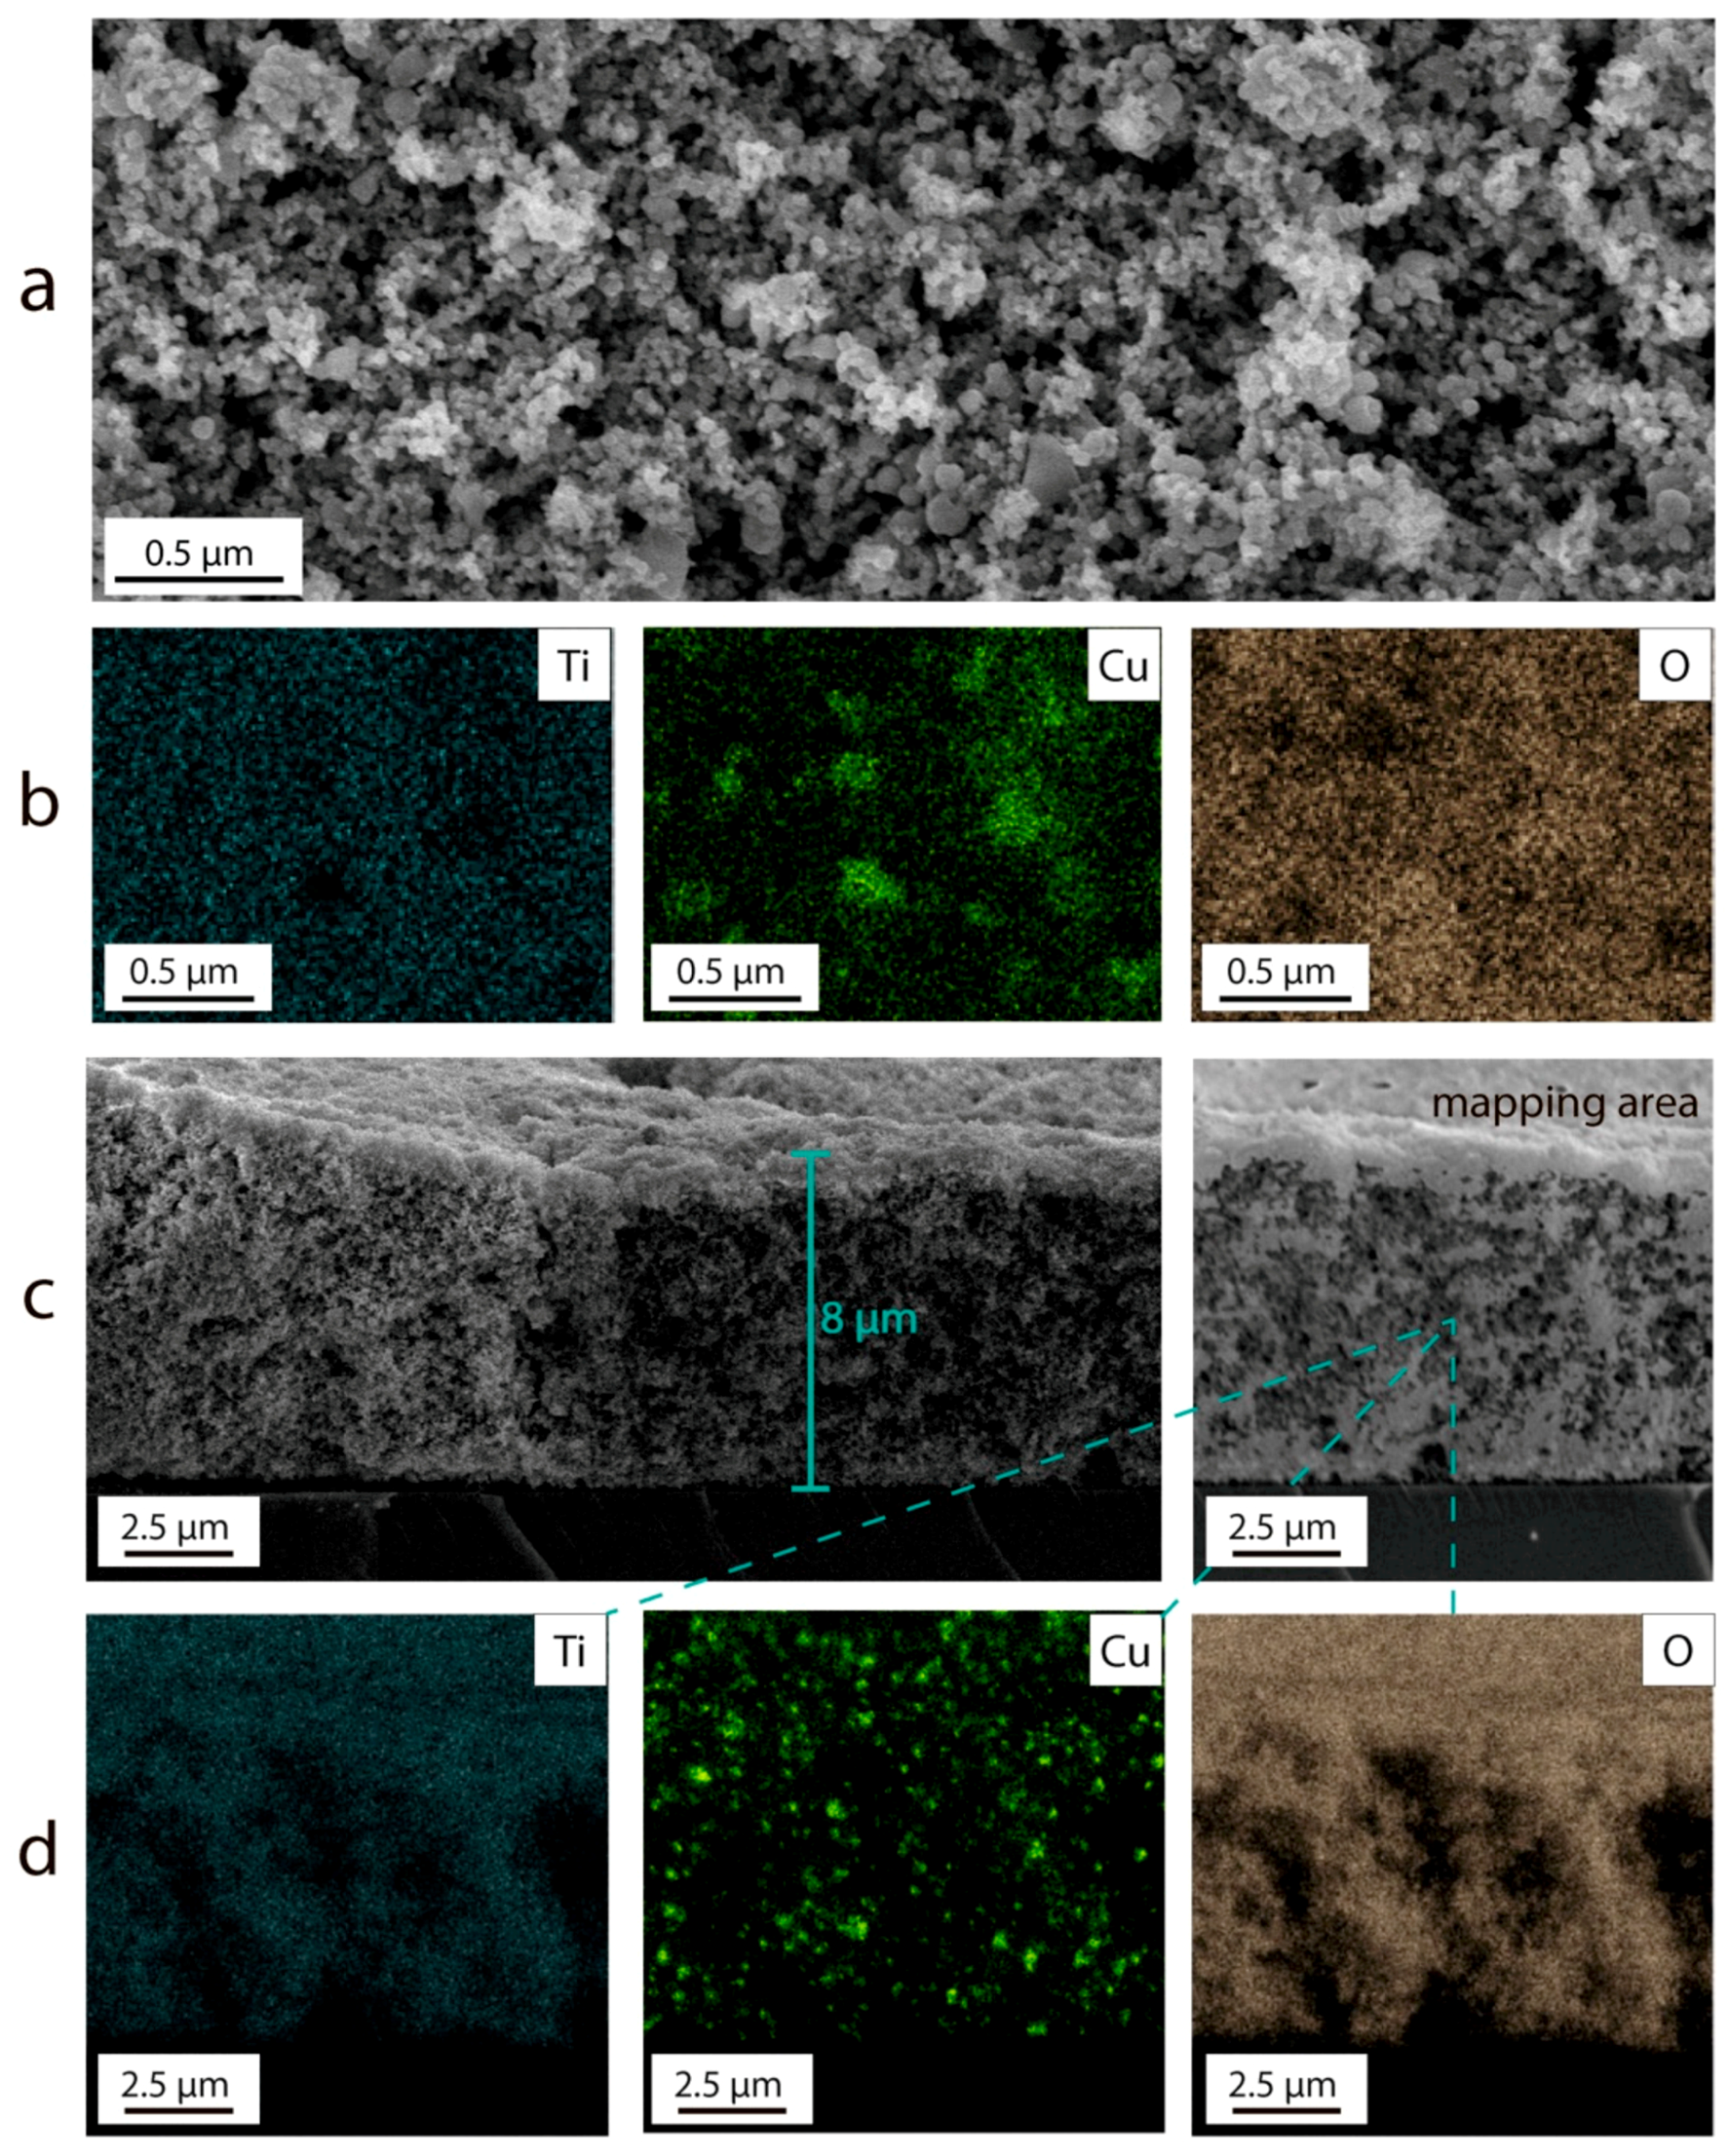
3.2. Electrophoretic Deposition of TiO2–CuOx Layers

No additional stabilizing additives are required for electrophoretic deposition of CuOx from an isopropanol-based suspension. When CuOx and TiO2 particles are mixed, the suspension remains stable for one day, but only CuOx particles are electrophoretically deposited. A similar study of the influence of SDS on the electrophoretic deposition rate and the morphology of the deposited layers was conducted. When SDS is added to the suspension containing CuOx and TiO2 particles, the rate of electrophoretic deposition also increases up to a certain maximum value and then decreases. However, in this case, a significantly lower amount of SDS is required (0.04 mg SDS per 1 mg of TiO2 nanopowder), because CuOx particles do not require additional electrostatic stabilization.
A series of samples deposited from suspensions containing 3%, 10%, and 20% wt. CuOx were obtained. Figure 3 shows SEM images and EDX element mapping of the TiO2–CuOx layer deposited from a suspension with 20 wt.% CuOx. The composition of the resulting TiO2–CuOx composite layers was determined by EDX analysis. (Table 1).
The TiO2–CuOx layer formed by electrophoretic deposition has a developed surface (Figure 3a). All elements are distributed uniformly over the entire area, which is confirmed by Figure 3b,d. The approximate thickness of the TiO2–CuOx layer with a specific mass of 1 mg/cm2 is 8 μm (Figure 3c).
The mass content of CuOx in the layer differs from the content of CuOx in the suspension by almost two times (Table 1). Aggregates of particles from suspensions with the addition of SDS were studied using a transmission electron microscope (Figure 4).
To identify TiO2 and CuOx particles, a characteristic fragment of the investigated sample was selected, shown in Figure 4a,b. In STEM mode, the high-angle annual dark-field detector (HAADF) was used. Therefore, the light parts of the image in Figure 4b correspond to the fragments of the sample that cause maximum scattering of the electron beam. The images show two large particles surrounded by small ones. EDX maps of this fragment (Figure 4c,d) show that large particles correspond to copper oxide, and small particles correspond to titanium oxide. Figure 4f shows that smaller TiO2 particles (~25 nm) are concentrated around large CuOx particles (~50–100 nm), forming TiO2–CuOx heteroaggregates. It is assumed that TiO2–CuOx heteroaggregates and individual TiO2 particles migrate during the EPD process. The size of the TiO2–CuOx heteroaggregates is ten times larger than the size of TiO2 particles. This facilitates slower electrophoretic deposition of copper oxide particles.
The phase composition of the deposited TiO2–CuOx layers was investigated by XRD (Figure 5).
Figure 5 shows that the XRD pattern indicates the presence of three phases: anatase, rutile, and CuO. Phases of anatase and rutile correspond to commercial TiO2 P25 nanopowder. We could not identify the Cu2O phase, which is present in small amounts in the commercial powder CuOx in accordance with the certificate. Thus, the electrophoretic deposition process of TiO2–CuOx composites as a whole does not change the phase composition relative to the initial powders.
Figure 6 shows the dependences of the EPD rate on the electric field strength for TiO2–CuOx layers with CuOx content of 1.5; 5.5; and 11 wt.% (deposition time 2 min).
The deposition rate of TiO2–CuOx layers increases linearly with increasing electric field strength. With an increase in the content of CuOx particles, the deposition rate of the TiO2–CuOx layer decreases, which also confirms that the electrophoretic mobility of TiO2–CuOx heteroaggregates is lower. The optimal range of electric field voltage for TiO2–CuOx formation is determined to be above 110 V/cm, as it enables the deposition of layers with a high deposition rate. For subsequent studies, TiO2–CuOx layers with a specific mass of 1 mg/cm2 were deposited at an electric field strength of 110 V/cm, while varying the duration of the EPD process.

3.3. Optical Band Gap

Knowledge of the optical bandgap (Egopt), which characterizes the optoelectronic properties and determines the position of the absorption edge, is crucial for purposeful optimization of the photocatalytic properties of the formed composite materials.
The estimation of the optical band gap of the formed composite TiO2–CuOx, pure TiO2 P25, and pure CuOx, determined by linear extrapolation of the absorption edges on the dependence of (F(Rd)hν)1/2 on hν, is presented in Figure 7 and Table 2.
Determination of the optical bandgap for pure TiO2 and CuOx by absorption edge is not problematic and gives a value of approximately 3.08 eV and 1.36 eV, respectively. In the case of adding CuOx to TiO2, the dependences (F(Rd)hν)1/2 on E show two absorption edges, obviously corresponding to TiO2 and CuOx. Herewith, applying the approach of determining the optical band gap of TiO2 by the intersection of the tangent with the abscissa axis shows a monotonic decrease in the determined value of Egopt (see Eg21opt in Table 2). A similar decrease effect has been observed in other works [33,34]. This is probably due to the combination of the absorption spectra of two materials: TiO2 and CuOx. A solution to this problem was described in [35,36], where the diffusion spectra of samples consisting of a combination of two materials were analyzed. In these works, the estimation of Egopt is performed by plotting two tangents to the fundamental absorption edge and the slope below the fundamental absorption. The intersection point of the linear fits can be interpreted as optical band gap value. Using this approach in our case gives an increase in the Egopt values for TiO2 (see Eg22opt in Table 2) with increasing CuOx content, as can be seen in Figure 7 also. Despite this, the application of the second approach gives values Egopt closer to pure TiO2.
Thus, the two observed absorption edges indicate that the addition of CuOx to TiO2 enables the extension of the photosensitivity range of the material.

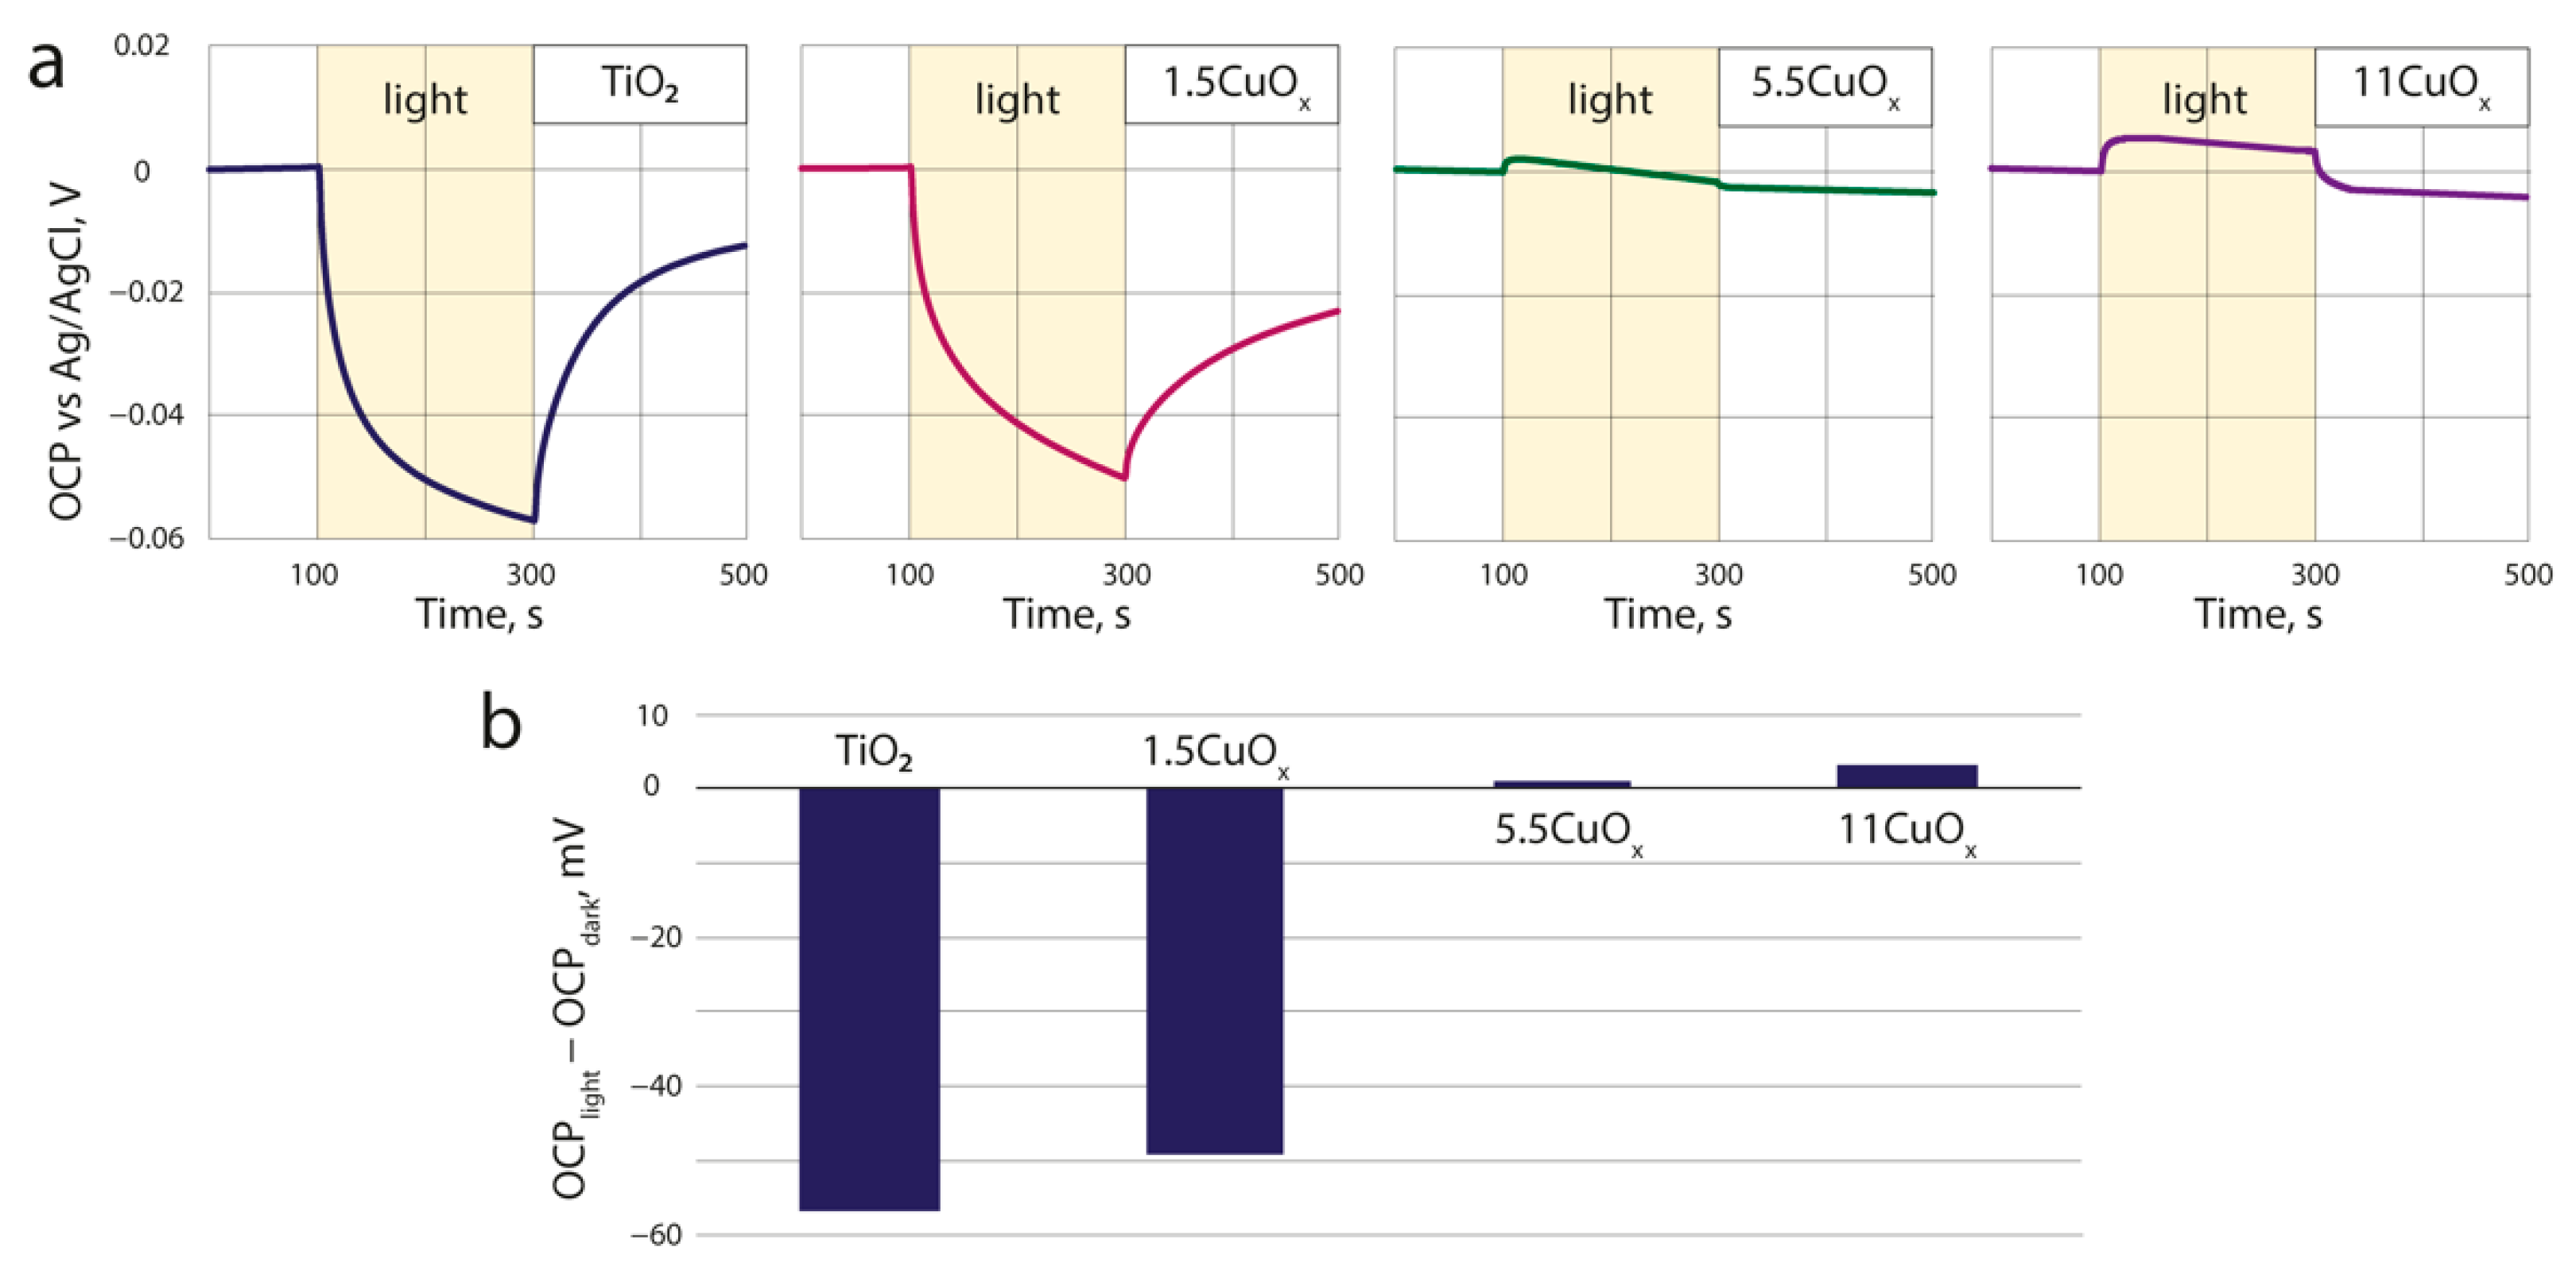
3.4. Open-Circuit Potential

The TiO2–CuOx composite layers were further analyzed using chronopotentiometry in a photoelectrochemical cell. Figure 8 presents the dependencies of the open-circuit potential (OCP) relative to the Ag/AgCl reference electrode on the illumination time of the TiO2–CuOx composites.
The open-circuit potential is the potential difference between the working electrode and the reference electrode when there is no current flowing through the external circuit. When the photoelectrode is illuminated, any change in the OCP reflects the generated photovoltage [37]. The value of the photovoltage of a semiconductor electrode represents the difference of the Fermi quasi-levels of holes (Ef,p) and electrons (Ef,n) and is directly related to the concentration of free charge carriers in the semiconductor [38]. The photogenerated charge carriers accumulate in the photoelectrode material and the change in OCP depends on the ratio of n and p [39]. The negative photovoltage indicates the anodic properties of the photoelectrode, while the positive photovoltage indicates the cathodic properties characteristic of the n-type and p-type materials [37,40].
Figure 8b shows that the OCP light/dark change of the sample with pure TiO2 is negative (−57 mV), which indicates that there are more electrons than holes (n ≫ p) and that the electrode based on this material is the anode. However, for samples with 1.5, 5.5, and 11 wt.% CuOx content, the change in OCP becomes more positive and increases with CuOx content in electrode material (−50, 1 and 3.2 mV, respectively). As mentioned above, the sample of pure TiO2 exhibits anodic properties, but with increasing content of copper oxide in the photoelectrode material, the samples begin to exhibit more cathodic properties, which can be attributed to a change in the ratio of free charge carriers (n and p).
Thus, by changing the amount of CuOx in the composite material, it is possible to control the ratio of photogenerated n and p carriers, and, consequently, the catalytic properties of the material.

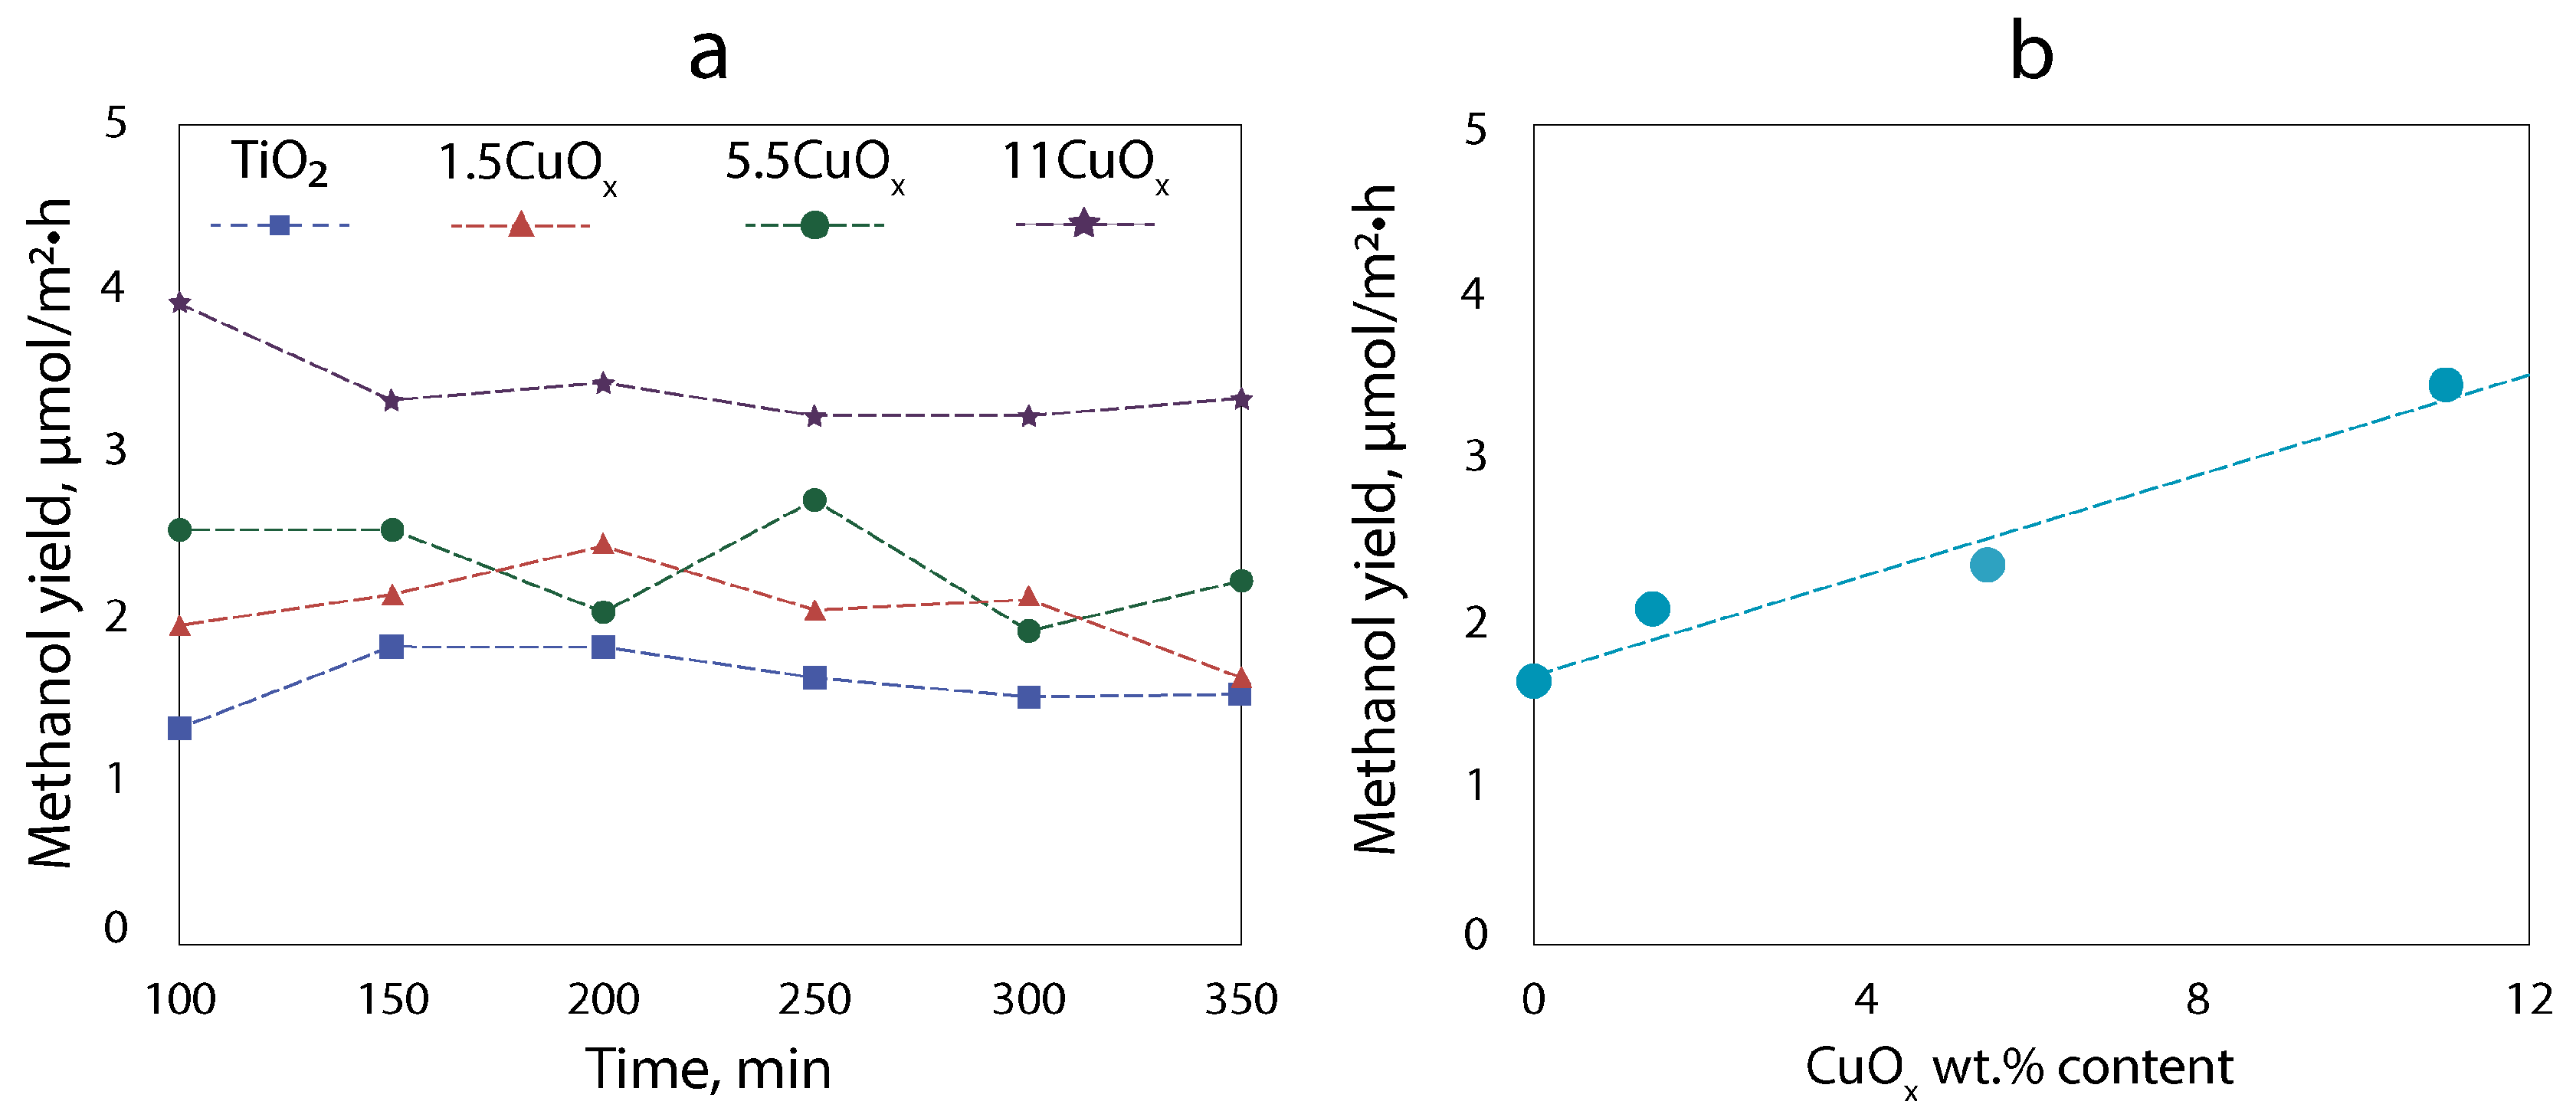
3.5. Photocatalytic Activity

We investigated the photocatalytic activity of TiO2–CuOx composite layers deposited on titanium foil. The main product of CO2 conversion under full-spectrum irradiation is methanol. Figure 9 shows the dynamics of methanol yield over time (a) and the average methanol yield as a function of the copper oxide content in the layer (b).
It can be seen from Figure 9 that the methanol yield increases almost linearly with increasing content of copper oxide in the composite material. The highest methanol yield is approximately 3.4 μmol/m2·h for the sample with 11 wt.% CuOx, which is two times higher compared to pure TiO2 P25. As we know [41] and observe, pure TiO2 P25 can produce methanol through the generation of electron–hole pairs under the influence of light (UV) in the probable scheme:
H 2 O + h + H + + O H ·
C O 2 + 6 H + + 6 e C H 3 O H + H 2 O
The addition of p-type CuOx to n-type TiO2 and the formation of a composite material lead to the local appearance of both a heterojunction and a p–n junction at the same time. This provides at least two advantages: (i) more efficient use of light-generated charge carriers due to their increased lifetime, which is achieved through the separation of charge carriers by the p–n heterojunction; (ii) expansion of the spectral range of photoactivity of the material, since TiO2 P25 is photoactive in the UV region, while copper oxide, having a narrower band gap, is photoactive in the visible spectrum.
A probable scheme of charge carrier separation during irradiation of the TiO2/CuOx material is presented in the papers [42,43,44,45,46]. We assume that this mechanism is realized in our case and is shown in Figure 10.
Under the influence of radiation, electron–hole pairs are generated in both materials. A probable process involves the recombination of electrons from the conduction band (CB) of TiO2 with the holes of CuO in the valence band (VB) of CuO (Figure 10). As a consequence, holes accumulate in VB of TiO2 and electrons accumulate in the CB of CuO. This leads to the oxidation of adsorbed H2O molecules on the TiO2 surface, producing the required H+ ions for reaction (5), and the photoreduction of adsorbed CO2 occurs on CuO. Therefore, increasing the amount of copper oxide in the composite results in an increase in the number of catalytic centers with CO2 adsorption, thereby intensifying the reaction (5).

4. Conclusions

A technique for the formation of TiO2 and composite TiO2–CuOx layers by electrophoretic deposition from a suspension based on isopropanol with the addition of SDS was developed. Composite layers based on TiO2 P25 and CuOx in a certain ratio can be easily obtained by the EPD method. By varying the ratio of TiO2 and CuOx it is possible to adjust the optical and photocatalytic properties. The addition of CuOx to TiO2 results in two absorption edges corresponding to TiO2 and CuOx to indicate a photosensitivity range expansion of composite TiO2–CuOx material in comparison to pure TiO2. Altering the quantity of CuOx in the composite material allows for the manipulation of the proportion of free charge carriers (n and p), as evidenced by an open-circuit potential investigation. Thus, the catalytic properties of the material are controlled. The photocatalytic activity of the formed composite layers was investigated using the reaction of CO2 reduction to methanol as a model reaction. It is found that the methanol yield increase linearly with increasing content of copper oxide in the composite material. The highest methanol yield is approximately 3.4 μmol/m2·h for the sample with 11 wt.% CuOx, which is two times higher compared to pure TiO2 P25. The increased photocatalytic activity of TiO2–CuOx composite layers in comparison with pure TiO2 is explained by the formation of a p–n heterojunction, which expands the spectral range of photoactivity, separates photogenerated charge carriers, and enhances the redox capacity.

Author Contributions

Conceptualization, L.I.S., D.G., and S.V.D.; methodology, A.M.T., A.I.P., P.I.L., A.V.T., E.N.S., A.Y.T., and T.P.S.; validation, D.G. and S.V.D.; formal analysis, S.V.D., A.V.T., and A.M.T.; investigation, L.I.S., P.I.L., A.V.T., E.N.S., A.Y.T., E.S.Z., A.V.K., L.S.V., and T.P.S.; resources, D.V.K.; data curation, D.V.K., S.V.D., and A.Y.T.; writing—original draft preparation, L.I.S. and D.G.; writing—review and editing, A.Y.T., D.G., and. S.V.D.; visualization, L.I.S.; supervision, D.G. All authors have read and agreed to the published version of the manuscript.

Funding

This research was funded by the Russian Science Foundation No. 22-19-00654 https://rscf.ru/project/22-19-00654/ (accessed on 12 May 2022).

Data Availability Statement

The data presented in this study are available upon request from the corresponding author.

Conflicts of Interest

The authors declare no conflict of interest.

References

  1. Luévano-Hipólito, E.; Garay-Rodríguez, L.F.; Torres-Martínez, L.M. Photocatalytic Heterostructured Materials for Air Decontamination and Solar Fuels Production. In Handbook of Greener Synthesis of Nanomaterials and Compounds; Elsevier: Amsterdam, The Netherlands, 2021; pp. 593–636. ISBN 9780128224465. [Google Scholar]
  2. Afroz, K.; Moniruddin, M.; Bakranov, N.; Kudaibergenov, S.; Nuraje, N. A Heterojunction Strategy to Improve the Visible Light Sensitive Water Splitting Performance of Photocatalytic Materials. J. Mater. Chem. A Mater. Energy Sustain. 2018, 6, 21696–21718. [Google Scholar] [CrossRef]
  3. Heterostructured Photocatalysts for Solar Energy Conversion; Elsevier: Amsterdam, The Netherlands, 2021; ISBN 9780128200728.
  4. Shawky, A.; Mohamed, R.M.; Alahmadi, N.; Zaki, Z.I. Enhanced Photocatalytic Reduction of Hexavalent Chromium Ions over S-Scheme Based 2D MoS2-Supported TiO2 Heterojunctions under Visible Light. Colloids Surf. A Physicochem. Eng. Asp. 2022, 641, 128564. [Google Scholar] [CrossRef]
  5. Cosma, D.; Urda, A.; Radu, T.; Rosu, M.C.; Mihet, M.; Socaci, C. Evaluation of the Photocatalytic Properties of Copper Oxides/Graphene/TiO2 Nanoparticles Composites. Molecules 2022, 27, 5803. [Google Scholar] [CrossRef] [PubMed]
  6. Wang, J.; Wang, B.; Zhang, W.; Xiao, Y.; Xu, H.; Liu, Y.; Liu, Z.; Zhang, J.; Jiang, Y. Visible-Light-Driven Double-Shell SnIn4S8/TiO2 Heterostructure with Enhanced Photocatalytic Activity for MO Removal and Cr(VI) Cleanup. Appl. Surf. Sci. 2022, 587, 152867. [Google Scholar] [CrossRef]
  7. Matias, M.L.; Reis-Machado, A.S.; Rodrigues, J.; Calmeiro, T.; Deuermeier, J.; Pimentel, A.; Fortunato, E.; Martins, R.; Nunes, D. Microwave Synthesis of Visible-Light-Activated g-C3N4/TiO2 Photocatalysts. Nanomaterials 2023, 13, 1090. [Google Scholar] [CrossRef] [PubMed]
  8. Wang, Y.; Tao, J.; Wang, X.; Wang, Z.; Zhang, M.; He, G.; Sun, Z. A Unique Cu2O/TiO2 Nanocomposite with Enhanced Photocatalytic Performance under Visible Light Irradiation. Ceram. Int. 2017, 43, 4866–4872. [Google Scholar] [CrossRef]
  9. Wu, J.; Li, C.; Zhao, X.; Wu, Q.; Qi, X.; Chen, X.; Hu, T.; Cao, Y. Photocatalytic Oxidation of Gas-Phase Hg0 by CuO/TiO2. Appl. Catal. B 2015, 176–177, 559–569. [Google Scholar] [CrossRef]
  10. Lu, D.; Zelekew, O.A.; Abay, A.K.; Huang, Q.; Chen, X.; Zheng, Y. Synthesis and Photocatalytic Activities of a CuO/TiO2 Composite Catalyst Using Aquatic Plants with Accumulated Copper as a Template. RSC Adv. 2019, 9, 2018–2025. [Google Scholar] [CrossRef]
  11. Kadi, M.W.; Mohamed, R.M.; Ismail, A.A. Uniform Dispersion of CuO Nanoparticles on Mesoporous TiO2 Networks Promotes Visible Light Photocatalysis. Ceram. Int. 2020, 46, 8819–8826. [Google Scholar] [CrossRef]
  12. Hurum, D.C.; Agrios, A.G.; Gray, K.A.; Rajh, T.; Thurnauer, M.C. Explaining the Enhanced Photocatalytic Activity of Degussa P25 Mixed-Phase TiO2 Using EPR. J. Phys. Chem. B 2003, 107, 4545–4549. [Google Scholar] [CrossRef]
  13. Wang, K.; Wei, Z.; Colbeau-Justin, C.; Nitta, A.; Kowalska, E. P25 and Its Components—Electronic Properties and Photocatalytic Activities. Surf. Interfaces 2022, 31, 102057. [Google Scholar] [CrossRef]
  14. Xu, N.; Huang, H.; Ouyang, H.; Wang, H. Preparation of the Heterojunction Catalyst N-Doping Carbon Quantum Dots/P25 and Its Visible Light Photocatalytic Activity. Sci. Rep. 2019, 9, 9971. [Google Scholar] [CrossRef] [PubMed] [Green Version]
  15. Li, X.; Li, Z.; Xing, Z.; Song, Z.; Ye, B.; Wang, Z.; Wu, Q. UV-LED/P25-Based Photocatalysis for Effective Degradation of Isothiazolone Biocide. Front. Environ. Sci. Eng. 2021, 15, 85. [Google Scholar] [CrossRef]
  16. Zouzelka, R.; Remzova, M.; Brabec, L.; Rathousky, J. Photocatalytic Performance of Porous TiO2 Layers Prepared by Quantitative Electrophoretic Deposition from Organic Solvents. Appl. Catal. B 2018, 227, 70–78. [Google Scholar] [CrossRef]
  17. Dhiflaoui, H.; Khlifi, K.; Barhoumi, N.; Ben Cheikh Larbi, A. The Tribological and Corrosion Behavior of TiO2 Coatings Deposited by the Electrophoretic Deposition Process. Proc. Inst. Mech. Eng. Part C 2020, 234, 1231–1238. [Google Scholar] [CrossRef]
  18. Chen, T.; Zhao, Y.; Song, S. Electrophoretic Mobility Study for Heterocoagulation of Montmorillonite with Fluorite in Aqueous Solutions. Powder Technol. 2017, 309, 61–67. [Google Scholar] [CrossRef]
  19. Wu, K.; Wang, Y.; Zhitomirsky, I. Electrophoretic Deposition of TiO2 and Composite TiO2-MnO2 Films Using Benzoic Acid and Phenolic Molecules as Charging Additives. J. Colloid Interface Sci. 2010, 352, 371–378. [Google Scholar] [CrossRef] [PubMed]
  20. Sun, Y.; Wang, Y.; Zhitomirsky, I. Dispersing Agents for Electrophoretic Deposition of TiO2 and TiO2–Carbon Nanotube Composites. Colloids Surf. A Physicochem. Eng. Asp. 2013, 418, 131–138. [Google Scholar] [CrossRef]
  21. Parsi Benehkohal, N.; Demopoulos, G.P. Electrophoretically Self-Assembled Mixed Metal Oxide-TiO2 Nano-Composite Film Structures for Photoelectrochemical Energy Conversion: Probing of Charge Recombination and Electron Transport Resistances. J. Power Sources 2013, 240, 667–675. [Google Scholar] [CrossRef]
  22. Kubelka, P. Ein Beitrag Zur Optik Der Farbanstriche (Contribution to the Optic of Paint). Z. Fur Tech. Phys. 1931, 12, 593–601. [Google Scholar]
  23. Simmons, E.L. Diffuse Reflectance Spectroscopy: A Comparison of the Theories. Appl. Opt. 1975, 14, 1380. [Google Scholar] [CrossRef]
  24. López, R.; Gómez, R. Band-Gap Energy Estimation from Diffuse Reflectance Measurements on Sol–Gel and Commercial TiO2: A Comparative Study. J. Solgel Sci. Technol. 2012, 61, 1–7. [Google Scholar] [CrossRef]
  25. Kotarba, S.; Sulka, G.D.; Syrek, K. Synthesis and Spectroelectrochemical Investigation of Anodic Black TiOx Nanotubes. Nanomaterials 2023, 13, 931. [Google Scholar] [CrossRef]
  26. Landi, S., Jr.; Segundo, I.R.; Freitas, E.; Vasilevskiy, M.; Carneiro, J.; Tavares, C.J. Use and Misuse of the Kubelka-Munk Function to Obtain the Band Gap Energy from Diffuse Reflectance Measurements. Solid State Commun. 2022, 341, 114573. [Google Scholar] [CrossRef]
  27. Yeredla, R.R.; Xu, H. An Investigation of Nanostructured Rutile and Anatase Plates for Improving the Photosplitting of Water. Nanotechnology 2008, 19, 055706. [Google Scholar] [CrossRef] [PubMed]
  28. Boukhoubza, I.; Matei, E.; Jorio, A.; Enculescu, M.; Enculescu, I. Electrochemical Deposition of ZnO Nanowires on CVD-Graphene/Copper Substrates. Nanomaterials 2022, 12, 2858. [Google Scholar] [CrossRef] [PubMed]
  29. Landi, S., Jr. Comment on “Photocatalytic Degradation of RhB from an Aqueous Solution Using Ag3PO4/N-TiO2 Heterostructure” and “Evaluation of the Effect of Dose Change of Fe3O4 Nanoparticles on Electrochemical Biosensor Compatibility Using Hydrogels as an Experimental Living Organism Model. ” J. Mol. Liq. 2021, 338, 116635. [Google Scholar] [CrossRef]
  30. Landi, S., Jr.; Segundo, I.R.; Afonso, C.; Lima, O., Jr.; Costa, M.F.M.; Freitas, E.; Carneiro, J. Evaluation of Band Gap Energy of TiO2 Precipitated from Titanium Sulphate. Phys. B Condens. Matter 2022, 639, 414008. [Google Scholar] [CrossRef]
  31. Patel, M.; Chavda, A.; Mukhopadhyay, I.; Kim, J.; Ray, A. Nanostructured SnS with Inherent Anisotropic Optical Properties for High Photoactivity. Nanoscale 2016, 8, 2293–2303. [Google Scholar] [CrossRef]
  32. Emeline, A.V.; Rudakova, A.V.; Mikhaylov, R.V.; Bulanin, K.M.; Bahnemann, D.W. Photoactive Heterostructures: How They Are Made and Explored. Catalysts 2021, 11, 294. [Google Scholar] [CrossRef]
  33. Zhang, X.; Tang, A. Novel CuO/TiO2 Nanocomposite Films with a Graded Band Gap for Visible Light Irradiation. Mater. Express 2012, 2, 238–244. [Google Scholar] [CrossRef]
  34. Koohestani, H.; Sadrnezhaad, S.K. Photocatalytic Degradation of Methyl Orange and Cyanide by Using TiO2/CuO Composite. Desalination Water Treat. 2016, 57, 22029–22038. [Google Scholar] [CrossRef]
  35. Makuła, P.; Pacia, M.; Macyk, W. How to Correctly Determine the Band Gap Energy of Modified Semiconductor Photocatalysts Based on UV-Vis Spectra. J. Phys. Chem. Lett. 2018, 9, 6814–6817. [Google Scholar] [CrossRef] [PubMed] [Green Version]
  36. Escobedo-Morales, A.; Ruiz-López, I.I.; Ruiz-Peralta, M.D.; Tepech-Carrillo, L.; Sánchez-Cantú, M.; Moreno-Orea, J.E. Automated Method for the Determination of the Band Gap Energy of Pure and Mixed Powder Samples Using Diffuse Reflectance Spectroscopy. Heliyon 2019, 5, e01505. [Google Scholar] [CrossRef] [Green Version]
  37. Balık, M.; Bulut, V.; Erdogan, I.Y. Optical, Structural and Phase Transition Properties of Cu2O, CuO and Cu2O/CuO: Their Photoelectrochemical Sensor Applications. Int. J. Hydrogen Energy 2019, 44, 18744–18755. [Google Scholar] [CrossRef]
  38. van de Krol, R.; Grätzel, M. (Eds.) Photoelectrochemical Hydrogen Production; Springer: Boston, MA, USA, 2012; ISBN 9781461413790. [Google Scholar]
  39. Beranek, R. (Photo)Electrochemical Methods for the Determination of the Band Edge Positions of TiO2-Based Nanomaterials. Adv. Phys. Chem. 2011, 2011, 786759. [Google Scholar] [CrossRef] [Green Version]
  40. Zare, M.; Solaymani, S.; Shafiekhani, A.; Kulesza, S.; Ţălu, Ş.; Bramowicz, M. Evolution of Rough-Surface Geometry and Crystalline Structures of Aligned TiO2 Nanotubes for Photoelectrochemical Water Splitting. Sci. Rep. 2018, 8, 10870. [Google Scholar] [CrossRef] [Green Version]
  41. Nguyen, T.P.; Nguyen, D.L.T.; Nguyen, V.-H.; Le, T.-H.; Vo, D.-V.N.; Trinh, Q.T.; Bae, S.-R.; Chae, S.Y.; Kim, S.Y.; Van Le, Q. Recent Advances in TiO2-Based Photocatalysts for Reduction of CO2 to Fuels. Nanomaterials 2020, 10, 337. [Google Scholar] [CrossRef] [Green Version]
  42. Hamad, H.; Elsenety, M.M.; Sadik, W.; El-Demerdash, A.-G.; Nashed, A.; Mostafa, A.; Elyamny, S. The Superior Photocatalytic Performance and DFT Insights of S-Scheme CuO@TiO2 Heterojunction Composites for Simultaneous Degradation of Organics. Sci. Rep. 2022, 12, 2217. [Google Scholar] [CrossRef]
  43. Park, S.-M.; Razzaq, A.; Park, Y.H.; Sorcar, S.; Park, Y.; Grimes, C.A.; In, S.-I. Hybrid CuxO-TiO2 Heterostructured Composites for Photocatalytic CO2 Reduction into Methane Using Solar Irradiation: Sunlight into Fuel. ACS Omega 2016, 1, 868–875. [Google Scholar] [CrossRef] [Green Version]
  44. Konstantinova, E.; Savchuk, T.; Pinchuk, O.; Kytina, E.; Ivanova, E.; Volkova, L.; Zaitsev, V.; Pavlikov, A.; Elizarova, E. Photoelectron Properties and Organic Molecules Photodegradation Activity of Titania Nanotubes with CuxO Nanoparticles Heat Treated in Air and Argon. Molecules 2022, 27, 8080. [Google Scholar] [CrossRef] [PubMed]
  45. Savchuk, T.P.; Kytina, E.V.; Konstantinova, E.A.; Kytin, V.G.; Pinchuk, O.; Tarhanov, A.K.; Zaitsev, V.B.; Maniecki, T. Photocatalytic CO2 Conversion Using Anodic TiO2 Nanotube-CuxO Composites. Catalysts 2022, 12, 1011. [Google Scholar] [CrossRef]
  46. Aguirre, M.E.; Zhou, R.; Eugene, A.J.; Guzman, M.I.; Grela, M.A. Cu2O/TiO2 Heterostructures for CO2 Reduction through a Direct Z-Scheme: Protecting Cu2O from Photocorrosion. Appl. Catal. B 2017, 217, 485–493. [Google Scholar] [CrossRef]
Figure 1. EPD rate of TiO2 particles as a function of SDS content per 1 mg of TiO2 in suspension at different electric field strengths.
Nanomaterials 13 02030 g001
Figure 2. Photo images of TiO2 layers deposited from suspension with different contents of SDS per 1 mg of TiO2: (a) 0.06 mg, (b) 0.1 mg, (c) 0.14 mg, (d) 0.2 mg.
Nanomaterials 13 02030 g002
Figure 3. SEM image of layer surface (a), element mapping of layer surface (b) cross-section (c), cross-section element mapping (d) of TiO2–CuOx deposited from suspension with 20 wt.% CuOx.
Nanomaterials 13 02030 g003
Figure 4. TEM images of TiO2–CuOx aggregates in suspension with the addition of SDS: TEM (a) and STEM HAADF (b) images of a fragment of the aggregate; EDX maps of copper (c) and titanium (d) distribution; combined RGB image (e): Cu—red; Ti—blue; TEM image of the aggregate (f).
Nanomaterials 13 02030 g004
Figure 5. XRD pattern of TiO2–CuOx layers with 11 wt.% CuOx content.
Nanomaterials 13 02030 g005
Figure 6. Dependences of EPD rate of TiO2–CuOx layers on electric field strength.
Nanomaterials 13 02030 g006
Figure 7. Determination of the optical band gap of composites with different CuOx contents, colored solid line—experiment, dash line—linear fit.
Nanomaterials 13 02030 g007
Figure 8. Dependences of OCP on illumination time (a), OCPlight − OCPdark difference diagram of TiO2–CuOx composites (b).
Nanomaterials 13 02030 g008
Figure 9. Methanol yield over time (a) and the average methanol yield as a function of the copper oxide content in the layer (b).
Nanomaterials 13 02030 g009
Figure 10. Schematic illustration of the e/h+ pair generation mechanism at the TiO2–CuO contact.
Nanomaterials 13 02030 g010
Table 1. CuOx content, wt.% in the deposited layer as a function of CuOx wt.% in the suspension.
CuOx wt.% in the SuspensionCuOx wt.% in the Deposited Layer
31.5
105.5
2011
Table 2. Optical band gap of TiO2 and TiO2–CuOx layers formed by EPD method.
CuOx Content, wt.%Eg1opt, eVEg21opt, eVEg22opt, eV
0-3.083.08
1.51.412.893.13
5.51.442.553.25
111.442.033.36
1001.36--
Disclaimer/Publisher’s Note: The statements, opinions and data contained in all publications are solely those of the individual author(s) and contributor(s) and not of MDPI and/or the editor(s). MDPI and/or the editor(s) disclaim responsibility for any injury to people or property resulting from any ideas, methods, instructions or products referred to in the content.

