
Enhanced Fluorescence Characteristics of SrAl2O4: Eu2+, Dy3+ Phosphor by Co-Doping Gd3+ and Anti-Counterfeiting Application

 , ,
, ,
Abstract
:1. Introduction
2. Materials and Equipment
2.1. Materials and Synthesis
2.2. Instruments
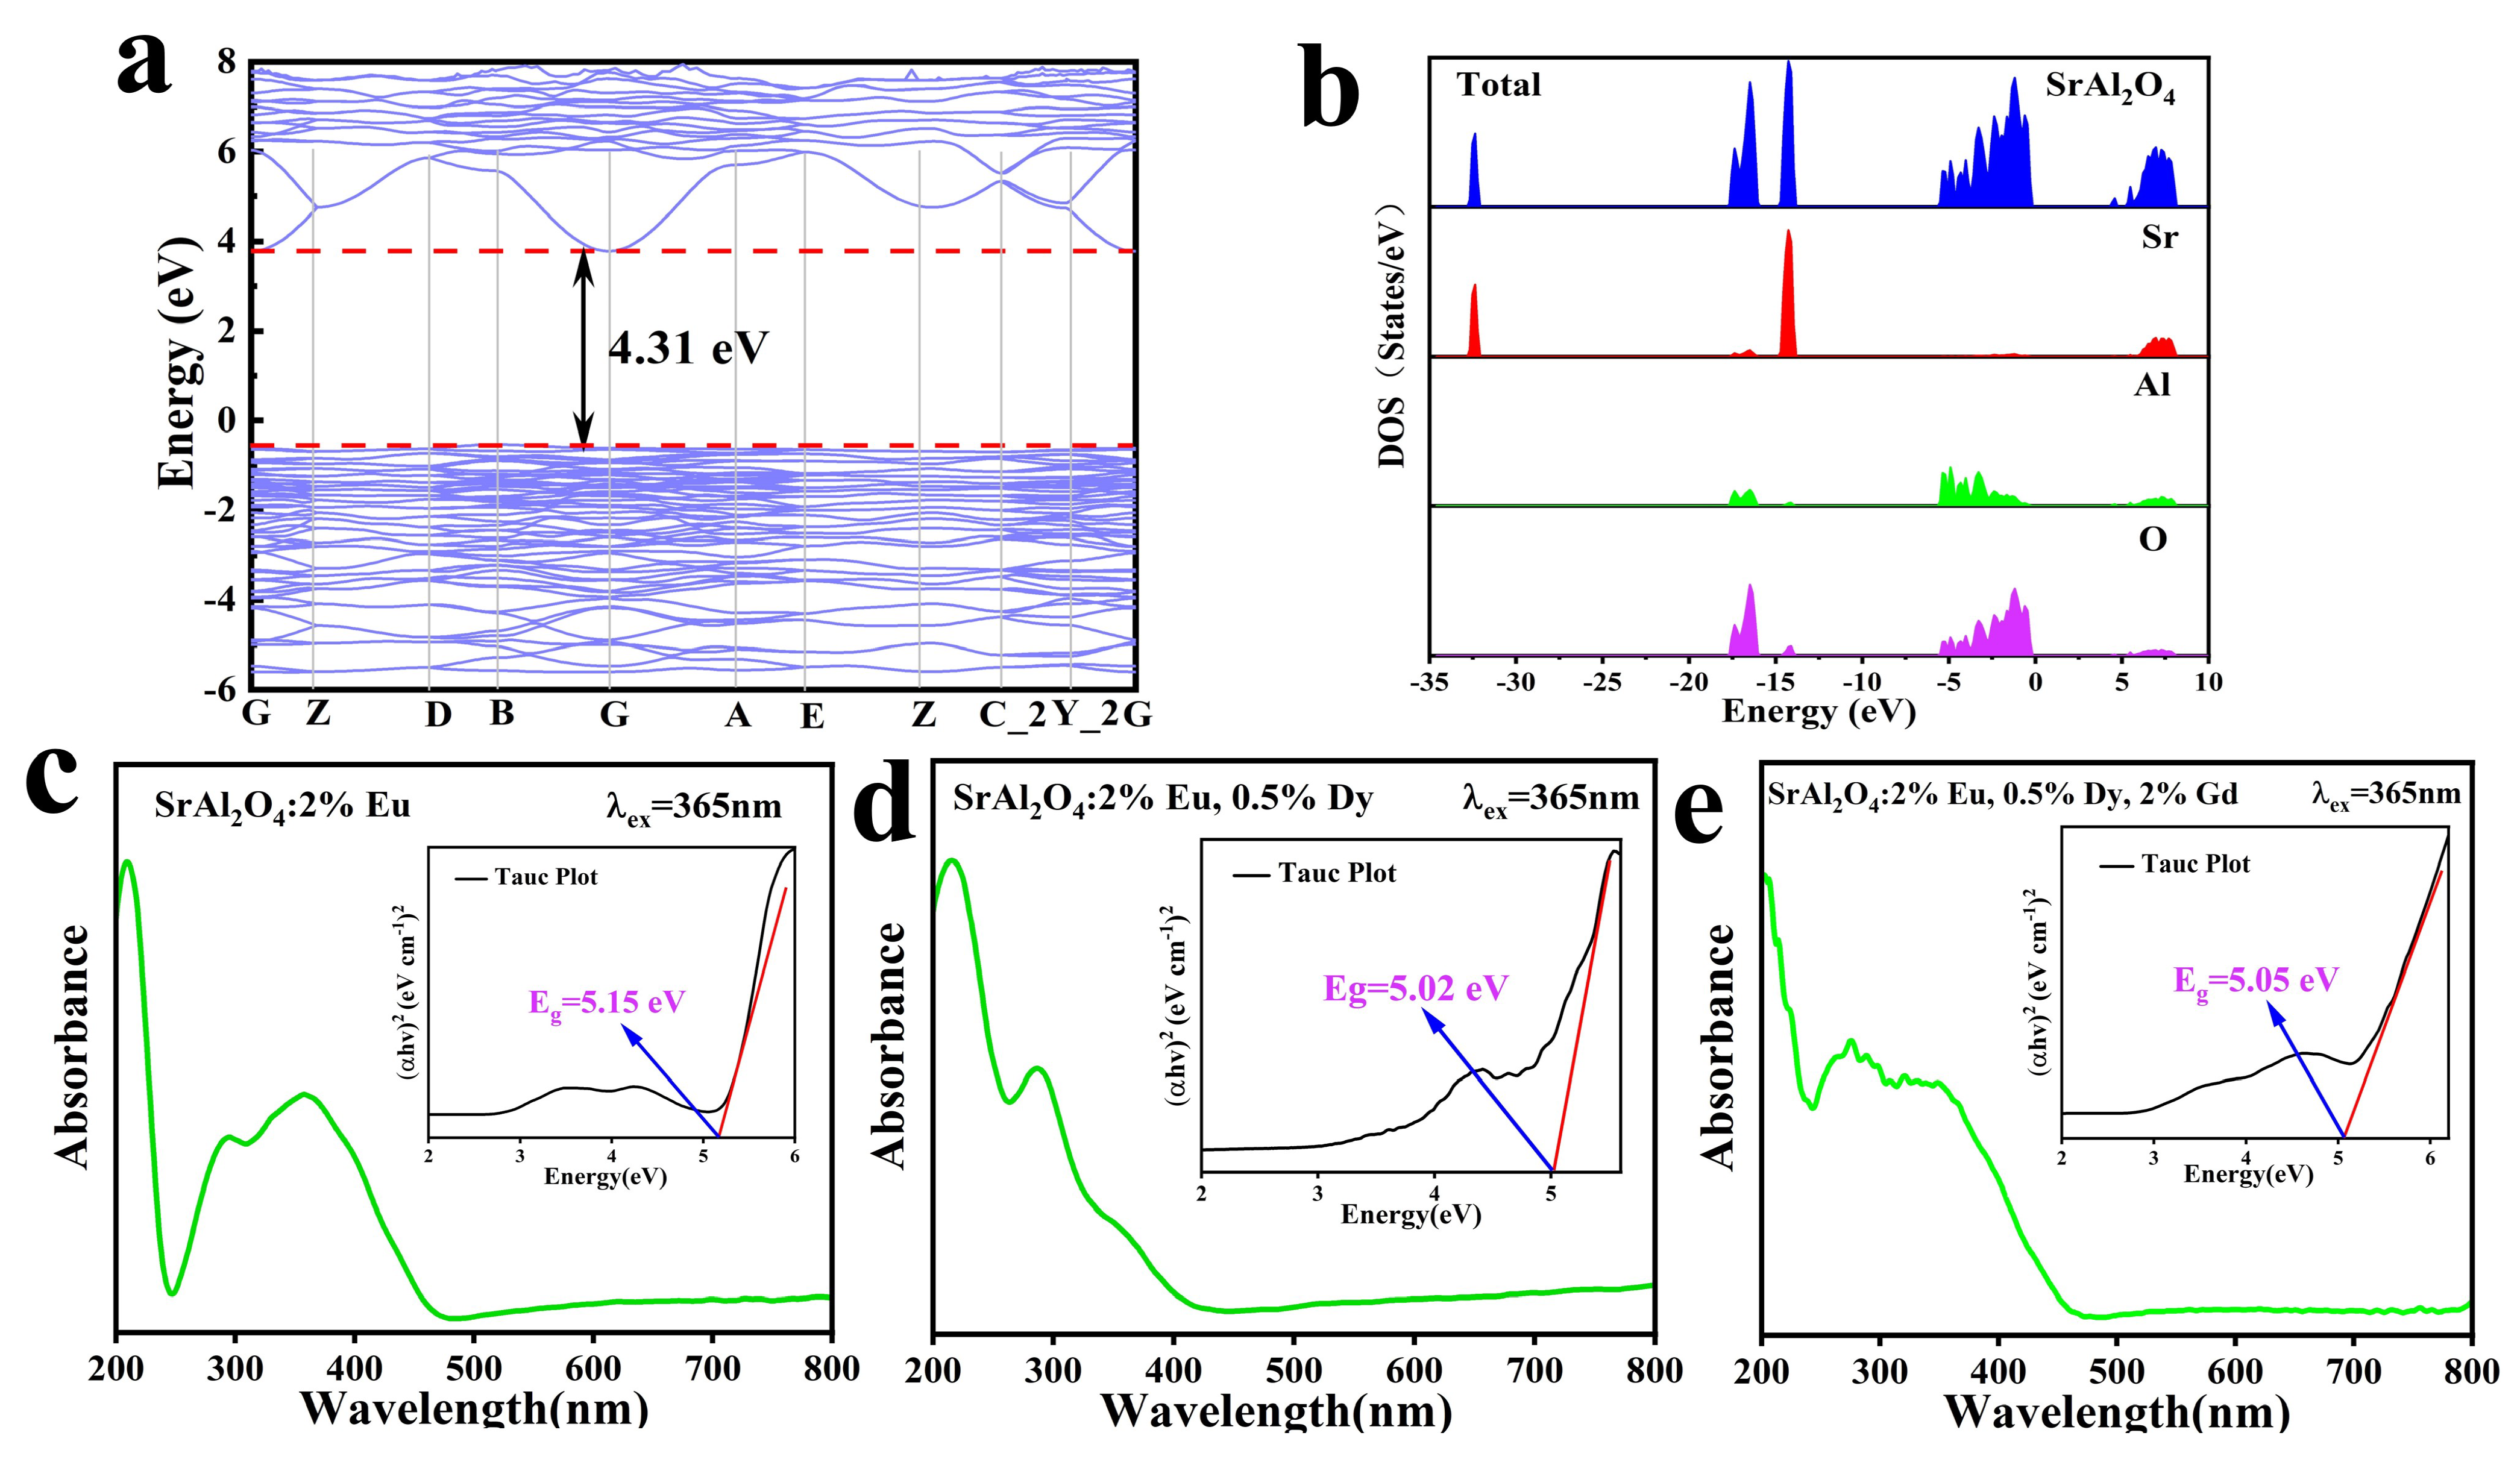
2.3. Band Structure and Density of States of SrAl2O4
2.4. Preparation of Ink
3. Results and Discussion
3.1. Phase Analysis
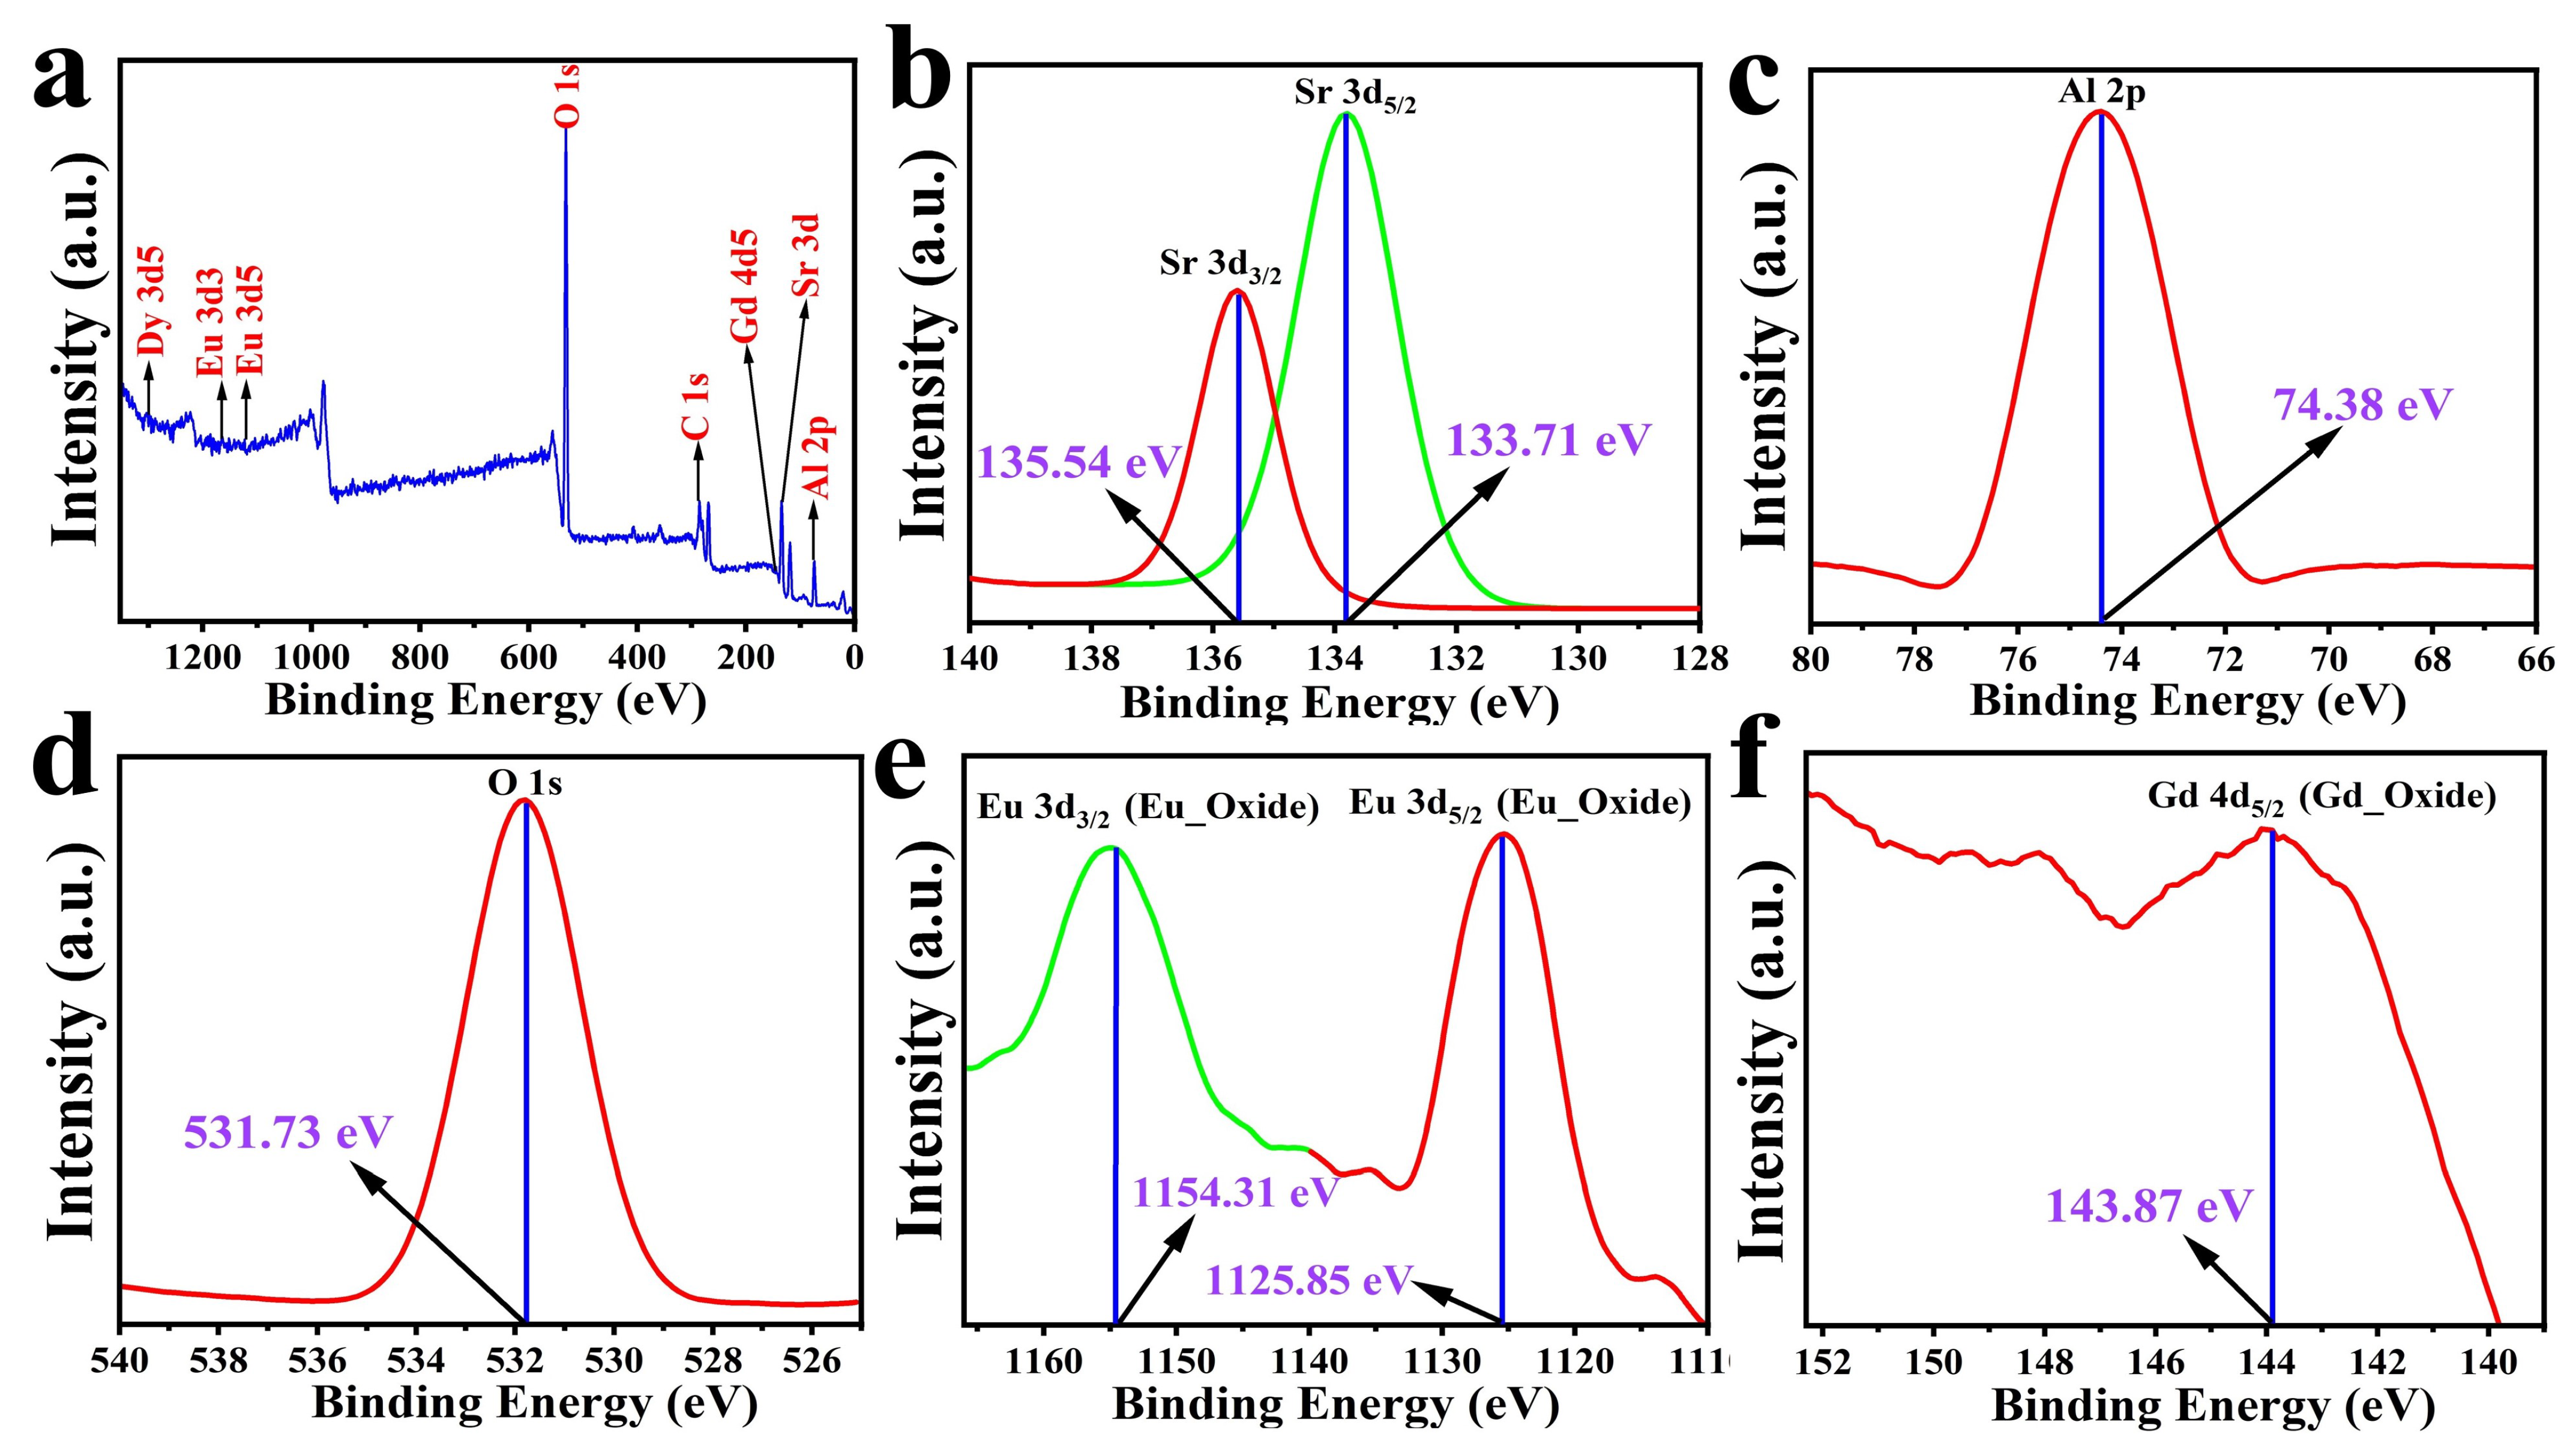
3.2. Elemental Analysis
3.3. SEM Analysis
3.4. Optical Characterization
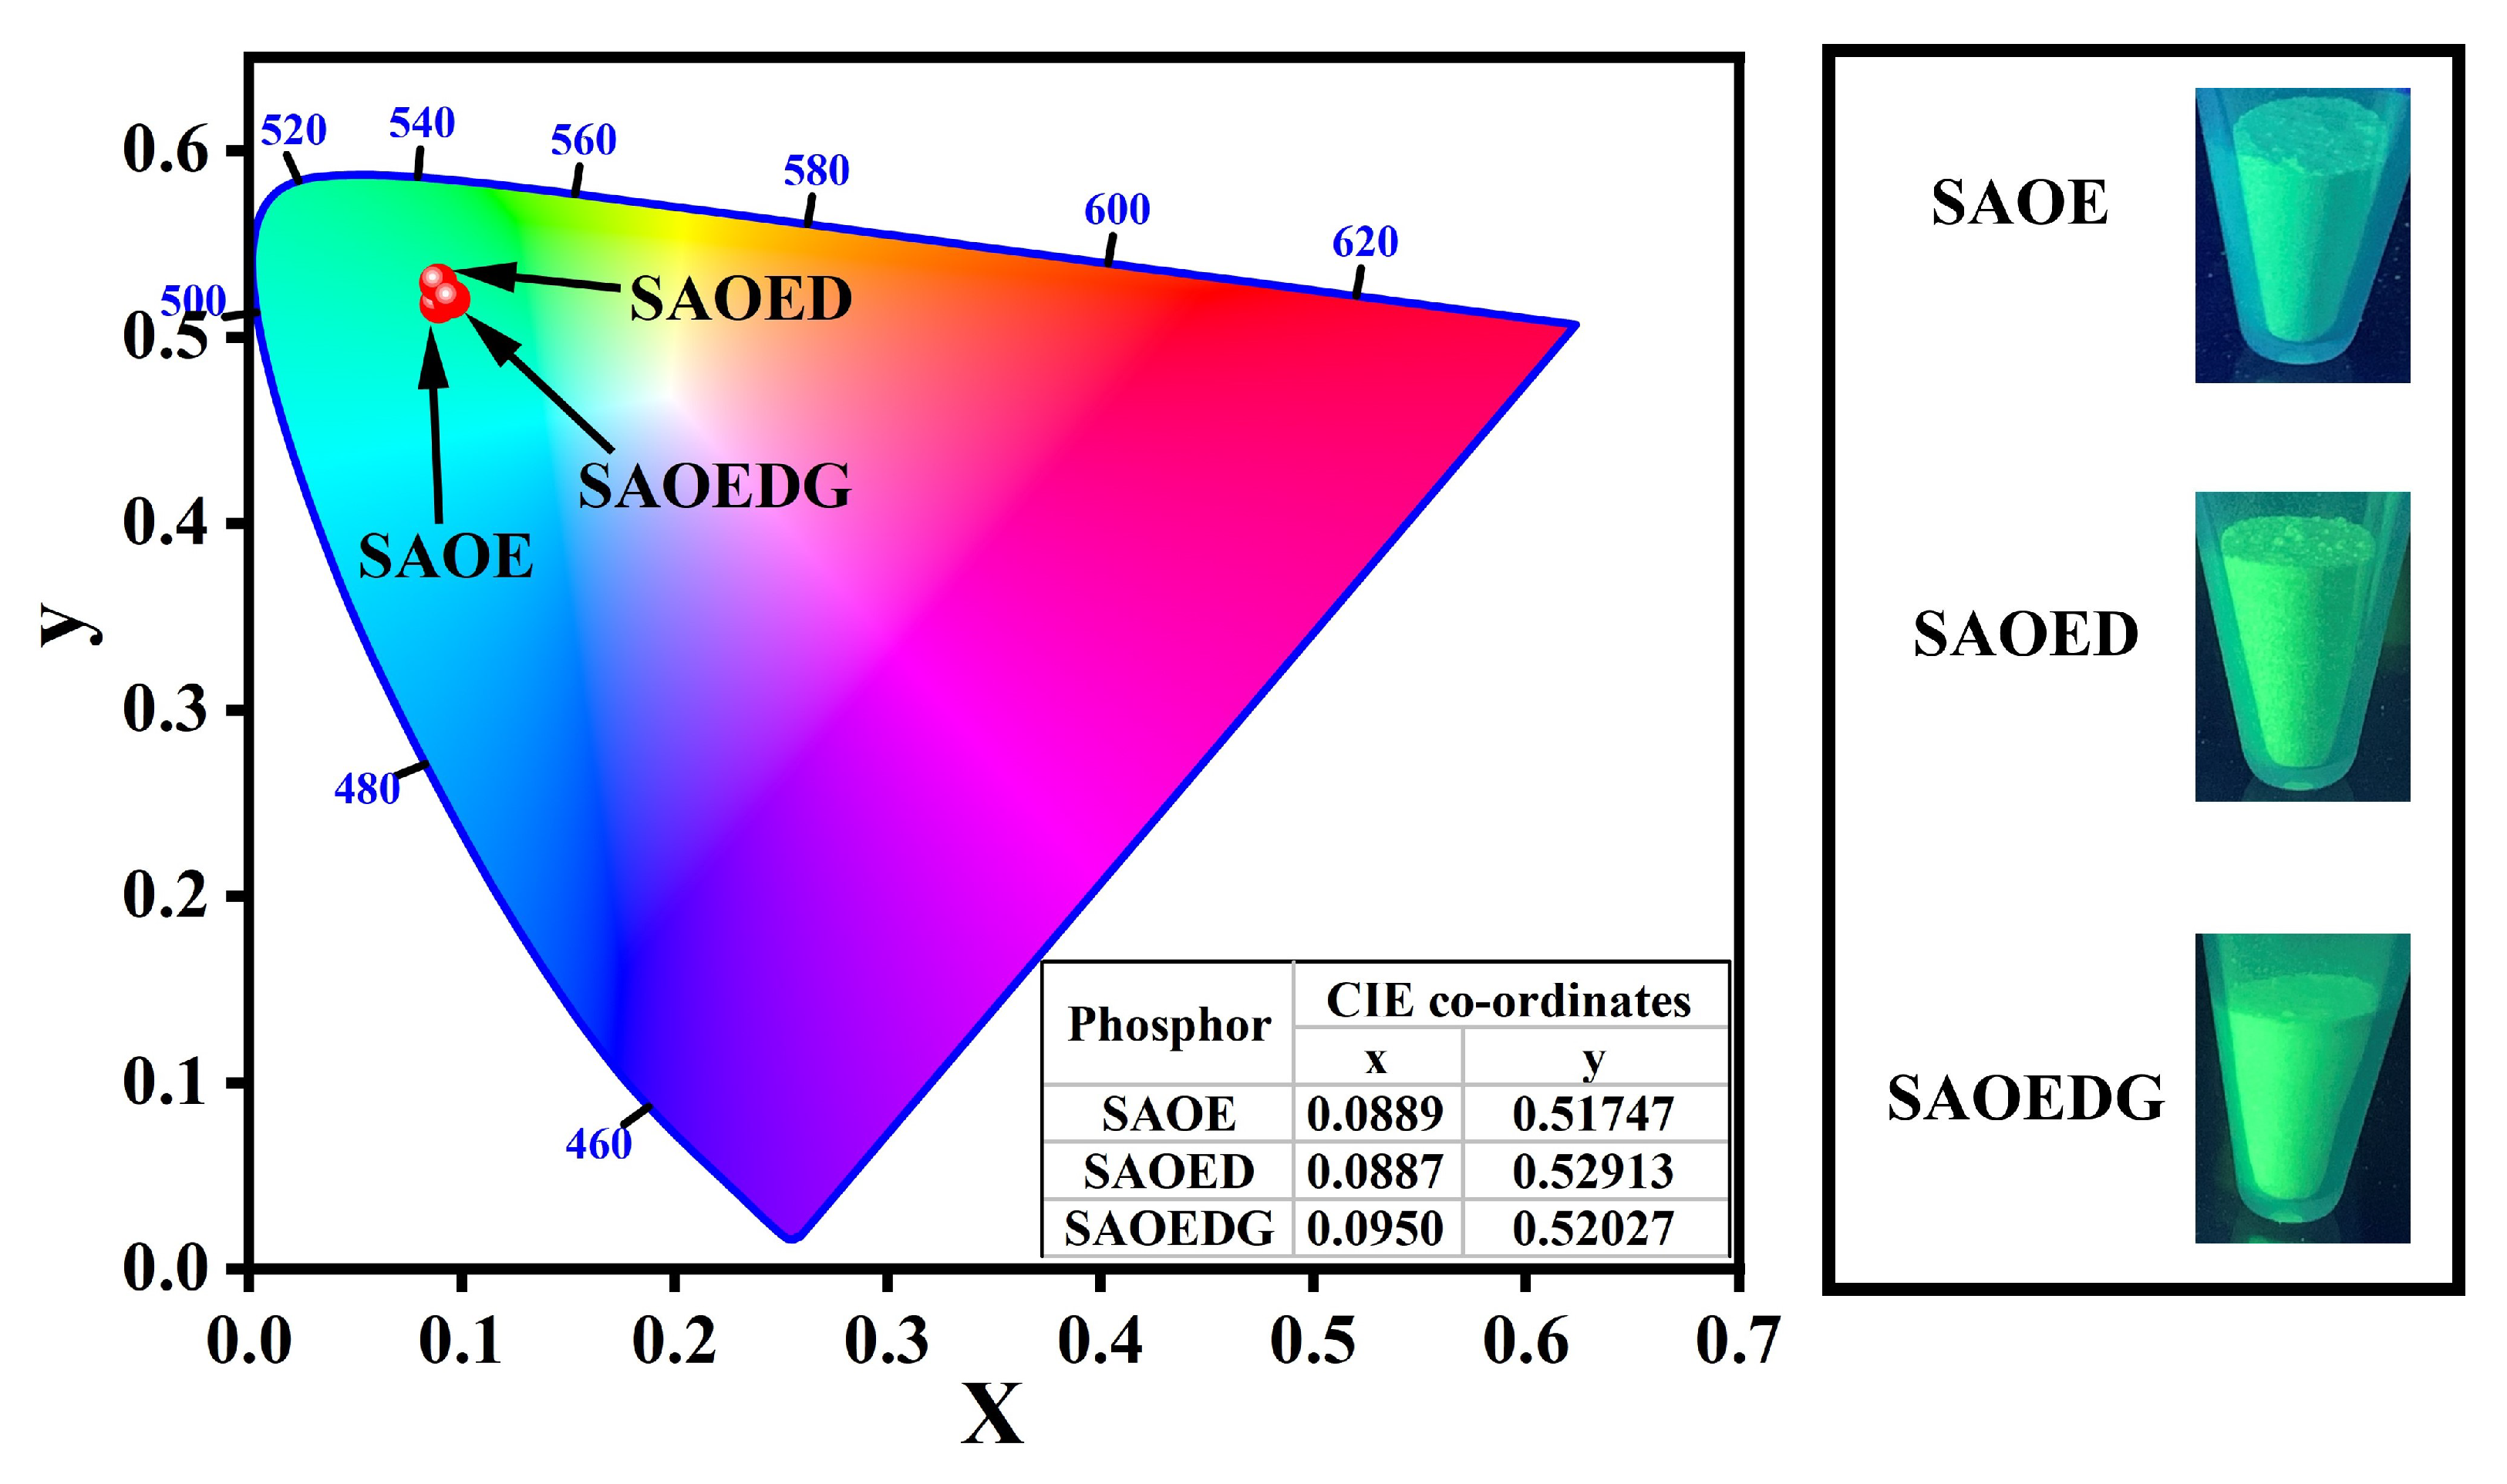
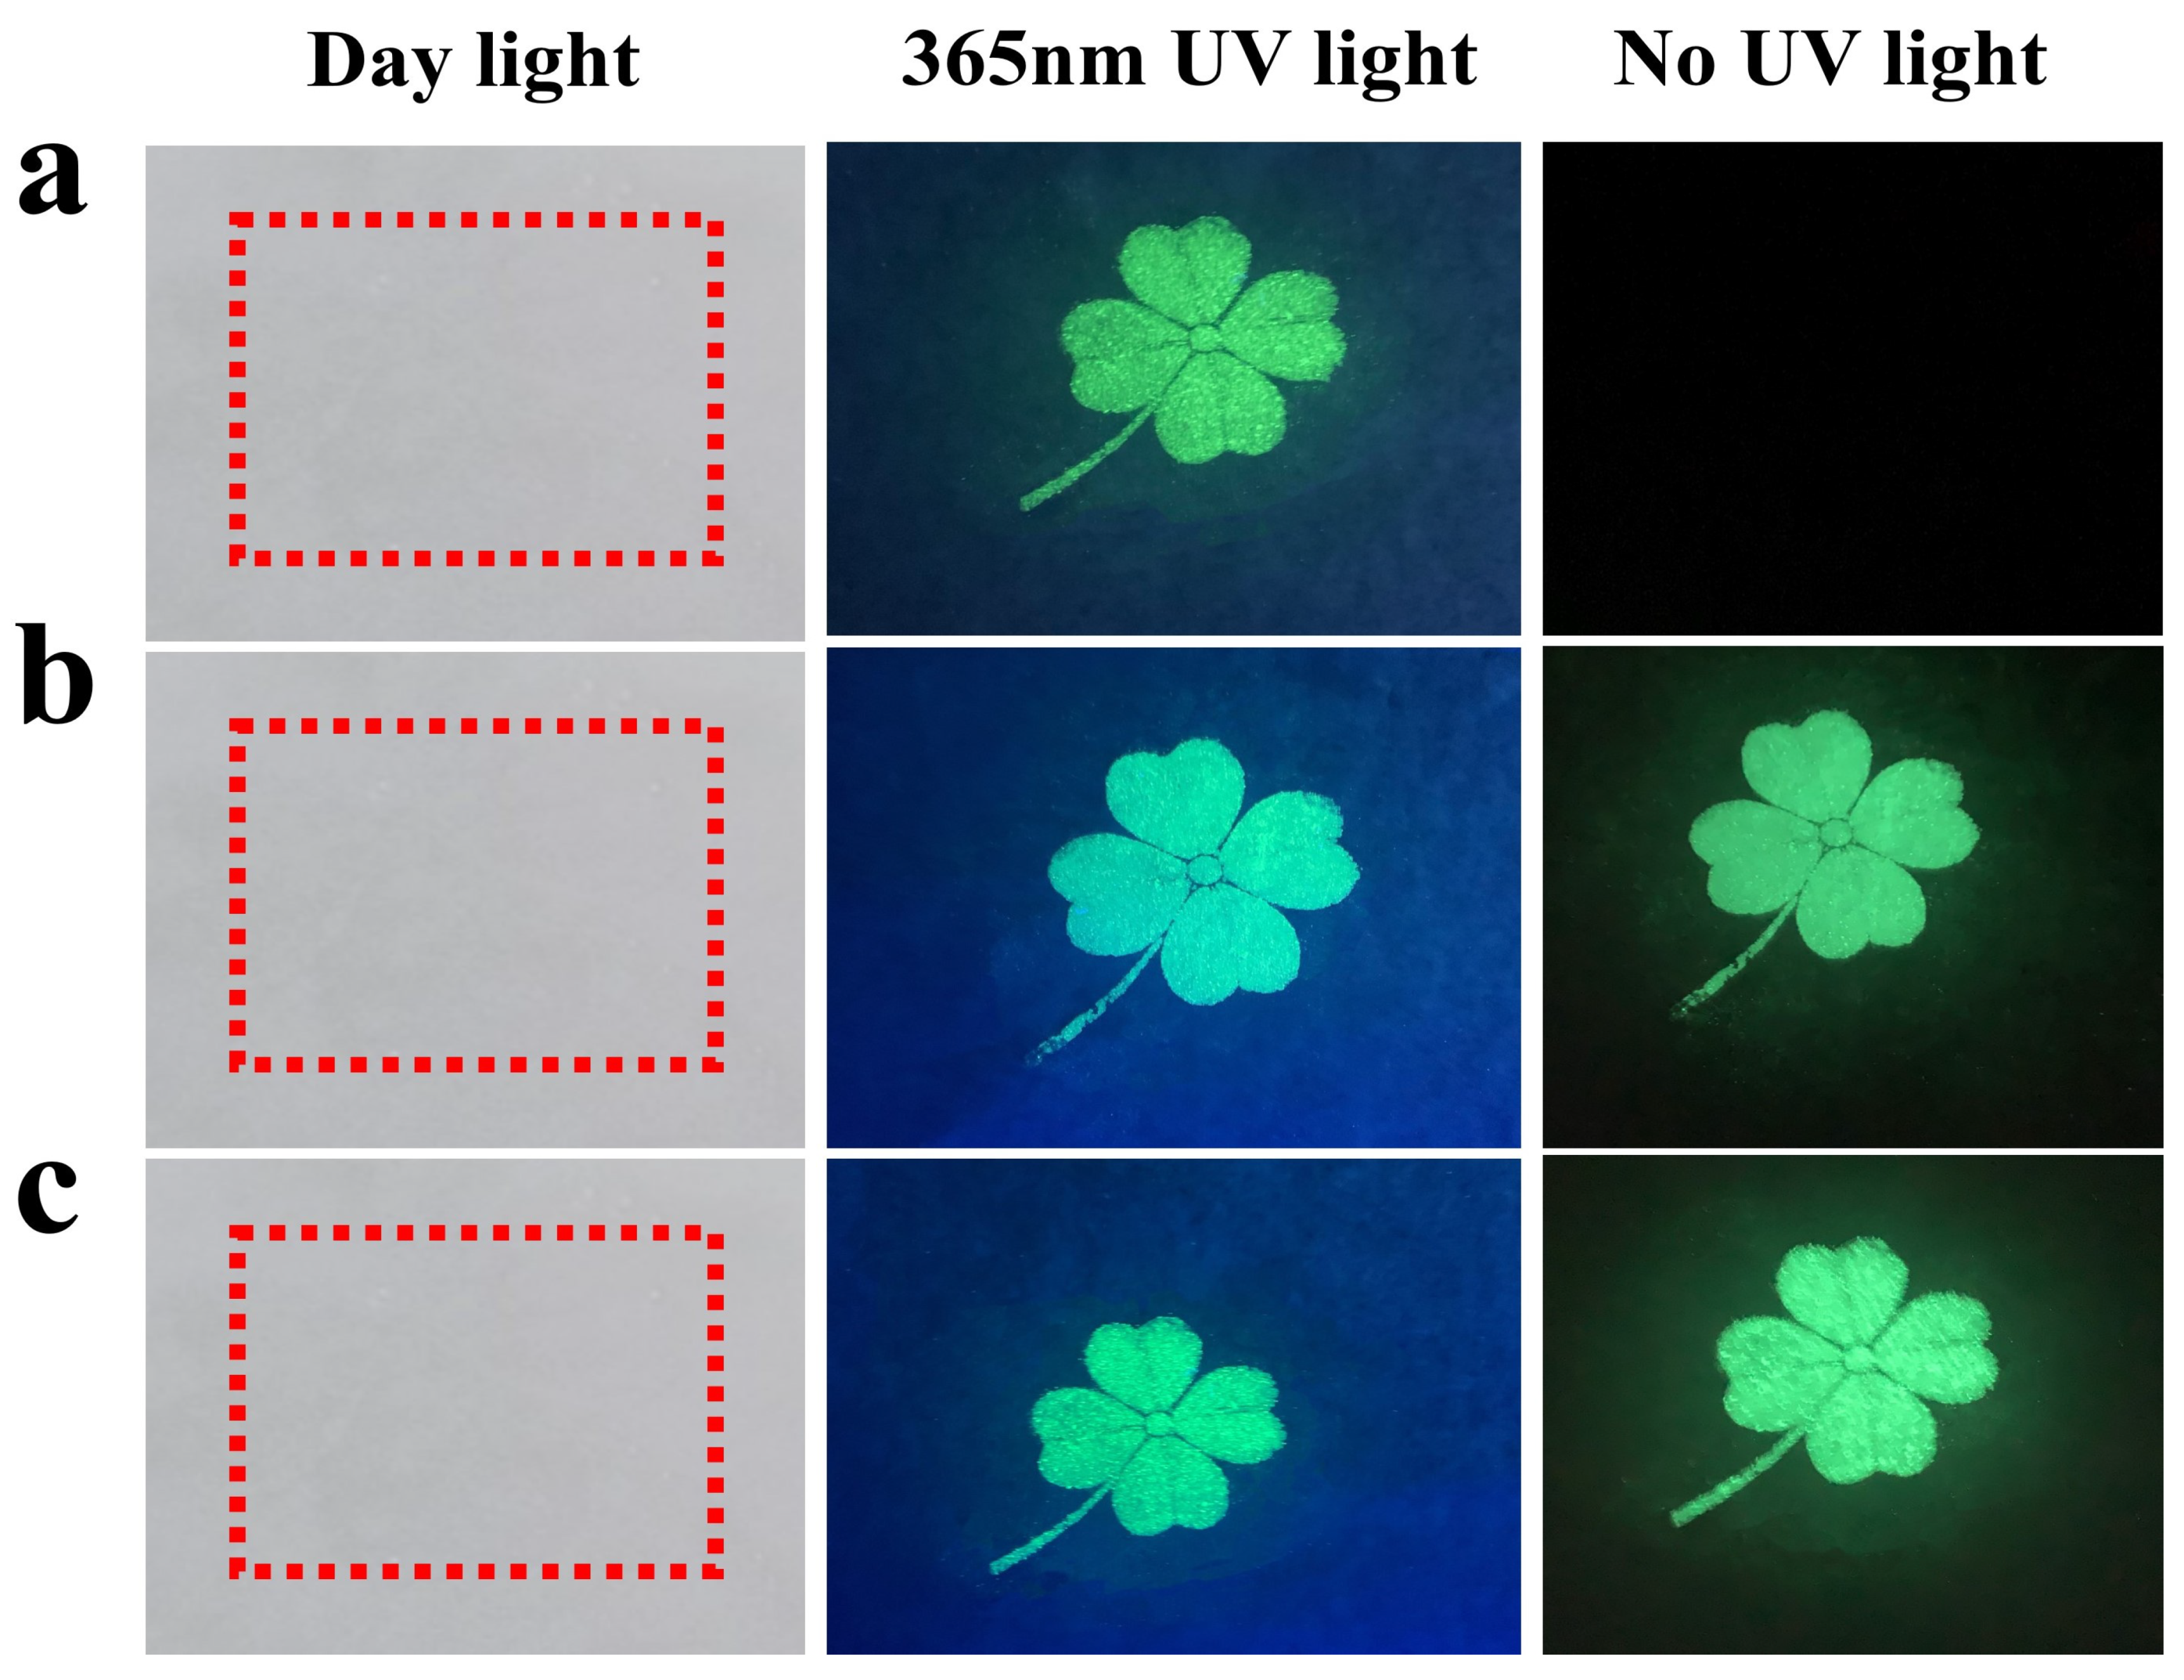
3.5. Anti-Counterfeiting Application
4. Conclusions
Author Contributions
Funding
Data Availability Statement
Conflicts of Interest
References
- Aroz, R.; Lennikov, V.; Cases, R.; Sanjuán, M.L.; de la Fuente, G.F.; Munoz, E. Laser synthesis and luminescence properties of SrAl2O4: Eu2+, Dy3+ phosphors. J. Eur. Ceram. Soc. 2012, 32, 4363–4369. [Google Scholar] [CrossRef] [Green Version]
- Tang, Z.; Zhang, F.; Zhang, Z.; Huang, C.; Lin, Y. Luminescent properties of SrAl2O4: Eu, Dy material prepared by the gel method. J. Eur. Ceram. Soc. 2000, 20, 2129–2132. [Google Scholar] [CrossRef]
- Xiong, P.; Peng, M. Recent advances in ultraviolet persistent phosphors. Opt. Mater. 2019, 2, 100022. [Google Scholar] [CrossRef]
- Lazău, R.; Ianoș, R.; Păcurariu, C.; Căpraru, A. Comparative study on SrAl2O4 formation using different approaches. Ceram. Int. 2022, 48, 13271–13276. [Google Scholar] [CrossRef]
- Ye, C.; Bando, Y.; Shen, G.; Golberg, D. Formation of Crystalline SrAl2O4 Nanotubes by a Roll-Up and Post-Annealing Approach. Angew. Chem. 2006, 118, 5044–5048. [Google Scholar] [CrossRef]
- Cheng, Y.; Zhao, Y.; Zhang, Y.; Cao, X. Preparation of SrAl2O4: Eu2+, Dy3+ fibers by electrospinning combined with sol–gel process. J. Colloid Interface Sci. 2010, 344, 321–326. [Google Scholar] [CrossRef]
- Matsuzawa, T.; Yamamoto, H. Mechanism of long phosphorescence of SrAl2O4: Eu2+, Dy3+ and CaAl2O4: Eu2+, Nd3+. J. Lumin. 1997, 47, 72–74. [Google Scholar]
- Jia, W.; Yuan, H.; Holmstrom, S.; Liu, H.; Yen, W. Photo-stimulated luminescence in SrAl2O4: Eu2+, Dy3+ single crystal fibers. J. Lumin. 1999, 83, 465–469. [Google Scholar] [CrossRef]
- Xu, Y.F.; Ma, D.K.; Guan, M.L.; Chen, X.A.; Pan, Q.Q.; Huang, S.M. Controlled synthesis of single-crystal SrAl2O4: Eu2+, Dy3+ nanosheets with long-lasting phosphorescence. J. Alloy Compd. 2010, 502, 38–42. [Google Scholar] [CrossRef]
- Zeng, P.; Wei, X.; Yin, M.; Chen, Y. Investigation of the long afterglow mechanism in SrAl2O4: Eu2+/Dy3+ by optically stimulated luminescence and thermoluminescence. J. Lumin. 2018, 199, 400–406. [Google Scholar] [CrossRef]
- Wang, Z.; Ma, G.; Bu, X.; Mi, R.; Chen, J.; Liu, Y. Dual-driven ratiometric luminescence behaviour of Eu2+ and Eu3+ in a single host of SrAl2O4 prepared in ambient atmosphere. J. Alloy Compd. 2023, 941, 168912. [Google Scholar] [CrossRef]
- Gao, W.; Ge, W.; Shi, J.; Tian, Y.; Zhu, J.; Li, Y. Stretchable, flexible, and transparent SrAl2O4: Eu2+ @ TPU ultraviolet stimulated anti-counterfeiting film. Chem. Eng. J. 2021, 405, 126949. [Google Scholar] [CrossRef]
- Vitola, V.; Lahti, V.; Bite, I.; Spustaka, A.; Millers, D.; Lastusaari, M.; Petit, L.; Smits, K. Low temperature afterglow from SrAl2O4: Eu, Dy, B containing glass. Scr. Mater. 2021, 190, 86–90. [Google Scholar] [CrossRef]
- Johari, M.; Rajabi, M.; Mohammadi, V. Production of SrAl2O4: Eu2+, Dy3+ green-emitting phosphor nano-pigment powders via microwave processing route. Pigment. Resin Technol. 2017, 46, 85–91. [Google Scholar] [CrossRef]
- Kostova, M.H.; Zollfrank, C.; Batentschuk, M.; Goetz-Neunhoeffer, F.; Winnacker, A.; Greil, P. Bioinspired design of SrAl2O4: Eu2+ phosphor. Adv. Funct. Mater. 2009, 19, 599–603. [Google Scholar] [CrossRef]
- Zhu, D.; Shao, L.; Yu, M.; Cheng, R.; Desiatov, B.; Xin, C.; Hu, Y.; Holzgrafe, J.; Ghosh, S.; Shams-Ansari, A.; et al. Integrated photonics on thin-film lithium niobate. Adv. Opt. Photonics 2021, 13, 242–352. [Google Scholar] [CrossRef]
- Wang, X.; Chen, Y.; Kner, P.A.; Pan, Z. Gd3+ -activated narrowband ultraviolet-B persistent luminescence through persistent energy transfer. Dalton Trans. 2021, 50, 3499–3505. [Google Scholar] [CrossRef] [PubMed]
- Song, H.; Chen, D.; Tang, W.; Peng, Y. Synthesis of SrAl2O4: Eu2+, Dy3+, Gd3+ phosphor by combustion method and its phosphorescence properties. Displays 2008, 29, 41–44. [Google Scholar] [CrossRef]
- Liu, S.; Wang, J.; Tang, F.; Wang, N.; Li, L.; Yao, C.; Li, L. Aqueous systems with tunable fluorescence including white-light emission for anti-counterfeiting fluorescent inks and hydrogels. ACS Appl. Mater. Interfaces 2020, 12, 55269–55277. [Google Scholar] [CrossRef]
- Ghezelsefloo, S.; Rad, J.K.; Hajiali, M.; Mahdavian, A.R. Rhodamine-based fluorescent polyacrylic nanoparticles: A highly selective and sensitive chemosensor for Fe (II) and Fe (III) cations in water. J. Environ. Chem. Eng. 2021, 9, 105082. [Google Scholar] [CrossRef]
- Kresse, G.; Furthmüller, J. Efficient iterative schemes for ab initio total-energy calculations using a plane-wave basis set. Phys. Rev. B. 1996, 54, 11169–11186. [Google Scholar] [CrossRef]
- Perdew, J.P.; Burke, K.; Ernzerhof, M. Generalized Gradient Approximation Made Simple university. Phys. Rev. Lett. 1996, 77, 3865–3868. [Google Scholar] [CrossRef] [Green Version]
- Kresse, G.; Joubert, D. From ultrasoft pseudopotentials to the projector augmented-wave method. Phys. Rev. B. 1999, 59, 1758–1775. [Google Scholar] [CrossRef]
- Liu, Y.; Xu, C.N. Influence of calcining temperature on photoluminescence and triboluminescence of europium-doped strontium aluminate particles prepared by sol- gel process. J. Phys. Chem. B 2003, 107, 3991–3995. [Google Scholar] [CrossRef]
- Vitola, V.; Millers, D.; Bite, I.; Smits, K.; Spustaka, A. Recent progress in understanding the persistent luminescence in SrAl2O4: Eu, Dy. Mater. Sci. Technol. 2019, 35, 1661–1677. [Google Scholar] [CrossRef]
- Zhai, B.-G.; Huang, Y.-M. Green Afterglow of Undoped SrAl2O4. Nanomaterials 2021, 11, 2331. [Google Scholar] [CrossRef] [PubMed]
- Singh, V.; Singh, N.; Pathak, M.; Natarajan, V. Annealing Effect on the Structural, Optical and EPR Properties of UV Radiation Emitting Gd3+ Doped SrAl2O4 Host. J. Electron. Mater. 2019, 48, 238–243. [Google Scholar] [CrossRef]
- Lin, Y.; Zhang, Z.; Zhang, F.; Tang, Z.; Chen, Q. Preparation of the ultrafine SrAl2O4: Eu, Dy needle-like phosphor and its optical properties. Mater. Chem. Phys. 2000, 65, 103–106. [Google Scholar] [CrossRef]
- Shannon, R.D. Revised effective ionic radii and systematic studies of interatomic distances in halides and chalcogenides. Acta Crystallogr. Sect. A Cryst. Physics, Diffraction, Theor. Gen. Crystallogr. 1976, 32, 751–767. [Google Scholar] [CrossRef]
- Wang, C.; Li, Y.; Chen, S.; Li, Y.; Lv, Q.; Shao, B.; Zhu, G.; Zhao, L. A novel high efficiency and ultra-stable red emitting europium doped pyrophosphate phosphor for multifunctional applications. Inorg. Chem. Front. 2021, 8, 3984–3997. [Google Scholar] [CrossRef]
- Du, H.; Shan, W.; Wang, L.; Xu, D.; Yin, H.; Chen, Y.; Guo, D. Optimization and complexing agent-assisted synthesis of green SrAl2O4: Eu2+, Dy3+ phosphors through sol–gel process. J. Lumin. 2016, 176, 272–277. [Google Scholar] [CrossRef]
- Feng, W.L. Preparation and luminescent properties of green SrAl2O4: Eu2+ and blue SrAl2O4: Eu2+, Gd3+ phosphors. Mater. Lett. 2013, 110, 91–93. [Google Scholar] [CrossRef]
- Gültekin, S.; Yıldırım, S.; Yılmaz, O.; Keskin, İ.Ç.; Katı, M.İ.; Çelik, E. Structural and optical properties of SrAl2O4: Eu2+/Dy3+ phosphors synthesized by flame spray pyrolysis technique. J. Lumin. 2019, 206, 59–69. [Google Scholar] [CrossRef]
- Singh, D.; Tanwar, V.; Samantilleke, A.P.; Mari, B.; Bhagwan, S.; Kadyan, P.S.; Singh, I. Preparation and Photoluminescence Properties of SrAl2O4: Eu2+, RE3+ Green Nanophosphors for Display Device Applications. J. Electron. Mater. 2016, 45, 2718–2724. [Google Scholar] [CrossRef]
- Poornaprakash, B.; Chalapathi, U.; Reddeppa, M.; Park, S.H. Effect of Gd doping on the structural, luminescence and magnetic properties of ZnS nanoparticles synthesized by the hydrothermal method. Superlattices Microstruct. 2016, 97, 104–109. [Google Scholar] [CrossRef]
- Cao, J.; Ding, S.; Zhou, Y.; Ma, X.; Wang, Y. Enhancing the luminescence performance of Ca2-xSrxBO3Cl: Eu2+, Dy3+ by substitution of Sr2+ for Ca2+. J. Mater. Chem. C 2022, 10, 12266–12275. [Google Scholar] [CrossRef]
- Feilong, S.; Junwu, Z. Blue-green BaAl2O4: Eu2+, Dy3+ phosphors synthesized via combustion synthesis method assisted by microwave irradiation. J. Rare Earths 2011, 29, 326–329. [Google Scholar]
- Schläfer, H.L.; Gliemann, G.; Gliemann, G. Basic Principles of Ligand Field Theory; Wiley: Hoboken, NJ, USA, 1969. [Google Scholar]
- Feng, W.; Zheng, W.; Liu, H. Crystal Field Theory and its Applications in Material Science; Southwest Jiaotong University Press: Chengdu, China, 2011. [Google Scholar]
- Zhang, L.; Lyu, S.; Zhang, Q.; Wu, Y.; Melcher, C.; Chmely, S.C.; Chen, Z.; Wang, S. Dual-emitting film with cellulose nanocrystal-assisted carbon dots grafted SrAl2O4, Eu2+, Dy3+ phosphors for temperature sensing. Carbohydr. Polym. 2019, 206, 767–777. [Google Scholar] [CrossRef]
- Chen, L.; Zhang, Y.; Liu, F.; Luo, A.; Chen, Z.; Jiang, Y.; Chen, S.; Liu, R.S. A new green phosphor of SrAl2O4: Eu2+, Ce3+, Li+ for alternating current driven light-emitting diodes. Mater. Res. Bull. 2012, 47, 4071–4075. [Google Scholar] [CrossRef]
- Pei, P.; Wei, R.; Wang, B.; Su, J.; Zhang, Z.; Liu, W. An advanced tunable multimodal luminescent La4GeO8: Eu2+, Er3+ phosphor for multicolor anticounterfeiting. Adv. Funct. Mater. 2021, 31, 2102479. [Google Scholar] [CrossRef]
- Zhang, Y.; Qiao, X.; Wan, J.; Wu, L.A.; Chen, B.; Fan, X. Facile synthesis of monodisperse YAG: Ce3+ microspheres with high quantum yield via an epoxide-driven sol–gel route. J. Mater. Chem. 2017, 5, 8952–8957. [Google Scholar]
- Wan, J.; Zhang, Y.; Wang, Y.; Ma, R.; Wu, Y.; Qiao, X.; Fan, X. Facile synthesis of monodisperse SrAl2O4: Eu2+ cage-like microspheres with an excellent luminescence quantum yield. J. Mater. Chem. 2018, 6, 3346–3351. [Google Scholar] [CrossRef]
- Amin, M.R.; Strobel, P.; Schnick, W.; Schmidt, P.J.; Moewes, A. Energy levels of Eu2+ states in the next-generation LED-phosphor SrLi2Al2O2N2: Eu2+. J. Mater. Chem. 2022, 10, 9740–9747. [Google Scholar] [CrossRef]
- Liang, P.; Lian, W.L.; Liu, Z.H. Highly efficient blue-emitting phosphor of Sr[B8O11(OH)4]: Eu2+ prepared by a self-reduction method. Chem. Commun. 2021, 57, 3371–3374. [Google Scholar] [CrossRef] [PubMed]
- Pei, P.; Liu, K.; Ju, Z.; Wei, R.; Liu, W. Achieving mechano-upconversion-downshifting-afterglow multimodal luminescence in Pr3+/Er3+ coactivated Ba2Ga2GeO7 for multidimensional anticounterfeiting. J. Mater. Chem. C 2022, 10, 5240–5248. [Google Scholar] [CrossRef]
- Nazarov, M.; Brik, M.; Spassky, D.; Tsukerblat, B.; Nazida, A.N.; Ahmad-Fauzi, M. Structural and electronic properties of SrAl2O4: Eu2+ from density functional theory calculations. J. Alloy Compd. 2013, 573, 6–10. [Google Scholar] [CrossRef]
- Mkhalid, I. Hydrogen evolution over sol-gel prepared visible-light-responsive Ag2O/SrAl2O4/CNT ternary photocatalyst. Ceram. Int. 2022, 48, 1542–1549. [Google Scholar] [CrossRef]
- Akbudak, S.; Candan, A.; Kushwaha, A.; Yadav, A.; Uğur, G.; Uğur, Ş. Structural, elastic, electronic and vibrational properties of XAl2O4 (X= Ca, Sr and Cd) semiconductors with orthorhombic structure. J. Alloy Compd. 2019, 809, 151773. [Google Scholar] [CrossRef]
- Bo, L.; Mu, G.; Xiaolin, L.; Shiming, H.; Chen, N. Theoretical study of structural, electronic, lattice dynamical and dielectric properties of SrAl2O4. J. Alloy Compd. 2011, 509, 4300–4303. [Google Scholar]
- Yang, Y.; Jiang, H.; Xu, D.; Hai, O.; Yang, T. Preparation of SrAl2O4: Eu2+, Dy3+ phosphors using propylene oxide as gel agent and its optical properties. Mater. Res. Express 2018, 5, 016201. [Google Scholar] [CrossRef]
- Gencel, O.; Danish, A.; Yilmaz, M.; Erdogmus, E.; Sutcu, M.; Ozbakkaloglu, T.; Gholampour, A. Experimental evaluation of the luminescence performance of fired clay brick coated with SrAl2O4: Eu/Dy phosphor. Ceram. Int. 2022, 48, 33167–33176. [Google Scholar] [CrossRef]
- Liu, J.; Li, G.; Guo, H.; Liu, D.; Feng, P.; Wang, Y. Design, synthesis and characterization of a novel bluish-green long-lasting phosphorescence phosphor BaLu2Si3O10: Eu2+, Nd3+. RSC Adv. 2018, 8, 10246–10254. [Google Scholar] [CrossRef] [PubMed]
- Sahu, I.P. Enhance luminescence by introducing alkali metal ions (R+= Li+, Na+ and K+) in SrAl2O4: Eu3+ phosphor by solid-state reaction method. Radiat. Eff. Defects Solids 2016, 171, 511–527. [Google Scholar] [CrossRef]


| 2 | FWHM () | Lattice Spacing (d) | Intensity (I) | hkl | Crystallite Size (D) |
|---|---|---|---|---|---|
| 19.951 | 0.298 | 4.447 | 52 | 011 | 27.068 |
| 28.386 | 0.286 | 3.142 | 100 | −211 | 28.652 |
| 29.275 | 0.257 | 3.048 | 91 | 220 | 31.949 |
| 29.922 | 0.276 | 2.984 | 76 | 211 | 29.794 |
| 35.113 | 0.350 | 2.554 | 69 | 031 | 23.807 |
| 2 | FWHM () | Lattice Spacing (d) | Intensity (I) | hkl | Crystallite Size (D) |
|---|---|---|---|---|---|
| 19.951 | 0.231 | 4.447 | 52 | 011 | 34.858 |
| 28.386 | 0.256 | 3.142 | 100 | −211 | 31.944 |
| 29.275 | 0.235 | 3.048 | 91 | 220 | 34.890 |
| 29.922 | 0.251 | 2.984 | 76 | 211 | 32.826 |
| 35.113 | 0.362 | 2.554 | 69 | 031 | 23.048 |
| 2 | FWHM () | Lattice Spacing (d) | Intensity (I) | hkl | Crystallite Size (D) |
|---|---|---|---|---|---|
| 19.951 | 0.222 | 4.447 | 52 | 011 | 36.285 |
| 28.386 | 0.265 | 3.142 | 100 | −211 | 30.899 |
| 29.275 | 0.279 | 3.048 | 91 | 220 | 29.467 |
| 29.922 | 0.308 | 2.984 | 76 | 211 | 26.709 |
| 35.113 | 0.320 | 2.554 | 69 | 031 | 26.074 |
| Sample | Decay Lifetime (ns) | |||||
|---|---|---|---|---|---|---|
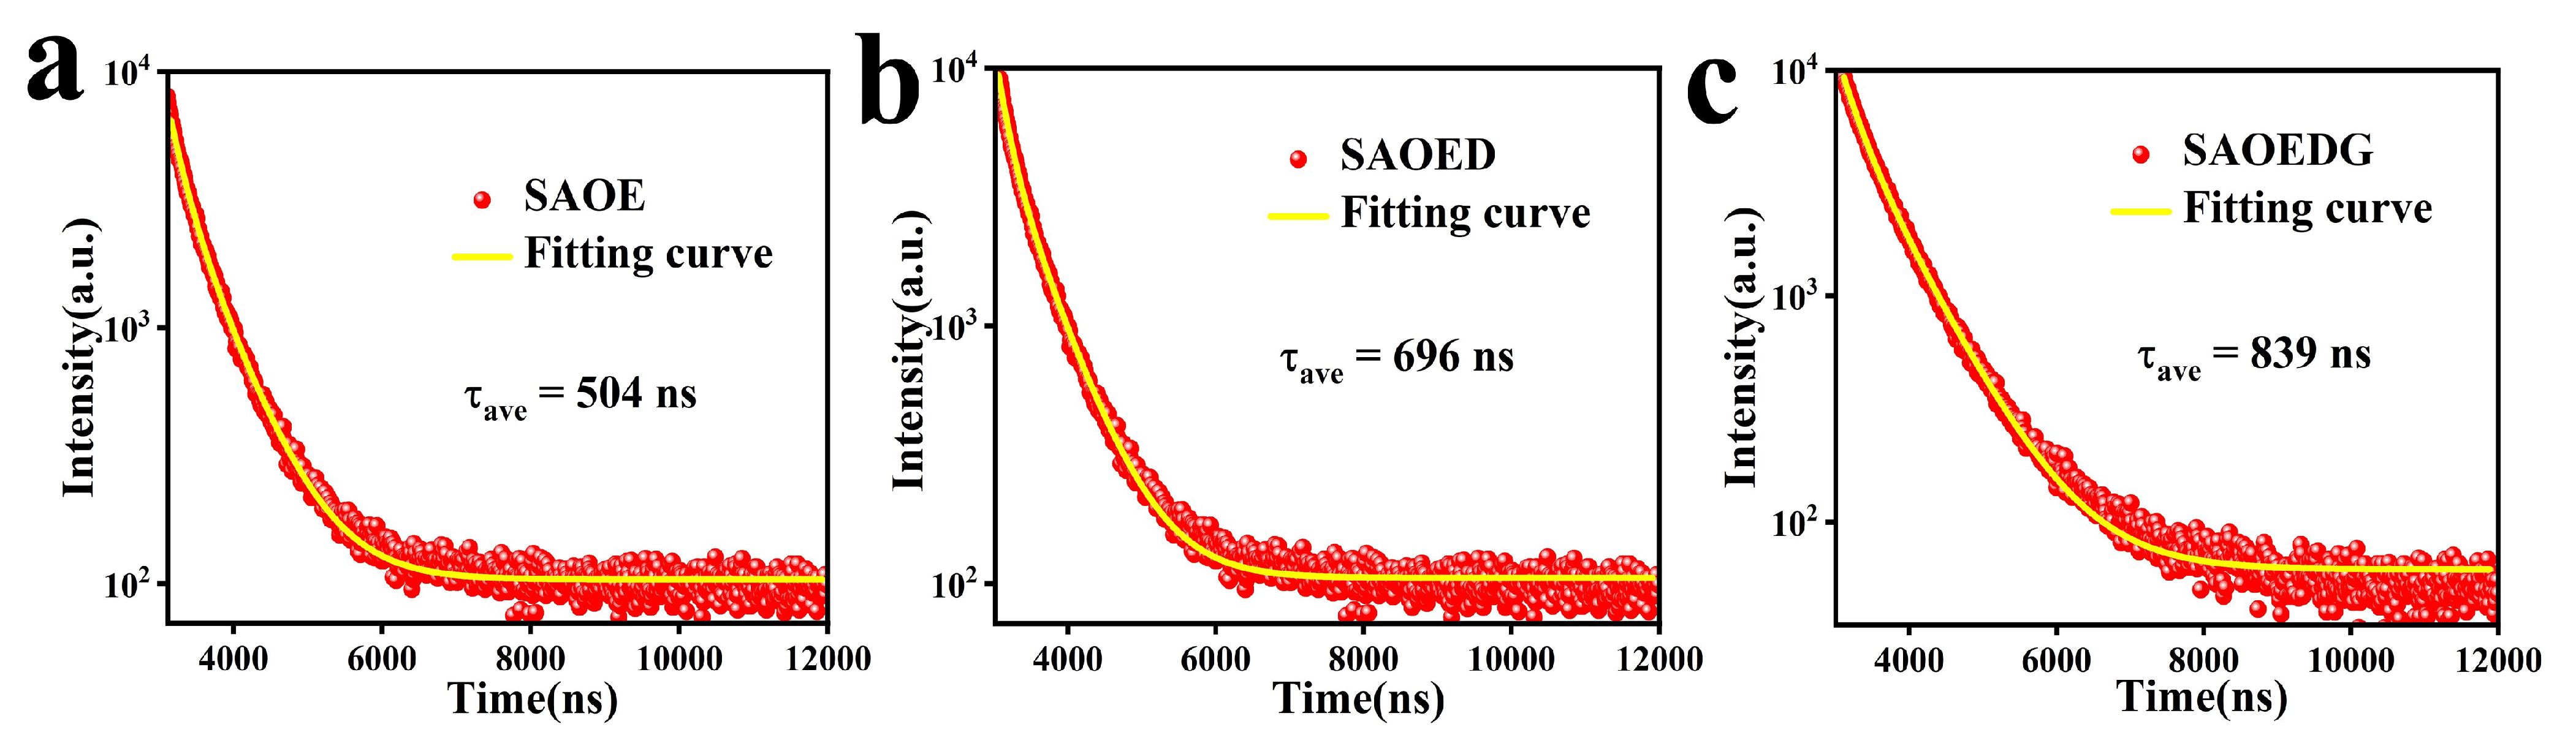
| SAOE | 4828 | 2733 | 250 | 672 | 504 | 1.203 |
| SAOED | 7321 | 1248 | 467 | 1214 | 696 | 1.238 |
| SAOEDG | 3794 | 1179 | 299 | 1254 | 839 | 1.260 |
| Sample | Afterglow Decay Time (s) | ||||
|---|---|---|---|---|---|
| SAOE | 3 | 1 | 1 | 2 | 1 |
| SAOED | 4 | 337 | 6 | 38 | 38 |
| SAOEDG | 5 | 37 | 4 | 55 | 55 |
Disclaimer/Publisher’s Note: The statements, opinions and data contained in all publications are solely those of the individual author(s) and contributor(s) and not of MDPI and/or the editor(s). MDPI and/or the editor(s) disclaim responsibility for any injury to people or property resulting from any ideas, methods, instructions or products referred to in the content. |
© 2023 by the authors. Licensee MDPI, Basel, Switzerland. This article is an open access article distributed under the terms and conditions of the Creative Commons Attribution (CC BY) license (https://creativecommons.org/licenses/by/4.0/).
Share and Cite
Gao, P.; Liu, Q.; Wu, J.; Jing, J.; Zhang, W.; Zhang, J.; Jiang, T.; Wang, J.; Qi, Y.; Li, Z. Enhanced Fluorescence Characteristics of SrAl2O4: Eu2+, Dy3+ Phosphor by Co-Doping Gd3+ and Anti-Counterfeiting Application. Nanomaterials 2023, 13, 2034. https://doi.org/10.3390/nano13142034
Gao P, Liu Q, Wu J, Jing J, Zhang W, Zhang J, Jiang T, Wang J, Qi Y, Li Z. Enhanced Fluorescence Characteristics of SrAl2O4: Eu2+, Dy3+ Phosphor by Co-Doping Gd3+ and Anti-Counterfeiting Application. Nanomaterials. 2023; 13(14):2034. https://doi.org/10.3390/nano13142034
Chicago/Turabian StyleGao, Peng, Quanxiao Liu, Jiao Wu, Jun Jing, Wenguan Zhang, Junying Zhang, Tao Jiang, Jigang Wang, Yuansheng Qi, and Zhenjun Li. 2023. "Enhanced Fluorescence Characteristics of SrAl2O4: Eu2+, Dy3+ Phosphor by Co-Doping Gd3+ and Anti-Counterfeiting Application" Nanomaterials 13, no. 14: 2034. https://doi.org/10.3390/nano13142034