
High-Entropy Lead-Free Perovskite Bi0.2K0.2Ba0.2Sr0.2Ca0.2TiO3 Powders and Related Ceramics: Synthesis, Processing, and Electrical Properties

 , ,
, ,  ,
,  , ,
, , 
Abstract
:1. Introduction
2. Materials and Methods
2.1. Powder Synthesis
2.2. Ceramics Processing
2.3. Characterization
3. Results and Discussion
3.1. Powder Characterization
3.2. Ceramics Characterization

4. Conclusions
Author Contributions
Funding
Data Availability Statement
Conflicts of Interest
References
- Goldschmidt, V.M. Die gesetze der krystallochemie. Naturwissenschaften 1926, 14, 477–485. [Google Scholar] [CrossRef]
- Zhang, D.; Wu, H.; Bowen, C.R.; Yang, Y. Recent Advances in Pyroelectric Materials and Applications. Small 2021, 17, 2103960. [Google Scholar] [CrossRef]
- Liu, Z.; Wu, H.; Yuan, Y.; Wan, H.; Luo, Z.; Gao, P.; Zhuang, J.; Zhang, J.; Zhang, N.; Li, J.; et al. Recent progress in bismuth-based high Curie temperature piezo-/ferroelectric perovskites for electromechanical transduction applications. Curr. Opin. Solid State Mater. Sci. 2022, 26, 101016. [Google Scholar] [CrossRef]
- Sun, Z.; Liu, W.; Li, Q.; Tao, Z.; Han, Y. Relaxor behaviour and nonlinear dielectric properties of lead-free BZT–BZN composite ceramics. Ceram. Int. 2021, 47, 2086–2093. [Google Scholar] [CrossRef]
- Kurchania, R.; Sahu, R.; Navin, K.; Subohi, O. Room-temperature Ferroelectricity and Ferromagnetism in Double Perovskite Bi2CoMnO6 Ceramics Synthesized Using Sol–Gel Combustion Technique. J. Supercond. Nov. Magn. 2021, 34, 2667–2672. [Google Scholar] [CrossRef]
- Rosso, J.M.; Volnistem, E.A.; Santos, I.A.; Bonadio, T.G.M.; Freitas, V.F. Lead-free NaNbO3-based ferroelectric perovskites and their polar polymer-ceramic composites: Fundamentals and potentials for electronic and biomedical applications. Ceram. Int. 2022, 48, 19527–19541. [Google Scholar] [CrossRef]
- Frattini, D.; Accardo, G.; Kwon, Y. Perovskite ceramic membrane separator with improved biofouling resistance for yeast-based microbial fuel cells. J. Memb. Sci. 2020, 599, 117843. [Google Scholar] [CrossRef]
- Ramam, K.; Surabhi, S.; Gurumurthy, S.C.; Shilpa, M.P.; Bindu, K.; Ravikirana; Mundinamani, S. Dielectric and piezoelectric studies of dysprosium-doped BZT–BCNT perovskite ceramic system for sensors and actuator applications. J. Mater. Sci. Mater. Electron. 2021, 32, 18002–18011. [Google Scholar] [CrossRef]
- Ni, L.; Li, L.; Du, M.; Zhan, Y. Wide temperature stable Ba(MgxTa2/3)O3 microwave dielectric ceramics with ultra-high-Q applied for 5G dielectric filter. Ceram. Int. 2021, 47, 1034–1039. [Google Scholar] [CrossRef]
- Djellabi, R.; Ordonez, M.F.; Conte, F.; Falletta, E.; Bianchi, C.L.; Rossetti, I. A review of advances in multifunctional XTiO3 perovskite-type oxides as piezo-photocatalysts for environmental remediation and energy production. J. Hazard. Mater. 2022, 421, 126792. [Google Scholar] [CrossRef]
- Goel, P.; Sundriyal, S.; Shrivastav, V.; Mishra, S.; Dubal, D.P.; Kim, K.H.; Deep, A. Perovskite materials as superior and powerful platforms for energy conversion and storage applications. Nano Energy 2021, 80, 105552, Corrigendum in Nano Energy 2023, 111, 108394. [Google Scholar] [CrossRef]
- Manzi, M.; Pica, G.; De Bastiani, M.; Kundu, S.; Grancini, G.; Saidaminov, M.I. Ferroelectricity in Hybrid Perovskites. J. Phys. Chem. Lett. 2023, 14, 3535–3552. [Google Scholar] [CrossRef] [PubMed]
- Haydoura, M.; Benzerga, R.; Le Paven, C.; Le Gendre, L.; Laur, V.; Chevalier, A.; Sharaiha, A.; Tessier, F.; Cheviré, F. Perovskite (Sr2Ta2O7)100−x(La2Ti2O7)x ceramics: From dielectric characterization to dielectric resonator antenna applications. J. Alloys Compd. 2021, 872, 159728. [Google Scholar] [CrossRef]
- Zhao, P.; Wang, H.; Wu, L.; Chen, L.; Cai, Z.; Li, L.; Wang, X. High-Performance Relaxor Ferroelectric Materials for Energy Storage Applications. Adv. Energy Mater. 2019, 9, 1803048. [Google Scholar] [CrossRef]
- Bovtun, V.; Kamba, S.; Pashkin, A.; Savinov, M.; Samoukhina, P.; Petzelt, J.; Bykov, I.P.; Glinchuk, M.D. Central-peak components and polar soft mode in relaxor PbMg 1/3Nb2/3O3 crystals. Ferroelectrics 2004, 298, 23–30. [Google Scholar] [CrossRef]
- Bersuker, I.B.; Polinger, V. Perovskite crystals: Unique pseudo-jahn–teller origin of ferroelectricity, multiferroicity, permittivity, flexoelectricity, and polar nanoregions. Condens. Matter 2020, 5, 68. [Google Scholar] [CrossRef]
- Chu, F.; Reaney, I.M.; Setter, N. Role of Defects in the Ferroelectric Relaxor Lead Scandium Tantalate. J. Am. Ceram. Soc. 1995, 78, 1947–1952. [Google Scholar] [CrossRef]
- Tang, X.G.; Chew, K.H.; Chan, H.L.W. Diffuse phase transition and dielectric tunability of Ba(Zry,Ti1−y)O3 relaxor ferroelectric ceramics. Acta Mater. 2004, 52, 5177–5183. [Google Scholar] [CrossRef]
- Xie, L.; Li, Y.L.; Yu, R.; Cheng, Z.Y.; Wei, X.Y.; Yao, X.; Jia, C.L.; Urban, K.; Bokov, A.A.; Ye, Z.G.; et al. Static and dynamic polar nanoregions in relaxor ferroelectric Ba(Ti1−xSnx)O3 system at high temperature. Phys. Rev. B Condens. Matter Mater. Phys. 2012, 85, 014118. [Google Scholar] [CrossRef]
- Ang, C.; Jing, Z.; Yu, Z. Ferroelectric relaxor Ba(TiCe)O3. J. Phys. Condens. Matter 2002, 14, 8901–8912. [Google Scholar] [CrossRef]
- Zhang, X.; Hu, D.; Pan, Z.; Lv, X.; He, Z.; Yang, F.; Li, P.; Liu, J.; Zhai, J. Enhancement of recoverable energy density and efficiency of lead-free relaxor-ferroelectric BNT-based ceramics. Chem. Eng. J. 2021, 406, 126818. [Google Scholar] [CrossRef]
- Wei, Y.; Zhang, N.; Jin, C.; Zhu, W.; Zeng, Y.; Xu, G.; Gao, L.; Jian, Z. Bi0.5K0.5TiO3–CaTiO3 ceramics: Appearance of the pseudocubic structure and ferroelectric-relaxor transition characters. J. Am. Ceram. Soc. 2019, 102, 3598–3608. [Google Scholar] [CrossRef]
- Gao, X.; Wu, J.; Yu, Y.; Chu, Z.; Shi, H.; Dong, S. Giant Piezoelectric Coefficients in Relaxor Piezoelectric Ceramic PNN-PZT for Vibration Energy Harvesting. Adv. Funct. Mater. 2018, 28, 1706895. [Google Scholar] [CrossRef]
- Tang, X.G.; Chan, H.L.W. Effect of grain size on the electrical properties of (Ba,Ca)(Zr,Ti)O3 relaxor ferroelectric ceramics. J. Appl. Phys. 2005, 97, 034109. [Google Scholar] [CrossRef]
- Polinger, V.; Bersuker, I.B. Origin of polar nanoregions and relaxor properties of ferroelectrics. Phys. Rev. B 2018, 98, 214102. [Google Scholar] [CrossRef]
- Veerapandiyan, V.; Benes, F.; Gindel, T.; Deluca, M. Strategies to improve the energy storage properties of perovskite lead-free relaxor ferroelectrics: A review. Materials 2020, 13, 5742. [Google Scholar] [CrossRef]
- Xiang, H.; Xing, Y.; Dai, F.Z.; Wang, H.; Su, L.; Miao, L.; Zhang, G.; Wang, Y.; Qi, X.; Yao, L.; et al. High-entropy ceramics: Present status, challenges, and a look forward. J. Adv. Ceram. 2021, 10, 385–441. [Google Scholar]
- Baker, I.; Cantor, B.; Yeh, J.W. High Entropy Alloys and Materials. High Entropy Alloys Mater. 2023. [Google Scholar] [CrossRef]
- Liu, Z.; Tang, Z.; Song, Y.; Yang, G.; Qian, W.; Yang, M.; Zhu, Y.; Ran, R.; Wang, W.; Zhou, W.; et al. High-Entropy Perovskite Oxide: A New Opportunity for Developing Highly Active and Durable Air Electrode for Reversible Protonic Ceramic Electrochemical Cells. Nano-Micro Lett. 2022, 14, 217. [Google Scholar] [CrossRef]
- Jiang, S.; Hu, T.; Gild, J.; Zhou, N.; Nie, J.; Qin, M.; Harrington, T.; Vecchio, K.; Luo, J. A new class of high-entropy perovskite oxides. Scr. Mater. 2018, 142, 116–120. [Google Scholar] [CrossRef]
- Miracle, D.B.; Senkov, O.N. A critical review of high entropy alloys and related concepts. Acta Mater. 2017, 122, 448–511. [Google Scholar] [CrossRef]
- Liu, J.; Ma, C.; Zhao, X.; Ren, K.; Zhang, R.; Shang, F.; Du, H.; Wang, Y. Structure, dielectric, and relaxor properties of BaTiO3-modified high-entropy (Bi0.2Na0.2K0.2Ba0.2Ca0.2)TiO3 ceramics for energy storage applications. J. Alloys Compd. 2023, 947, 169626. [Google Scholar] [CrossRef]
- Fang, J.; Wang, T.; Li, K.; Li, Y.; Gong, W. Energy storage properties of Mn-modified (Na0.2Bi0.2Ca0.2Sr0.2Ba0.2)TiO3 high-entropy relaxor-ferroelectric ceramics. Results Phys. 2022, 38, 105617. [Google Scholar] [CrossRef]
- Jabeen, N.; Hussain, A.; Qaiser, M.A.; Ali, J.; Rehman, A.; Sfina, N.; Ali, G.A.; Tirth, V. Enhanced Energy Storage Performance by Relaxor Highly Entropic (Bi0.2Na0.2K0.2La0.2Bi0.2)TiO3 and (Bi0.2Na0.2K0.2Mg0.2Bi0.2)TiO3 Ferroelectric Ceramics. Appl. Sci. 2022, 12, 12933. [Google Scholar] [CrossRef]
- Wang, H.; Zhang, J.; Jiang, S.; Wang, J.; Wang, J.; Wang, Y. (Bi1/6Na1/6Ba1/6Sr1/6Ca1/6Pb1/6)TiO3-based high-entropy dielectric ceramics with ultrahigh recoverable energy density and high energy storage efficiency. J. Mater. Chem. A 2023, 11, 4937–4945. [Google Scholar] [CrossRef]
- Xiong, W.; Zhang, H.; Hu, Z.; Reece, M.J.; Yan, H. Low thermal conductivity in A-site high entropy perovskite relaxor ferroelectric. Appl. Phys. Lett. 2022, 121, 112901. [Google Scholar] [CrossRef]
- Ning, Y.; Pu, Y.; Wu, C.; Zhou, S.; Zhang, L.; Zhang, J.; Zhang, X.; Shang, Y. Enhanced capacitive energy storage and dielectric temperature stability of A-site disordered high-entropy perovskite oxides. J. Mater. Sci. Technol. 2023, 145, 66–73. [Google Scholar] [CrossRef]
- Liu, L.; Chu, B.; Li, P.; Fu, P.; Du, J.; Hao, J.; Li, W.; Zeng, H. Achieving high energy storage performance and ultrafast discharge speed in SrTiO3-based ceramics via a synergistic effect of chemical modification and defect chemistry. Chem. Eng. J. 2022, 429, 132548. [Google Scholar]
- Shang, Y.; Pu, Y.; Zhang, Q.; Zhang, L.; Zhang, X.; Zhang, J.; Ning, Y. Effect of configuration entropy on dielectric relaxor, ferroelectric properties of high-entropy (NaBiBa)x(SrCa)(1−3x)/2TiO3 ceramics. J. Mater. Sci. Mater. Electron. 2022, 33, 5359–5369. [Google Scholar] [CrossRef]
- Guo, J.; Yu, H.; Ren, Y.; Qi, H.; Yang, X.; Deng, Y.; Zhang, S.-T.; Chen, J. Multi-symmetry high-entropy relaxor ferroelectric with giant capacitive energy storage. Nano Energy 2023, 112, 108458. [Google Scholar] [CrossRef]
- Wang, T.; Li, Y.; Zhang, X.; Zhang, D.; Gong, W. Simultaneous excellent energy storage density and efficiency under applied low electric field for high entropy relaxor ferroelectric ceramics. Mater. Res. Bull. 2023, 157, 112024. [Google Scholar] [CrossRef]
- Hussain, A.; Jabeen, N.; Hassan, N.U.; Hussain, W.; Qaiser, M.A.; Khan, S.; Hassan, A.M.; Alothman, A.A.; Almuhous, N.A.; Rosaiah, P.; et al. High-entropic relaxor ferroelectric perovskites ceramics with A-site modification for energy storage applications. Ceram. Int. 2023, 49, 39419–39427. [Google Scholar] [CrossRef]
- Lu, Y.; Zhang, H.; Yang, H.; Fan, P.; Samart, C.; Takesue, N.; Tan, H. SPS-Prepared High-Entropy (Bi0.2Na0.2Sr0.2Ba0.2Ca0.2)TiO3 Lead-Free Relaxor-Ferroelectric Ceramics with High Energy Storage Density. Crystals 2023, 13, 445. [Google Scholar] [CrossRef]
- Liu, Z.; Xu, S.; Li, T.; Xie, B.; Guo, K.; Lu, J. Microstructure and ferroelectric properties of high-entropy perovskite oxides with A-site disorder. Ceram. Int. 2021, 47, 33039–33046. [Google Scholar] [CrossRef]
- Li, Z.W.; Chen, Z.H.; Xu, J. jun Enhanced energy storage performance of BaTi0.97Ca0.03O2.97-based ceramics by doping high-entropy perovskite oxide. J. Alloys Compd. 2022, 922, 166179. [Google Scholar] [CrossRef]
- Zhou, S.; Pu, Y.; Zhang, X.; Shi, Y.; Gao, Z.; Feng, Y.; Shen, G.; Wang, X.; Wang, D. High energy density, temperature stable lead-free ceramics by introducing high entropy perovskite oxide. Chem. Eng. J. 2022, 427, 131684. [Google Scholar] [CrossRef]
- Liu, J.; Ma, C.; Wang, L.; Ren, K.; Ran, H.; Feng, D.; Du, H.; Wang, Y. Single-phase formation mechanism and dielectric properties of sol-gel-derived Ba(Ti0.2Zr0.2Sn0.2Hf0.2Ce0.2)O3 high-entropy ceramics. J. Mater. Sci. Technol. 2022, 130, 103–111. [Google Scholar] [CrossRef]
- Sharma, Y.; Lee, M.C.; Pitike, K.C.; Mishra, K.K.; Zheng, Q.; Gao, X.; Musico, B.L.; Mazza, A.R.; Katiyar, R.S.; Keppens, V.; et al. High Entropy Oxide Relaxor Ferroelectrics. ACS Appl. Mater. Interfaces 2022, 14, 11962–11970. [Google Scholar] [CrossRef] [PubMed]
- Yan, B.; Chen, K.; An, L. Design and preparation of lead-free (Bi0.4Na0.2K0.2Ba0.2)TiO3-Sr(Mg1/3Nb2/3)O3 high-entropy relaxor ceramics for dielectric energy storage. Chem. Eng. J. 2023, 453, 139921. [Google Scholar] [CrossRef]
- Sun, X.; Xu, C.; Ji, P.; Tang, Z.; Jiao, S.; Lu, Y.; Zhao, M.; Cai, H.L.; Wu, X.S. The enhancement of energy storage performance in high-entropy ceramic. Ceram. Int. 2023, 49, 17091–17098. [Google Scholar] [CrossRef]
- Si, H.; Yan, B.; An, L.; Chen, K. Improving the energy storage performance of 0.88(Bi0.4Ba0.2Na0.2K0.2)TiO3–0.12Sr(Mg1/3Nb2/3)O3 high-entropy relaxor ceramics by AlN doping. Ceram. Int. 2023, 49, 25179–25184. [Google Scholar] [CrossRef]
- Ning, Y.; Pu, Y.; Chen, Z.; Zhang, L.; Wu, C.; Zhang, X.; Wang, B.; Zhang, J. Novel high-entropy relaxors with ultrahigh energy-storage efficiency and density. Chem. Eng. J. 2023, 476, 146673. [Google Scholar] [CrossRef]
- Bai, M.; Qiao, W.; Mei, J.; Kang, R.; Gao, Y.; Wu, Y.; Hu, Y.; Li, Y.; Hao, X.; Zhao, J.; et al. High-performance energy storage in BaTiO3-based oxide ceramics achieved by high-entropy engineering. J. Alloys Compd. 2024, 970, 172671. [Google Scholar] [CrossRef]
- Chen, L.; Yu, H.; Wu, J.; Deng, S.; Liu, H.; Zhu, L.; Qi, H.; Chen, J. Large Energy Capacitive High-Entropy Lead-Free Ferroelectrics. Nano-Micro Lett. 2023, 15, 65. [Google Scholar] [CrossRef]
- Sun, W.; Zhang, F.; Zhang, X.; Shi, T.; Li, J.; Bai, Y.; Wang, C.; Wang, Z. Enhanced electrical properties of (Bi0.2Na0.2Ba0.2Ca0.2Sr0.2)TiO3 high-entropy ceramics prepared by hydrothermal method. Ceram. Int. 2022, 48, 19492–19500. [Google Scholar] [CrossRef]
- Vinnik, D.A.; Trofimov, E.A.; Zhivulin, V.E.; Gudkova, S.A.; Zaitseva, O.V.; Zherebtsov, D.A.; Starikov, A.Y.; Sherstyuk, D.P.; Amirov, A.A.; Kalgin, A.V.; et al. High entropy oxide phases with perovskite structure. Nanomaterials 2020, 10, 268. [Google Scholar] [CrossRef] [PubMed]
- Liu, J.; Ren, K.; Ma, C.; Du, H.; Wang, Y. Dielectric and energy storage properties of flash-sintered high-entropy (Bi0.2Na0.2K0.2Ba0.2Ca0.2)TiO3 ceramic. Ceram. Int. 2020, 46, 20576–20581. [Google Scholar] [CrossRef]
- Schweidler, S.; Tang, Y.; Lin, L.; Karkera, G.; Alsawaf, A.; Bernadet, L.; Breitung, B.; Hahn, H.; Fichtner, M.; Tarancón, A.; et al. Synthesis of perovskite-type high-entropy oxides as potential candidates for oxygen evolution. Front. Energy Res. 2022, 10, 983979. [Google Scholar] [CrossRef]
- Pechini, M.P. Method of Preparing Lead and Alkaline Earth Titanates and Niobates and Coating Method Using the Same to Form a Capacitor. U.S. Patent 3,330,697, 11 July 1967. [Google Scholar]
- Mitchell, R.H.; Chakhmouradian, A.R.; Woodward, P.M. Crystal chemistry of perovskite-type compounds in the tausonite-loparite series, (Sr1−2xNaxLax)TiO3. Phys. Chem. Miner. 2000, 27, 583–589. [Google Scholar] [CrossRef]
- Yasuda, N.; Murayama, H.; Fukuyama, Y.; Kim, J.E.; Kimura, S.; Toriumi, K.; Tanaka, Y.; Moritomo, Y.; Kuroiwa, Y.; Kato, K. X-ray diffractometry for the structure determination of a submicrometre single powder grain. J. Synchrotron Radiat. 2009, 16, 352–357. [Google Scholar] [CrossRef]
- Yamanaka, T.; Hirai, N.; Komatsu, Y. Structure change of Ca1−xSrxTiO3 perovskite with composition and pressure. Am. Mineral. 2002, 87, 1183–1189. [Google Scholar] [CrossRef]
- Chu, B.; Hao, J.; Li, P.; Li, Y.; Li, W.; Zheng, L.; Zeng, H. High-energy storage properties over a broad temperature range in La-modified BNT-based lead-free ceramics. ACS Appl. Mater. Interfaces 2022, 14, 19683–19696. [Google Scholar] [CrossRef] [PubMed]
- Mendez-González, Y.; Peláiz-Barranco, A.; Curcio, A.L.; Rodrigues, A.D.; Guerra, J.D.S. Raman spectroscopy study of the La-modified (Bi0.5Na0.5)0.92Ba0.08TiO3 lead-free ceramic system. J. Raman Spectrosc. 2019, 50, 1044–1050. [Google Scholar] [CrossRef]
- Veerapandiyan, V.K.; Khosravi, H.S.; Canu, G.; Feteira, A.; Buscaglia, V.; Reichmann, K.; Deluca, M. B-site vacancy induced Raman scattering in BaTiO3-based ferroelectric ceramics. J. Eur. Ceram. Soc. 2020, 40, 4684–4688. [Google Scholar] [CrossRef]
- Shi, F.; Fu, G.E.; Xiao, E.C.; Li, J. Lattice vibrational characteristics and dielectric properties of pure phase CaTiO3 ceramic. J. Mater. Sci. Mater. Electron. 2020, 31, 18070–18076. [Google Scholar] [CrossRef]
- Zhang, X.; Zhang, F.; Niu, Y.; Zhang, Z.; Bai, Y.; Wang, Z. Effect of La substitution on energy storage properties of (Bi0.2Na0.2Ca0.2Ba0.2Sr0.2)TiO3 lead-free high-entropy ceramics. J. Am. Ceram. Soc. 2023, 106, 6641–6653. [Google Scholar] [CrossRef]
- Turki, O.; Slimani, A.; Abdelmoula, N.; Seveyrat, L.; Sassi, Z.; Khemakhem, H.; Lebrun, L. Lanthanides effects on the ferroelectric and energy-storage properties of (Na0.5Bi0.5)0.94Ba0.06TiO3 ceramic: Comparative approach. Solid State Sci. 2021, 114, 106571. [Google Scholar] [CrossRef]
- Kang, R.; Wang, Z.; Zhao, Y.; Li, Y.; Hu, Y.; Hao, X.; Zhang, L.; Lou, X. Enhanced energy storage performance of Bi0.5K0.5TiO3-based ceramics via composition modulation. J. Alloys Compd. 2023, 935, 167999. [Google Scholar] [CrossRef]
- Kreisel, J.; Glazer, A.M.; Jones, G.; Thomas, P.A.; Abello, L.; Lucazeau, G. An X-ray diffraction and Raman spectroscopy investigation of A-site substituted perovskite compounds: The (Na1−xKx)0.5Bi0.5TiO3(0 x1) solid solution. J. Phys. Condens. Matter 2000, 12, 3267. [Google Scholar] [CrossRef]
- Cross, L.E. Relaxor Ferroelectrics BT—Piezoelectricity: Evolution and Future of a Technology; Heywang, W., Lubitz, K., Wersing, W., Eds.; Springer: Berlin/Heidelberg, Germany, 2008; pp. 131–155. ISBN 978-3-540-68683-5. [Google Scholar]
- Cross, L.E. Relaxor ferroelectrics. Ferroelectrics 1987, 76, 241–267. [Google Scholar] [CrossRef]
- Zhao, Z.; Buscaglia, V.; Viviani, M.; Buscaglia, M.T.; Mitoseriu, L.; Testino, A.; Nygren, M.; Johnsson, M.; Nanni, P. Grain-size effects on the ferroelectric behavior of dense nanocrystalline BaTiO3. Phys. Rev. B 2004, 70, 24107. [Google Scholar] [CrossRef]
- Buscaglia, M.T.; Viviani, M.; Buscaglia, V.; Mitoseriu, L.; Testino, A.; Nanni, P.; Zhao, Z.; Nygren, M.; Harnagea, C.; Piazza, D.; et al. High dielectric constant and frozen macroscopic polarization in dense nanocrystalline BaTiO3 ceramics. Phys. Rev. B 2006, 73, 64114. [Google Scholar] [CrossRef]
- Deng, X.; Wang, X.; Wen, H.; Kang, A.; Gui, Z.; Li, L. Phase Transitions in Nanocrystalline Barium Titanate Ceramics Prepared by Spark Plasma Sintering. J. Am. Ceram. Soc. 2006, 89, 1059–1064. [Google Scholar] [CrossRef]
- Curecheriu, L.; Balmus, S.-B.; Buscaglia, M.T.; Buscaglia, V.; Ianculescu, A.; Mitoseriu, L. Grain Size-Dependent Properties of Dense Nanocrystalline Barium Titanate Ceramics. J. Am. Ceram. Soc. 2012, 95, 3912–3921. [Google Scholar] [CrossRef]
- Molak, A.; Paluch, M.; Pawlus, S.; Klimontko, J.; Ujma, Z.; Gruszka, I. Electric modulus approach to the analysis of electric relaxation in highly conducting (Na0.75Bi0.25)(Mn0.25Nb0.75)O3 ceramics. J. Phys. D Appl. Phys. 2005, 38, 1450–1460. [Google Scholar] [CrossRef]
- Ene, V.L.; Lupu, V.R.; Condor, C.V.; Patru, R.E.; Hrib, L.M.; Amarande, L.; Nicoara, A.I.; Pintilie, L.; Ianculescu, A.-C. Influence of Grain Size on Dielectric Behavior in Lead-Free 0.5 Ba(Zr0.2Ti0.8)O3–0.5 (Ba0.7Ca0.3)TiO3 Ceramics. Nanomaterials 2023, 13, 2934. [Google Scholar] [CrossRef]
- Xiong, W.; Zhang, H.; Cao, S.; Gao, F.; Svec, P.; Dusza, J.; Reece, M.J.; Yan, H. Low-loss high entropy relaxor-like ferroelectrics with A-site disorder. J. Eur. Ceram. Soc. 2021, 41, 2979–2985. [Google Scholar] [CrossRef]
- Iwamoto, M. Maxwell–Wagner Effect BT—Encyclopedia of Nanotechnology; Bhushan, B., Ed.; Springer: Dordrecht, The Netherlands, 2012; pp. 1276–1285. ISBN 978-90-481-9751-4. [Google Scholar]
- Santos, I.A.; Garcia, D.; Eiras, J.A.; Arantes, V.L. Features of diffuse phase transition in lead barium niobate ferroelectric ceramics. J. Appl. Phys. 2003, 93, 1701–1706. [Google Scholar] [CrossRef]
- Santos, I.A.; Eiras, J.A. Phenomenological description of the diffuse phase transition in ferroelectrics. J. Phys. Condens. Matter 2001, 13, 11733. [Google Scholar] [CrossRef]
- Peláiz-Barranco, A.; Gutiérrez-Amador, M.P.; Huanosta, A.; Valenzuela, R. Phase transitions in ferrimagnetic and ferroelectric ceramics by ac measurements. Appl. Phys. Lett. 1998, 73, 2039–2041. [Google Scholar] [CrossRef]
- Bruce, P.G. High and low frequency Jonscher behaviour of an ionically conducting glass. Solid State Ion. 1985, 15, 247–251. [Google Scholar] [CrossRef]
- Jonscher, A.K.; Frost, M.S. Weakly frequency-dependent electrical conductivity in a chalcogenide glass. Thin Solid Film. 1976, 37, 267–273. [Google Scholar] [CrossRef]
- Funke, K. Jump relaxation in solid electrolytes. Prog. Solid State Chem. 1993, 22, 111–195. [Google Scholar] [CrossRef]
- Smyth, D.M. Comments on the Defect Chemistry of Undoped and Acceptor-Doped BaTiO3. J. Electroceram. 2003, 11, 89–100. [Google Scholar] [CrossRef]
- Yoo, H.-I.; Song, C.-R.; Lee, D.-K. BaTiO3−δ: Defect Structure, Electrical Conductivity, Chemical Diffusivity, Thermoelectric Power, and Oxygen Nonstoichiometry. J. Electroceram. 2002, 8, 5–36. [Google Scholar] [CrossRef]
- Verdier, C.; Morrison, F.D.; Lupascu, D.C.; Scott, J.F. Fatigue studies in compensated bulk lead zirconate titanate. J. Appl. Phys. 2004, 97, 024107. [Google Scholar] [CrossRef]
- Jorcin, J.-B.; Orazem, M.E.; Pébère, N.; Tribollet, B. CPE analysis by local electrochemical impedance spectroscopy. Electrochim. Acta 2006, 51, 1473–1479. [Google Scholar] [CrossRef]
- Brug, G.J.; van den Eeden, A.L.G.; Sluyters-Rehbach, M.; Sluyters, J.H. The analysis of electrode impedances complicated by the presence of a constant phase element. J. Electroanal. Chem. Interfacial Electrochem. 1984, 176, 275–295. [Google Scholar] [CrossRef]


| Composition | Reference | Sconfig | <RA> | δ(RA) (%) | t | |
|---|---|---|---|---|---|---|
| Balanced charge | (Bi0.2Li0.2Ba0.2Sr0.2Pb0.2)TiO3 | [44] | 1.61R | 1.434 | 21.15 | 0.956 |
| (Bi0.2Ag0.2Ba0.2Sr0.2Pb0.2)TiO3 | [44] | 1.61R | 1.512 | 12.02 | 0.985 | |
| (Bi0.2Na0.2Ba0.2Sr0.2Ca0.2)TiO3 | [44] | 1.61R | 1.53 | 9.33 | 0.991 | |
| (Bi0.2Na0.2Ba0.2Ca0.2Sr0.2)TiO3 | [55] | 1.61R | 1.53 | 9.33 | 0.991 | |
| (Bi0.2Na0.2Sr0.2Ba0.2Ca0.2)TiO3 | [43] | 1.61R | 1.53 | 9.33 | 0.991 | |
| (Bi0.2Na0.2Ba0.2Sr0.2Pb0.2)TiO3 | [44] | 1.61R | 1.56 | 9.28 | 1.002 | |
| (Bi0.2K0.2Ba0.2Ca0.2Sr0.2)TiO3 | This work | 1.61R | 1.58 | 11.03 | 1.009 | |
| (Bi0.2K0.2Ba0.2Sr0.2Pb0.2)TiO3 | [44] | 1.61R | 1.61 | 10.39 | 1.020 | |
| Unbalanced charge | (Ba0.2Na0.2Mg0.2La0.2Bi0.2)TiO3 | [34] | 1.61R | 1.424 | 16.96 | 0.953 |
| (Ba0.2Na0.2K0.2Mg0.2Bi0.2)TiO3 | [42] | 1.61R | 1.446 | 23.41 | 0.961 | |
| (Bi0.2Na0.2K0.2Li0.2Sr0.2Ca0.2)TiO3 | [29] | 1.61R | 1.452 | 16.98 | 0.963 | |
| Na0.30K0.07Ca0.27La0.18Ce0.21TiO3 | [56] | 1.54R | 1.465 | 15.56 | 0.968 | |
| (Ba0.2Na0.2Ca0.2Sm0.2Bi0.2)TiO3 | [42] | 1.61R | 1.49 | 10.13 | 0.977 | |
| (Bi0.2Na0.2K0.2Ba0.2Ca0.2)TiO3 | [57] | 1.61R | 1.57 | 11.17 | 1.006 | |
| (Bi0.2Na0.2K0.2Li0.2Ca0.2Mg0.2)TiO3 | [29] | 1.93R | 1.638 | 25.44 | 1.030 | |
| (Bi0.2Na0.2K0.2Li0.2Sr0.2Mg0.2)TiO3 | [29] | 1.93R | 1.658 | 25.74 | 1.037 | |
| (Bi0.2Na0.2K0.2Li0.2Ba0.2Mg0.2)TiO3 | [29] | 1.93R | 1.692 | 26.71 | 1.050 | |
| (Bi0.2Na0.2K0.2Li0.2Ca0.2Pb0.2)TiO3 | [29] | 1.93R | 1.758 | 23.23 | 1.074 | |
| (Bi0.2Na0.2K0.2Li0.2Sr0.2Pb0.2)TiO3 | [29] | 1.93R | 1.778 | 23.29 | 1.081 | |
| (Bi0.2Na0.2K0.2Li0.2Ba0.2Ca0.2)TiO3 | [29] | 1.93R | 1.782 | 23.81 | 1.082 | |
| (Bi0.2Na0.2K0.2Li0.2Ba0.2Sr0.2)TiO3 | [29] | 1.93R | 1.802 | 23.79 | 1.089 | |
| (Bi0.2Na0.2K0.2Li0.2Ba0.2Pb0.2)TiO3 | [29] | 1.93R | 1.812 | 23.87 | 1.093 |
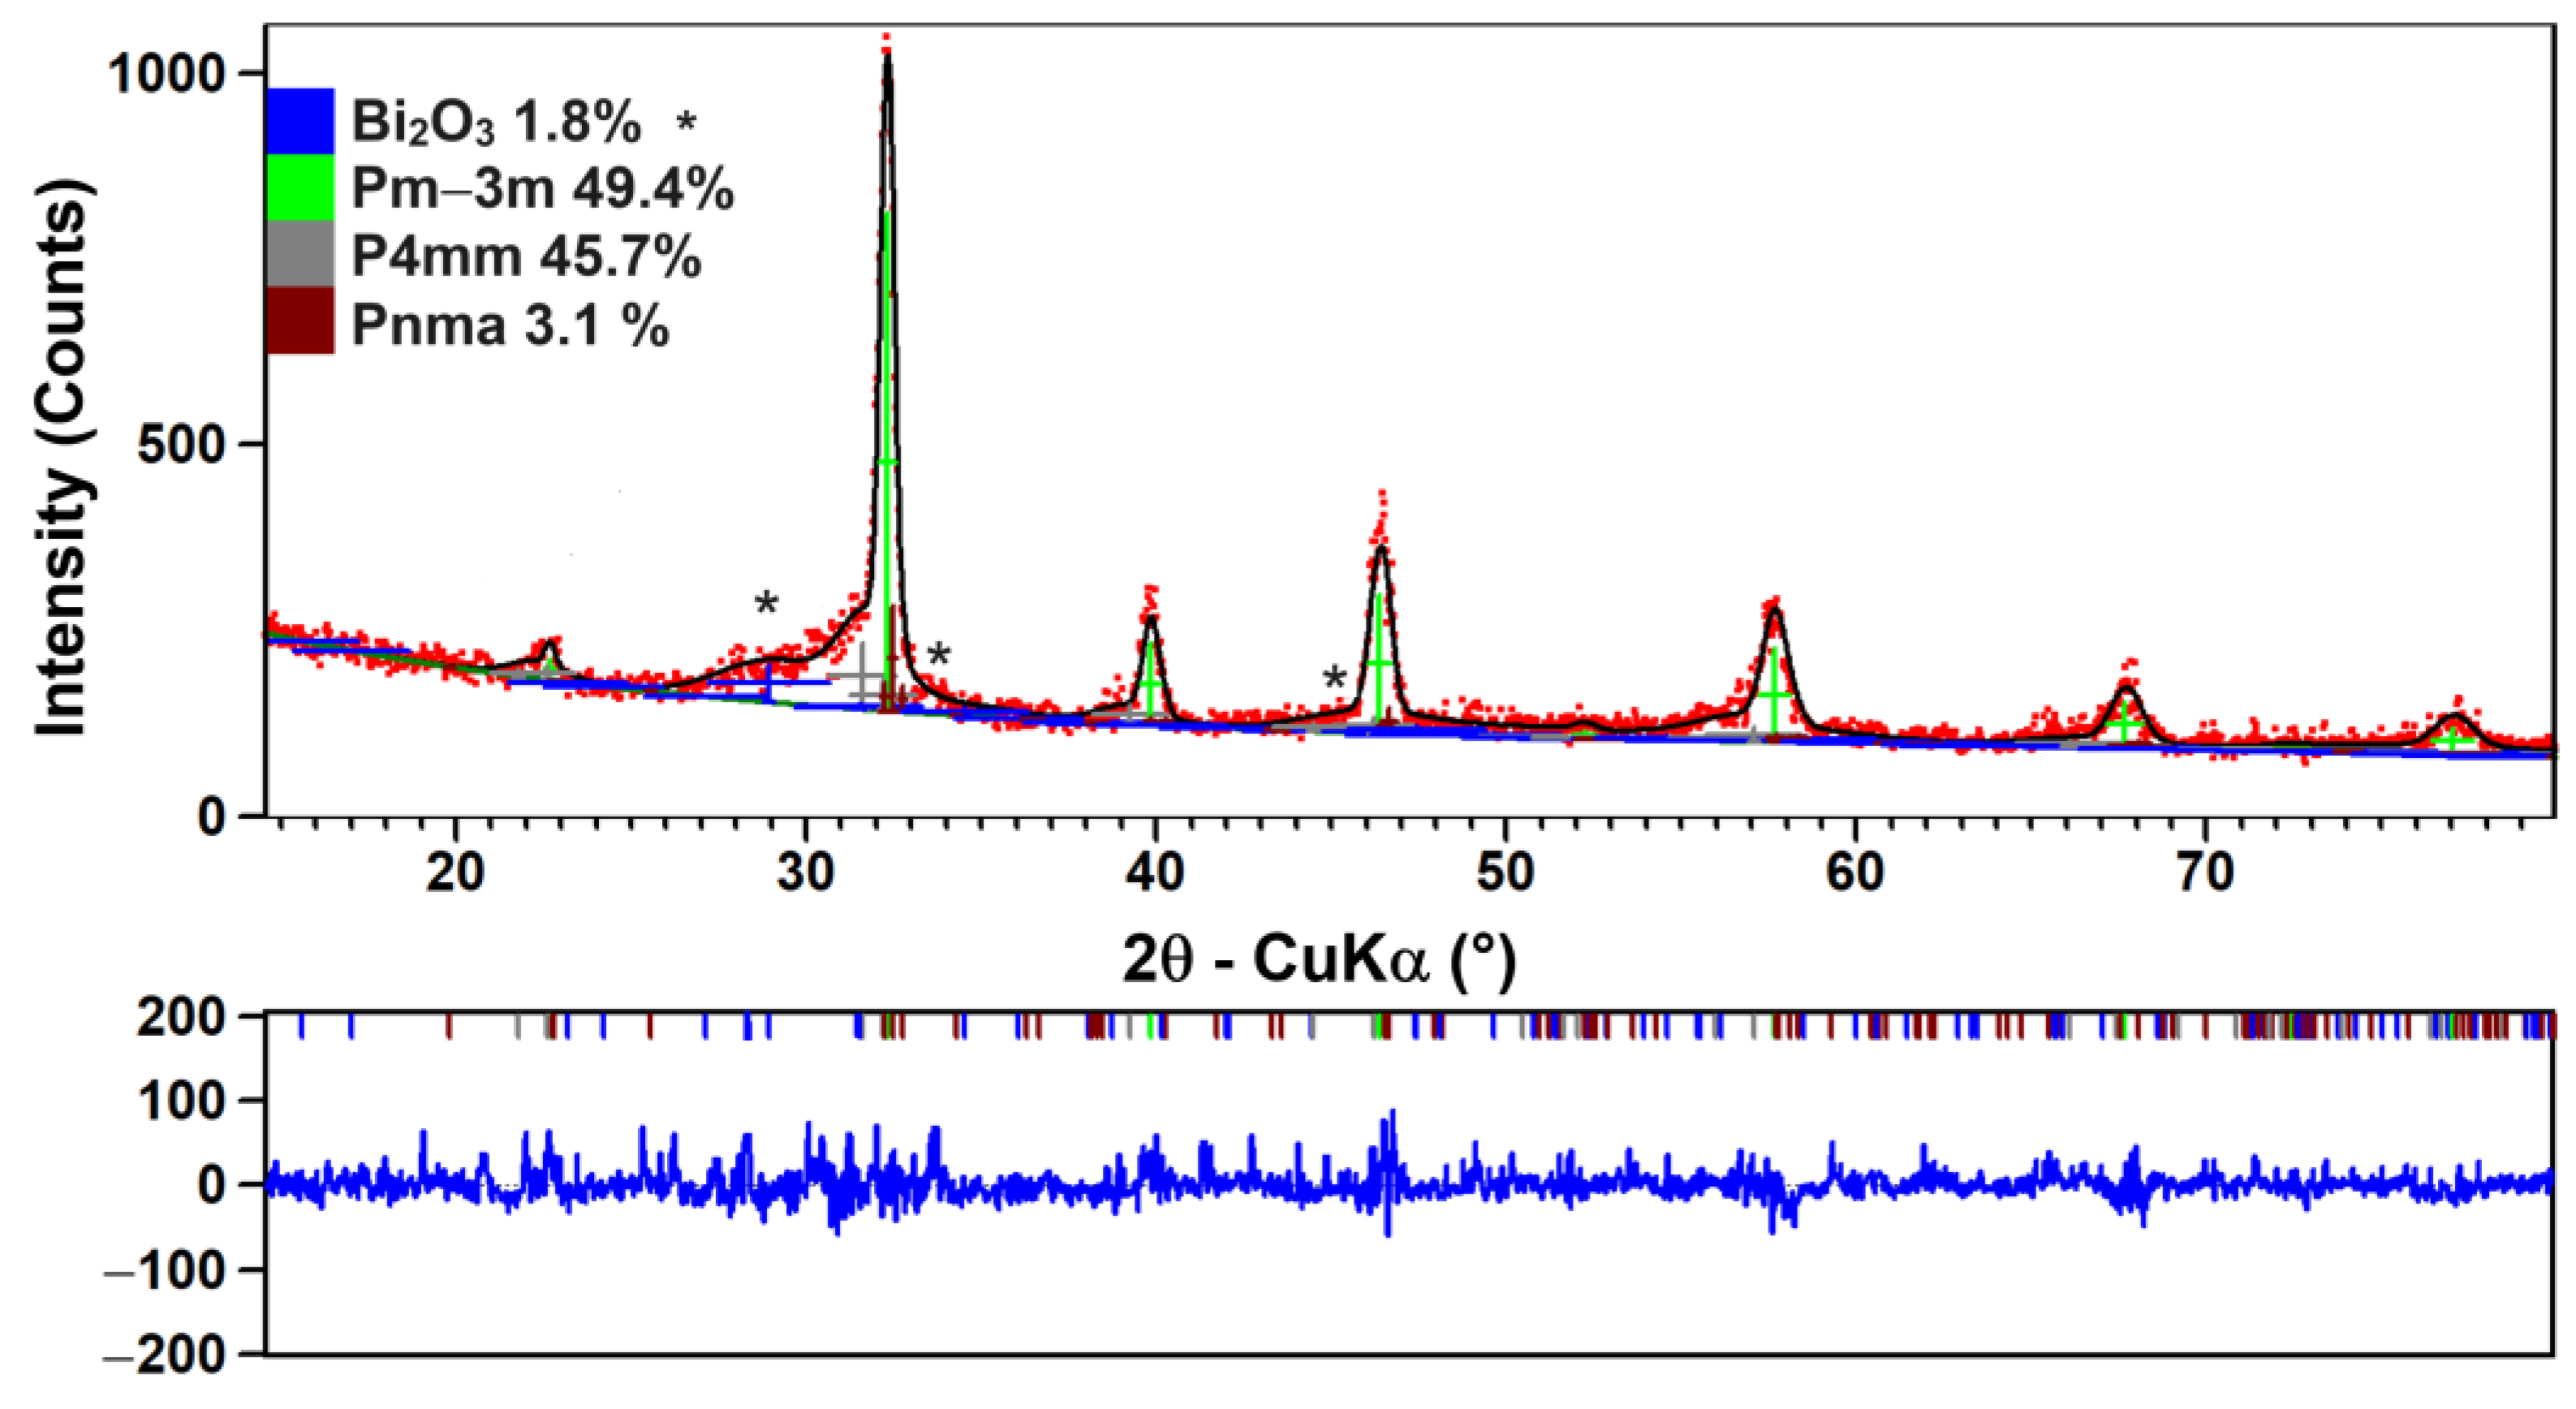
| Cubic, Pm-3m (49.4%) | Tetragonal, P4mm (45.7%) | Orthorhombic, Pnma (3.1%) | Bi2O3 (1.8%) | |
|---|---|---|---|---|
| COD # | 96-900-6865 | 96-151-3253 | 96-900-2804 | 96-101-0313 |
| Crystal system | Cubic | Tetragonal | Orthorhombic | Tetragonal |
| a (Å) | 3.907 ± 0.002 | 3.999 ± 0.041 | 5.378 ± 0.002 | - |
| b (Å) | 3.907 ± 0.002 | 3.999 ± 0.041 | 7.382 ± 0.011 | - |
| c (Å) | 3.907 ± 0.002 | 4.037 ± 0.082 | 5.421 ± 0.002 | - |
| V (Å3) | 59.64 | 64.58 | 215.18 | - |
| Rexp | 17.17 | |||
| Rp | 9.21 | |||
| Rwp | 14.43 | |||
| χ2 | 0.71 | |||
| Average crystallite size <D> (nm) | 14.24 ± 9.12 | 1.93 ± 0.26 | 25.66 ± 6.23 | |
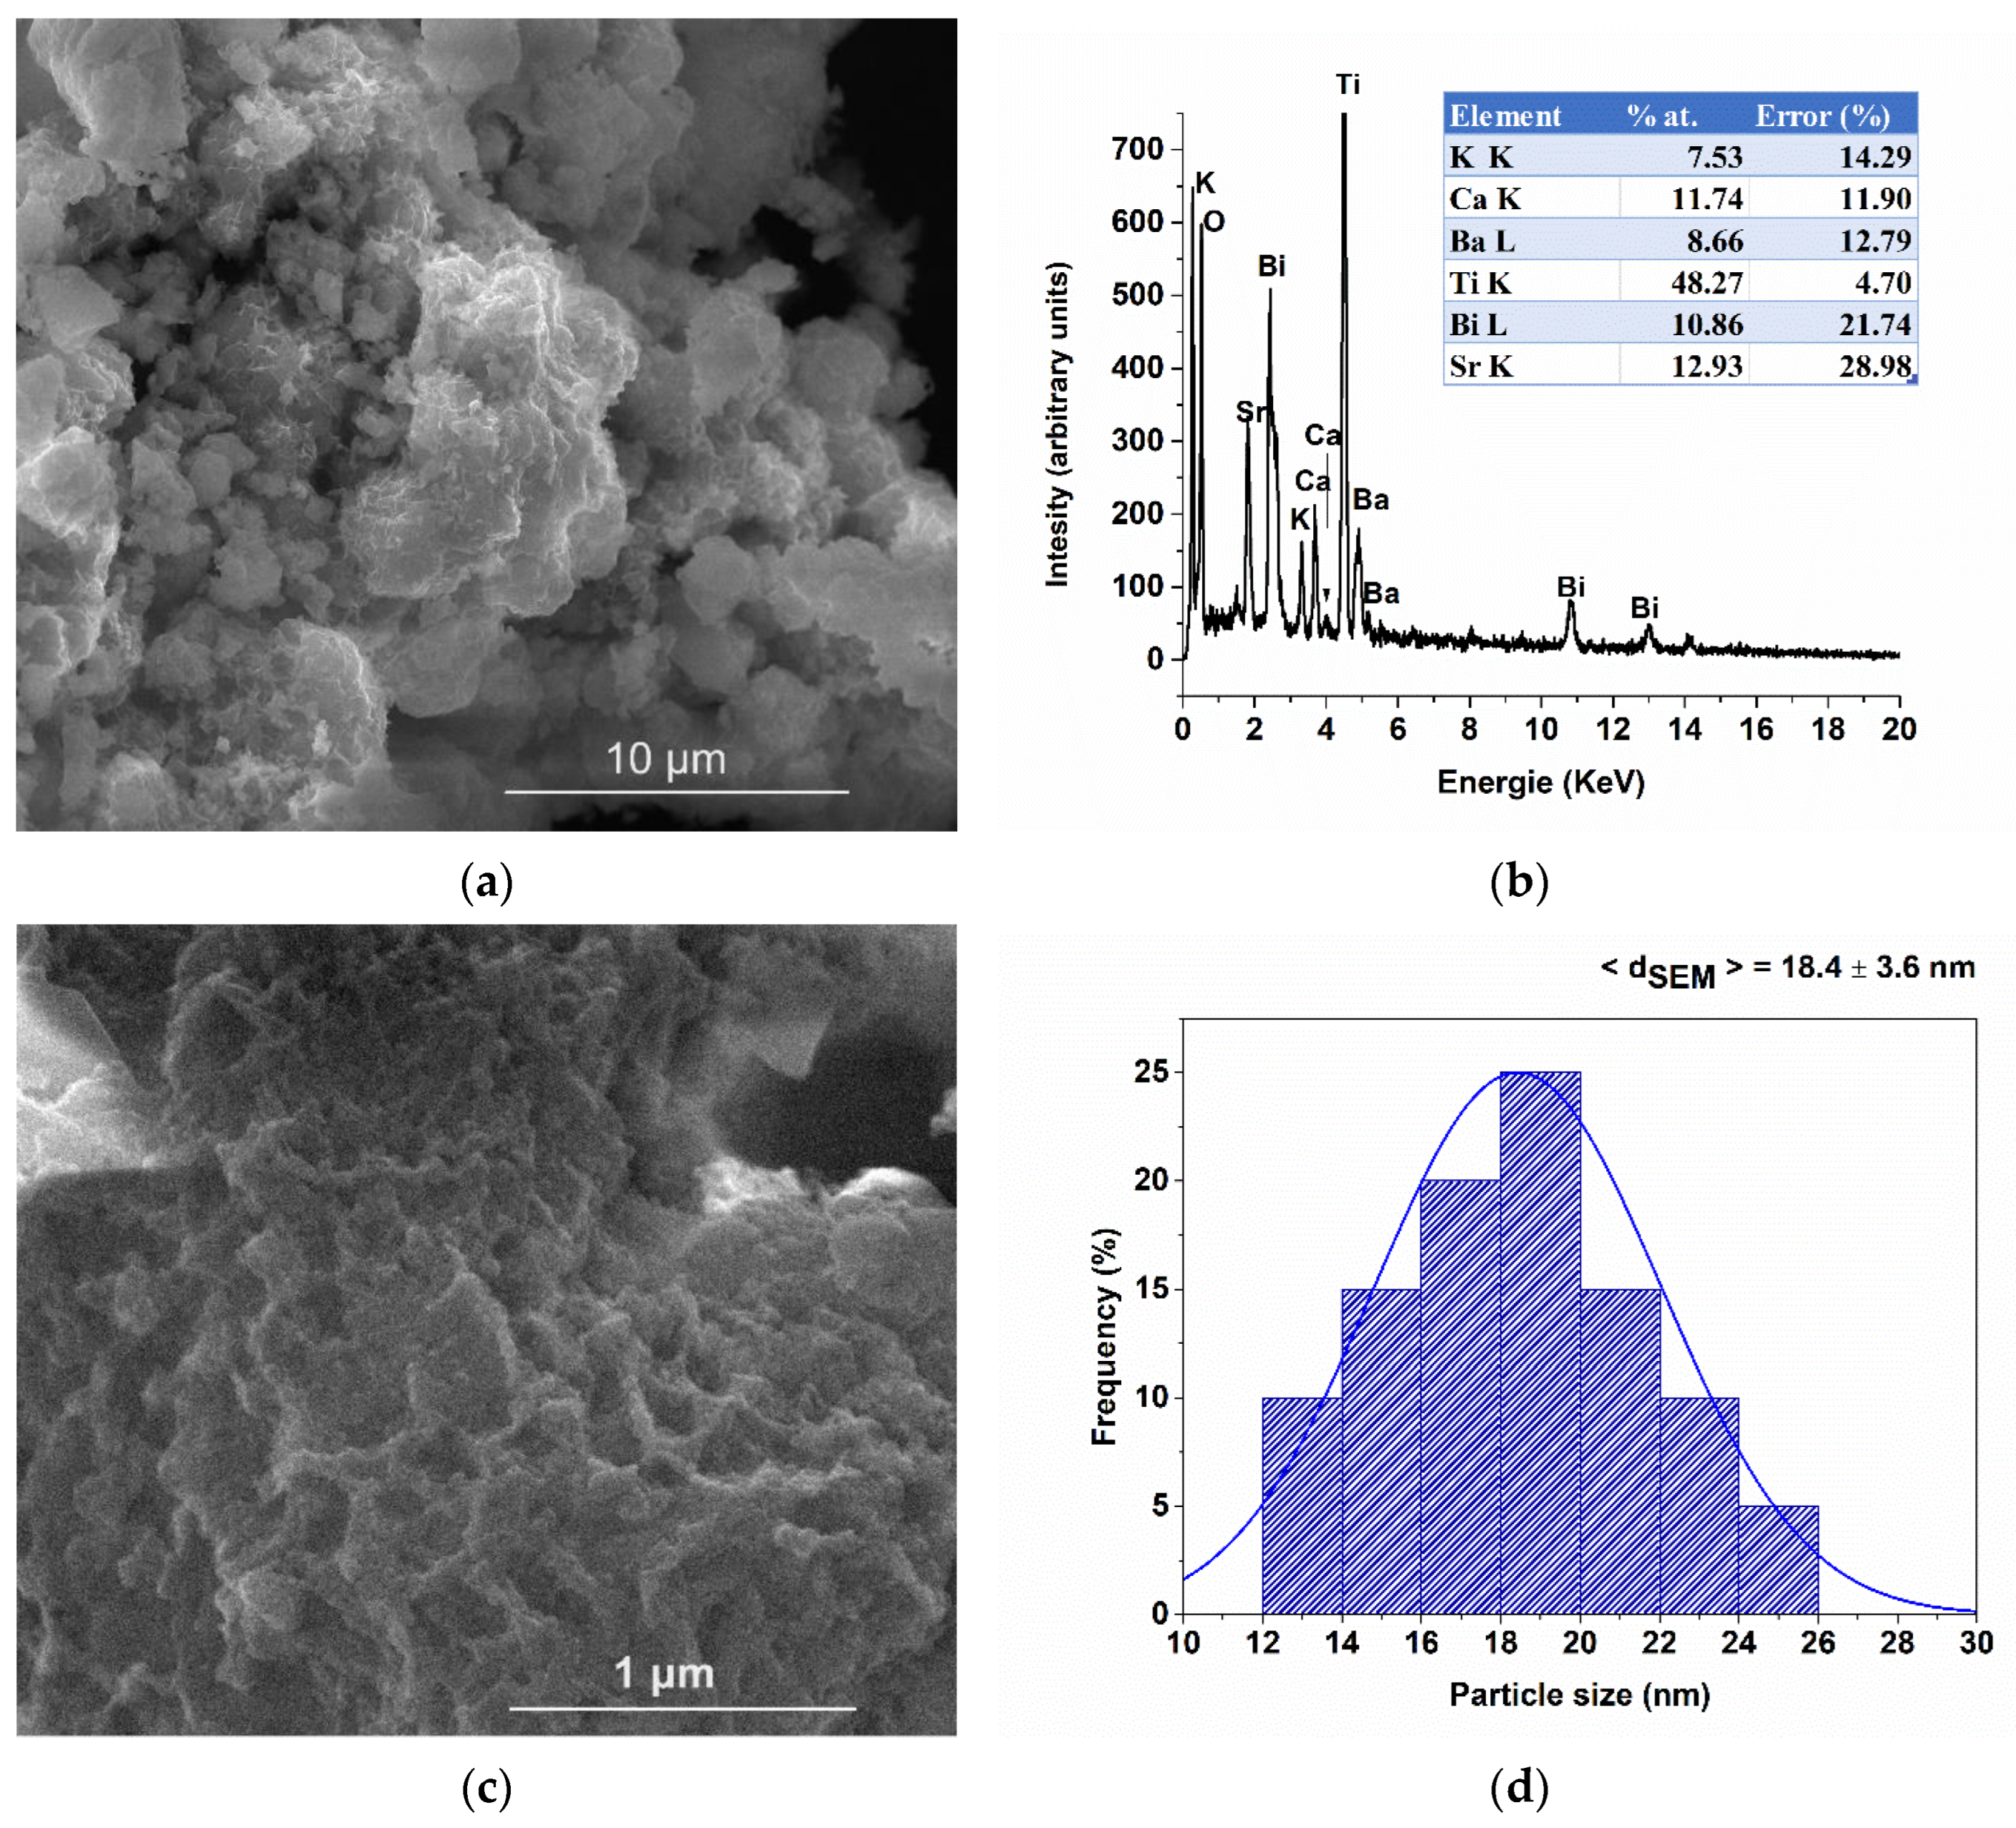
| Element | Wt% | Est. Error |
|---|---|---|
| Ti | 32.03 | 0.23 |
| Bi | 25.79 | 0.22 |
| Ba | 16.75 | 0.19 |
| Sr | 10.82 | 0.16 |
| Ca | 6.54 | 0.12 |
| K | 5.84 | 0.12 |
| Processing Parameters | 900 °C/4 h | 950 °C/4 h | 1000 °C/4 h | |||
|---|---|---|---|---|---|---|
| Crystal system | Tetragonal | Cubic | Tetragonal | Cubic | Tetragonal | Cubic |
| Phase amount (%) | 54.3 | 45.7 | 66.6 | 33.4 | 73.7 | 26.3 |
| a (Å) | 3.819 ± 0.002 | 3.983 ± 0.001 | 3.912 ± 0.003 | 3.980 ± 0.001 | 3.936 ± 0.007 | 3.967 ± 0.001 |
| c (Å) | 3.964 ± 0.005 | 3.983 ± 0.001 | 3.938 ± 0.006 | 3.980 ± 0.001 | 3.938 ± 0.015 | 3.967 ± 0.001 |
| c/a | 1.038 | 1.000 | 1.006 | 1.000 | 1.001 | 1.000 |
| V (Å3) | 60.87 | 63.19 | 60.28 | 63.020 | 60.99 | 62.41 |
| ρt (g/cm3) | 5.35 | 5.37 | 5.36 | |||
| ρa (g/cm3) | 4.65 | 4.41 | 4.17 | |||
| ρr (%) | 86.89 | 82.09 | 77.77 | |||
| Rexp | 6.90 | 6.94 | 7.03 | |||
| Rp | 5.38 | 5.43 | 5.28 | |||
| Rwp | 7.48 | 7.53 | 7.01 | |||
| χ2 | 1.18 | 1.18 | 0.99 | |||
| Average crystallite size <D> (nm) | 5.58 ± 2.23 | 40.31 ± 14.05 | 6.38 ± 1.60 | 28.05 ± 9.57 | 7.93 ± 3.84 | 28.53 ± 15.25 |
| Grain size <GS> (nm) | 35.93 ± 17.59 | 40.82 ± 10.11 | 50.53 ± 13.94 | |||
| Samples | <GS> (nm) | ε′m | Tm | Δ | ξ | ε′ (RT) | Tan δ (RT) |
|---|---|---|---|---|---|---|---|
| BiKBSCT-900 | 50.53 | 41 | 249 | 690 | 1.58 | 40 | 0.0074 |
| BiKBSCT-950 | 40.82 | 58 | 266 | 678 | 1.53 | 58 | 0.0084 |
| BiKBSCT-1000 | 35.93 | 157 | 276 | 615 | 1.49 | 156 | 0.088 |
| Sample | Measuring Temperature | |||||
|---|---|---|---|---|---|---|
| 100 K | 300 K | 500 K | ||||
| n | m | n | m | n | m | |
| BiKBSCT-900 | 0.97 | 1.97 | 0.98 | 1.97 | 0.33 | 2 |
| BiKBSCT-950 | 0.97 | 1.96 | 0.98 | 1.96 | 0.32 | 2 |
| BiKBSCT-1000 | 0.98 | 1.96 | 0.89 | 1.92 | 0.3 | 1.98 |
| Sample | Rs | Qgb | ngb | Rgb | Qg | ng | Rg | Cgb | Cg |
|---|---|---|---|---|---|---|---|---|---|
| BiKBSCT-900 | 703 | 8.18 × 10⁻⁸ | 0.68 | 164,350 | 1.61 × 10⁻¹¹ | 0.999 | 3.16 × 10¹⁰ | 9.67 × 10⁻⁹ | 1.61 × 10⁻¹¹ |
| BiKBSCT-950 | 593 | 3.44 × 10⁻⁸ | 0.73 | 150,600 | 1.88 × 10⁻¹¹ | 1 | 9.64 × 10⁹ | 4.24 × 10⁻⁹ | 1.88 × 10⁻¹¹ |
| BiKBSCT-1000 | 364 | 3.0 × 10⁻⁸ | 0.74 | 144,680 | 2.78 × 10⁻¹¹ | 1 | 8.03 × 10⁹ | 4.07 × 10⁻⁹ | 2.78 × 10⁻¹¹ |
Disclaimer/Publisher’s Note: The statements, opinions and data contained in all publications are solely those of the individual author(s) and contributor(s) and not of MDPI and/or the editor(s). MDPI and/or the editor(s) disclaim responsibility for any injury to people or property resulting from any ideas, methods, instructions or products referred to in the content. |
© 2023 by the authors. Licensee MDPI, Basel, Switzerland. This article is an open access article distributed under the terms and conditions of the Creative Commons Attribution (CC BY) license (https://creativecommons.org/licenses/by/4.0/).
Share and Cite
Surdu, V.-A.; Marinică, M.-A.; Pătru, R.-E.; Oprea, O.-C.; Nicoară, A.I.; Vasile, B.Ș.; Trușca, R.; Ianculescu, A.-C. High-Entropy Lead-Free Perovskite Bi0.2K0.2Ba0.2Sr0.2Ca0.2TiO3 Powders and Related Ceramics: Synthesis, Processing, and Electrical Properties. Nanomaterials 2023, 13, 2974. https://doi.org/10.3390/nano13222974
Surdu V-A, Marinică M-A, Pătru R-E, Oprea O-C, Nicoară AI, Vasile BȘ, Trușca R, Ianculescu A-C. High-Entropy Lead-Free Perovskite Bi0.2K0.2Ba0.2Sr0.2Ca0.2TiO3 Powders and Related Ceramics: Synthesis, Processing, and Electrical Properties. Nanomaterials. 2023; 13(22):2974. https://doi.org/10.3390/nano13222974
Chicago/Turabian StyleSurdu, Vasile-Adrian, Mariana-Andreea Marinică, Roxana-Elena Pătru, Ovidiu-Cristian Oprea, Adrian Ionuț Nicoară, Bogdan Ștefan Vasile, Roxana Trușca, and Adelina-Carmen Ianculescu. 2023. "High-Entropy Lead-Free Perovskite Bi0.2K0.2Ba0.2Sr0.2Ca0.2TiO3 Powders and Related Ceramics: Synthesis, Processing, and Electrical Properties" Nanomaterials 13, no. 22: 2974. https://doi.org/10.3390/nano13222974