
Investigations on the Degradation Behavior of Processed FeMnSi-xCu Shape Memory Alloys
 ,
,  ,
,  ,
,  ,
,  ,
,
Abstract
:1. Introduction

| Tested Material | Solution Used in the Experiment | DR | Reference | |
|---|---|---|---|---|
| Electrochemical mm/Year | Immersion mm/Year | |||
| Pure Fe | Hank’s solution | 0.105 | - | [43] |
| Pure Fe | Hank’s solution | 0.16 | - | [44] |
| Pure Fe | SBF | 0.041 | 0.101 (70 days) | [45] |
| Fe-30Mn | 0.899 | 0.028 (70 days) | ||
| Fe-30Mn | SBF | 0.29 | 0.24 (21 days) | [46] |
| Fe-2Pd | SBF | - | 0.025 (70 days) | [47] |
| Fe-23Mn-5Si | Hank’s solution | 0.48 | - | [37] |
| Fe-26Mn-5Si | 0.59 | |||
| Fe-30Mn-5Si | 0.80 | |||
| Fe-15Mn-3Si | Ringer’s solution | 0.133 | 0.45 (3 days) | [48] |
| Fe-14Mn-4Si-2Al | Ringer’s solution | 0.054 | 0.13 (7 days) | [5] |
| Fe-29Mn-5Si-1Ag | Ringer’s solution | - | 0.08 (14 days) | [49] |
| Fe-29Mn-5Si-2Ag | 0.14 (14 days) | |||
| Fe-35Mn-0Cu | Hank’s solution | 0.043 | - | [39] |
| Fe-34Mn-1Cu | 0.032 | |||
| Fe-25Mn-10Cu | 0.258 | |||
| Fe-30Mn-1C-0.8Cu | Artificial urine solution | - | 0.4 (7 days) | [40] |
| 0.3 (90 days) | ||||
| Fe-30Mn-1C-0.5Cu | SBF | 0.04 | - | [41] |
| Fe-30Mn-1C-1Cu | 0.05 | |||
| Fe-30Mn-1C-1.5Cu | 0.05 | |||
| Fe-35Mn | Hank’s solution | 0.05 | - | [42] |
| FeMn-1Cu | 0.06 | |||
| FeMn-3Cu | 0.07 | |||
| FeMn-6Cu | 0.27 | |||
| FeMn-10Cu | 0.06 | |||
2. Materials and Methods
3. Experimental Results
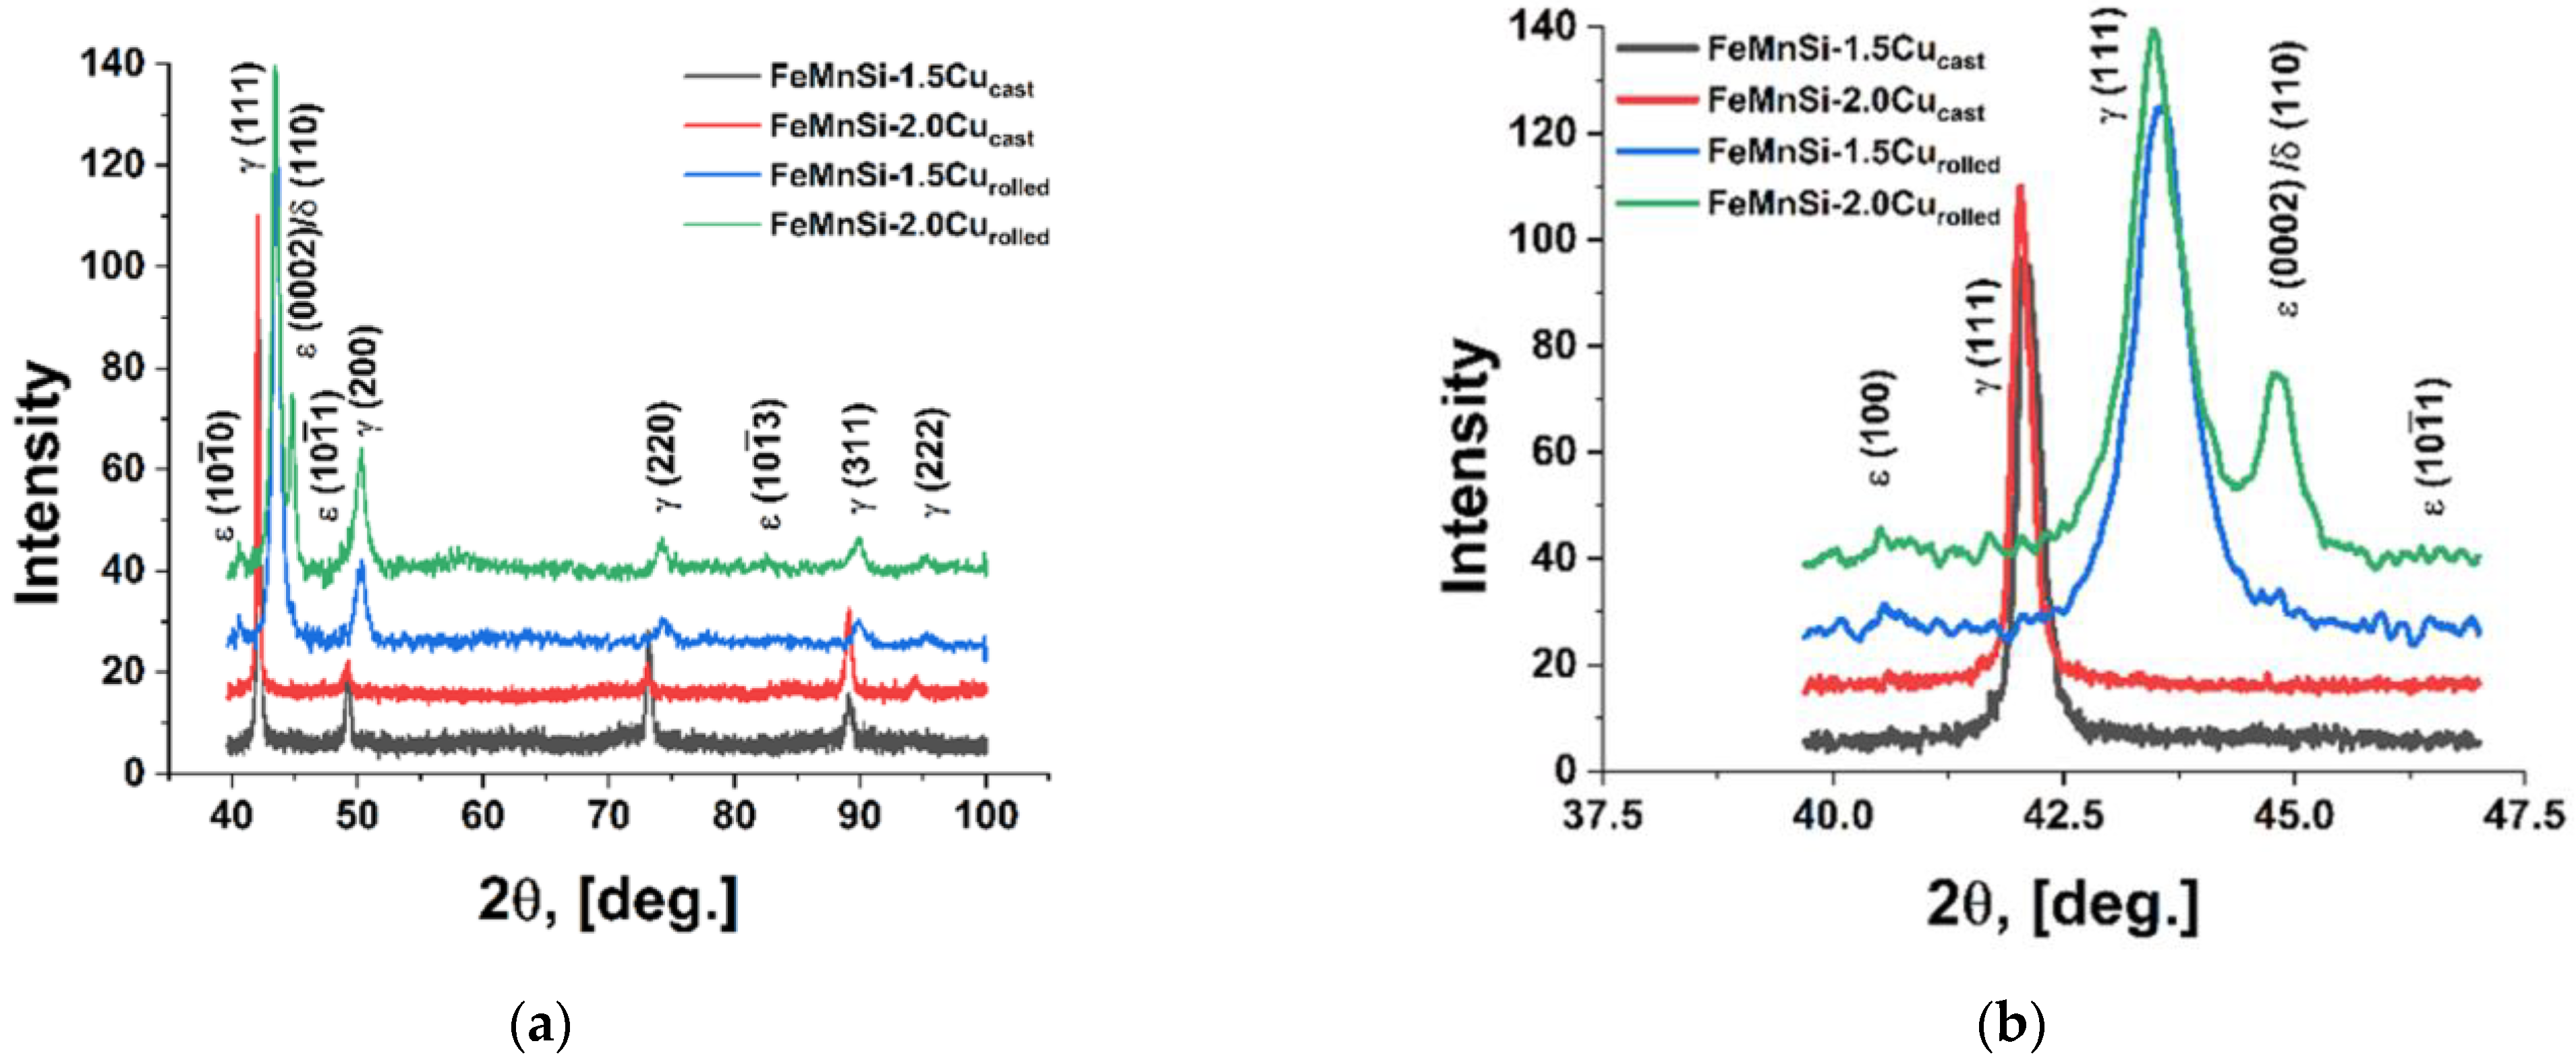
3.1. Structural and Chemical Analysis of the Experimental Alloys
3.2. Dynamic Mechanical Analysis (DMA)
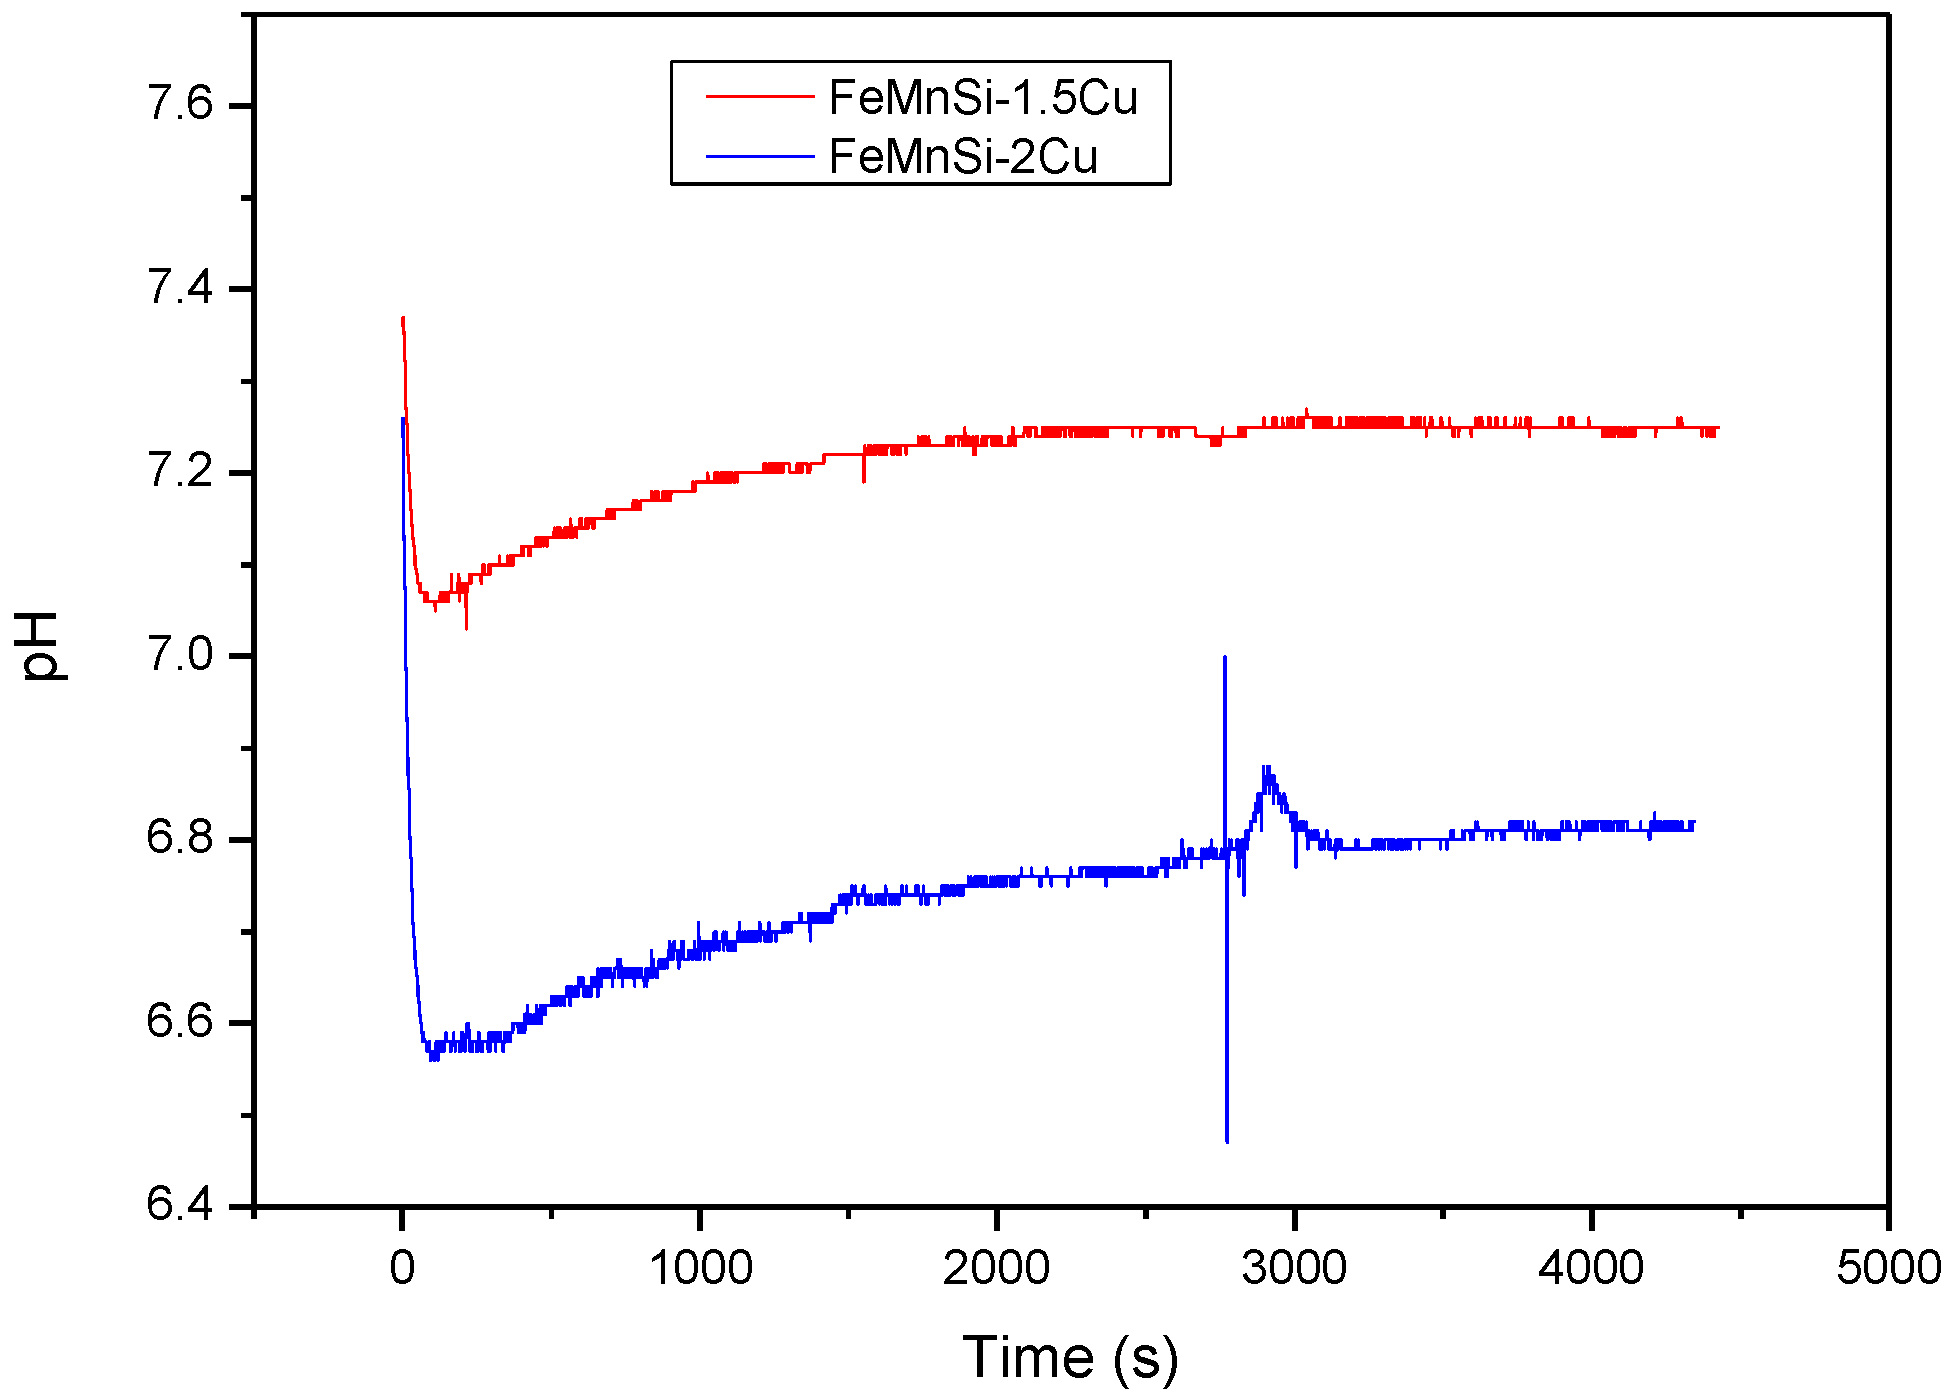
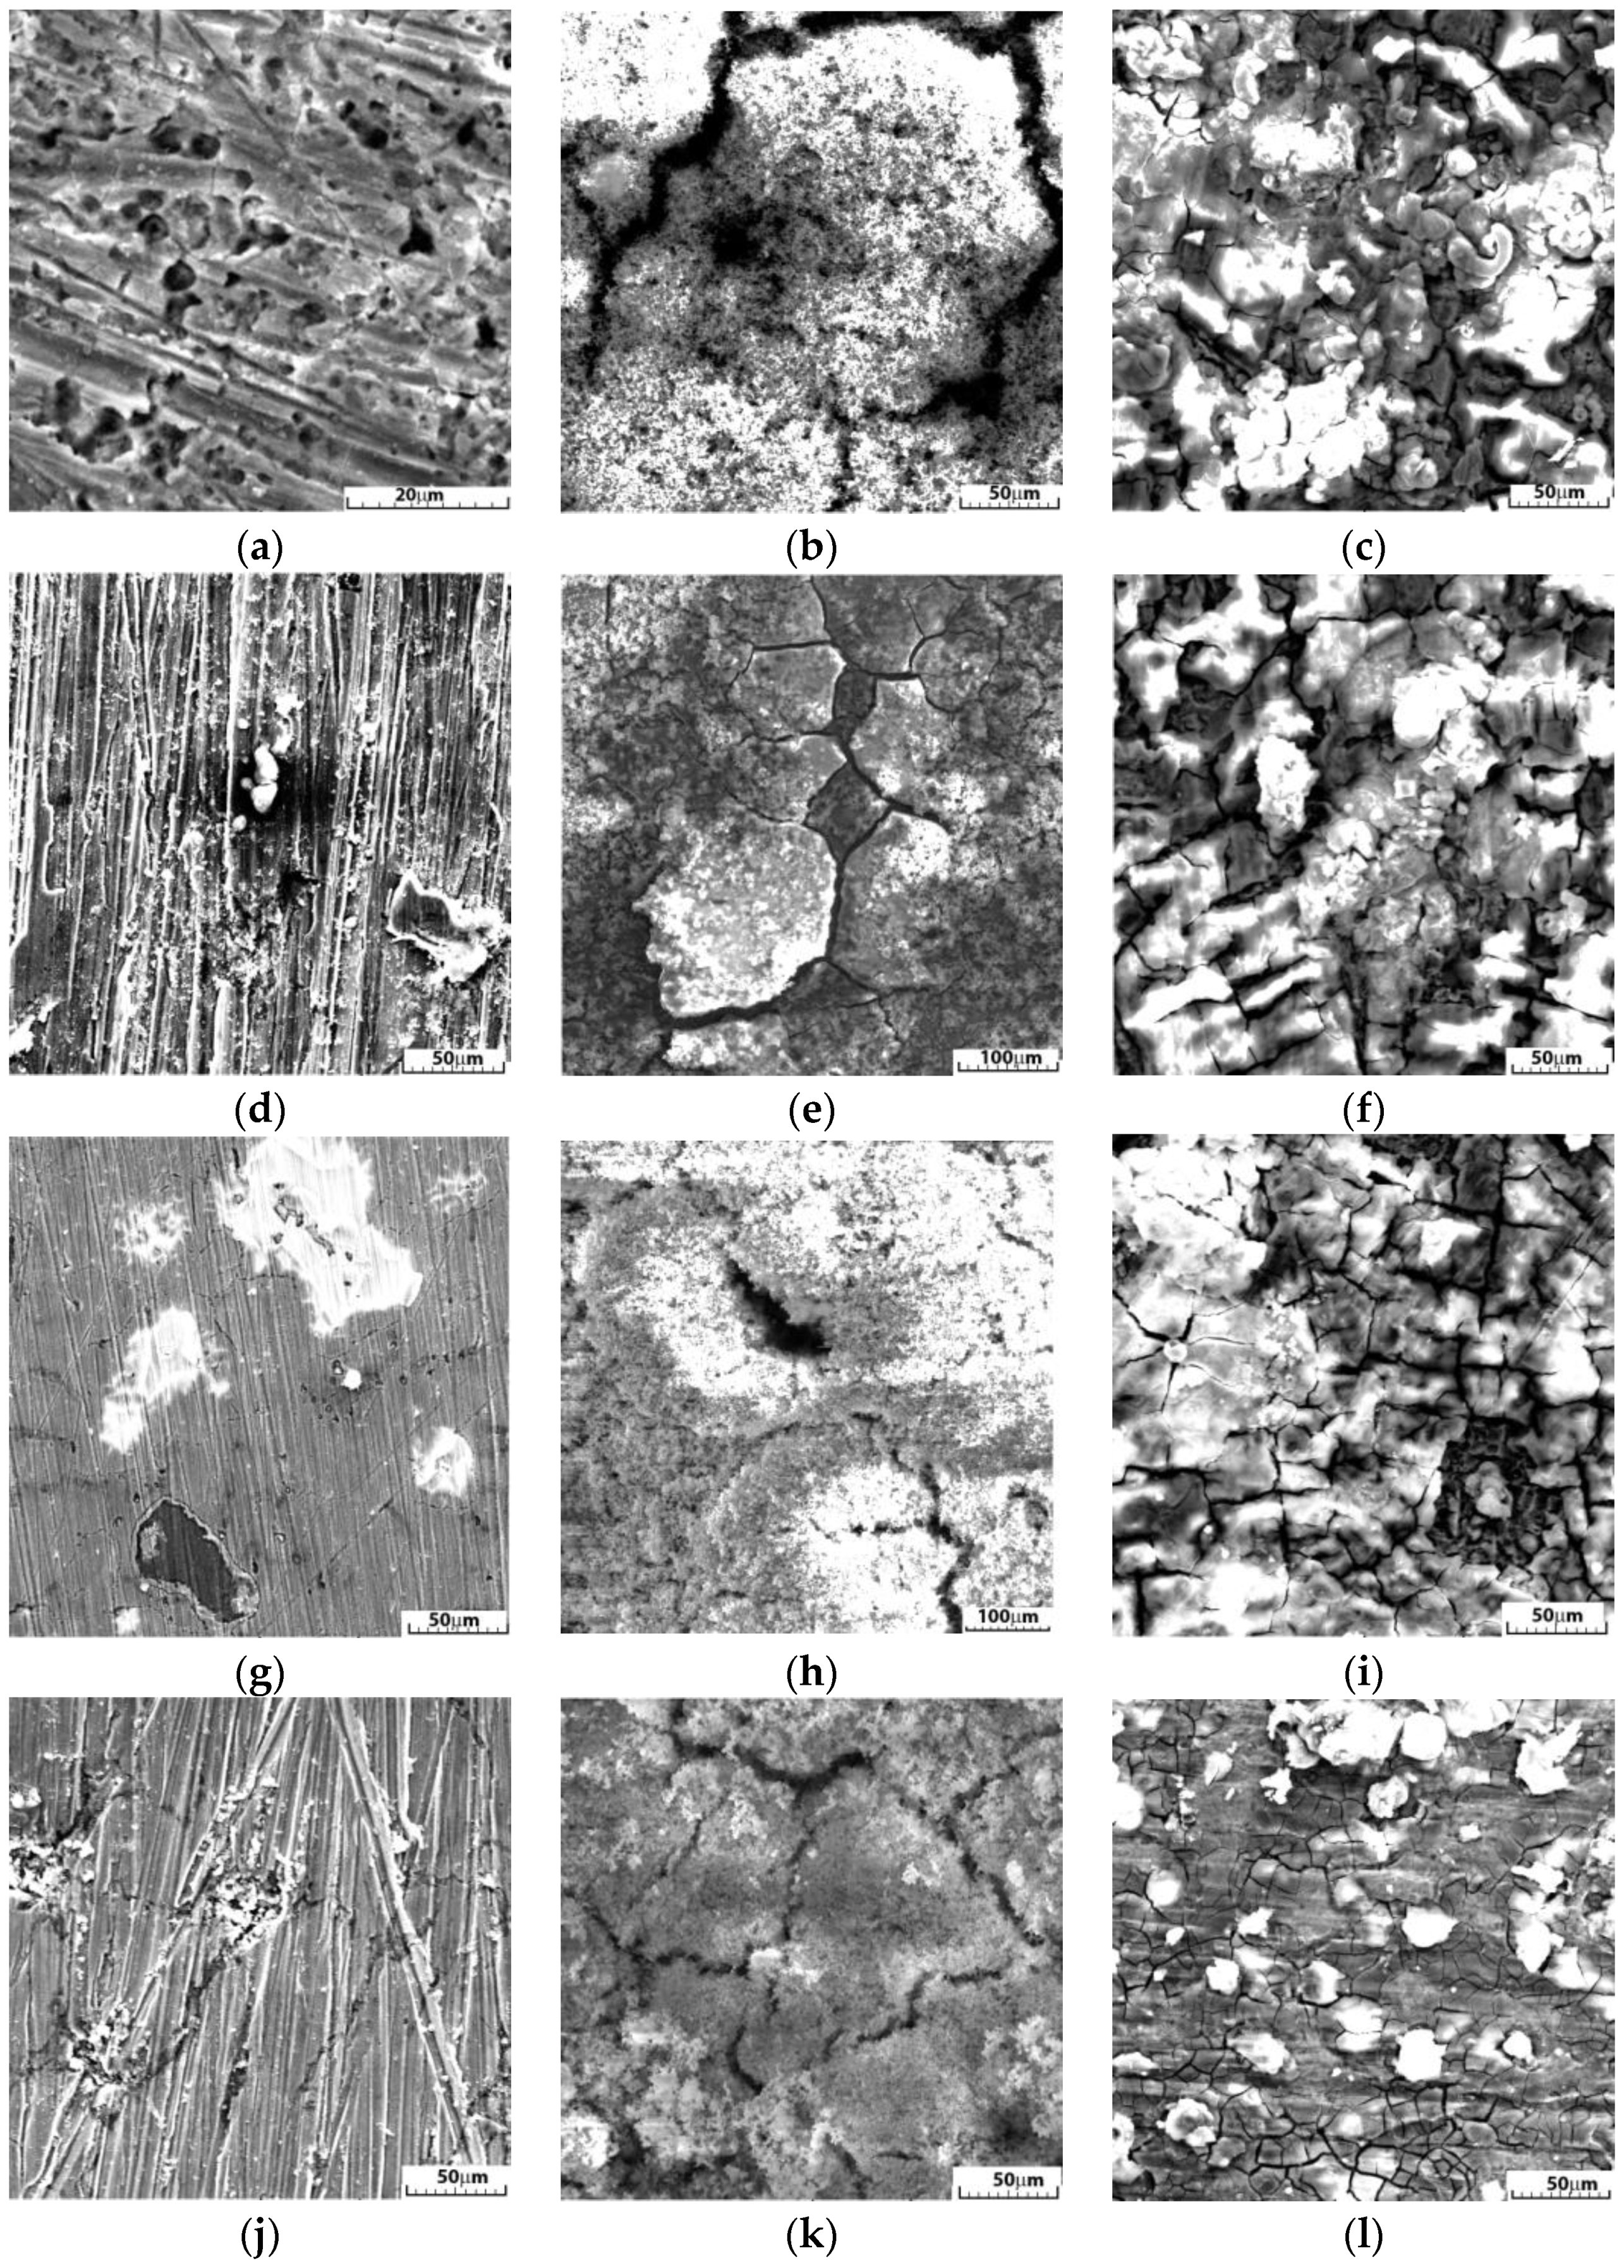
3.3. In Vitro Immersion Tests, Degradation Rates and pH Monitoring
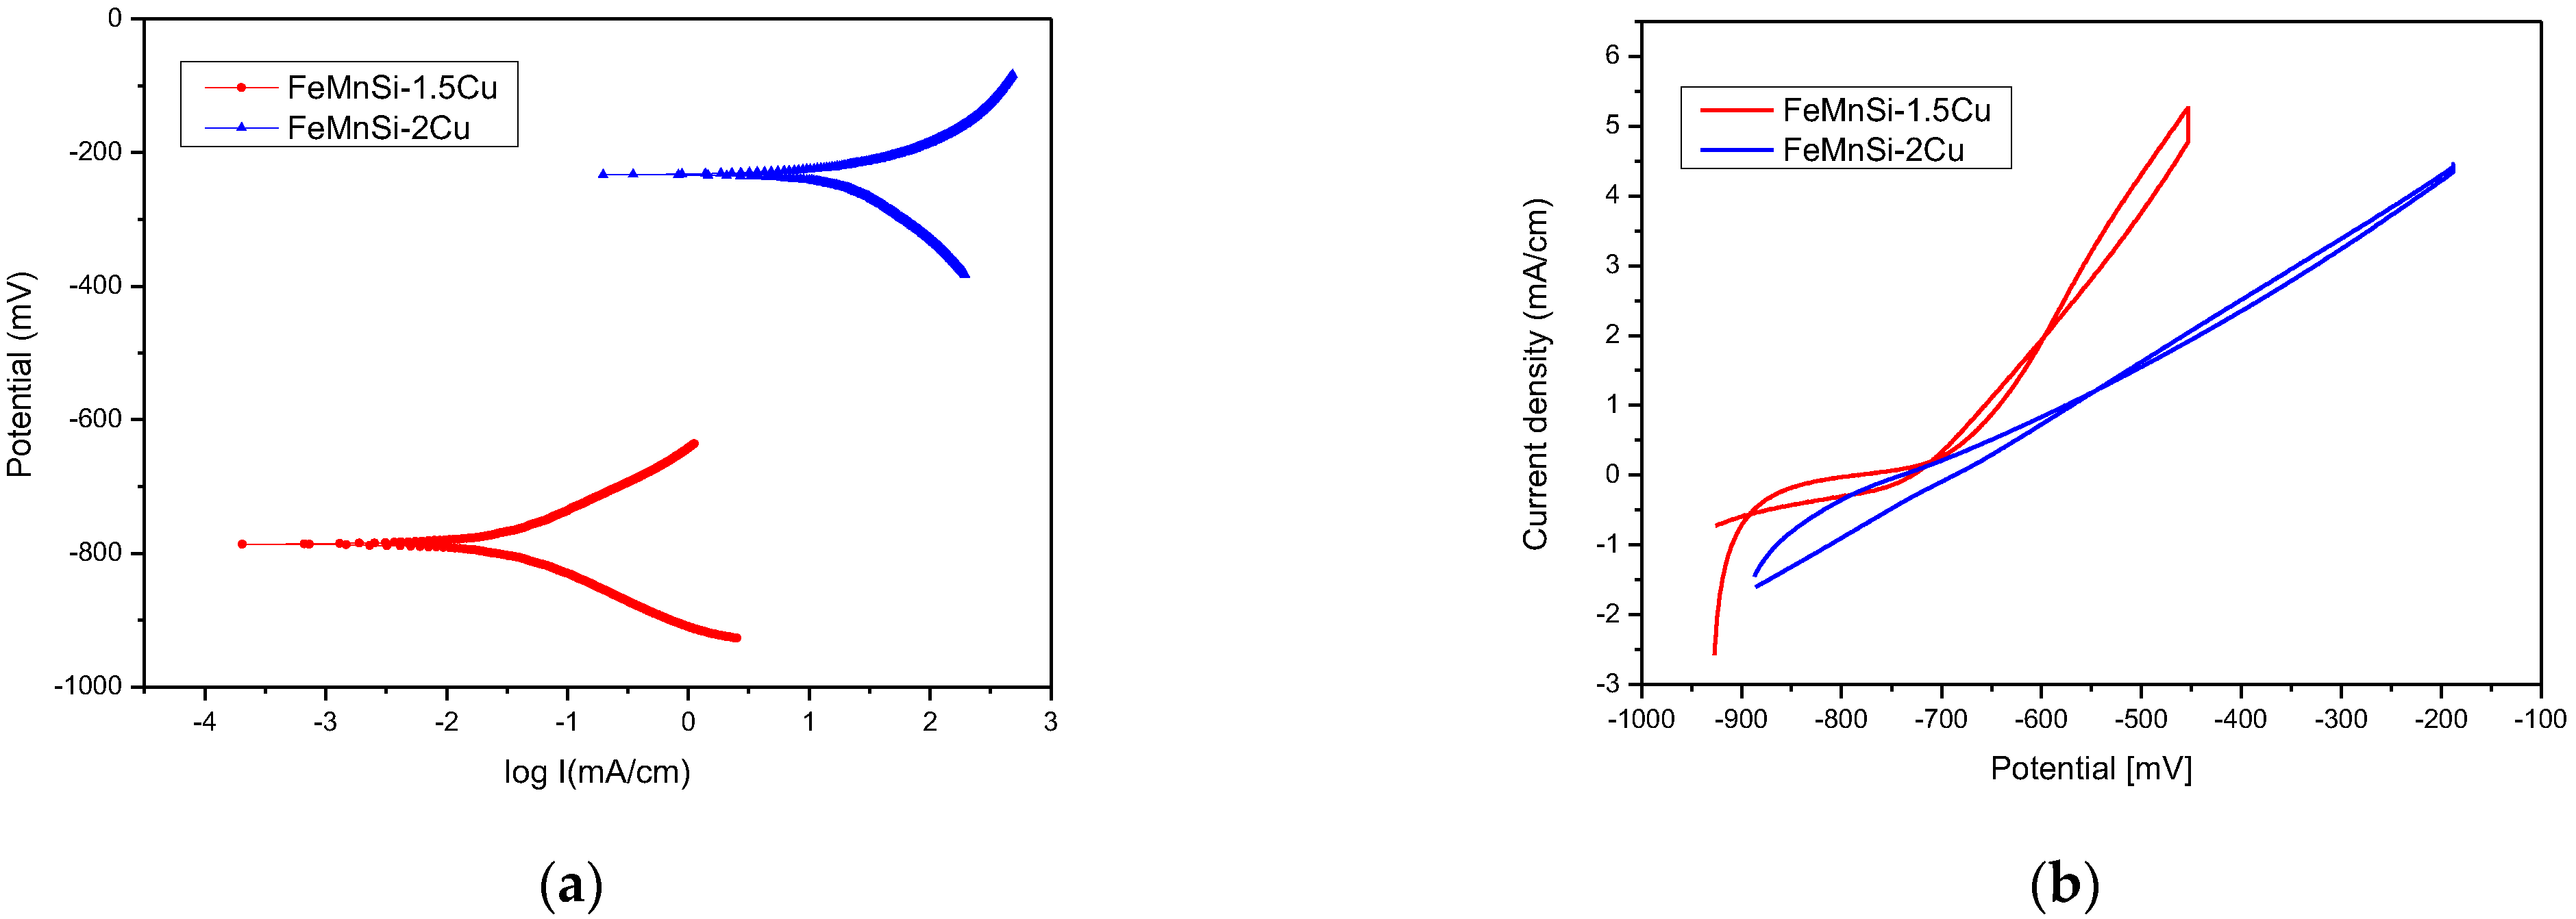
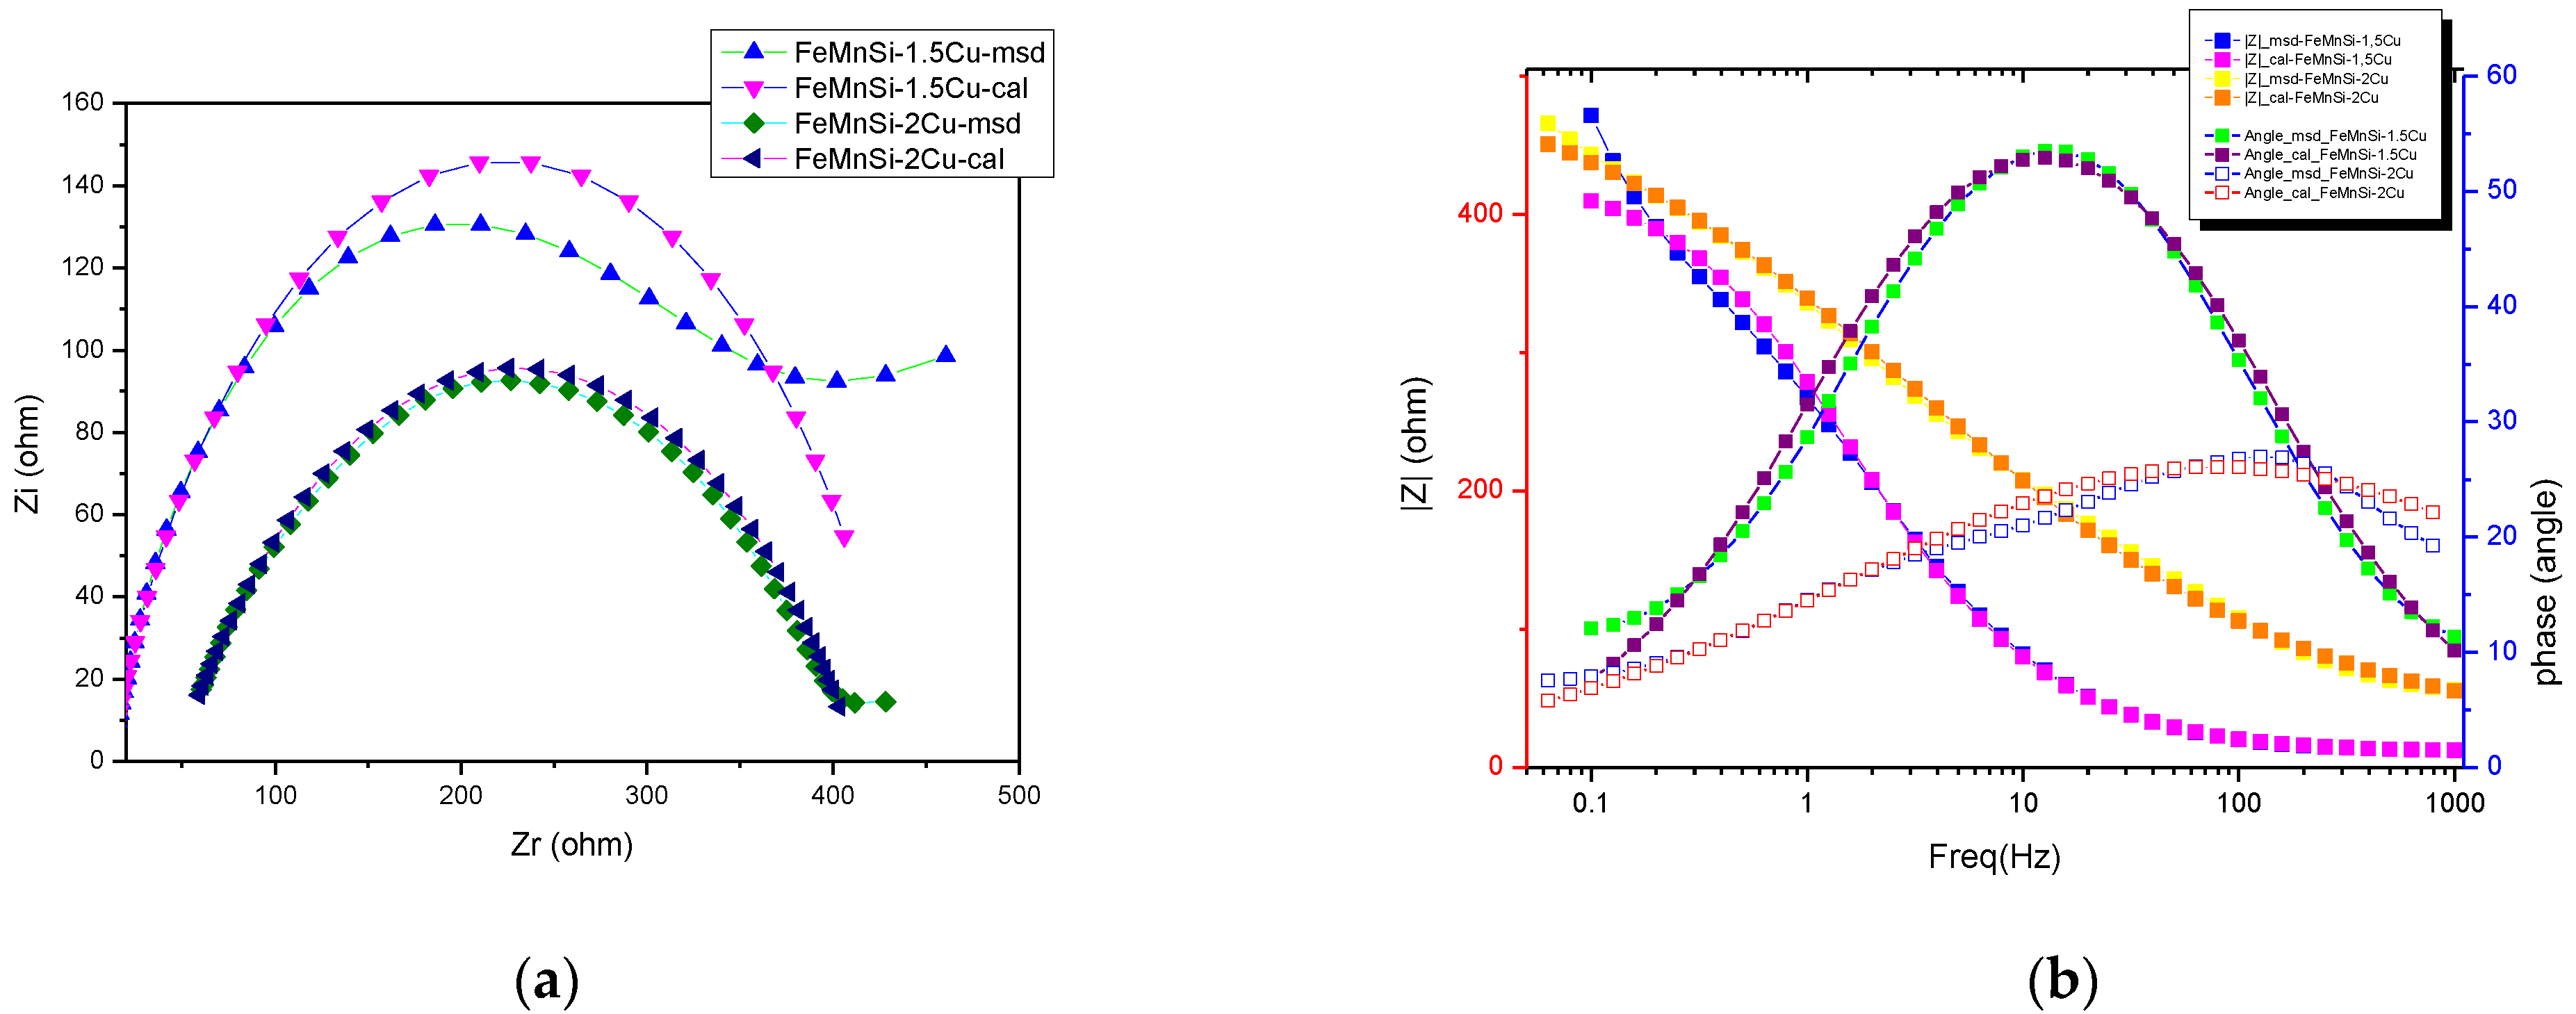
3.4. Electrochemical Corrosion Resistance Tests (LP and CP, EIS)
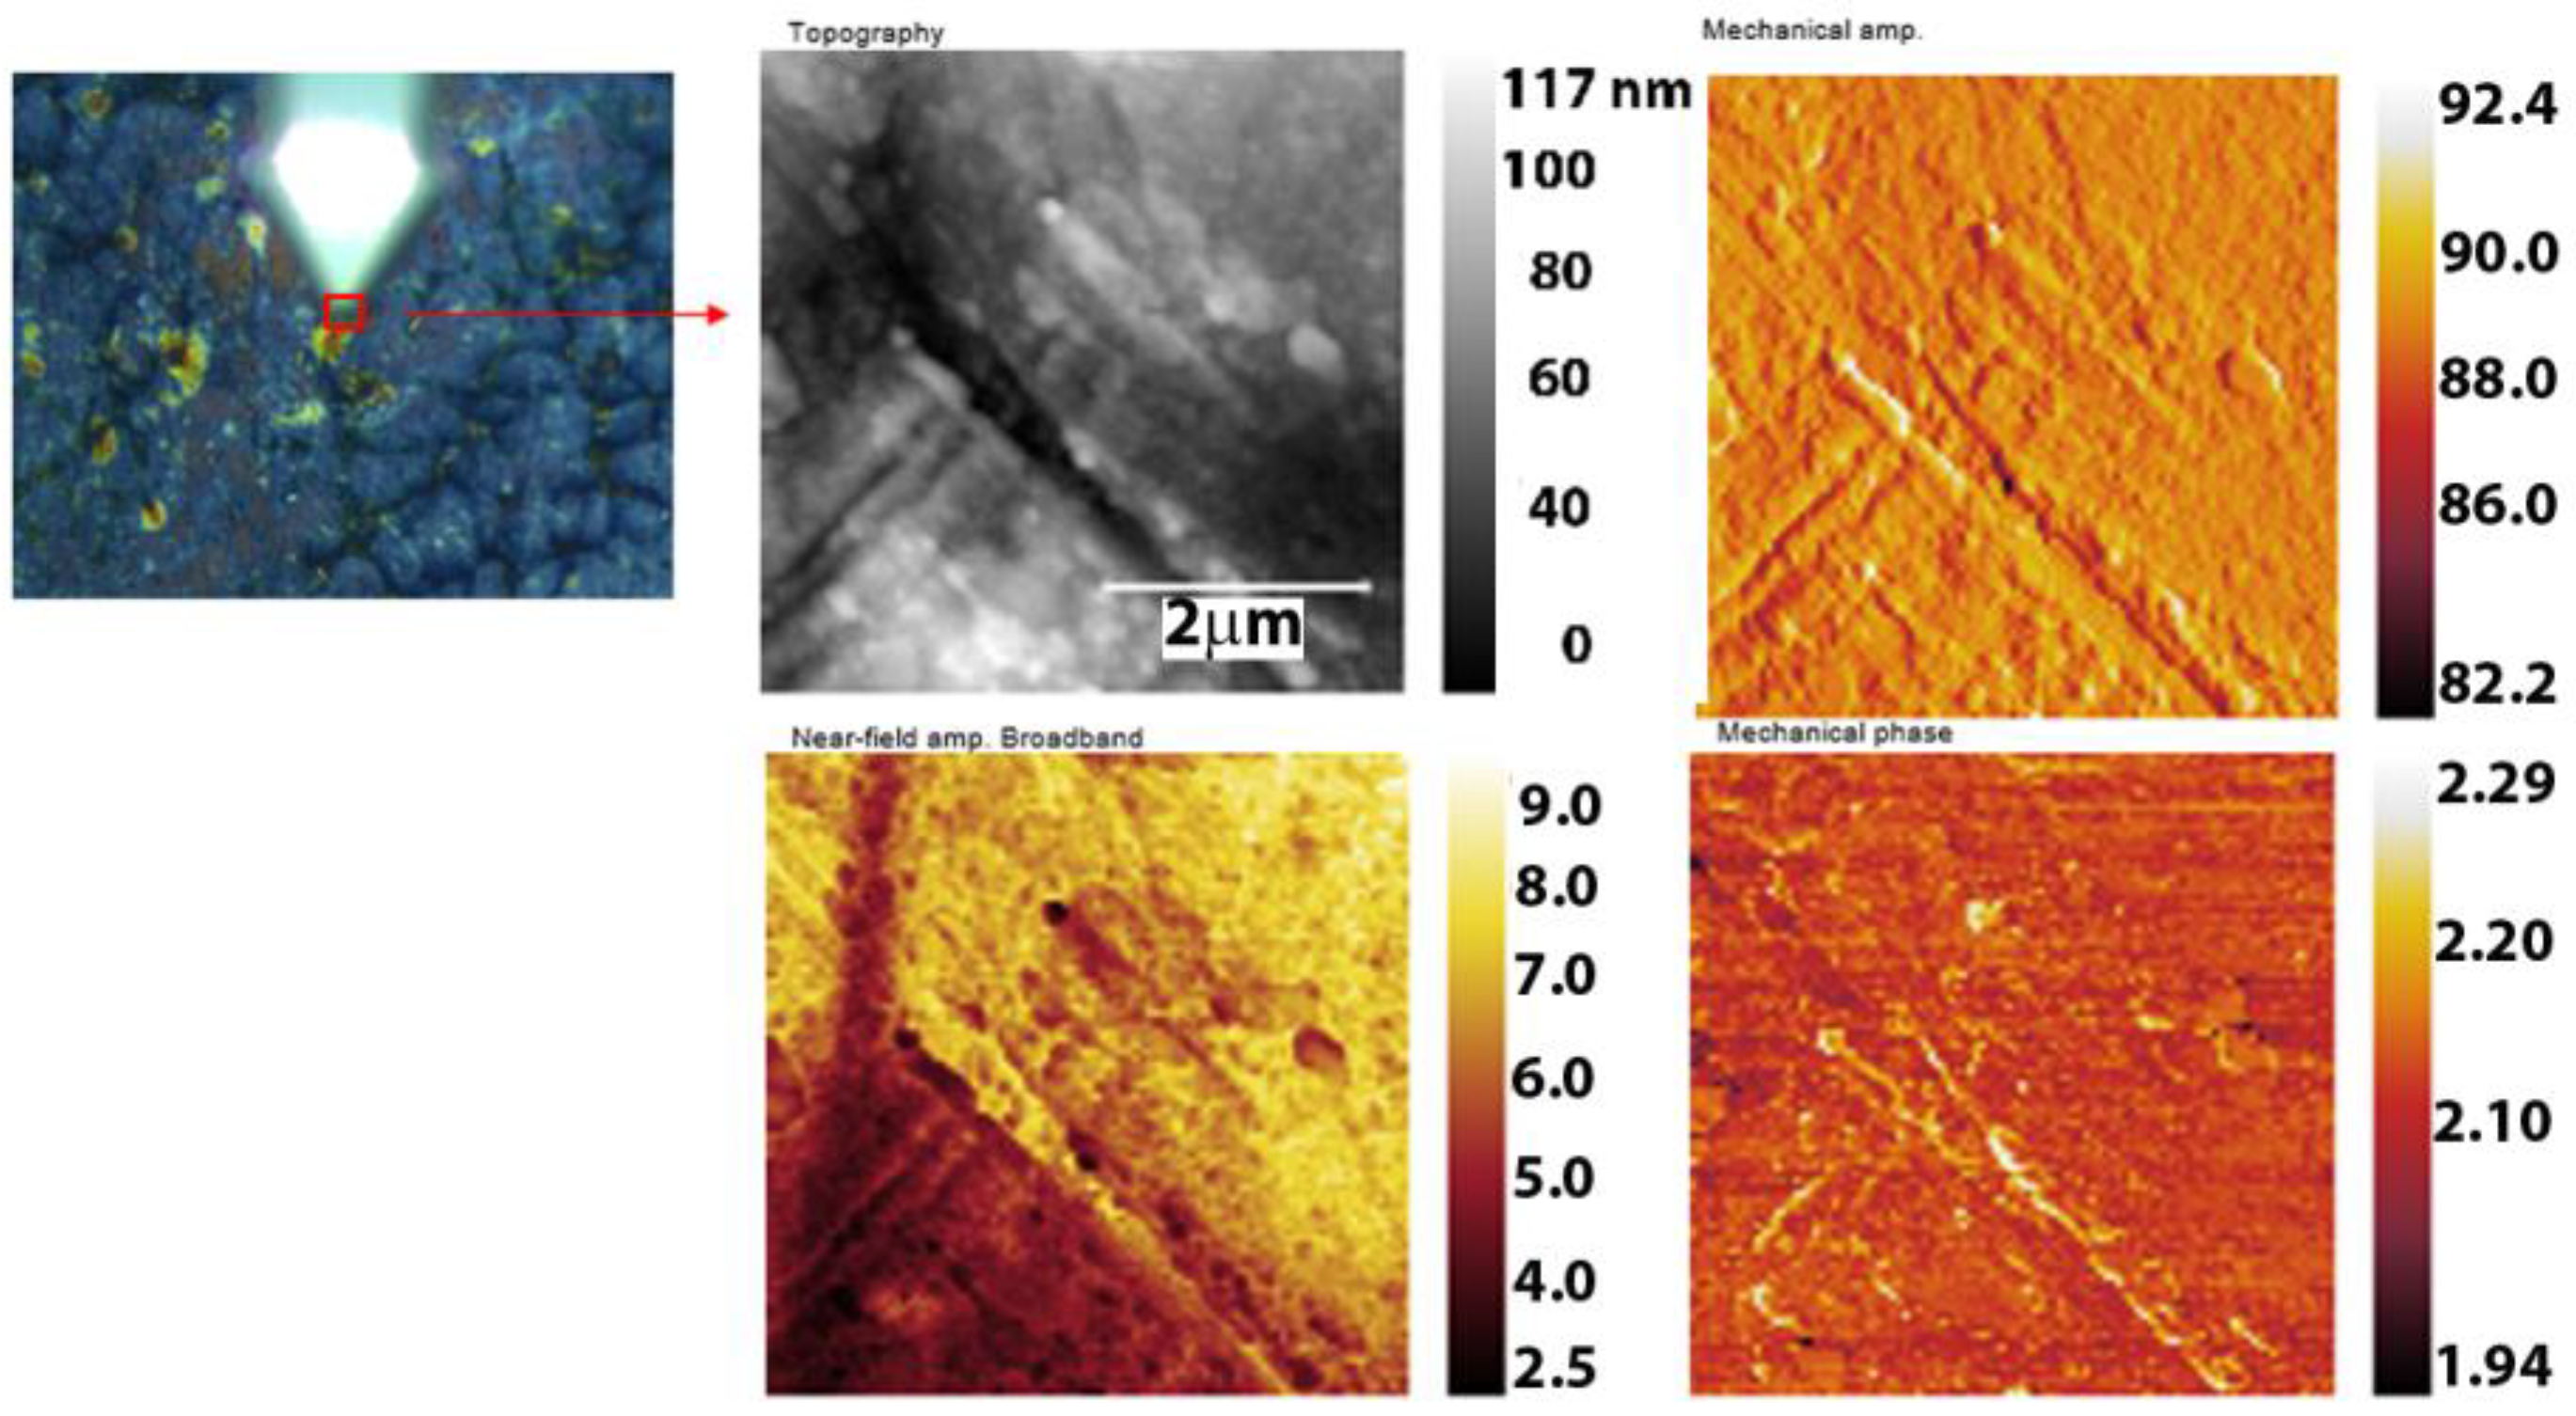
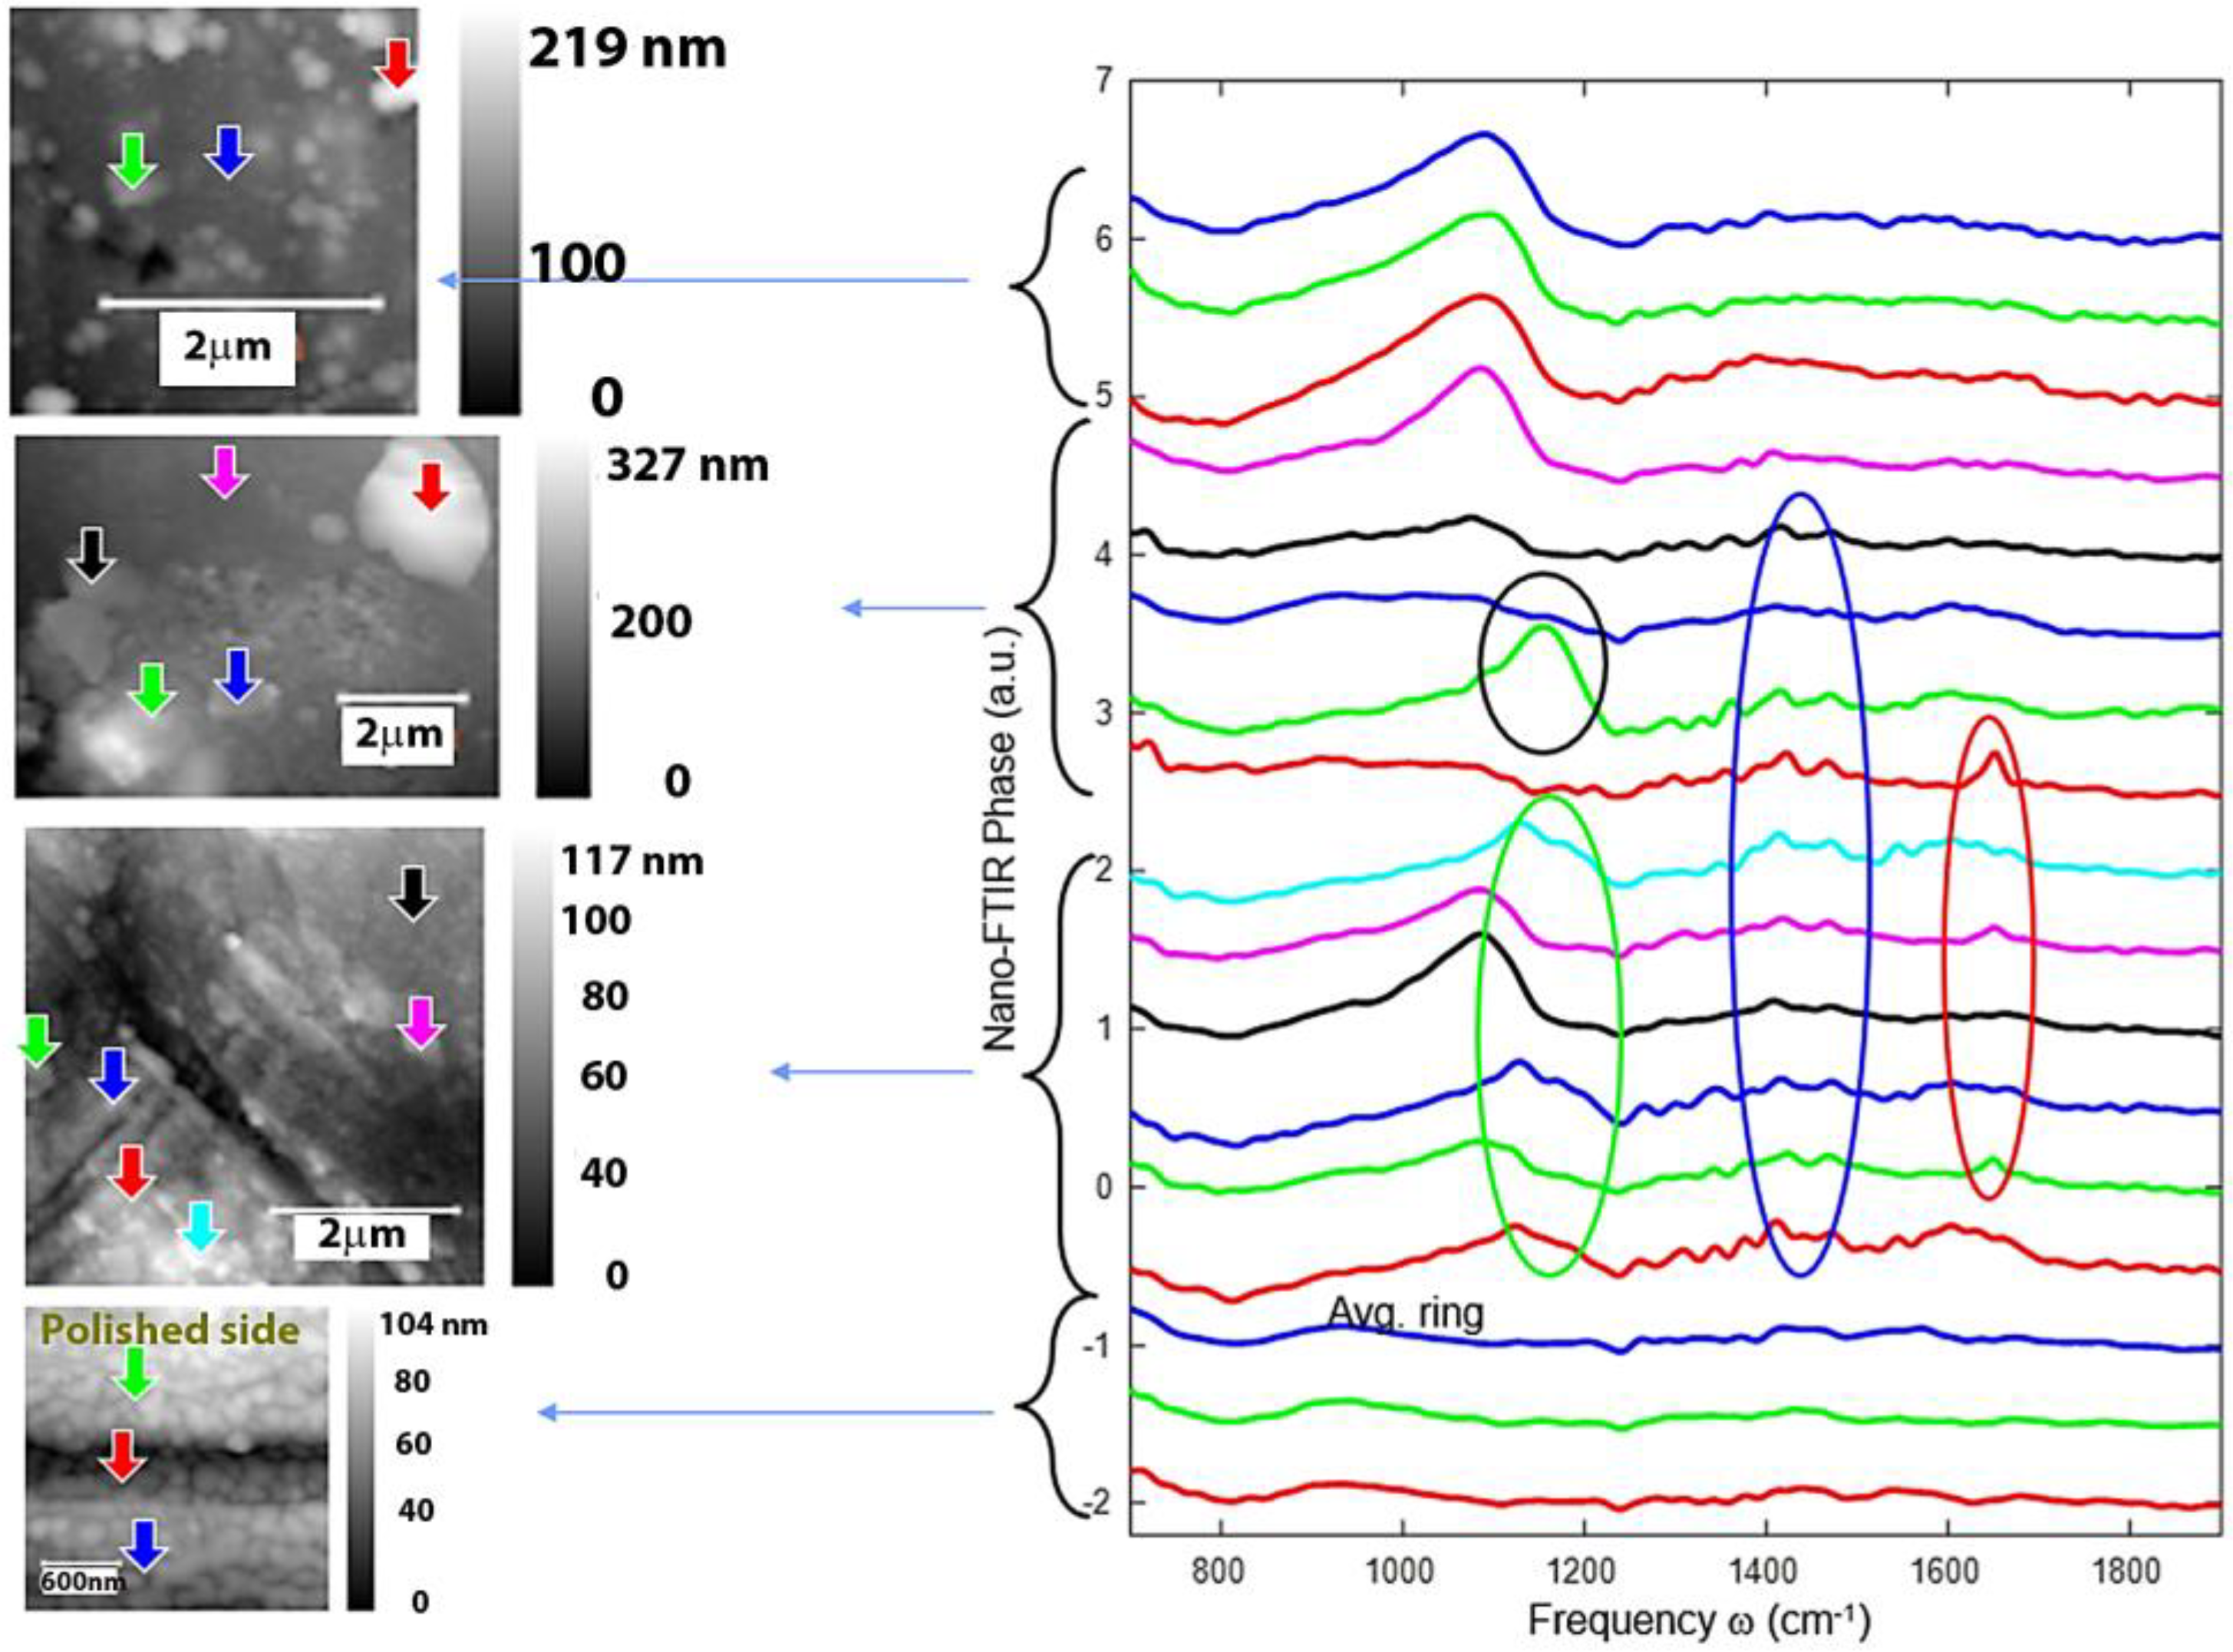
3.5. Nano-FTIR Analysis of Corrosion Products
4. Discussion
5. Conclusions
Author Contributions
Funding
Data Availability Statement
Acknowledgments
Conflicts of Interest
References
- Im, S.H.; Jung, Y.; Kim, S.H. Current status and future direction of biodegradable metallic and polymeric vascular scaffolds for next-generation stents. Acta Biomater. 2017, 60, 3–22. [Google Scholar] [CrossRef]
- Kraus, T.; Moszner, F.; Fischerauer, S.; Fiedler, M.; Martinelli, E.; Eichler, J.; Witte, F.; Willbold, E.; Schinhammer, M.; Meischel, M. Biodegradable Fe-based alloys for use in osteosynthesis: Outcome of an in vivo study after 52 weeks. Acta Biomater. 2014, 10, 3346–3353. [Google Scholar] [CrossRef]
- Panaghie, C.; Cimpoeșu, R.; Istrate, B.; Cimpoeșu, N.; Bernevig, M.-A.; Zegan, G.; Roman, A.-M.; Chelariu, R.; Sodor, A. New Zn3Mg-xY Alloys: Characteristics, Microstructural Evolution and Corrosion Behavior. Materials 2021, 14, 2505. [Google Scholar] [CrossRef]
- Istrate, B.; Munteanu, C.; Antoniac, I.-V.; Lupescu, Ș.-C. Current Research Studies of Mg–Ca–Zn Biodegradable Alloys Used as Orthopedic Implants—Review. Crystals 2022, 12, 1468. [Google Scholar] [CrossRef]
- Roman, A.M.; Voiculescu, I.; Cimpoeșu, R.; Istrate, B.; Chelariu, R.; Cimpoeșu, N.; Zegan, G.; Panaghie, C.; Lohan, N.M.; Axinte, M.; et al. Microstructure, shape memory effect, chemical composition and corrosion resistance performance of biodegradable FeMnSi-Al alloy. Crystals 2023, 13, 109. [Google Scholar] [CrossRef]
- Zheng, Y.F.; Gu, X.N.; Witte, F. Biodegradable metals. Mater. Sci. Eng. R 2014, 77, 1–34. [Google Scholar] [CrossRef]
- Witte, F. The history of biodegradable magnesium implants: A review. Acta Biomater. 2010, 6, 1680–1692. [Google Scholar] [CrossRef] [PubMed]
- Heiden, M.; Walker, E.; Stanciu, L. Magnesium, Iron and Zinc Alloys, the Trifecta of Bioresorbable Orthopaedic and Vascular Implantation—A Review. J. Biotechnol. Biomater. 2015, 5, 178. [Google Scholar] [CrossRef]
- Li, H.; Zheng, Y.; Qin, L. Progress of biodegradable metals. Prog. Nat. Sci. Mater. Int. 2014, 24, 414–422. [Google Scholar] [CrossRef]
- Persaud-Sharma, D.; McGoron, A. Biodegradable Magnesium Alloys: A Review of Material Development and Applications. J. Biomim. Biomater Tissue Eng. 2012, 12, 25–39. [Google Scholar] [CrossRef]
- Agarwal, S.; Curtin, J.; Duffy, B.; Jaiswal, S. Biodegradable magnesium alloys for orthopaedic applications: A review on corrosion, biocompatibility and surface modifications. Mater. Sci. Eng. C 2016, 68, 948–963. [Google Scholar] [CrossRef]
- Kim, Y.K.; Lee, K.B.; Kim, S.Y.; Bode, K.; Jang, Y.S.; Kwon, T.Y.; Jeon, M.H.; Lee, M.H. Gas formation and biological effects of biodegradable magnesium in a preclinical and clinical observation. Sci. Technol. Adv. Mater. 2018, 19, 324–335. [Google Scholar] [CrossRef] [PubMed]
- Bowen, P.K.; Shearier, E.R.; Zhao, S.; Guillory, R.J.; Zhao, F.; Goldman, J.; Drelich, J.W. Biodegradable Metals for Cardiovascular Stents: From Clinical Concerns to Recent Zn-Alloys. Adv. Healthcare Mater. 2016, 5, 1121–1140. [Google Scholar] [CrossRef] [PubMed]
- Bowen, P.K.; Drelich, J.; Goldman, J. Zinc Exhibits Ideal Physiological Corrosion Behavior for Bioabsorbable Stents. Adv. Mater. 2013, 25, 2577–2582. [Google Scholar] [CrossRef]
- Moravej, M.; Mantovani, D. Biodegradable metals for cardiovascular stent application: Interests and new opportunities. Int. J. Mol. Sci. 2011, 12, 4250–4270. [Google Scholar] [CrossRef]
- Francis, A.; Yang, Y.; Virtanen, S.; Boccaccini, A.R. Iron and iron-based alloys for temporary cardiovascular applications. J. Mater. Sci.: Mater. Med. 2015, 26, 138–153. [Google Scholar] [CrossRef]
- He, J.; He, F.L.; Li, D.W.; Liu, Y.L.; Liu, Y.Y.; Ye, Y.J.; Yin, D.C. Advances in Fe-based biodegradable metallic materials. RSC Adv. 2016, 6, 112819–112838. [Google Scholar] [CrossRef]
- Hermawan, H.; Purnama, A.; Dube, D.; Couet, J.; Mantovani, D. Fe–Mn alloys for metallic biodegradable stents: Degradation and cell viability studies. Acta Biomater. 2010, 6, 1852–1860. [Google Scholar] [CrossRef] [PubMed]
- Peuster, M.; Wohlsein, P.; Brügmann, M.; Ehlerding, M.; Seidler, K.; Fink, C.; Brauer, H.; Fischer, A.; Hausdorf, G. A novel approach to temporary stenting: Degradable cardiovascular stents produced from corrodible metal: Results 6–18 months after implantation into New Zealand white rabbits. Heart 2001, 86, 563–569. [Google Scholar] [CrossRef]
- Hermawan, H. Updates on the research and development of absorbable metals for biomedical applications. Prog. Biomater. 2018, 7, 93–110. [Google Scholar] [CrossRef]
- Hermawan, H.; Dube, D.; Mantovani, D. Development of degradable Fe-35Mn alloy for biomedical application. Adv. Mater. Res. 2007, 15, 107–112. [Google Scholar] [CrossRef]
- Hermawan, H.; Dube, D.; Mantovani, D. Degradable metallic biomaterials: Design and development of Fe-Mn alloys for stents. J. Biomed. Mater. Res. A 2010, 93, 1–11. [Google Scholar] [CrossRef]
- Spandana, D.; Desai, H.; Chakravarty, D.; Vijay, R.; Hembram, K. Fabrication of a biodegradable Fe-Mn-Si alloy by field assisted sintering. Adv. Powder Technol. 2020, 31, 4577–4584. [Google Scholar] [CrossRef]
- Schinhammer, M.; Steiger, P.; Moszner, F.; Loffler, J.F.; Uggowitzer, P.J. Degradation performance of biodegradable Fe-Mn-C(-Pd) alloys. Mater. Sci. Eng. C 2013, 33, 1882–1893. [Google Scholar] [CrossRef]
- Gebert, A.; Kochta, F.; Voß, A.; Oswald, S.; Fernandez-Barcia, M.; Kühn, U.; Hufenbach, J. Corrosion studies on Fe-30Mn-1C alloy in chloride-containing solutions with view to biomedical application. Mater. Corros. 2018, 69, 167–177. [Google Scholar] [CrossRef]
- Harjanto, S.; Pratesa, Y.; Suharno, B.; Syarif, J. Corrosion Behavior of Fe-Mn-C Alloy as Degradable Materials Candidate Fabricated via Powder Metallurgy Process. Adv. Mater. Res. 2012, 576, 386–389. [Google Scholar] [CrossRef]
- Allenstein, U.; Ma, Y.; Arabi-Hashemi, A.; Zink, M.; Mayr, S.G. Fe-Pd based ferromagnetic shape memory actuators for medical applications: Biocompatibility, effect of surface roughness and protein coatings. Acta Biomater. 2013, 9, 5845–5853. [Google Scholar] [CrossRef]
- Feng, Y.P.; Blanquer, A.; Fornell, J.; Zhang, H.; Solsona, P.; Baró, M.D.; Suriñach, S.; Ibáñez, E.; García-Lecina, E.; Wei, X.; et al. Novel Fe–Mn–Si–Pd alloys: Insights into mechanical, magnetic, corrosion resistance and biocompatibility performances. J. Mater. Chem. B 2016, 4, 6402–6412. [Google Scholar] [CrossRef] [PubMed]
- Babacan, N.; Kochta, F.; Hoffmann, V.; Gemming, T.; Kühn, U.; Giebeler, L.; Gebert, A.; Hufenbach, J. Effect of silver additions on the microstructure, mechanical properties and corrosion behavior of biodegradable Fe-30Mn-6Si. Mater. Today Commun. 2021, 28, 102689. [Google Scholar] [CrossRef]
- Liu, R.Y.; He, R.G.; Xu, L.Q.; Guo, S.F. Design of Fe–Mn–Ag alloys as potential candidates for biodegradable metals. Acta Metall. Sin. (Engl. Lett.) 2018, 31, 584–590. [Google Scholar] [CrossRef]
- Wang, Y.; Venezuela, J.; Dargusch, M. Biodegradable shape memory alloys: Progress and prospects. Biomaterials 2021, 279, 121215. [Google Scholar] [CrossRef] [PubMed]
- Chilnicean, G.A.; Sprâncenatu, R.; Zhao, X.; Crăciunescu, C.M. Development of Ti-Nb-Zr shape memory alloys. In Proceedings of the AIP Conference Proceedings 2017, New York, NY, USA, 11 December 2017; AIP Publishing: Woodbury, NY, USA, 2017; Volume 1916, p. 1. [Google Scholar] [CrossRef]
- Song, C. History and current situation of shape memory alloys devices for minimally invasive surgery. Open Med. Dev. J. 2010, 2, 24–31. [Google Scholar] [CrossRef]
- Nedeff, V.; Bejenariu, C.; Lazar, G.; Agop, M. Generalized lift force for complex fluid. Powder Technol. 2013, 235, 685–695. [Google Scholar] [CrossRef]
- Maruyama, T.; Kubo, H. 12—Ferrous (Fe-Based) Shape Memory Alloys (SMAs): Properties, Processing and Applications, Shape Memory and Superelastic Alloys; Woodhead Publishing: Sawston, UK, 2011; pp. 141–159. [Google Scholar] [CrossRef]
- Liu, B.; Zheng, Y.F.; Ruan, L. In vitro investigation of Fe30Mn6Si shape memory alloy as potential biodegradable metallic material. Mater. Lett. 2011, 65, 540–543. [Google Scholar] [CrossRef]
- Drevet, R.; Zhukova, Y.; Malikova, P.; Dubinskiy, S.; Korotitskiy, A.; Pustov, Y.; Prokoshkin, S. Martensitic transformations and mechanical and corrosion properties of Fe-Mn-Si alloys for biodegradable medical implants. Metall. Mater. Trans. 2018, 49, 1006–1013. [Google Scholar] [CrossRef]
- Ibrahim, M.; Wang, F.; Lou, M.; Xie, G.; Li, B.; Bo, Z.; Zhang, G.; Liu, H.; Wareth, A. Copper as an antibacterial agent for human pathogenic multidrug resistant Burkholderia cepacia complex bacteria. J. Biosci. Bioeng. 2011, 112, 570–576. [Google Scholar] [CrossRef]
- Mandal, S.; Ummadi, R.; Bose, M.; Balla, V.K.; Roy, M. Fe–Mn–Cu alloy as biodegradable material with enhanced antimicrobial properties. Mater. Lett. 2019, 237, 323–327. [Google Scholar] [CrossRef]
- Ma, Z.; Gao, M.; Na, D.; Li, Y.; Tan, L.; Yang, K. Study on a biodegradable antibacterial Fe-Mn-C-Cu alloy as urinary implant material. Mater. Sci. Eng. C 2019, 103, 109718. [Google Scholar] [CrossRef]
- Wei, S.; Ma, Z.; Tan, L.; Junxiu Chen, J.; Misra, R.D.K.; Yang, K. Effect of copper content on the biodegradation behavior of Fe-Mn-C alloy system. Mater. Technol. 2022, 37, 1109–1119. [Google Scholar] [CrossRef]
- Goudarzi, P.; Moazami-Goudarzi, M.; Masoudi, A. Sintering, microstructure and properties of absorbable Fe–Mn-xCu alloys. Mater. Chem. Phys. 2022, 287, 126368. [Google Scholar] [CrossRef]
- Cheng, J.; Liu, B.; Wu, Y.H.; Zheng, Y.F. Comparative in vitro study on pure metals (Fe, Mn, Mg, Zn and W) as biodegradable metals. J. Mater. Sci. Technol. 2013, 29, 619–627. [Google Scholar] [CrossRef]
- Moravej, M.; Prima, F.; Fiset, M.; Mantovani, D. Electroformed iron as new biomaterial for degradable stents: Development process and structure–properties relationship. Acta Biomater. 2010, 6, 1726–1735. [Google Scholar] [CrossRef] [PubMed]
- Čapek, J.; Kubásek, J.; Vojtěch, D.; Jablonská, E.; Lipov, J.; Ruml, T. Microstructural, mechanical, corrosion and cytotoxicity characterization of the hot forged FeMn30 (wt.%) alloy. Mater. Sci. Eng. C 2016, 58, 900–908. [Google Scholar] [CrossRef] [PubMed]
- Dehestani, M.; Trumble, K.; Wang, H.; Wang, H.; Stanciu, L.A. Effects of microstructure and heat treatment on mechanical properties and corrosion behavior of powder metallurgy derived Fe–30Mn alloy. Mater. Sci. Eng. A 2017, 703, 214–226. [Google Scholar] [CrossRef]
- Čapek, J.; Msallamová, Š.; Jablonska, E.; Lipov, J.; Vojtěch, D. A novel high-strength and highly corrosive biodegradable Fe-Pd alloy: Structural, mechanical and in vitro corrosion and cytotoxicity study. Mater. Sci. Eng. C 2017, 79, 550–562. [Google Scholar] [CrossRef]
- Roman, A.M.; Geantă, V.; Cimpoeșu, R.; Munteanu, C.; Lohan, N.M.; Zegan, G.; Cernei, E.R.; Ioniță, I.; Cimpoeșu, N.; Ioanid, N. In-vitro analysis of FeMn-Si smart biodegradable alloy. Materials 2022, 15, 568. [Google Scholar] [CrossRef]
- Roman, A.M.; Cimpoeșu, R.; Pricop, B.; Lohan, N.M.; Cazacu, M.M.; Bujoreanu, L.G.; Panaghie, C.; Zegan, G.; Cimpoeșu, N.; Murariu, A.M. Influence of Dynamic Strain Sweep on the Degradation Behavior of FeMnSi–Ag Shape Memory Alloys. J. Funct. Biomater. 2023, 14, 377. [Google Scholar] [CrossRef]
- Istrate, B.; Munteanu, C.; Baltatu, M.S.; Cimpoesu, R.; Ioanid, N. Microstructural and Electrochemical Influence of Zn in MgCaZn Biodegradable Alloys. Materials 2023, 16, 2487. [Google Scholar] [CrossRef]
- Panaghie, C.; Zegan, G.; Sodor, A.; Cimpoeșu, N.; Lohan, N.M.; Istrate, B.; Roman, A.M.; Ioanid, N. Analysis of Degradation Products of Biodegradable ZnMgY Alloy. Materials 2023, 16, 3092. [Google Scholar] [CrossRef]
- Drevet, R.; Zhukova, Y.; Kadirov, P.; Dubinskiy, S.; Kazakbiev, A.; Pustov, Y.; Prokoshkin, S. Tunable corrosion behavior of calcium phosphate coated Fe-Mn-Si alloys for bone implant applications. Metall. Mater. Trans. A 2018, 49, 6553–6560. [Google Scholar] [CrossRef]
- Gavriljuk, V.G.; Bliznuk, V.V.; Shanina, B.D.; Kolesnik, S.P. Effect of silicon on atomic distribution and shape memory in Fe–Mn base alloys. Mater. Sci. Eng. A 2005, 406, 1–10. [Google Scholar] [CrossRef]
- Pricop, B.; Mihalache, E.; Lohan, M.N.; Istrate, B.; Mocanu, M.; Ozkal, B.; Bujoreanu, L.G. Powder metallurgy and mechanical alloying effects on the formation of thermally induced martensite in an FeMnSiCrNi SMA. In Proceedings of the Matec Web of Conferences 2015, Xiamen, China, 29–30 May 2015; EDP Sciences: Les Ulis, France, 2015; Volume 33, p. 04004. [Google Scholar] [CrossRef]
- Bujoreanu, L.G.; Stanciu, S.; Özkal, B.; Comăneci, R.I.; Meyer, M. Comparative study of the structures of Fe-Mn-Si-Cr-Ni shape memory alloys obtained by classical and by powder metallurgy, respectively. In European Symposium on Martensitic Transformations; EDP Sciences: Les Ulis, France, 2009; p. 05003. [Google Scholar] [CrossRef]
- Bulbuc, V.; Pricop, B.; Mihalache, E.; Özkal, B.; Bujoreanu, L.G. Thermomechanical processing effects on the structure and properties of Fe-based SMAs. I. Evolution of phase structure. In IOP Conference Series: Materials Science and Engineering 2019 Mar 1; IOP Publishing: Bristol, UK, 2019; Volume 485, p. 012004. [Google Scholar] [CrossRef]
- Bulbuc, V.; Pricop, B.; Maxim, F.; Popa, M.; Cimpoeșu, N.; Bujoreanu, L.G. Influence of Dynamic Three Point Bending on the Work Hardening Capacity of T105Mn120 Manganese Steel. J. Mater. Eng. Perform. 2018, 27, 6127–6134. [Google Scholar] [CrossRef]
- Pricop, B.; Soyler, A.U.; Ozkal, B.; Bujoreanu, L.G. Powder Metallurgy: An Alternative for FeMnSiCrNi Shape Memory Alloys Processing. Front. Mater. 2020, 7, 247. [Google Scholar] [CrossRef]
- Revie, W.R.; Uhlig, H.H. Corrosion and Corrosion Control. In An Introduction to Corrosion Science and Engineering, 4th ed.; John Wiley and Sons Inc.: Hoboken, NJ, USA, 2008; Available online: https://edisciplinas.usp.br/pluginfile.php/5955761/mod_resource/content/1/CORROSION_AND_CORROSION_CONTROL_An_Intro%20%20Revie%20and%20Uhlig.pdf (accessed on 15 October 2023).
- Quan, P.H.; Antoniac, I.; Miculescu, F.; Antoniac, A.; Robu, A.; Bița, A.I.; Miculescu, M.; Saceleanu, A.; Bodog, A.D.; Saceleanu, V. Fluoride Treatment and In Vitro Corrosion Behavior of Mg-Nd-Y-Zn-Zr Alloys Type. Materials 2022, 15, 566. [Google Scholar] [CrossRef] [PubMed]
- Maji, B.C.; Das, C.M.; Krishnan, M.; Ray, R.K. The corrosion behaviour of Fe–15Mn–7Si–9Cr–5Ni shape memory alloy. Corros. Sci. 2006, 48, 937–949. [Google Scholar] [CrossRef]
- Huth, F.; Govyadinov, A.; Amarie, S.; Nuansing, W.; Keilmann, F.; Hillenbrand, R. Nano-FTIR absorption spectroscopy of molecular fingerprints at 20 nm spatial resolution. Nano Lett. 2012, 12, 3973–3978. [Google Scholar] [CrossRef]
- Collazo, A.; Figueroa, R.; Mariño-Martínez, C.; Nóvoa, X.R.; Pérez, C. Electrochemical characterization of a Fe-based shape memory alloy in an alkaline medium and the behaviour in aggressive conditions. Electrochim. Acta 2023, 444, 142034. [Google Scholar] [CrossRef]
- Buzatu, M.; Geanta, V.; Stefanoiu, R.; Butu, M.; Petrescu, M.I.; Buzatu, M.; Ghica, V.G.; Niculescu, F.; Iacob, G. Influence of the Tungsten Content on the Elastic Modulus of New Ti-15Mo-W Alloys Intended for Medical Applications. JOM 2019, 71, 2272–2279. [Google Scholar] [CrossRef]
- Mocanu, M.; Mihalache, E.; Pricop, B.; Borza, F.; Grigoraș, M.; Comăneci, R.I.; Özkal, B.; Bujoreanu, L.G. The Influence of α′(bcc) Martensite on the Dynamic and Magnetic Response of Powder Metallurgy FeMnSiCrNi Shape Memory Alloys. In Proceedings of the International Conference on Martensitic Transformations: Chicago; Springer International Publishing: Berlin/Heidelberg, Germany, 2018; pp. 99–108. [Google Scholar] [CrossRef]
- Pricop, B.; Mihalache, E.; Stoian, G.; Borza, F.; Özkal, B.; Bujoreanu, L.G. Thermo-mechanical effects caused by martensite formation in powder metallurgy FeMnSiCrNi shape memory alloys. Powder Metall. 2018, 61, 348–356. [Google Scholar] [CrossRef]
- Cimpoeşu, N.; Stanciu, S.; Mayer, M.; Ionita, I.; Cimpoeşu, R.H. Effect of stress on damping capacity of a shape memory alloy CuZnAl. J. Optoelectron. Adv. 2010, 12, 386. Available online: http://www.616.pce-idei.sim.tuiasi.ro/2CIMPOESU.pdf (accessed on 23 November 2023).
- Saliba, L.; Sammut, K.; Tonna, C.; Pavli, F.; Valdramidis, V.; Gatt, R.; Giordmaina, R.; Camilleri, L.; Atanasio, W.; Buhagiar, J. FeMn and FeMnAg biodegradable alloys: An in vitro and in vivo investigation. Heliyon 2023, 9, e15671. [Google Scholar] [CrossRef] [PubMed]
- Pretsch, E.; Buhlmann, P.; Badertscher, M. Structure Determination of Organic Compounds. In Tables of Spectral Data, 4th ed.; Revised and Enlarged Edition; Springer: Berlin/Heidelberg, Germany, 2009; ISBN 978-3-540-93810-1. [Google Scholar] [CrossRef]
- Elango, M.; Deepa, M.; Subramanian, R.; Mohamed Musthafa, A. Synthesis, characterization, and antibacterial activity of polyindole/Ag–Cuo nanocomposites by reflux condensation method. Polym. Plast. Technol. Eng. 2018, 57, 1440–1451. [Google Scholar] [CrossRef]
- Veneranda, M.; Aramendia, J.; Bellot-Gurlet, L.; Colomban, P.; Castro, K.; Madariaga, J.M. FTIR spectroscopic semi-quantification of iron phases: A new method to evaluate the protection ability index (PAI) of archaeological artefacts corrosion systems. Corros. Sci. 2018, 133, 68–77. [Google Scholar] [CrossRef]
- Su, J.F.; Huang, Z.; Yuan, X.Y.; Wang, X.Y.; Li, M. Structure and properties of carboxymethyl cellulose/soy protein isolate blend edible films crosslinked by Maillard reactions. Carbohydr. Polym. 2010, 79, 145–153. [Google Scholar] [CrossRef]
- Knoll, B.; Keilmann, F. Near-Field Probing of Vibrational Absorption for Chemical Microscopy. Nature 1999, 399, 134–137. [Google Scholar] [CrossRef]
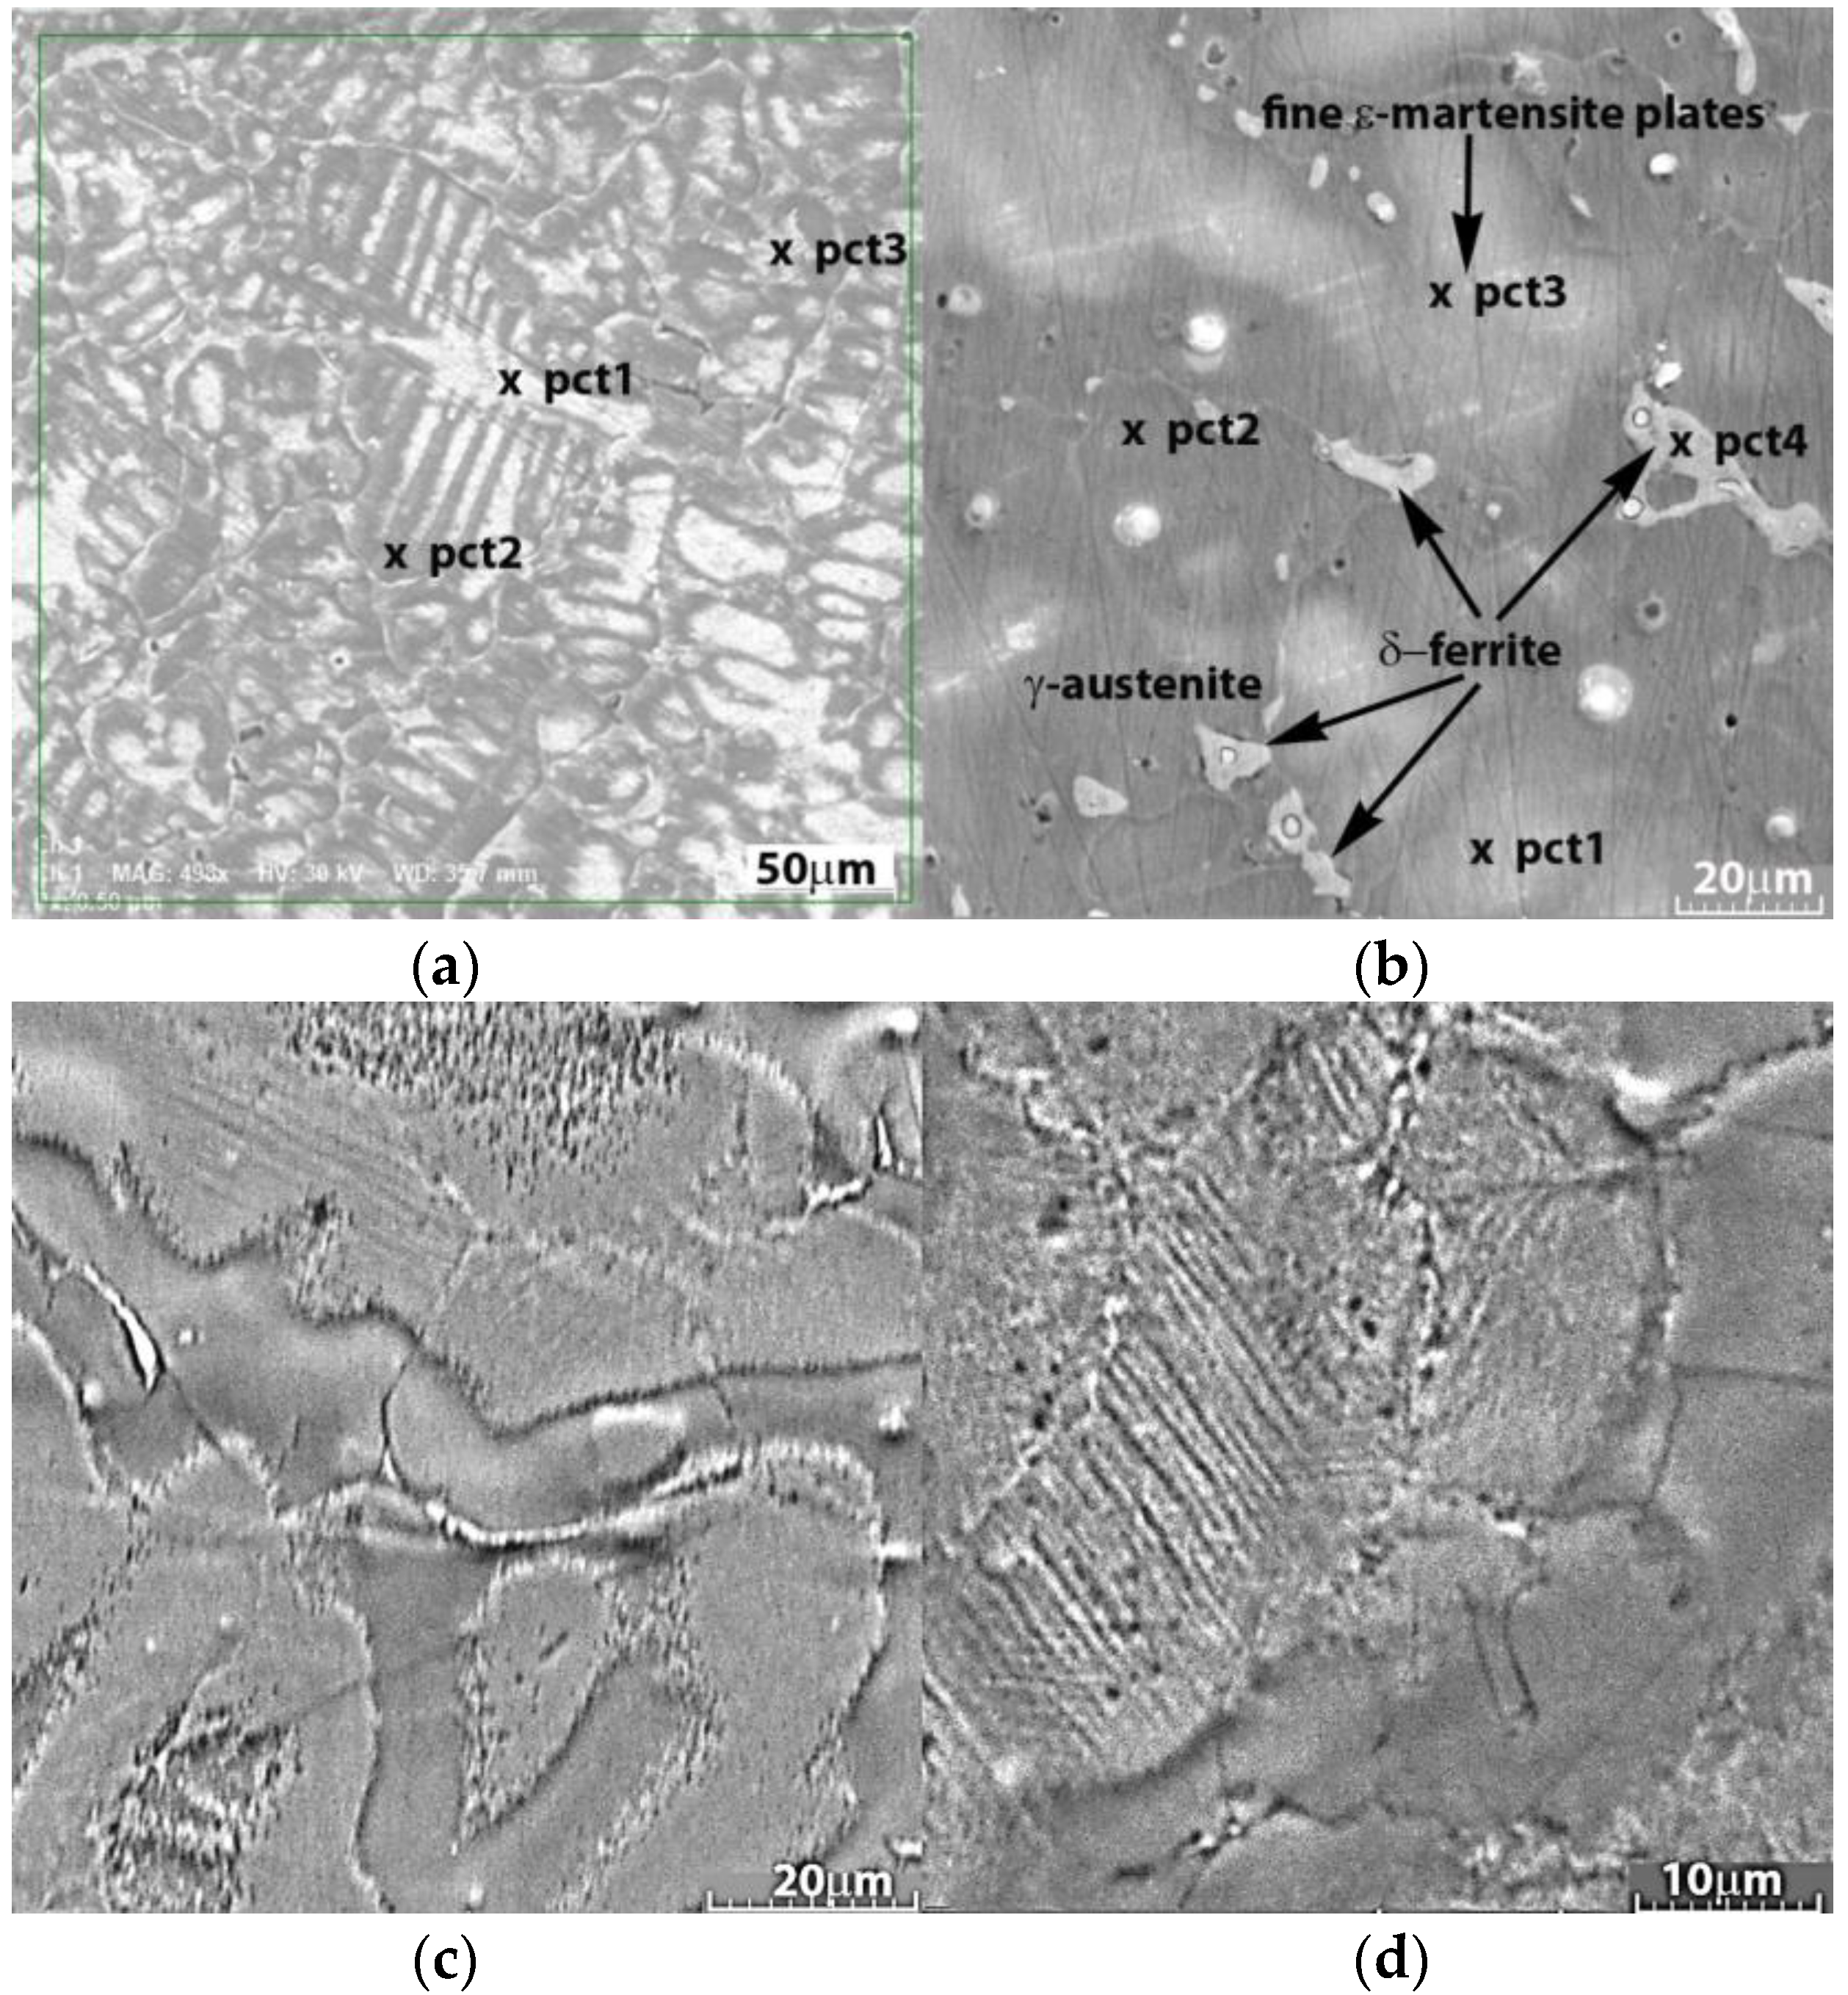


| (a) FeMnSi-1.5Cu | Fe (wt%) | Mn (wt%) | Si (wt%) | Cu (wt%) |
| Point 1 | 56.15 | 34.03 | 5.89 | 1.92 |
| Point 2 | 65.49 | 29.46 | 3.94 | 1.11 |
| Point 3 | 55.87 | 34.04 | 5.69 | 1.73 |
| Average | 59.17 | 32.51 | 5.17 | 1.59 |
| (b) FeMnSi-2Cu | Fe (wt%) | Mn (wt%) | Si (wt%) | Cu (wt%) |
| Point 1 | 55.22 | 35.91 | 5.95 | 2.92 |
| Point 2 | 60.73 | 32.08 | 4.98 | 2.22 |
| Point 3 | 66.40 | 28.41 | 3.81 | 1.38 |
| Point 4 | 41.85 | 42.54 | 7.01 | 8.58 |
| Average | 60.78 | 32.13 | 4.91 | 2.17 |
| Sample | Dimension | Average—Before DMA (nm) | St. Dev. ± | Average—After DMA (nm) | St. Dev. ± |
|---|---|---|---|---|---|
| FeMnSi-1.5Cu (1 Hz) | w | 368 | 24.6 | 92 | 3.8 |
| h | 234 | 12.6 | 46 | 3.1 | |
| FeMnSi-2Cu (1 Hz) | w | 200 | 18.6 | 163 | 13.3 |
| h | 116 | 6.5 | 71 | 11.5 |
| D I + U | Alloys/wt% | Fe | Mn | Si | Cu | O | C | Cl | Ca | P | |
|---|---|---|---|---|---|---|---|---|---|---|---|
| 1 | FeMnSi-1.5Cu | C | 70.7 | 2.36 | 4.99 | 1.53 | 9.66 | 10.2 | - | - | 0.38 |
| HR | 49.8 | 25.1 | 4.32 | 1.52 | 11.8 | 5.9 | - | 0.29 | 1.27 | ||
| FeMnSi-2Cu | C | 62.2 | 15.8 | 4.11 | 1.13 | 10.4 | 5.23 | - | - | 0.99 | |
| HR | 52.9 | 24.6 | 3.73 | 1.66 | 9.75 | 6.44 | 0.1 | - | 0.72 | ||
| 7 | FeMnSi-1.5Cu | C | 31.4 | 7.8 | 2.06 | 2.18 | 37.5 | 9.95 | 0.63 | 1.64 | 6.84 |
| HR | 32.1 | 8.65 | 0.72 | 0.49 | 36.5 | 8.77 | 3.48 | 2.09 | 7.21 | ||
| FeMnSi-2Cu | C | 34.3 | 4.18 | 1.41 | 0.13 | 37.6 | 11.8 | 0.8 | 1.44 | 8.34 | |
| HR | 28.9 | 7.73 | 0.41 | 0.25 | 40.9 | 7.93 | 1.81 | 2.5 | 9.54 | ||
| 14 | FeMnSi-1.5Cu | C | 29.6 | 13.6 | 6.03 | 5.79 | 34.6 | 9.44 | 0.38 | - | - |
| HR | 29.1 | 14.2 | 3.74 | 5.74 | 37.1 | 9.73 | 0.21 | - | - | ||
| FeMnSi-2Cu | C | 25.6 | 11.8 | 3.9 | 8.8 | 37.6 | 10.9 | 0.46 | 0.6 | ||
| HR | 30.9 | 14.7 | 3.5 | 8.59 | 31.7 | 9.59 | 0.87 | - | - | ||
| EDS detector error % | 0.38 | 0.18 | 0.07 | 0.07 | 2.14 | 0.77 | 0.05 | 0.05 | 0.19 | ||
| (a) FeMnSi-1.5Cu | 1 day | 7 days | 14 days | |||
| C | HR | C | HR | C | HR | |
| Initial mass (mg) | 6007.4 | 698.2 | 3192.4 | 851 | 3471.6 | 794 |
| Mass after immersion (mg) | 6010.2 (+2.8) | 697.4 (−0.8) | 3153.8 (−38.6) | 858.6 (+7.6) | 3436.8 (−34.8) | 767.6 (−26.4) |
| Mass after ultrasound (mg) | 6005.9 (−1.5) | 697.3 (−0.9) | 3147.2 (−45.2) | 844.8 (−6.2) | 3434.4 (−37.2) | 766.9 (−27.1) |
| DR (μm/year) | 108 | 184 | 536 | 145 | 200 | 327 |
| (b) FeMnSi-2Cu | 1 day | 7 days | 14 days | |||
| C | HR | C | HR | C | HR | |
| Initial mass (mg) | 5628.8 | 716.8 | 4886.4 | 977.1 | 6122.4 | 1100.5 |
| Mass after immersion (mg) | 5629.9 (+1.1) | 716.4 (−0.4) | 4855.8 (−30.6) | 970.3 (−6.8) | 6063.8 (−58.6) | 1102.7 (+2.2) |
| Mass after ultrasound (mg) | 5628.6 (−0.2) | 716.2 (−0.6) | 4850 (−36.4) | 966.6 (−10.5) | 6058 (−64.4) | 1087 (−13.5) |
| DR (μm/year) | 16 | 134 | 418 | 204 | 369 | 115 |
| Sample | E0 mV | ba mV | bc mV | Rp ohm·cm2 | Jcorr mA/cm2 | Vcorr μm/Year |
|---|---|---|---|---|---|---|
| FeMnSi-1.5Cu | −786 | 92 | −85 | 638 | 32.1 | 374 |
| FeMnSi-2Cu | −232 | 68 | −124 | 847 | 17.37 | 203 |
| R(QR) | 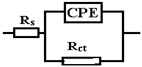 | |
|---|---|---|
| Sample | FeMnSi-1.5Cu | FeMnSi-2Cu |
| Rs (ohm·cm2) | 113 | 17 |
| 103·Q (S·sn/cm2) | 0.051 | 0.58 |
| n | 0.77 | 0.8 |
| Rct (ohm·cm2) | 4013 | 138 |
Disclaimer/Publisher’s Note: The statements, opinions and data contained in all publications are solely those of the individual author(s) and contributor(s) and not of MDPI and/or the editor(s). MDPI and/or the editor(s) disclaim responsibility for any injury to people or property resulting from any ideas, methods, instructions or products referred to in the content. |
© 2024 by the authors. Licensee MDPI, Basel, Switzerland. This article is an open access article distributed under the terms and conditions of the Creative Commons Attribution (CC BY) license (https://creativecommons.org/licenses/by/4.0/).
Share and Cite
Roman, A.-M.; Cimpoeșu, R.; Pricop, B.; Cazacu, M.M.; Zegan, G.; Istrate, B.; Cocean, A.; Chelariu, R.; Moscu, M.; Bădărău, G.; et al. Investigations on the Degradation Behavior of Processed FeMnSi-xCu Shape Memory Alloys. Nanomaterials 2024, 14, 330. https://doi.org/10.3390/nano14040330
Roman A-M, Cimpoeșu R, Pricop B, Cazacu MM, Zegan G, Istrate B, Cocean A, Chelariu R, Moscu M, Bădărău G, et al. Investigations on the Degradation Behavior of Processed FeMnSi-xCu Shape Memory Alloys. Nanomaterials. 2024; 14(4):330. https://doi.org/10.3390/nano14040330
Chicago/Turabian StyleRoman, Ana-Maria, Ramona Cimpoeșu, Bogdan Pricop, Marius Mihai Cazacu, Georgeta Zegan, Bogdan Istrate, Alexandru Cocean, Romeu Chelariu, Mihaela Moscu, Gheorghe Bădărău, and et al. 2024. "Investigations on the Degradation Behavior of Processed FeMnSi-xCu Shape Memory Alloys" Nanomaterials 14, no. 4: 330. https://doi.org/10.3390/nano14040330