
Full-Color Imaging System Based on the Joint Integration of a Metalens and Neural Network

1
School of Instrumentation and Optoelectronics Engineering, Beihang University, Beijing 100191, China
2
Institute of Microelectronics of the Chinese Academy of Sciences, Beijing 100029, China
3
Photonic Institute of Microelectronics, Wenzhou 396 Xingping Road, Longwan District, Wenzhou 100029, China
*
Authors to whom correspondence should be addressed.
Nanomaterials 2024, 14(8), 715; https://doi.org/10.3390/nano14080715
Submission received: 12 March 2024
/
Revised: 9 April 2024
/
Accepted: 14 April 2024
/
Published: 19 April 2024
(This article belongs to the Special Issue Advances in Nanomaterials for Optoelectronics: Second Edition)
Abstract
:Lenses have been a cornerstone of optical systems for centuries; however, they are inherently limited by the laws of physics, particularly in terms of size and weight. Because of their characteristic light weight, small size, and subwavelength modulation, metalenses have the potential to miniaturize and integrate imaging systems. However, metalenses still face the problem that chromatic aberration affects the clarity and accuracy of images. A high-quality image system based on the end-to-end joint optimization of a neural network and an achromatic metalens is demonstrated in this paper. In the multi-scale encoder–decoder network, both the phase characteristics of the metalens and the hyperparameters of the neural network are optimized to obtain high-resolution images. The average peak-signal-to-noise ratio (PSNR) and average structure similarity (SSIM) of the recovered images reach 28.53 and 0.83. This method enables full-color and high-performance imaging in the visible band. Our approach holds promise for a wide range of applications, including medical imaging, remote sensing, and consumer electronics.
1. Introduction
Today, imaging systems are widely used in medical instruments, wearable devices, smartphones, and so on. However, modern imaging systems usually consist of multiple optical elements to overcome geometric aberrations. The introduction of additional components, such as lenses, mirrors, or prisms, increases the overall weight and volume of the system, which may limit the application of imaging systems [1,2]. How to build a miniaturized imaging system and maintain high performance has become a hot topic in the industry and academia.
Nowadays, by manipulating the geometrical parameters of the subwavelength elements, such as the size, shape, and orientation, metasurfaces can modulate the polarization [3], amplitude [4,5], and phase [6] of incident light to achieve the desired functionality. As one planar optical device derived from metasurfaces, metalenses hold tremendous potential in the field of optical imaging. Different from traditional lenses [7], metalenses do not rely on changes in the thickness of the constituent structures to accumulate phase, but directly modulate the phase of the incident light. The emergence of metalenses addresses the issue of bulky volume associated with conventional optical lenses, aligning with the trends in integration and miniaturization [8,9,10] and offering various functionalities. However, the phase discontinuity of metalens can also lead to image distortion and blur. The design of achromatic metalens is still limited by large aperture and low Fnumber [11,12].
In recent years, various inverse designs have been proposed for nanomaterials and metelenses [13,14,15]. Sensong An [16] established a forward spectral prediction tensor neural network to predict the transmission spectra of meta-atoms with different structures. Zhaocheng Liu [17] demonstrated the feasibility of using an unsupervised learning system [18] to reverse-design nanophotonics. But these methods belong to the forward design metalens element structure. Meanwhile, existing end-to-end optimization frameworks in meta-optics [19,20,21] cannot optimize the final full-color image quality. They typically rely on intermediate metrics such as spot intensity.
Computational imaging opens up new directions for improving imaging quality [22,23,24,25,26,27,28]. The integration of metasurface optics and deep learning methods has significantly advanced high-quality images [29,30,31,32,33,34]. In 2019, Vincent Sitzmann et al. [23] designed an end-to-end optimization system for dispersion-compensated wide field depth and super-resolution imaging, integrating optical and image processing components. The system is a fully differentiable model that jointly optimizes the effective refractive index of diffractive optical elements (DOEs) and image processing parameters, but the modulation of DOEs is limited by phase. In 2022, Zeqing Yu et al. [35] utilized a U-Net pre-processing model and incorporated both metalens and computationally generated holography into one imaging system. In 2022, Qiangbo Zhang et al. [36] proposed a snapshot hyperspectral imaging system based on metalens, achieving joint optimization of the metalens and image processing. However, both methods are designed for polarization-sensitive metalenses.
In this paper, a high-quality imaging system is proposed by jointly optimizing a neural network and a polarization-insensitive achromatic metalens. The imaging system, outlined in Figure 1, employs both forward and backward propagation networks for image reconstruction. During forward propagation, the ground truth is convolved with the point spread function (PSF) of the metalens, and noises are added to generate the sensor image. Subsequently, the neural network reconstructs the sensor image. The loss function is computed by comparing the reconstructed images with the ground truth. In the process of backward propagation, the neural network and metalens parameters are optimized to minimize the loss function. Our method provides a new method for full-color imaging using a polarization-insensitive metalens. The polynomial phase factor makes the design more flexible to help achieve an achromatic metalens, and the multi-scale neural network makes the image feature extraction more comprehensive and conducive to image reconstruction. This approach enhances high-quality image recovery by co-optimizing the front-end optics and back-end recovery network.
2. Theoretical Analyses
The optimization process is mainly divided into the following steps. First, the metalens is constructed by selecting nanopillars according to the phase profile. The corresponding phases of nanopillars with different diameters are obtained by the finite difference time domain method. The phase profile of the metalens consists of hyperbolic and polynomial phases. Polynomial factors are optimized to design the achromatic metalens. Second, the PSF of the metalens is calculated, the ground truth is convolved with the PSF, and noises are added to create the sensor image. Third, the neural network is built and the phase factor of the metalens is optimized along with the network hyperparameters. Fourth, the loss function is minimized by comparing the loss between the reconstructed image and the ground truth.
2.1. Metalens Design
The phase control of a metalens can be divided into the geometric phase and propagation phase. However, since the geometric phase is sensitive to polarization, this paper focuses on the polarization-insensitive propagation phase. The propagation phase method provides phase discontinuities by altering size such as the height and diameters of symmetric unit cells. A nanopillar has structural symmetry and can be modulated by changing the duty cycle [37,38]. Silicon nitride is easy to integrate and has high transmittance in the visible spectrum. Therefore, a silicon nitride nanopillar with the propagation phase is discussed here.
An important aspect of designing a metalens is optimizing the geometric parameters of its unit structures, which include the period, diameter, and height, to achieve phase coverage from −π to π. According to the Nyquist sampling theorem, the period P of the unit structure should satisfy P < λ/2NA [39], where NA is the numerical aperture of the metalens. To suppress higher-order diffraction, the period of the unit structure should be smaller than the wavelength of the incident wave [40,41]. However, for achromatic metalenses operating within a certain wavelength range, the period of the unit structure should be larger than the wavelength of the incident light to excite resonance of different dispersive modes [40,41]. As the height of the unit structure increases, the achievable range of phase modulation also increases. However, a higher aspect ratio of the unit structure makes fabrication more challenging. Figure 2a shows the design of the unit cell. The selected nanopillar period is 350 nm, and the height is 0.8 μm.
In this paper, the finite difference time domain method is used for simulation. The diameter was swept from 50 to 350 nm. Figure 2c,d show the phase and transmittance of three wavelengths, respectively. Multiple −π to π periods are achieved by changing the diameter of unit cells, which means that more than one nanopillar can be selected at a certain location for the target phase. A phase library corresponding to the diameters of the nanopillars was constructed. As shown in Figure 2c,d, the transmittance remains at a high level except for the falling peaks.
The metalens phase profile in this paper is designed in the form of
where the first term in the formula is the hyperbolic phase and the second term is the polynomial phase. (x, y) is the position from the center of the metalens, f is the focal length, λ is the target wavelength, and ai is the polynomial phase factor as the optimizable parameter. According to Equation (1), the phase of the metalens at each position is obtained, and the corresponding nanopillar is selected from the phase library. Traditional metalenses use the hyperboloidal phase to generate a perfect spherical wavefront [37], but its coefficients are fixed and cannot be optimized. Here, three wavelengths of 462 nm, 511 nm, and 606 nm were selected for the achromatic metalens design in the visible band. The phase factors of the three wavelengths were optimized and initialized by the particle swarm optimization (PSO) algorithm [42]. Then, the phase factors were fine-tuned by using end-to-end network imaging.
2.2. PSF Calculation
The imaging system is modeled as a convolution of the ground truth with the PSF. The PSF is a function used to describe the imaging performance of an optical system for a point source of light. When a point source of light is imaged through an optical system, the PSF characterizes how the light is spread out on the imaging plane because of the limitations and characteristics of the optical system.
Scalar diffraction theory is used for imaging analysis of nano-optical elements. The metalens diffraction imaging schematic is demonstrated in Figure 3. Assuming that the amplitude of the incident light is A and the phase is φd, when the light passes through the metalens surface, the complex amplitude after metalens modulation is written as [43]
The light intensity received on the sensor is
The PSF is the intensity distribution of the point light source in the image plane after passing through the optical system. To obtain the PSF of the metalens, we assume that the incident light is a plane wave, and its complex amplitude is unit, then
Only single-wavelength point source imaging is considered above, but the model can be extended to color imaging. The image formed on the sensor is a displacement invariant convolution of the ground truth and the PSF,
where Isensor is the sensor image, Iλ is the ground truth, Pλ is the PSF at a certain wavelength, np is Poisson noise, and ng is Gaussian noise.
2.3. Network Architecture
In this section, a multi-scale encoder–decoder [44] based on a convolutional neural network is proposed, as illustrated in Figure 4. Here, both the multi-scale feature extraction encoder and the multi-scale decoder are fully convolutional networks.
In the encoder, a series of convolutional neural networks are employed to transform the three-channel RGB image into feature tensors. The input layer achieves resolution reduction through convolution to capture the rich feature information from the ground truth. Three different convolution kernels are 1 × 1, 3 × 3, and 5 × 5, with 15, 30, and 60 channels and correspondence to the original resolution [29], 2× downsampled resolution, and 4× downsampled resolution. At different resolutions, feature extraction is performed using residual blocks and full convolutions. The low-resolution feature maps are concatenated with the up-scale features by up-sampling. Performing feature extraction at lower resolutions may allow the network to show features at a global level, while the images extracted at the original resolution focus more on local details. Residual structures and concatenation layers are utilized to fuse different resolution features to obtain comprehensive image information.
To deal with different image resolutions, we preprocess the PSF by resizing it to 1×, 2×, and 4× downsampled resolutions. After the encoder, the image tensors are then fed into the multi-feature decoder. In the decoder, we first extract features from the original resolution using residual blocks. These features are then concatenated with the 2× downsampled resolution features. Similarly, the 2× downsampled resolution feature maps are concatenated with the 4× downsampled feature maps. After residual blocks, the 4× downsampled features are concatenated with upper-scale features using transpose convolution until the feature map returns to the original resolution. Eventually, all the feature tensors are generated a single three-channel RGB output image. This process helps the image model learn more realistic features and reconstruct high-resolution images.
2.4. Loss Definition
The loss function is defined as the combination of mean squared loss and perceptual losses to evaluate the deviation of the recovered image and the ground truth
where the weight coefficients of λ1 and λperc are set as 0.01 here. L1 represents the mean square error loss function. Lperc is a VGG-based perceptual loss function [45].
Although the traditional mean square error loss function can obtain a high peak signal-to-noise ratio, the reconstructed image edge is too smooth. Perceptual loss learns the original graphic structure and background information by observing the combination of high and low level features extracted. Therefore, both the mean square error function and the perceived loss function are added in this paper. The perceptual loss function extracts and compares features from the output RGB image Iout and the real RGB image Igt using the pre-trained VGG-19 network [45]:
where φb,2 is the feature map extracted by the VGG-19 network at the blockb_conv2 layer, Igt is the ground truth, and Iout is the output image.
To obtain high quality iterative images, in each iteration, the metalens phase factor and neural network system parameters should be continuously optimized to minimize the loss. Then the expression can be written as
where N is the number of training samples, Mlens is the metalens parameter, MCNN is the network parameter, Igt is the ground truth, and Iout is the reconstructed output image. After completing the training, Mlens is used to design our metalens.
3. Results and Discussion
3.1. Experimental Details
For the metalens design, the focal length was set to 15 mm and the diameter was 1 mm. The distance between the metalens and sensor was set to the focal length. A deep learning platform based on TensorFlow 2.1.6 was used, and the GPU was NVIDIA P100 (Santa Clara, CA, USA) with 16 GB memory in the training and testing experiment.
The DIV2K dataset [46] was used as the training set. The DIV2K dataset consists of over 800 high-resolution images. These images are sourced from various origins and cover diverse scenes and subjects. The dataset encompasses a variety of image types, including natural landscapes, portraits, architecture, etc., to ensure robust performance evaluation of algorithms across different scenarios. Typically, the DIV2K dataset is divided into training and testing sets. The training set is utilized for model training, while the testing set is used to evaluate model performance. The DIV2K dataset is widely used to evaluate the performance of image super-resolution algorithms, both qualitatively and quantitatively. It serves as a benchmark for training and testing various super-resolution models, including deep learning-based approaches. The dataset is enhanced by flipping the training image horizontally, vertically, and both horizontally and vertically triple the number of images. The image is cut to 720 × 720 size.
The parameter optimization algorithm uses Adam optimizers (β1 = β2 = 0.9). In each optimization process, the method of alternating optimization is used to optimize the phase factor and network parameters, respectively. In each iteration, the phase is optimized 5 times with a learning rate of 0.004, and the convolutional neural network parameters are optimized 10 times with a learning rate of 0.00095. The batch size is set as two. The training was conducted for 3000 iterations, which took 9 h. Our sensor camera is the Prosilica GT2000 (Burnaby, BC, Canada) with 5.5 μm pixels and the reconstructed image resolution is 720 px × 720 px, which matches the training image size. The sensor is modeled as Gaussian noise and Poisson noise, where ηg(x, σg)~N(x, σg2) is the Gaussian noise component and ηp(x, ap)~P(x/ap) is the Poisson noise component. Where σg = 1 × 10⁻⁵, ap = 4 × 10⁻⁵.
3.2. Results
The normalized simulated PSF is shown in Figure 5. It can be seen that the focusing effect is good at the three wavelengths of 462 nm, 511 nm, and 606 nm, and the defocusing will reduce the image quality. With the help of neural networks, the defocusing effect can be partially offset.
The image quality is quantitatively analyzed by using the peak-signal-to-noise ratio (PSNR) and structure similarity (SSIM). The PSNR and SSIM kept increasing and tended to stabilize after a certain number of iterations. The algorithm model in this section achieved good results in convergence, as shown in Figure 6. PSNR training improves after starting training. Between 0 and 500 iterations, the PSNR of the model fluctuatez greatly. On the whole, the PSNR kept rising and remained stable after 500 iterations, indicating that rapid convergence can gradually decrease.
At the same time, we also compared the metalens based on the cubic phase and hyperboloid phase. The cubic phase formulation can be written as
where (x, y) is the position of the metalens, f is the focal length, λ is the wavelength, and R is the metalens radius. A is the design parameter of the cubic term and is set to 86π.
The hyperboloid phase formulation can be written as
where λ0 = 462 nm is the nominal wavelength and f0 = 15 mm is the nominal focal length. We set f = f0·λ/λ0.
Table 1 shows the PSNR and SSIM of images recovered by three methods [6,21]. The recovery data of our model is better than the other two methods. Our method achieves an average PSNR of 28.53, which is about 6 dB better than the cubic phase method and about 11 dB better than the hyperboloid phase method. The average SSIM of the output image reaches 0.83, which is about 0.2 higher than the cubic phase method and about 0.3 higher than the hyperboloid method.
The final output image results are shown in Figure 7. The first column is the ground truth. The second column is the output image reconstructed in this paper. In contrast, the third and fourth columns are the reconstructed images based on the cubic and polynomial phases, respectively. It can be seen that the quality of the second line of restored images is significantly better than that of the second and third lines, both in terms of color and detail. The artifacts, blur, and noise at the edge of the images have been effectively restored and eliminated. Although it cannot be restored to the ground truth, it still demonstrates the good recovery capability of our imaging system.
3.3. Discussion
Our method combines the optimization of metalens phase parameters and neural network hyperparameters through an end-to-end network to generate high-quality reconstructed images. Compared with the hyperbolic phase method and cubic phase method, our method adds a polynomial phase factor to make metalens regulation more flexible. The multi-scale encoder–decoder network helps to learn image features and reconstruct high-quality images.
Our work provides a solid foundation for state-of-the-art imaging systems. It can solve the problem that the imaging system is large and not easy to carry, and it is conducive to the miniaturization and integration of the imaging system. This work can be used in many fields such as smartphones, VR/AR glasses, and surgery. However, this paper still has some limitations. There is a deviation between simulation and actual manufacture, and the phase of the metalens obtained by simulation is different from that obtained by actual manufacture. Phase error and psf error should be considered in future research work. At the same time, the effect of the incident angle of the light on the image of the metalens is not considered in this paper. In the future, we will study the phase of the metalens in the case of oblique incidence and how to build a high-quality imaging system.
4. Conclusions
In this study, a high-quality imaging system that jointly optimizes hardware and recovery algorithms based on metalens phase factors and network parameters is proposed. Our approach incorporates hyperbolic and polynomial phases within the metalens phase profile, introducing optimization coefficients to enhance metalens performance. Furthermore, we employed an end-to-end neural network to jointly optimize the polynomial factors of the metalens phase and the network parameters, achieving effective chromatic aberration and high-resolution image reconstruction. Compared with the hyperbolic phase and cubic phase methods separately, the method used in this paper yields superior image quality, with the average PSNR reaching 28.53 and the average SSIM reaching 0.83. These results underscore the effectiveness of our integrated hardware and algorithmic optimization strategy. The simulation results demonstrate the exceptional imaging performance of our system, underscoring its potential to advance the miniaturization and integration of imaging systems. In the future, we will study both full-color and varifocal imaging systems. Our approach holds promise for a wide range of applications, including medical imaging, remote sensing, and consumer electronics.
Author Contributions
Conceptualization, S.H.; methodology, R.S. and S.H.; software, R.S. and P.Z.; validation, R.S. and B.Q.; writing—original draft preparation, R.S.; writing—review and editing, S.H. and B.W.; visualization, R.S.; supervision, S.H. and Y.W. All authors have read and agreed to the published version of the manuscript.
Funding
This research received no external funding.
Data Availability Statement
The data that support the plots within this paper and the other findings of this study are available from the corresponding authors upon reasonable request.
Conflicts of Interest
The authors declare no conflicts of interest.
References
- Li, L.; Wang, Q.H. Zoom lens design using liquid lenses for achromatic and spherical aberration corrected target. Opt. Eng. 2012, 51, 043001. [Google Scholar] [CrossRef]
- Feng, B.; Shi, Z.L.; Zhao, Y.H.; Liu, H.Z.; Liu, L. A wide-FoV athermalized infrared imaging system with a two-element lens. Infrared Phys. Technol. 2017, 87, 11–21. [Google Scholar] [CrossRef]
- Arbabi, A.; Horie, Y.; Bagheri, M.; Faraon, A. Dielectric metasurfaces for complete control of phase and polarization with subwavelength spatial resolution and high transmission. Nat. Nanotechnol. 2015, 10, 937–943. [Google Scholar] [CrossRef] [PubMed]
- Cencillo-Abad, P.; Ou, J.Y.; Plum, E.; Zheludev, N.I. Electro-mechanical light modulator based on controlling the interaction of light with a metasurface. Sci. Rep. 2017, 7, 5405. [Google Scholar] [CrossRef] [PubMed]
- Overvig, A.C.; Shrestha, S.; Malek, S.C.; Lu, M.; Stein, A.; Zheng, C.X.; Yu, N.F. Dielectric metasurfaces for complete and independent control of the optical amplitude and phase. Light Sci. Appl. 2019, 8, 92. [Google Scholar] [CrossRef] [PubMed]
- Chen, K.; Feng, Y.J.; Monticone, F.; Zhao, J.M.; Zhu, B.; Jiang, T.; Zhang, L.; Kim, Y.; Ding, X.M.; Zhang, S.; et al. A reconfigurable active huygens’ metalens. Adv. Mater. 2017, 29, 1606422. [Google Scholar] [CrossRef] [PubMed]
- Yoshikawa, H. Computer-generated holograms for 3D displays. In Proceedings of the 1st International Conference on Photonics Solutions (ICPS), Pattaya, Thailand, 26–28 May 2013. [Google Scholar]
- Khorasaninejad, M.; Aieta, F.; Kanhaiya, P.; Kats, M.A.; Genevet, P.; Rousso, D.; Capasso, F. Achromatic Metasurface Lens at Telecommunication Wavelengths. Nano Lett. 2015, 15, 5358–5362. [Google Scholar] [CrossRef] [PubMed]
- Avayu, O.; Almeida, E.; Prior, Y.; Ellenbogen, T. Composite functional metasurfaces for multispectral achromatic optics. Nat. Commun. 2017, 8, 14992. [Google Scholar] [CrossRef] [PubMed]
- Arbabi, E.; Arbabi, A.; Kamali, S.M.; Horie, Y.; Faraon, A. Multiwavelength metasurfaces through spatial multiplexing. Sci. Rep. 2016, 6, 32803. [Google Scholar] [CrossRef] [PubMed]
- Shrestha, S.; Overvig, A.C.; Lu, M.; Stein, A.; Yu, N.F. Broadband achromatic dielectric metalenses. Light Sci. Appl. 2018, 7, 85. [Google Scholar] [CrossRef] [PubMed]
- Fan, Z.B.; Qiu, H.Y.; Zhang, H.L.; Pang, X.N.; Zhou, L.D.; Liu, L.; Ren, H.; Wang, Q.H.; Dong, J.W. A broadband achromatic metalens array for integral imaging in the visible. Light Sci. Appl. 2019, 8, 67. [Google Scholar] [CrossRef] [PubMed]
- Jaffari, Z.H.; Abbas, A.; Kim, C.M.; Shin, J.; Kwak, J.; Son, C.; Lee, Y.G.; Kim, S.; Chon, K.; Cho, K.H. Transformer-based deep learning models for adsorption capacity prediction of heavy metal ions toward biochar-based adsorbents. J. Hazard. Mater. 2024, 462, 132773. [Google Scholar] [CrossRef] [PubMed]
- Jaffari, Z.H.; Abbas, A.; Umer, M.; Kim, E.-S.; Cho, K.H. Crystal graph convolution neural networks for fast and accurate prediction of adsorption ability of Nb 2 CT x towards Pb (ii) and Cd (ii) ions. J. Mater. Chem. A 2023, 11, 9009–9018. [Google Scholar] [CrossRef]
- Iftikhar, S.; Zahra, N.; Rubab, F.; Sumra, R.A.; Khan, M.B.; Abbas, A.; Jaffari, Z.H. Artificial neural networks for insights into adsorption capacity of industrial dyes using carbon-based materials. Sep. Purif. Technol. 2023, 326, 124891. [Google Scholar] [CrossRef]
- An, S.S.; Fowler, C.; Zheng, B.W.; Shalaginov, M.Y.; Tang, H.; Li, H.; Zhou, L.; Ding, J.; Agarwal, A.M.; Rivero-Baleine, C.; et al. A deep learning approach for objective-driven all-dielectric metasurface design. ACS Photonics 2019, 6, 3196–3207. [Google Scholar] [CrossRef]
- Liu, Z.; Zhu, D.; Rodrigues, S.P.; Lee, K.-T.; Cai, W. Generative model for the inverse design of metasurfaces. Nano Lett. 2018, 18, 6570–6576. [Google Scholar] [CrossRef] [PubMed]
- Goodfellow, I.; Pouget-Abadie, J.; Mirza, M.; Xu, B.; Warde-Farley, D.; Ozair, S.; Courville, A.; Bengio, Y. Generative adversarial nets. In Proceedings of the Advances in Neural Information Processing Systems 27: Annual Conference on Neural Information Processing Systems 2014, Montreal, QC, Canada, 8–13 December 2014; pp. 1–27. [Google Scholar]
- Lin, Z.; Roques-Carmes, C.; Pestourie, R.; Soljačić, M.; Majumdar, A.; Johnson, S.G. End-to-end nanophotonic inverse design for imaging and polarimetry. Nanophotonics 2021, 10, 1177–1187. [Google Scholar] [CrossRef]
- Mansouree, M.; Kwon, H.; Arbabi, E.; McClung, A.; Faraon, A.; Arbabi, A. Multifunctional 2.5 D metastructures enabled by adjoint optimization. Optica 2020, 7, 77–84. [Google Scholar] [CrossRef]
- Chung, H.; Miller, O.D. High-NA achromatic metalenses by inverse design. Opt. Express 2020, 28, 6945–6965. [Google Scholar] [CrossRef] [PubMed]
- Barbastathis, G.; Ozcan, A.; Situ, G. On the use of deep learning for computational imaging. Optica 2019, 6, 921–943. [Google Scholar] [CrossRef]
- Sitzmann, V.; Diamond, S.; Peng, Y.F.; Dun, X.; Boyd, S.; Heidrich, W.; Heide, F.; Wetzstein, G. End-to-end Optimization of Optics and Image Processing for Achromatic Extended Depth of Field and Super-resolution Imaging. ACM Trans. Graph. 2018, 37, 1–13. [Google Scholar] [CrossRef]
- Chang, J.; Wetzstein, G. Deep optics for monocular depth estimation and 3D object detection. In Proceedings of the IEEE/CVF ICCV, Seoul, Republic of Korea, 27 October–2 November 2019; pp. 10192–10201. [Google Scholar]
- Wu, Y.C.; Boominathan, V.; Chen, H.J.; Sankaranarayanan, A.; Veeraraghavan, A. PhaseCam3D-Learning phase masks for passive single view depth estimation. In Proceedings of the 2019 IEEE International Conference on Computational Photography (ICCP), Tokyo, Japan, 15–17 May 2019. [Google Scholar]
- Metzler, C.A.; Ikoma, H.; Peng, Y.F.; Wetzstein, G. Deep optics for single-shot high-dynamic-range imaging. In Proceedings of the IEEE/CVF Conference on Computer Vision and Pattern Recognition (CVPR), Seattle, WA, USA, 13–19 June 2020; pp. 1372–1382. [Google Scholar]
- Chang, J.; Sitzmann, V.; Dun, X.; Heidrich, W.; Wetzstein, G. Hybrid optical-electronic convolutional neural networks with optimized diffractive optics for image classification. Sci. Rep. 2018, 8, 12324. [Google Scholar] [CrossRef] [PubMed]
- Dun, X.; Ikoma, H.; Wetzstein, G.; Wang, Z.S.; Cheng, X.B.; Peng, Y.F. Learned rotationally symmetric diffractive achromat for full-spectrum computational imaging. Optica 2020, 7, 913–922. [Google Scholar] [CrossRef]
- Tseng, E.; Colburn, S.; Whitehead, J.; Huang, L.; Baek, S.-H.; Majumdar, A.; Heide, F. Neural nano-optics for high-quality thin lens imaging. Nat. Commun. 2021, 12, 6493–6503. [Google Scholar] [CrossRef] [PubMed]
- Colburn, S.; Zhan, A.; Majumdar, A. Metasurface optics for full-color computational imaging. Sci. Adv. 2018, 4, 2114. [Google Scholar] [CrossRef] [PubMed]
- Guo, Q.; Shi, Z.J.; Huang, Y.W.; Alexander, E.; Qiu, C.W.; Capasso, F.; Zickler, T. Compact single-shot metalens depth sensors inspired by eyes of jumping spiders. Proc. Natl. Acad. Sci. USA 2019, 116, 22959–22965. [Google Scholar] [CrossRef] [PubMed]
- Tan, S.Y.; Yang, F.; Boominathan, V.; Veeraraghavan, A.; Naik, G. 3D imaging using extreme dispersion in optical metasurfaces. ACS Photonics 2021, 8, 1421–1429. [Google Scholar] [CrossRef]
- Fan, Q.B.; Xu, W.Z.; Hu, X.M.; Zhu, W.Q.; Yue, T.; Zhang, C.; Yan, F.; Chen, L.; Lezec, H.J.; Lu, Y.Q.; et al. Trilobite-inspired neural nanophotonic light-field camera with extreme depth-of-field. Nat. Commun. 2022, 13, 2130. [Google Scholar] [CrossRef] [PubMed]
- Hua, X.; Wang, Y.J.; Wang, S.M.; Zou, X.J.; Zhou, Y.; Li, L.; Yan, F.; Cao, X.; Xiao, S.M.; Tsai, D.P.; et al. Ultra-compact snapshot spectral light-field imaging. Nat. Commun. 2022, 13, 30439–30448. [Google Scholar] [CrossRef]
- Yu, Z.Q.; Zhang, Q.B.; Tao, X.; Li, Y.; Tao, C.N.; Wu, F.; Wang, C.; Zheng, Z.R. High-performance full-color imaging system based on end-to-end joint optimization of computer-generated holography and metalens. Opt. Express 2022, 30, 40871–40883. [Google Scholar] [CrossRef] [PubMed]
- Zhang, Q.B.; Yu, Z.Q.; Liu, X.Y.; Wang, C.; Zheng, Z.R. End-to-end joint optimization of metasurface and image processing for compact snapshot hyperspectral imaging. Opt. Commun. 2023, 530, 129154. [Google Scholar] [CrossRef]
- Li, H.M.; Xiao, X.J.; Fang, B.; Gao, S.L.; Wang, Z.Z.; Chen, C.; Zhao, Y.W.; Zhu, S.N.; Li, T. Bandpass-filter-integrated multiwavelength achromatic metalens. Photonics Res. 2021, 9, 1384–1390. [Google Scholar] [CrossRef]
- Khorasaninejad, M.; Shi, Z.; Zhu, A.Y.; Chen, W.T.; Sanjeev, V.; Zaidi, A.; Capasso, F. Achromatic metalens over 60 nm bandwidth in the visible and metalens with reverse chromatic dispersion. Nano Lett. 2017, 17, 1819–1824. [Google Scholar] [CrossRef] [PubMed]
- Khorasaninejad, M.; Capasso, F. Metalenses: Versatile multifunctional photonic components. Science 2017, 358, 358–366. [Google Scholar] [CrossRef] [PubMed]
- Fan, S.; Joannopoulos, J.D. Analysis of guided resonances in photonic crystal slabs. Phys. Rev. B 2002, 65, 235112. [Google Scholar] [CrossRef]
- Wang, S.; Magnusson, R. Theory and applications of guided-mode resonance filters. Appl. Opt. 1993, 32, 2606–2613. [Google Scholar] [CrossRef] [PubMed]
- Shi, R.X.; Hu, S.L.; Sun, C.Q.; Wang, B.; Cai, Q.Z. Broadband achromatic metalens in the visible light spectrum based on fresnel zone spatial multiplexing. Nanomaterials 2022, 12, 4298. [Google Scholar] [CrossRef] [PubMed]
- Khare, K.; Butola, M.; Rajora, S. Fourier Optics and Computational Imaging; Springer: Berlin/Heidelberg, Germany, 2015. [Google Scholar]
- Ronneberger, O.; Fischer, P.; Brox, T. U-net: Convolutional networks for biomedical image segmentation. In Proceedings of the Medical Image Computing and Computer-Assisted Intervention–MICCAI 2015: 18th International Conference, Munich, Germany, 5–9 October 2015; pp. 234–241. [Google Scholar]
- Simonyan, K.; Zisserman, A. Very deep convolutional networks for large-scale image recognition. arXiv 2014, arXiv:1409.1556. [Google Scholar]
- Agustsson, E.; Timofte, R. Ntire 2017 challenge on single image super-resolution: Dataset and study. In Proceedings of the IEEE Conference on Computer Vision and Pattern Recognition Workshops, Honolulu, HI, USA, 21–26 July 2017; pp. 126–135. [Google Scholar]
Figure 1.
The imaging reconstruction system.

Figure 2.
(a) Three-dimensional view of a unit cell; (b) top view of the unit cells; (c) the phase of unit cells; and (d) the transmittance of unit cells.
Figure 2.
(a) Three-dimensional view of a unit cell; (b) top view of the unit cells; (c) the phase of unit cells; and (d) the transmittance of unit cells.
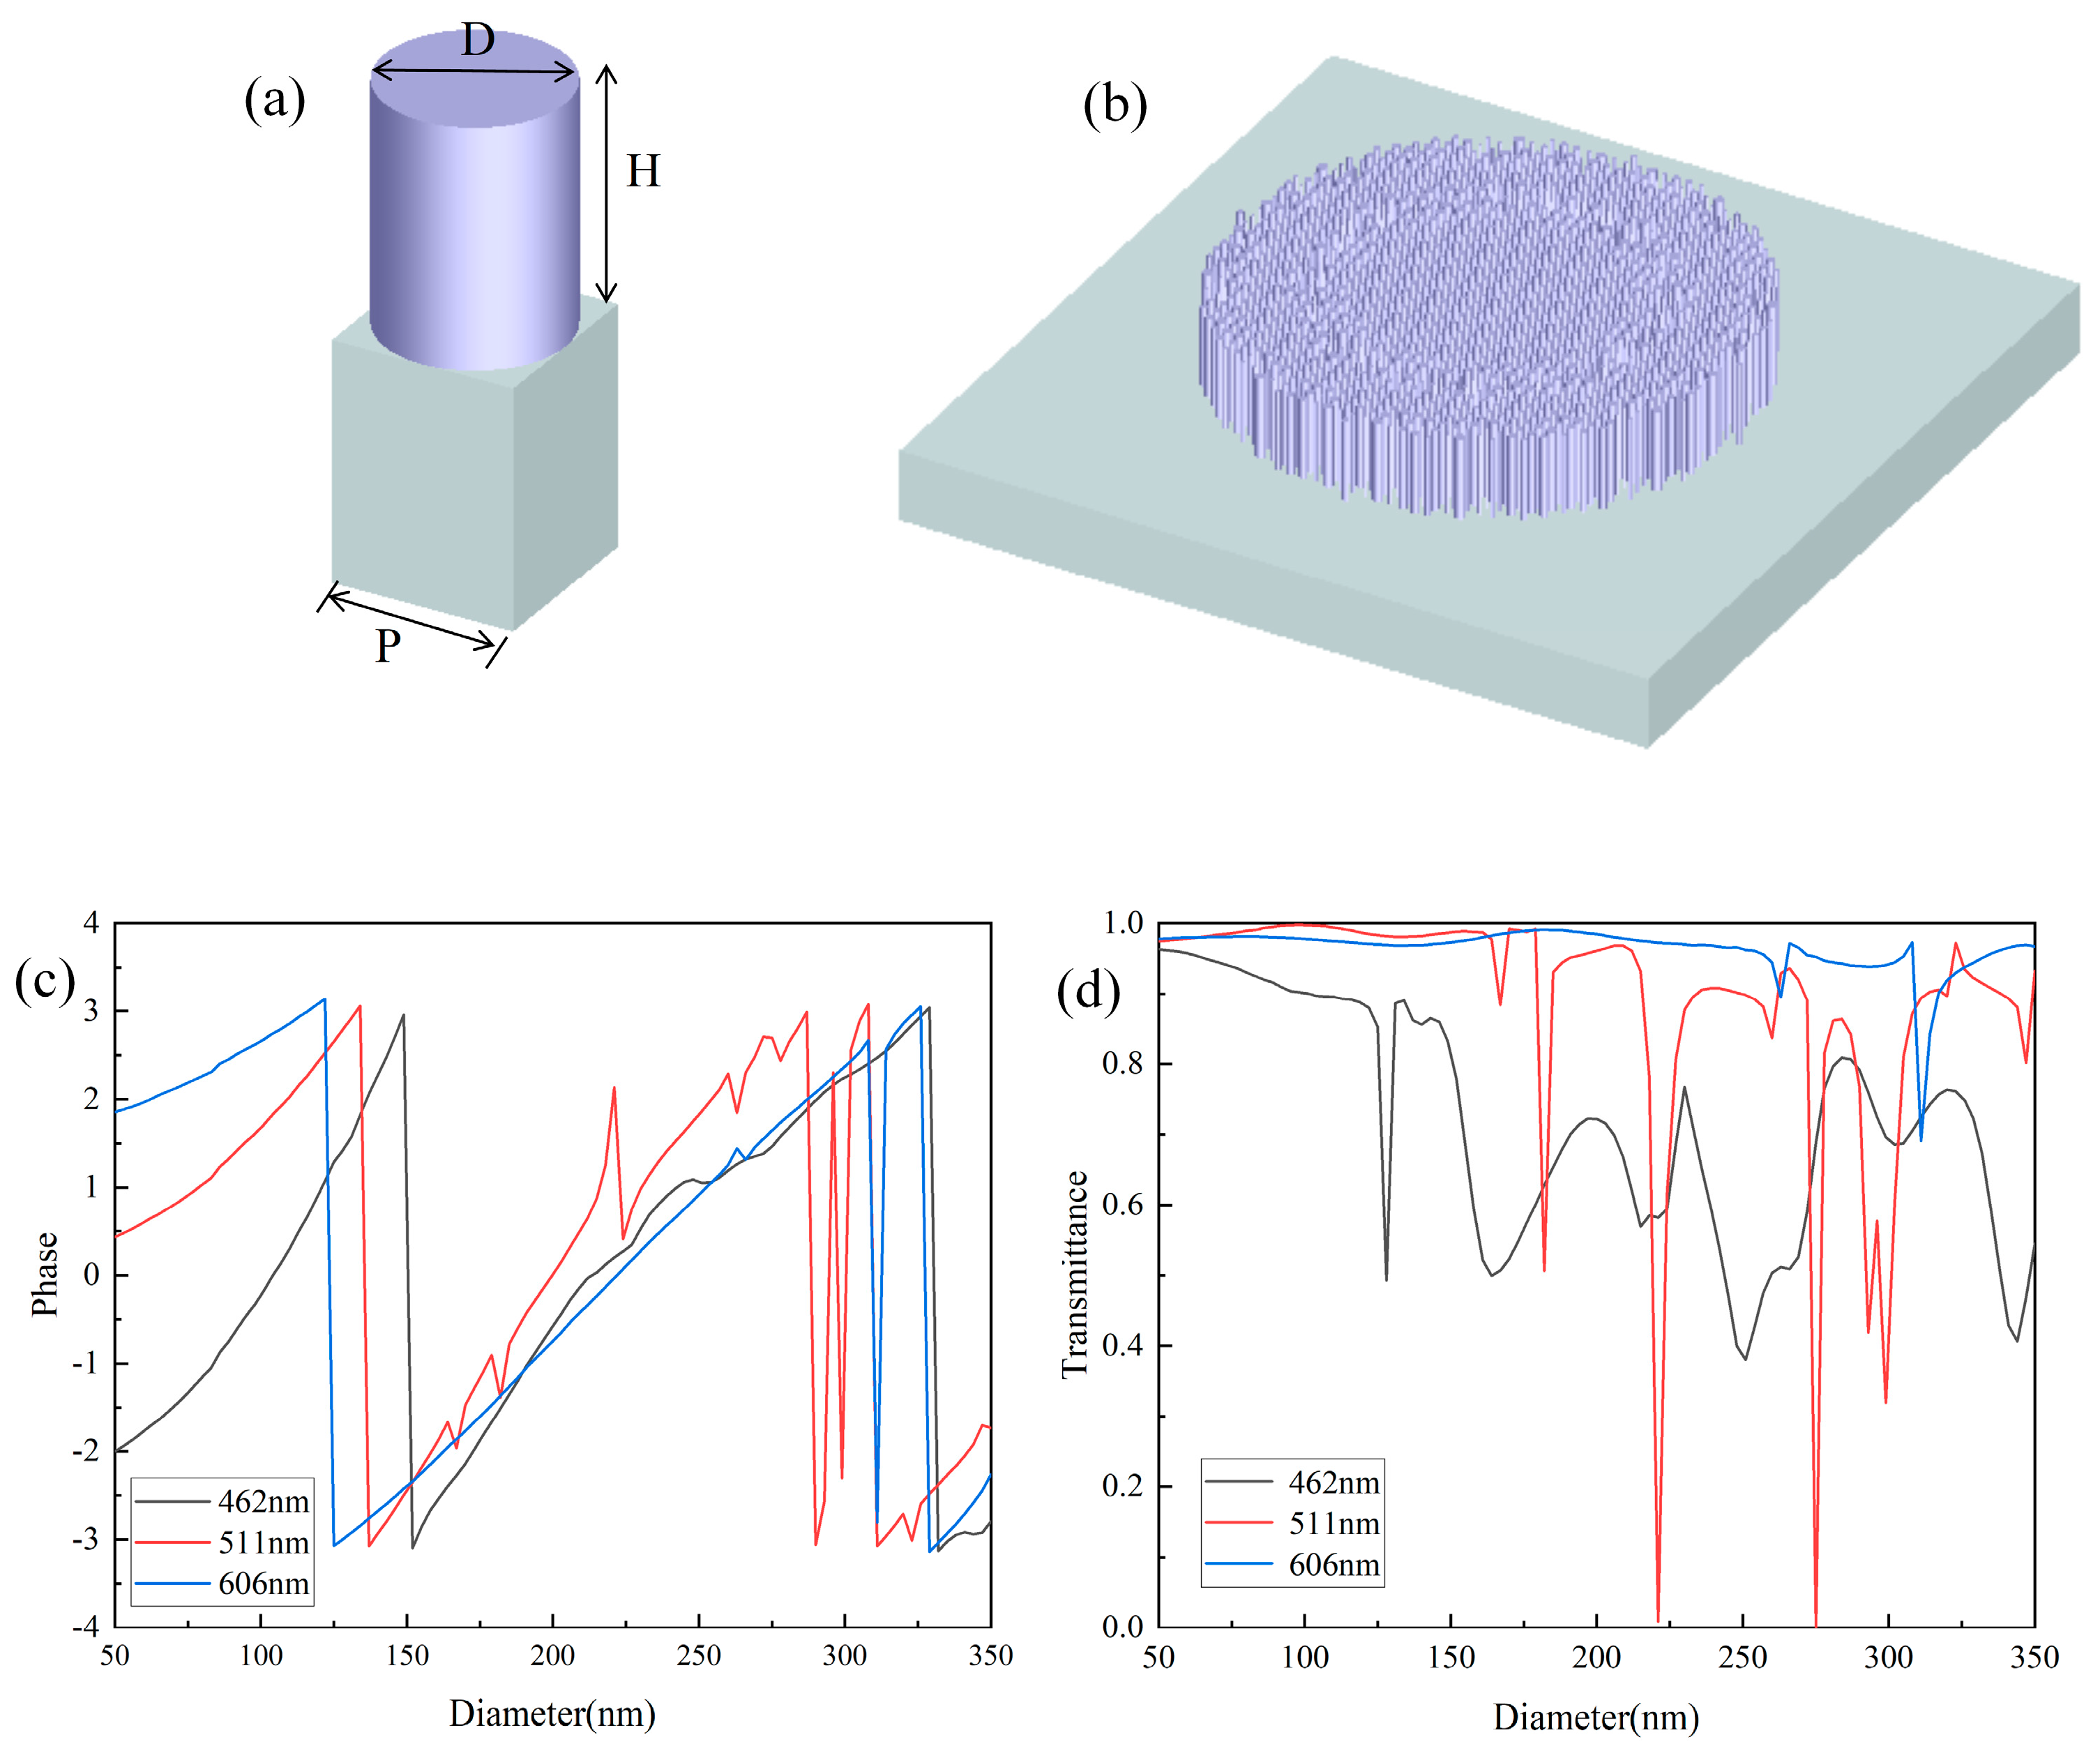
Figure 3.
The metalens diffraction imaging schematic scheme.
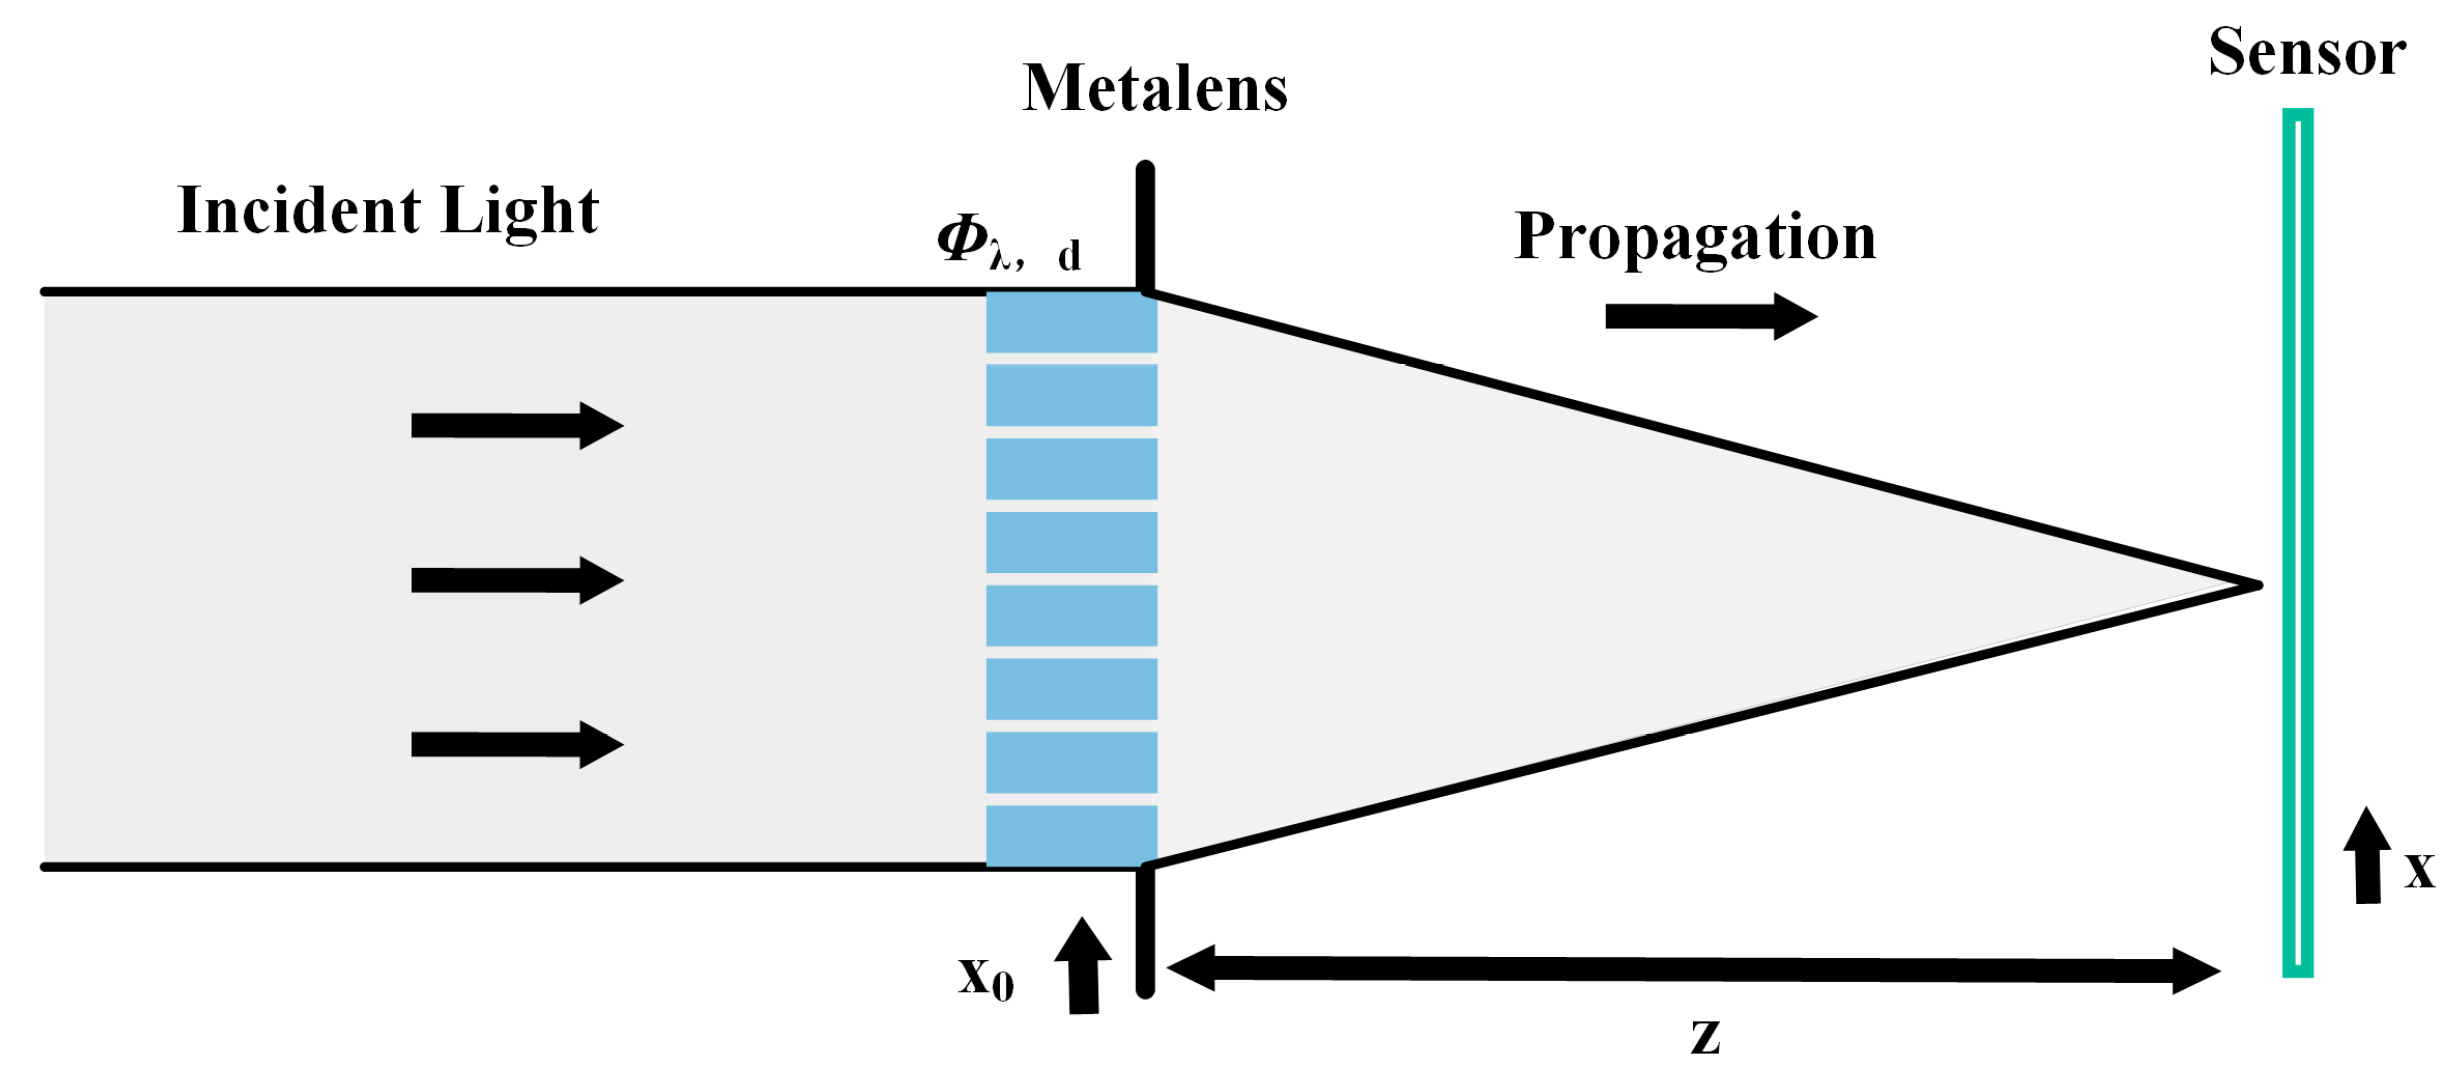
Figure 4.
The multi-scale encoder–decoder based on a convolutional neural network.
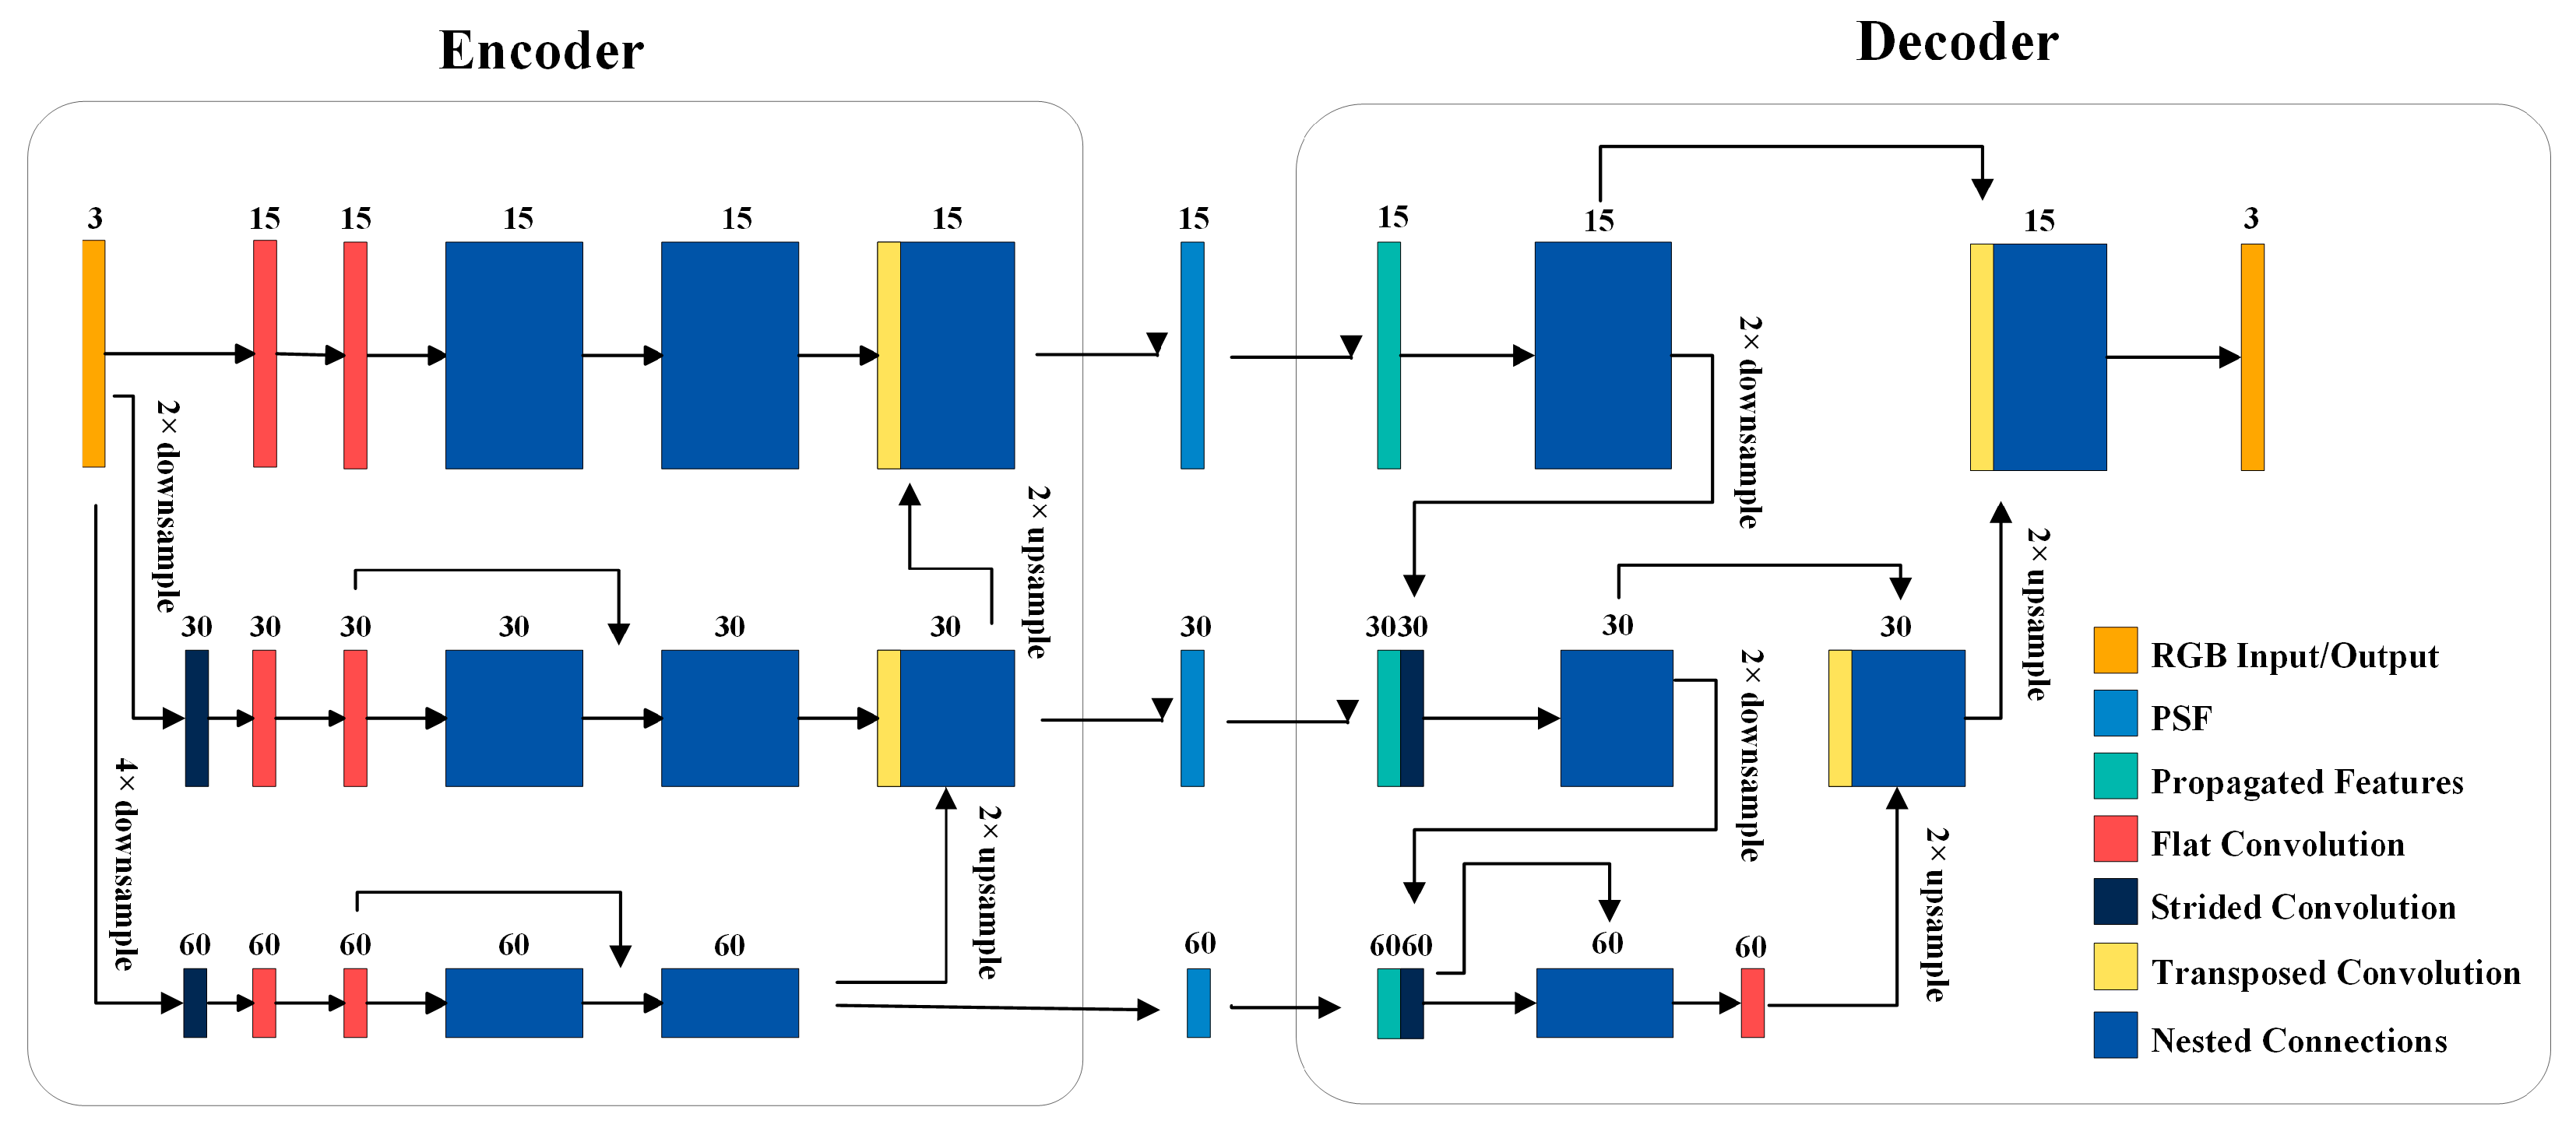
Figure 5.
(a) The relative intensity of the PSF of 462 nm; (b) the relative intensity of the PSF of 511 nm; and (c) the relative intensity of the PSF of 606 nm.
Figure 5.
(a) The relative intensity of the PSF of 462 nm; (b) the relative intensity of the PSF of 511 nm; and (c) the relative intensity of the PSF of 606 nm.

Figure 6.
(a) Schematic diagram of loss function changes; (b) schematic diagram of PSNR changes; and (c) schematic diagram of SSIM changes.
Figure 6.
(a) Schematic diagram of loss function changes; (b) schematic diagram of PSNR changes; and (c) schematic diagram of SSIM changes.
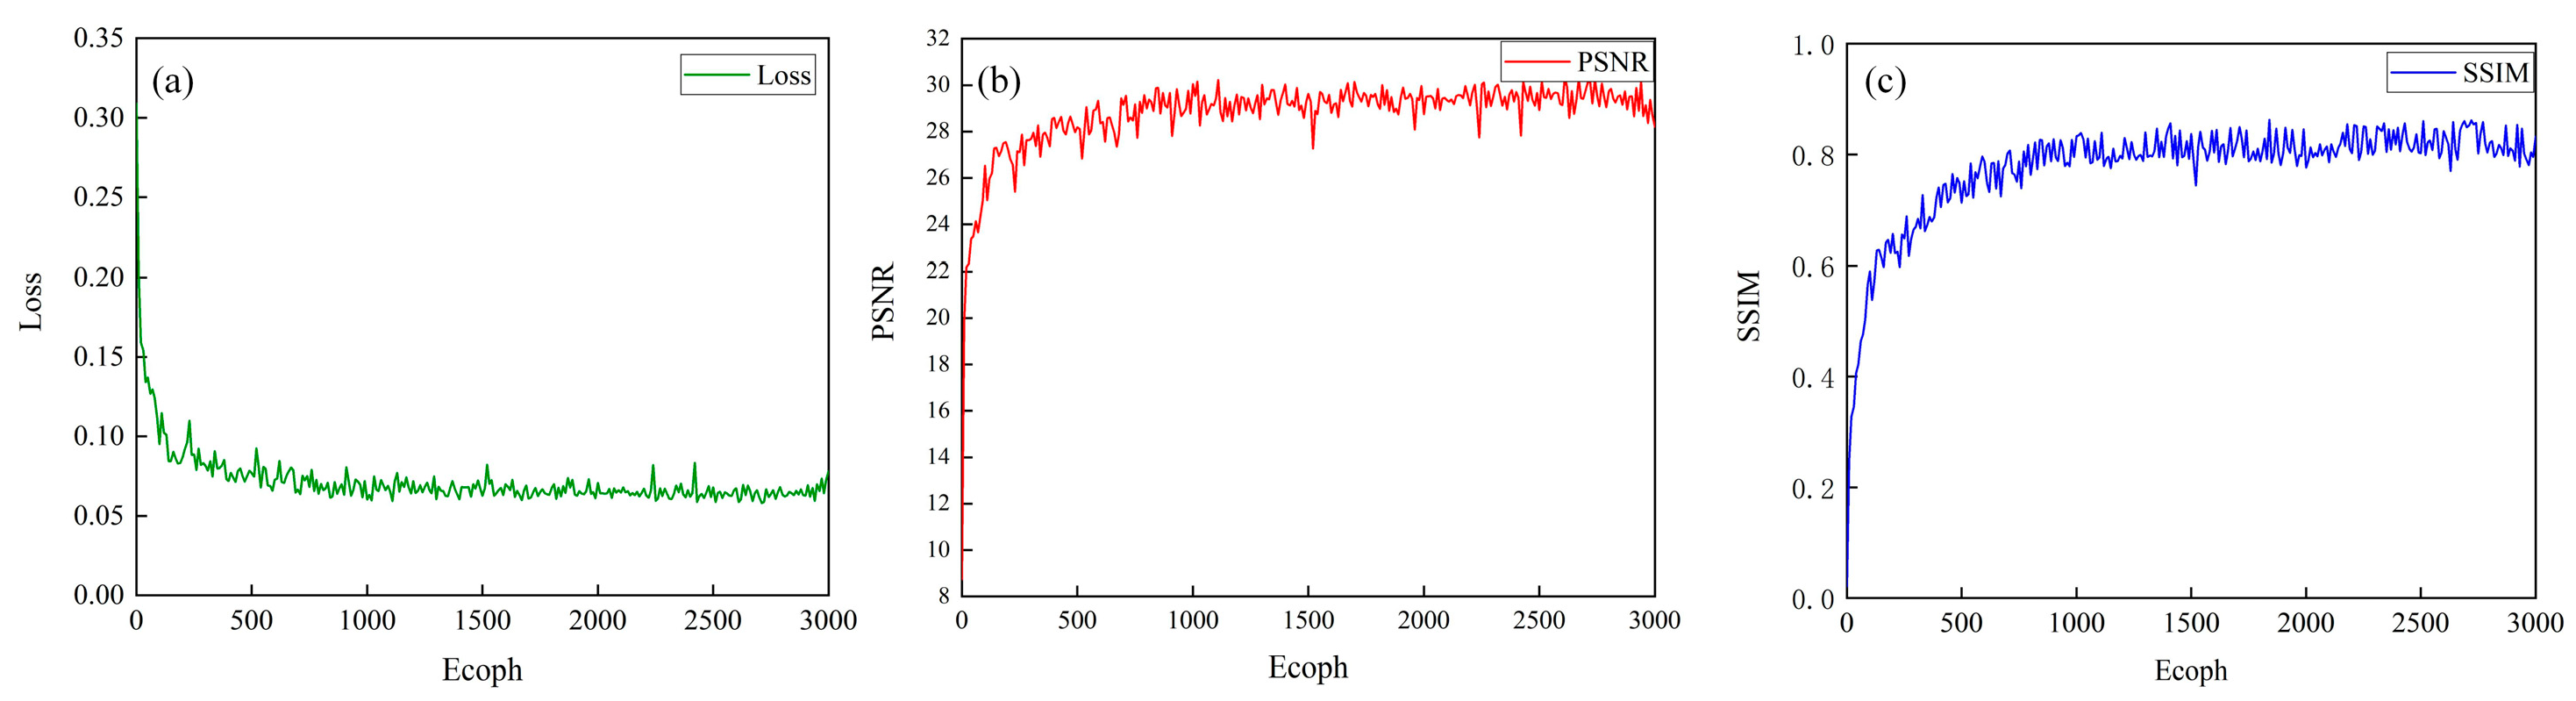
Figure 7.
The imaging reconstruction system results for different metalens phases.


Disclaimer/Publisher’s Note: The statements, opinions and data contained in all publications are solely those of the individual author(s) and contributor(s) and not of MDPI and/or the editor(s). MDPI and/or the editor(s) disclaim responsibility for any injury to people or property resulting from any ideas, methods, instructions or products referred to in the content. |
© 2024 by the authors. Licensee MDPI, Basel, Switzerland. This article is an open access article distributed under the terms and conditions of the Creative Commons Attribution (CC BY) license (https://creativecommons.org/licenses/by/4.0/).
Share and Cite
MDPI and ACS Style
Hu, S.; Shi, R.; Wang, B.; Wei, Y.; Qi, B.; Zhou, P. Full-Color Imaging System Based on the Joint Integration of a Metalens and Neural Network. Nanomaterials 2024, 14, 715. https://doi.org/10.3390/nano14080715
AMA Style
Hu S, Shi R, Wang B, Wei Y, Qi B, Zhou P. Full-Color Imaging System Based on the Joint Integration of a Metalens and Neural Network. Nanomaterials. 2024; 14(8):715. https://doi.org/10.3390/nano14080715
Chicago/Turabian StyleHu, Shuling, Ruixue Shi, Bin Wang, Yuan Wei, Binzhi Qi, and Peng Zhou. 2024. "Full-Color Imaging System Based on the Joint Integration of a Metalens and Neural Network" Nanomaterials 14, no. 8: 715. https://doi.org/10.3390/nano14080715
Note that from the first issue of 2016, this journal uses article numbers instead of page numbers. See further details here.