Performance of Electropun Polyacrylonitrile Nanofibrous Phases, Shown for the Separation of Water-Soluble Food Dyes via UTLC-Vis-ESI-MS


Abstract
:
1. Introduction
2. Experimental
2.1. Materials
2.2. Fabrication of Electrospun PAN Nanofiber Phases
2.3. Standard Solutions
2.4. Application
2.5. Chromatography
2.6. Documentation and Videoevaluation
2.7. Characterization by Electrospray Ionization Mass Spectrometry (ESI-MS)
3. Results and Discussion
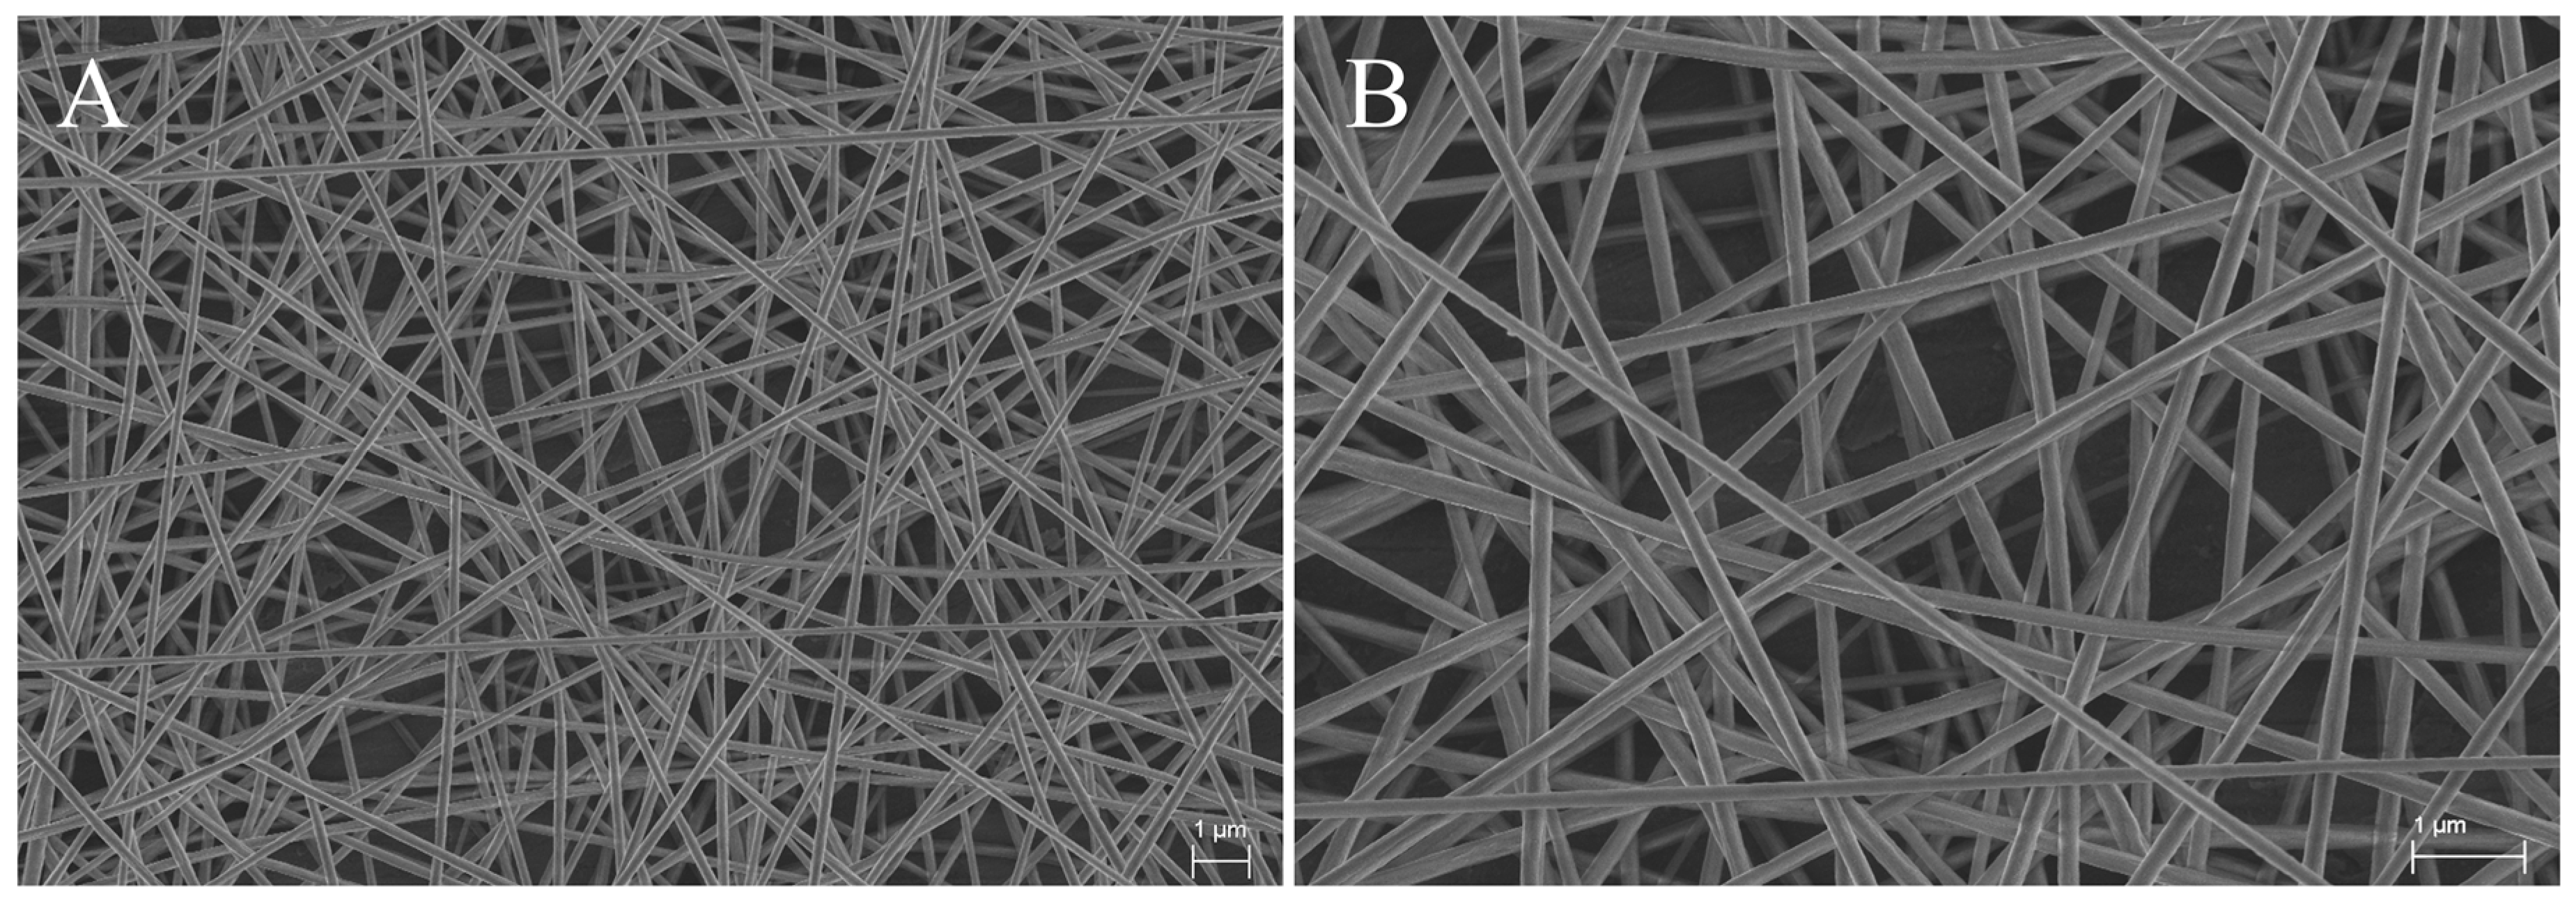
3.1. Characterization of Electrospun PAN Nanofibers
3.2. Comparison of Migration Velocities on Three Different Phases
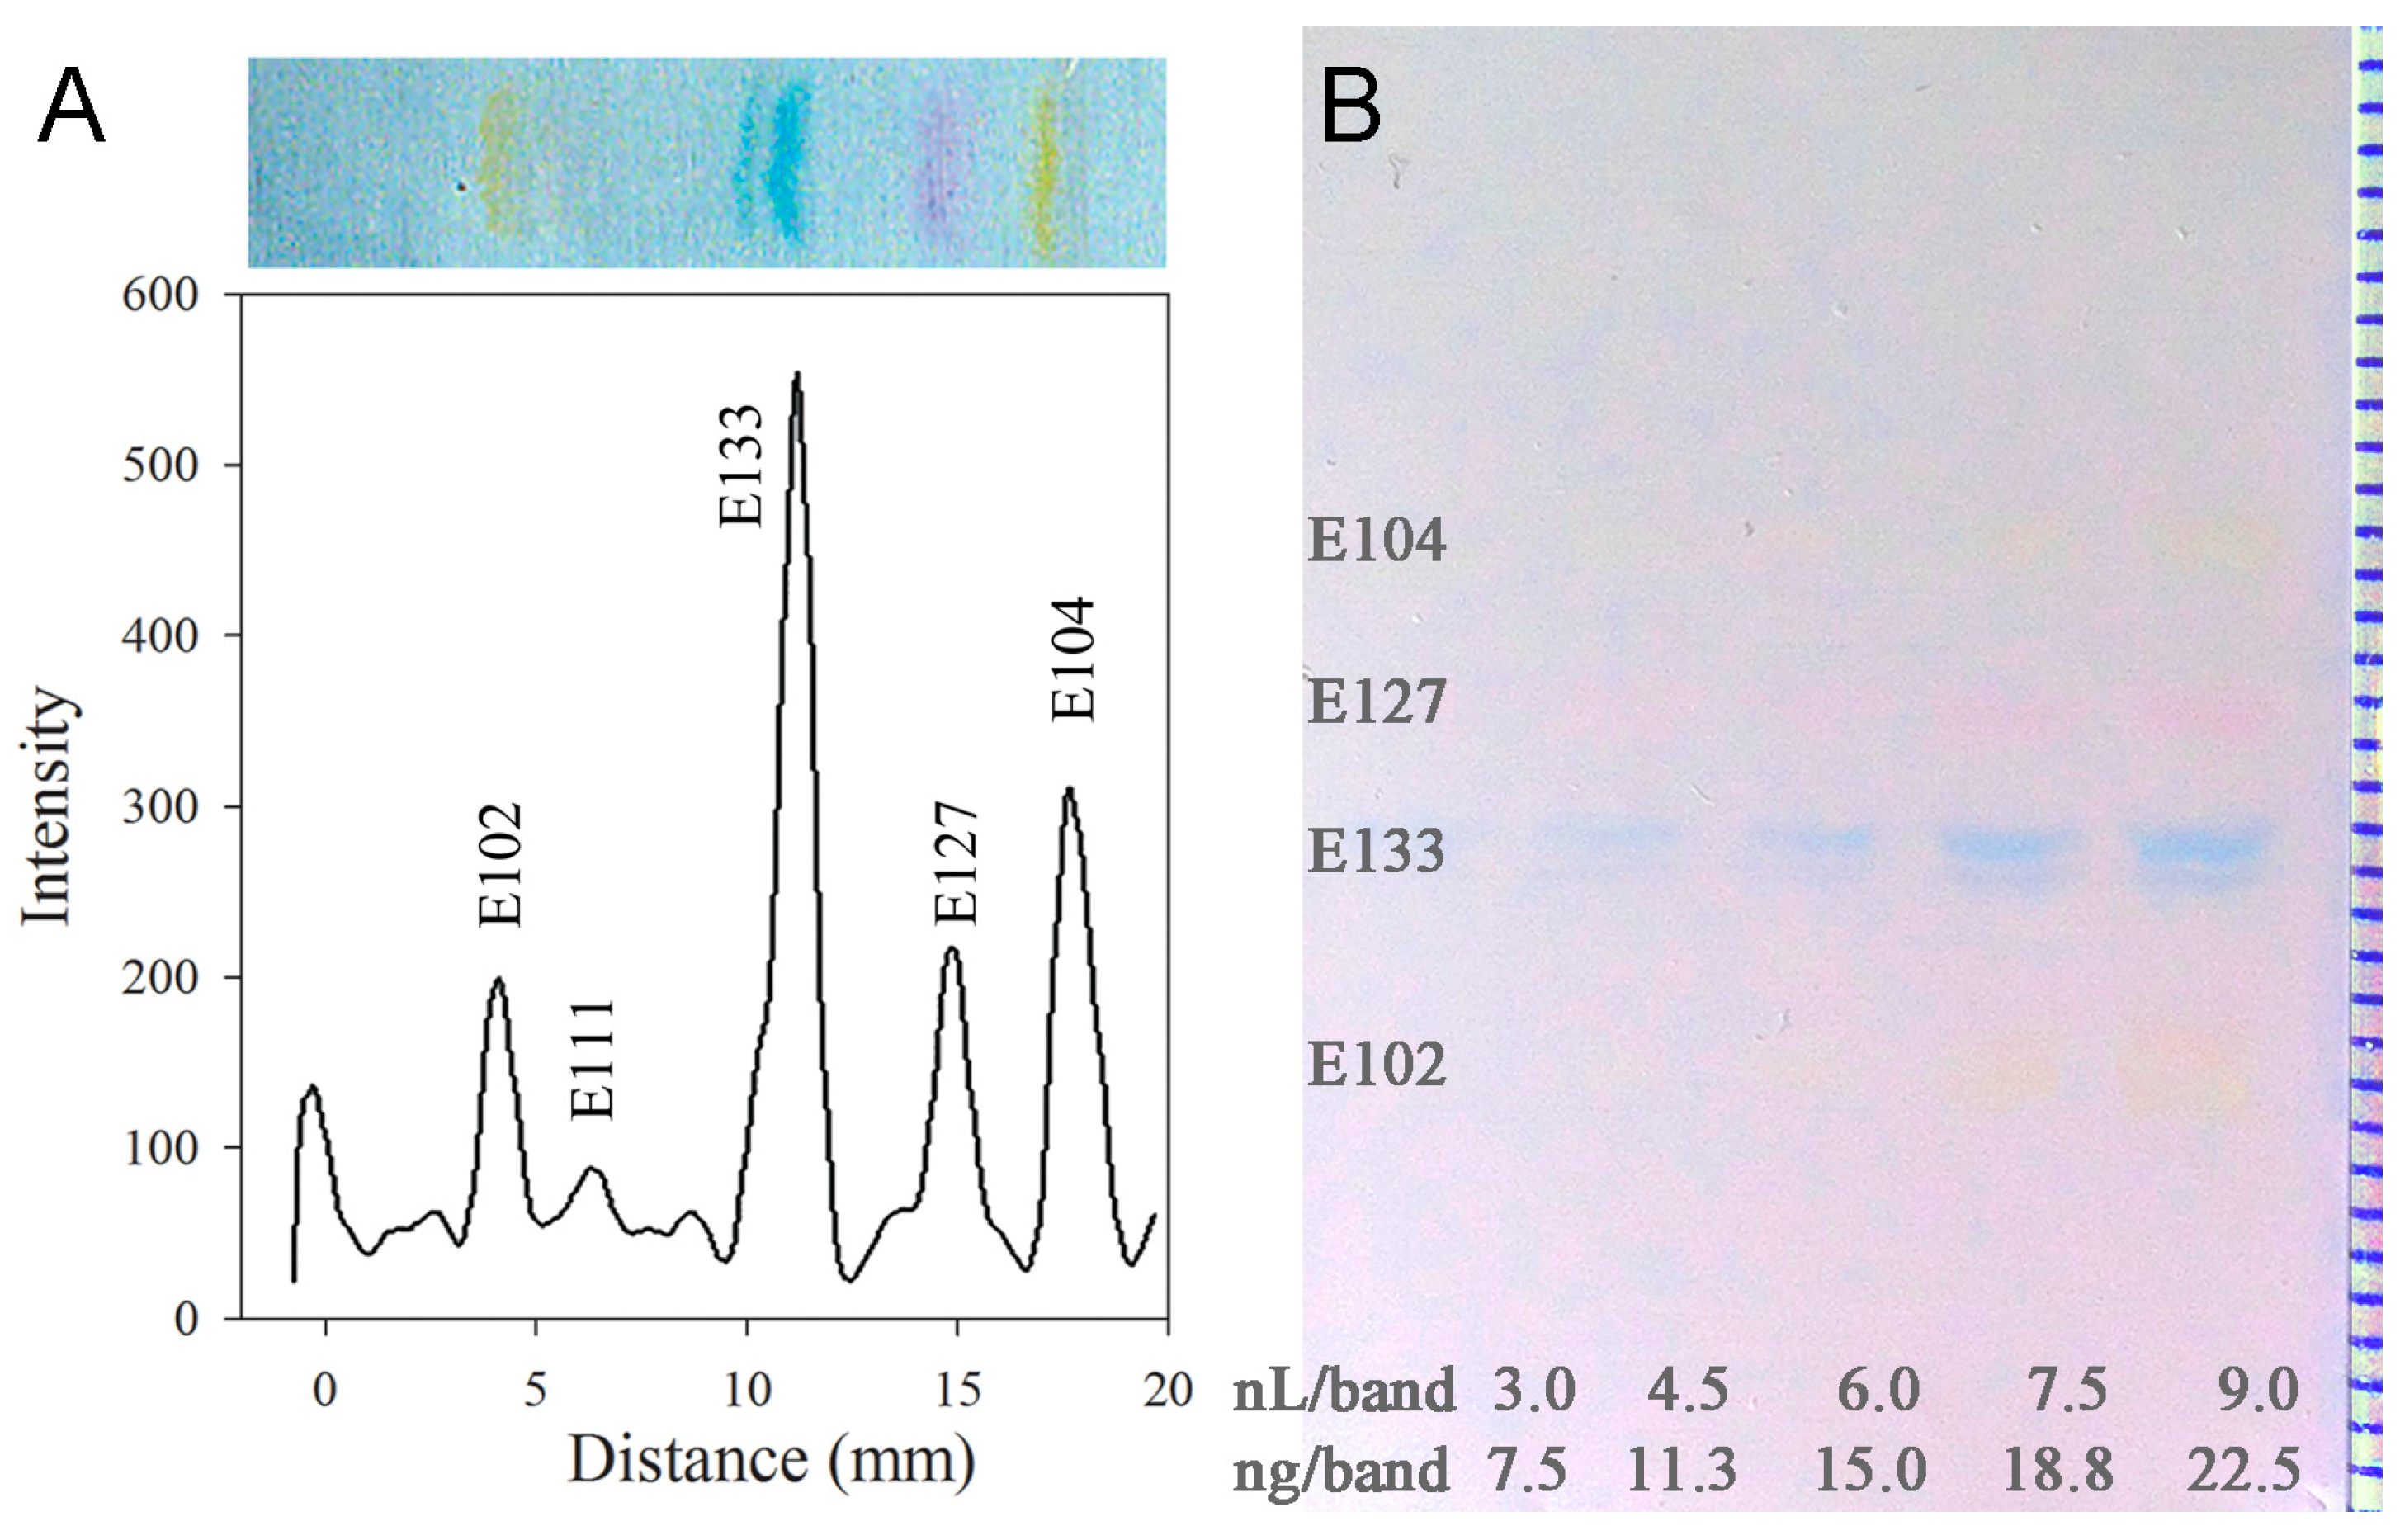
3.3. Efficiency and Performance of the Electrospun PAN Nanofiber Phase
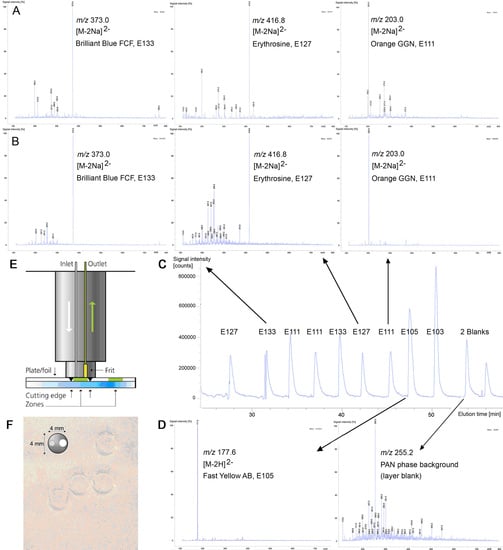
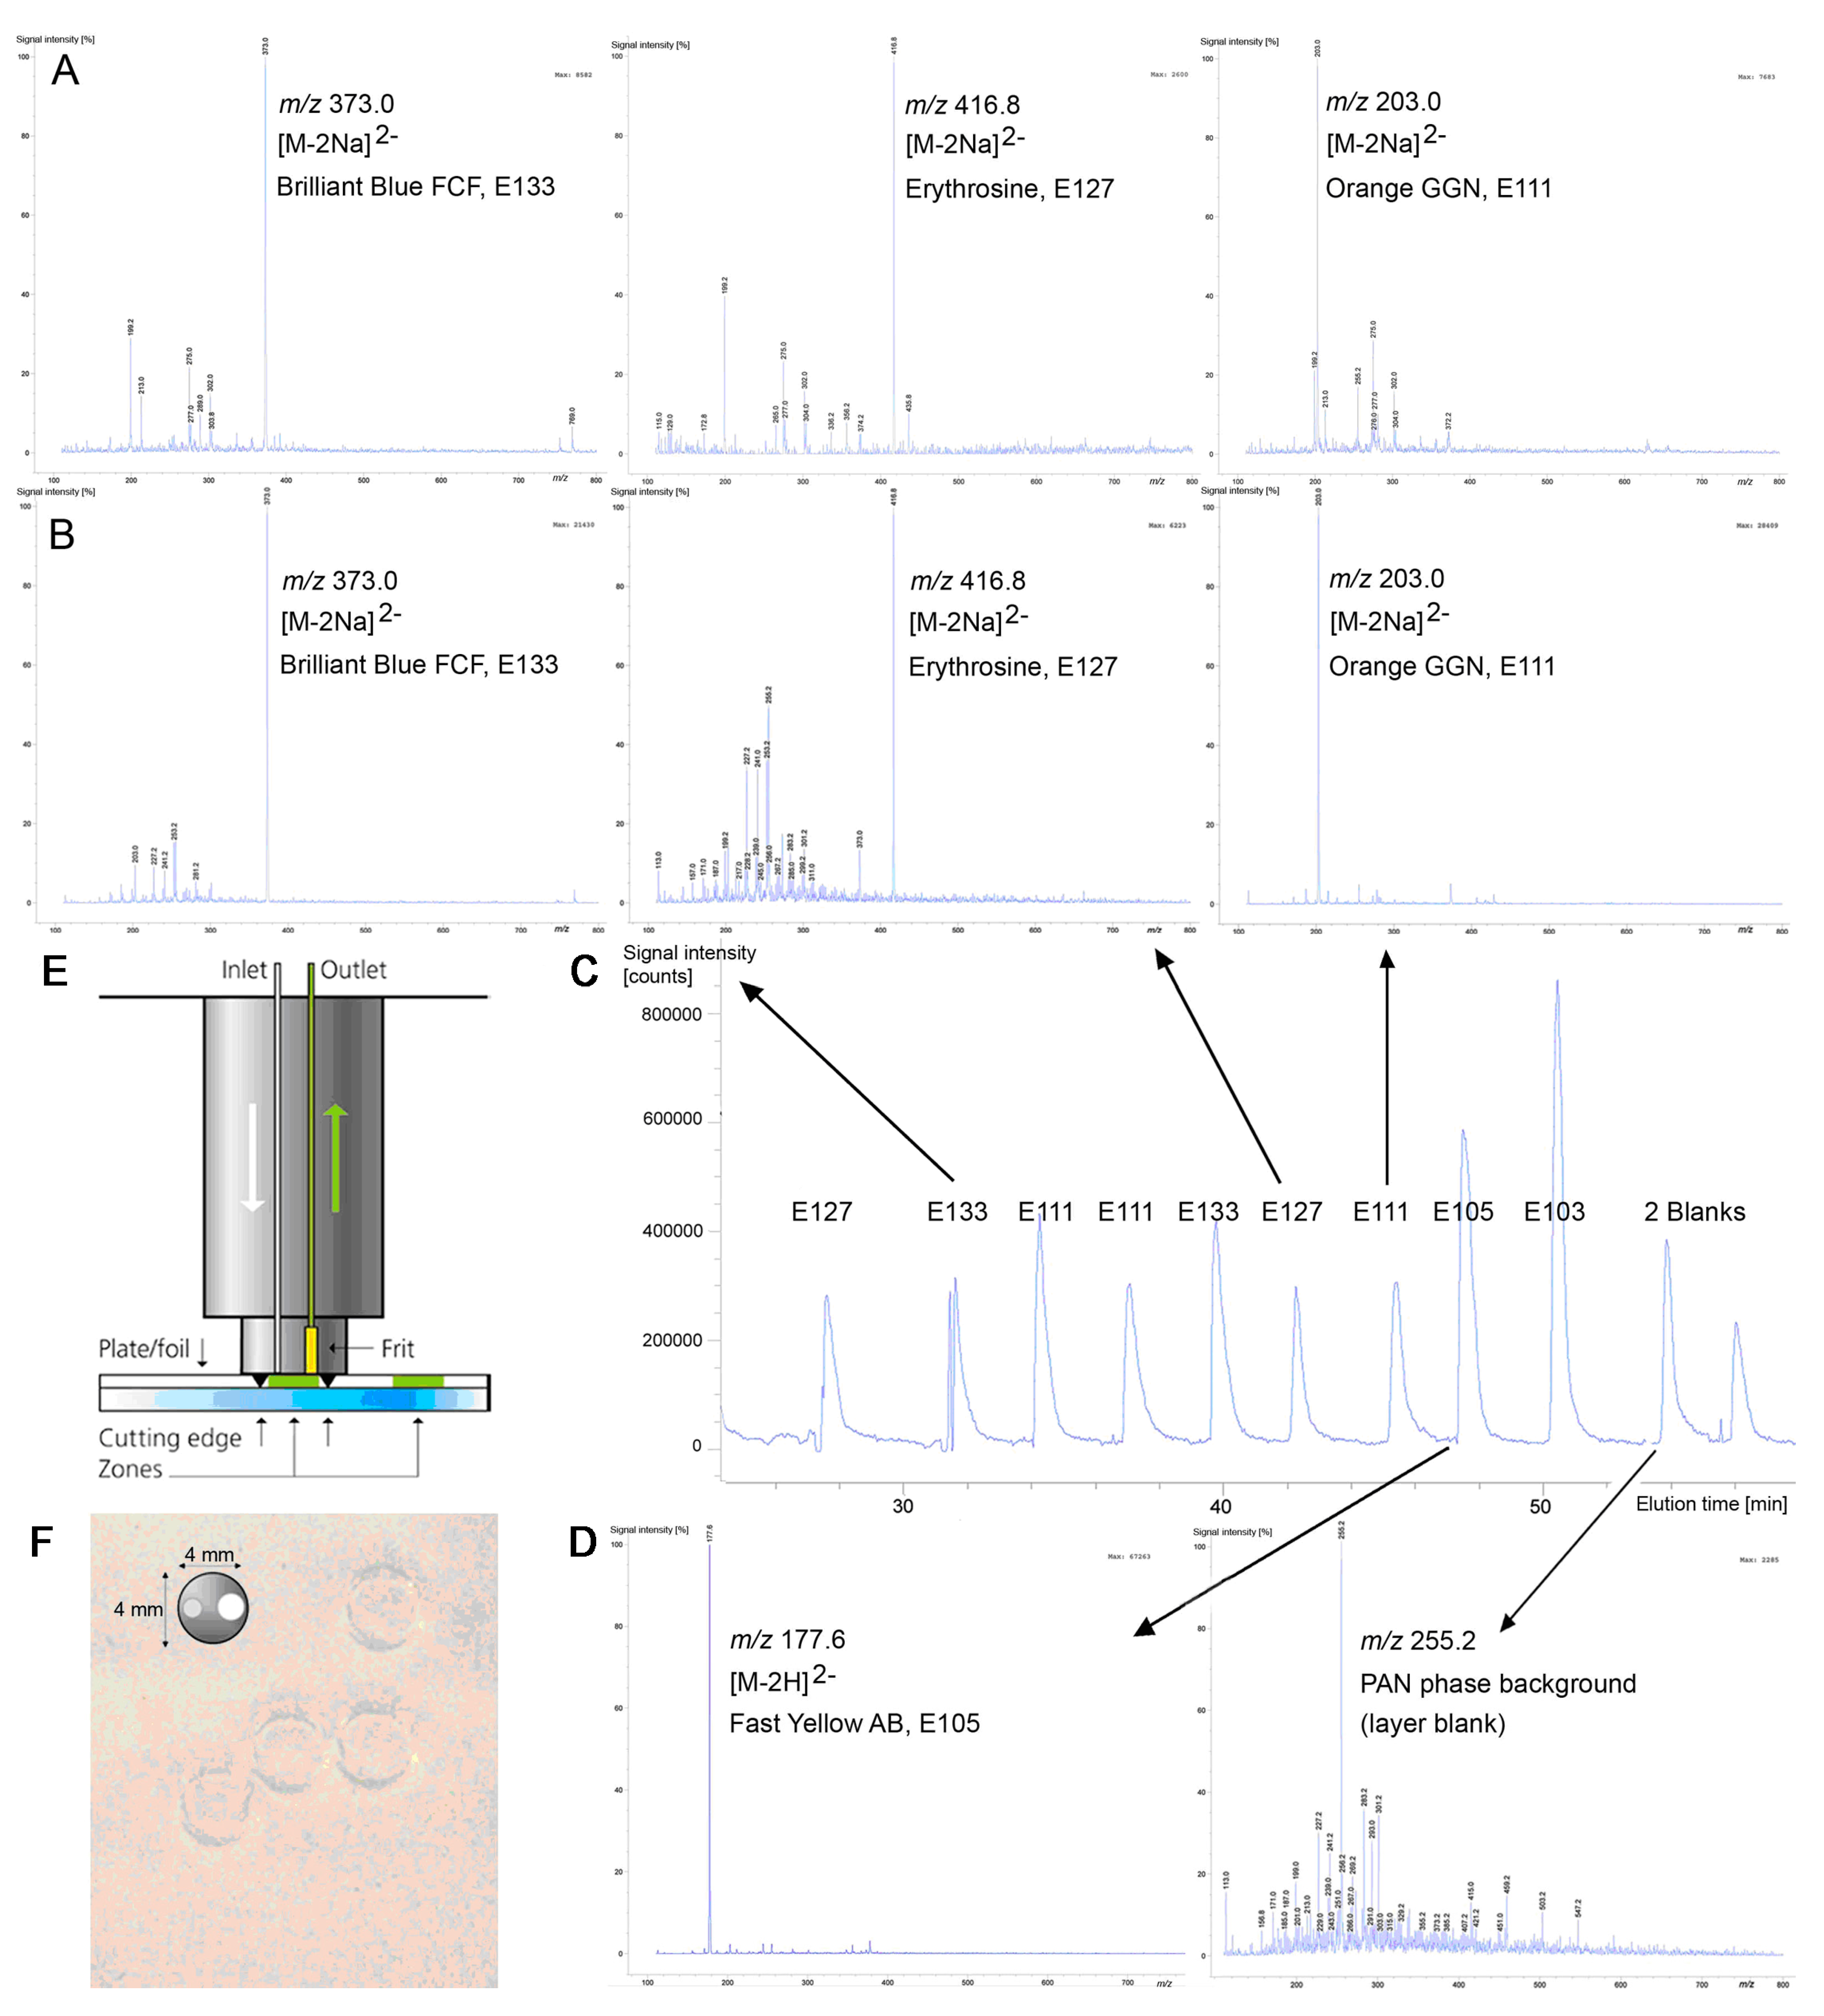
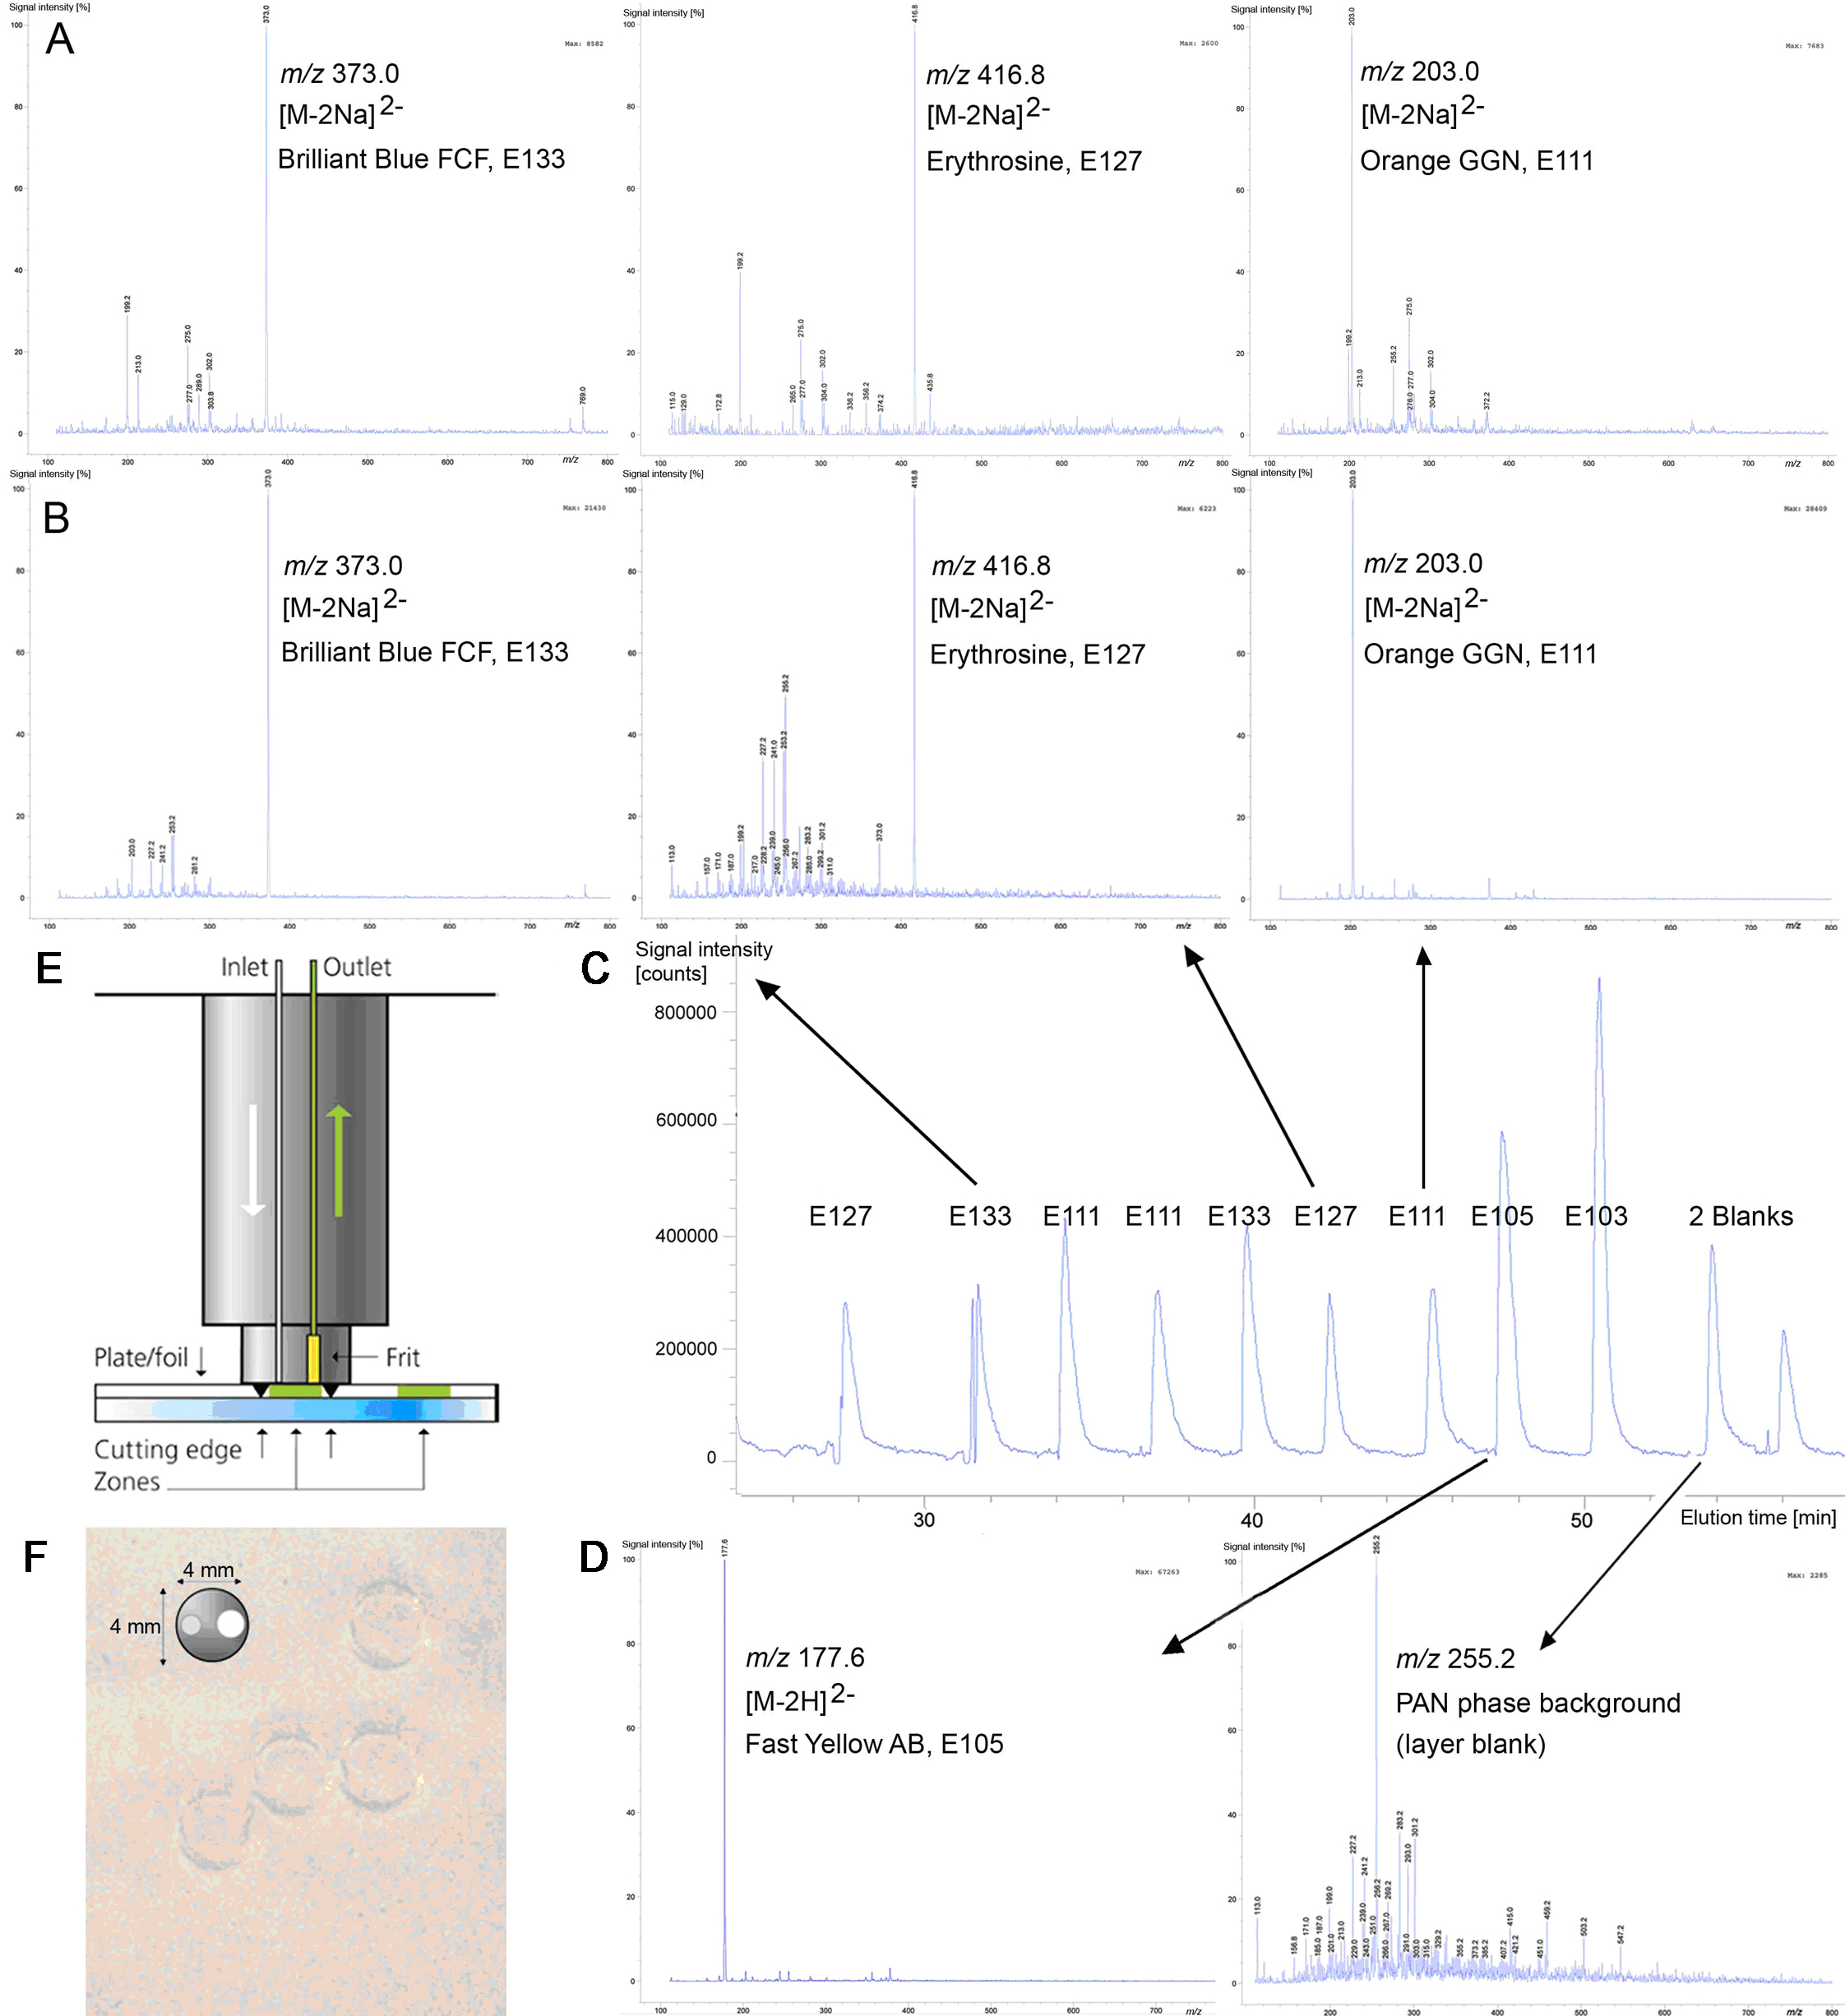
3.4. Identification by Mass Spectrometry
4. Conclusions
Acknowledgments
Author Contributions
Conflicts of Interest
References
- Poole, C.F. Thin-layer chromatography: Challenges and opportunities. J. Chromatogr. A 2003, 1000, 963–984. [Google Scholar] [CrossRef]
- Poole, C.F. Planar chromatography at the turn of the century. J. Chromatogr. A 1999, 856, 399–427. [Google Scholar] [CrossRef]
- Siouffi, A. From paper to planar, 60 years of thin layer chromatography. Sep. Purif. Rev. 2005, 34, 155–180. [Google Scholar] [CrossRef]
- Hauck, H.E.; Bund, O.; Fischer, M.; Schulz, M. Ultra-thin layer chromatography (UTLC)—A new dimension in thin-layer chromatography. J. Planar Chromatogr. 2001, 14, 234–236. [Google Scholar] [CrossRef]
- Hauck, H.E.; Schulz, M. Ultrathin-layer chromatography. J. Chromatogr. Sci. 2002, 40, 550–552. [Google Scholar] [CrossRef] [PubMed]
- Salo, P.K.; Salomies, H.; Harju, K.; Ketola, R.A.; Kotiaho, T.; Yli-Kauhaluoma, J.; Kostiainen, R. Analysis of small molecules by ultra thin-layer chromatography-atmospheric pressure matrix-assisted laser desorption/ionization mass spectrometry. J. Am. Soc. Mass Spectrom. 2005, 16, 906–915. [Google Scholar] [CrossRef] [PubMed]
- Clark, J.E.; Olesik, S.V. Technique for ultrathin layer chromatography using an electrospun, nanofibrous stationary phase. Anal. Chem. 2009, 81, 4121–4129. [Google Scholar] [CrossRef] [PubMed]
- Bezuidenhout, L.W.; Brett, M.J. Ultrathin layer chromatography on nanostructured thin films. J. Chromatogr. A 2008, 1183, 179–185. [Google Scholar] [CrossRef] [PubMed]
- Clark, J.E.; Olesik, S.V. Electrospun glassy carbon ultra-thin layer chromatography devices. J. Chromatogr. A 2010, 1217, 4655–4662. [Google Scholar] [CrossRef] [PubMed]
- Sutasinpromprae, J.; Jitjaicham, S.; Nithitanakul, M.; Meechaisue, C.; Supaphol, P. Preparation and characterization of ultrafine electrospun polyacrylonitrile fibers and their subsequent pyrolysis to carbon fibers. Polym. Int. 2006, 55, 825–833. [Google Scholar] [CrossRef]
- Kampalanonwat, P.; Supaphol, P.; Morlock, G. Electrospun nanofiber layers with incorporated photoluminescence indicator for chromatography and detection of ultraviolet-active compounds. J. Chromatogr. A 2013, 1299, 110–117. [Google Scholar] [CrossRef] [PubMed]
- Häbe, T.; Morlock, G. Office chromatography: Precise printing of sample solutions on miniaturized thin-layer phases and utilization for scanning direct analysis in real time mass spectrometry. J. Chromatogr. A 2015, 1413, 127–134. [Google Scholar] [CrossRef] [PubMed]
- Washburn, E.W. The dynamics of capillary flow. Phys. Rev. 1921, 17, 273–283. [Google Scholar] [CrossRef]
- Good, R.J.; Lin, N.J. Rate of penetration of a fluid into a porous body. J. Colloid Interface Sci. 1976, 54, 52–58. [Google Scholar] [CrossRef]
- Morlock, G.; Stiefel, C.; Schwack, W. Efficacy of a modified printer for application of reagents in planar chromatography. J. Liq. Chromatogr. Relat. Technol. 2007, 30, 2171–2184. [Google Scholar] [CrossRef]
- Morlock, G.; Oellig, C.; Bezuidenhout, L.W.; Brett, M.J.; Schwack, W. Miniaturized planar chromatography using office peripherals. Anal. Chem. 2010, 82, 2940–2946. [Google Scholar] [CrossRef] [PubMed]
- Morlock, G.E.; Oellig, C. Rapid planar chromatographic analysis of 25 water-soluble dyes used as food additives. J. AOAC Int. 2009, 92, 745–756. [Google Scholar] [PubMed]
 ), HPTLC plate silica gel CN (
  ) and electrospun PAN nanofiber phase (
  ).
), HPTLC plate silica gel CN ( ) and electrospun PAN nanofiber phase ( ).
).
), HPTLC plate silica gel CN ( ) and electrospun PAN nanofiber phase ( ).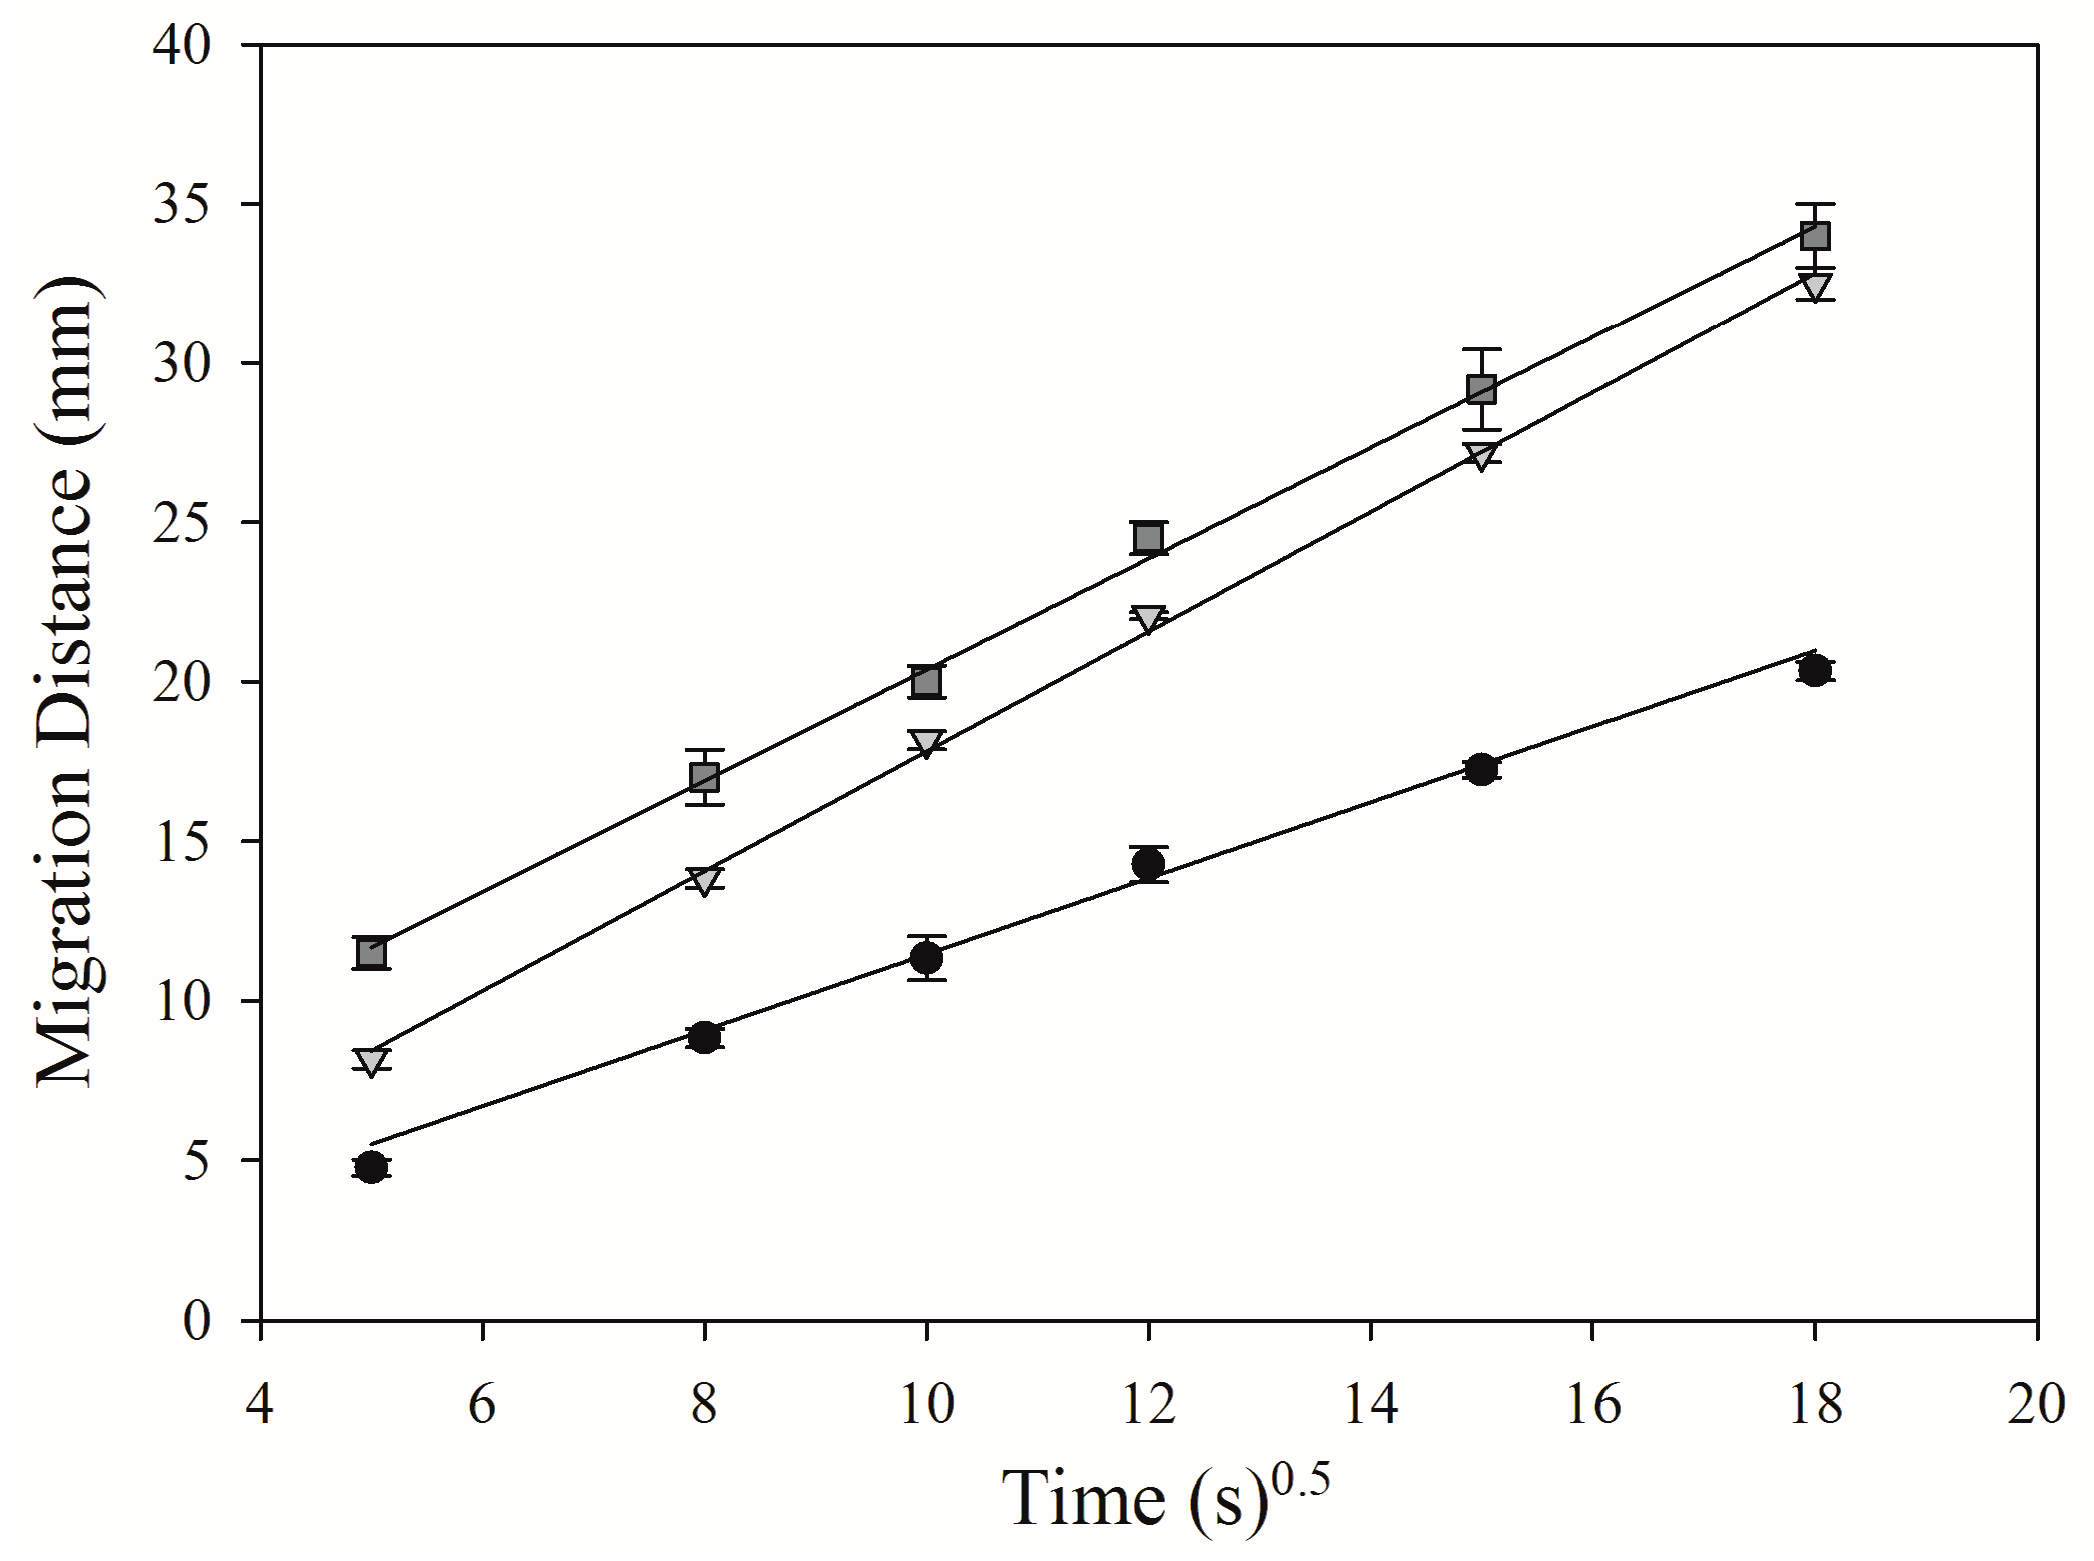


| Food Dye | Mean hRF (n = 5) | Precision (%RSD, n = 5) | Mean N (n = 5) | Linear Calibration | Adjacent Food Dyes | Mean RS | SD (n = 5) | |
|---|---|---|---|---|---|---|---|---|
| sdv (Peak Area) | sdv (Peak Height) | |||||||
| E 102 | 25 | 1 | 8345 | 6.0 | 9.3 | E 102/111 | 1.7 | 0.2 |
| E 111 | 33 | 4 | 8286 | * | * | E 111/133 | 6.5 | 0.2 |
| E 133 | 57 | 14 | 22,885 | 3.1 | 2.4 | E 133/127 | 4.6 | 0.6 |
| E 127 | 73 | 16 | 9596 | 4.5 | 5.7 | E 127/104 | 5.2 | 0.2 |
| E 104 | 90 | 1 | 9497 | 9.1 | 4.5 | - | - | - |
| Mean | (25–90) | 7 | 11,722 | 5.7 | 5.5 | Mean | 4.5 | 0.3 |
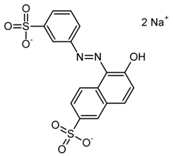
| Structure Formula * | Food Dye (E Number) | Molecular Weight (g/mol) | Mass Signal m/z on HPTLC Foils Silica Gel 60 | Mass Signal m/z on Electrospun PAN Nanofibers |
|---|---|---|---|---|
 | Chrysoine resorcinol (E 103) | 316.3 | n.d. | 293.0 [M−Na]− |
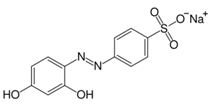
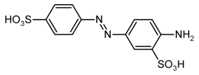 | Fast Yellow AB (E 105) | 357.4 | n.d. | 177.6 [M−2H]2− |
 | Orange GGN (E 111) | 452.4 | 203.0 [M−2Na]2− | 203.0 [M−2Na]2− |
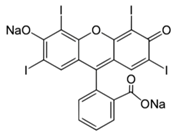 | Erythrosine (E 127) | 879.9 | 416.8 [M−2Na]2− | 416.8 [M−2Na]2− |
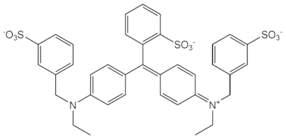 | Brilliant Blue FCF (E 133) | 792.9 | 373.0 [M−2Na]2− | 373.0 [M−2Na]2− |
© 2017 by the authors. Licensee MDPI, Basel, Switzerland. This article is an open access article distributed under the terms and conditions of the Creative Commons Attribution (CC BY) license (http://creativecommons.org/licenses/by/4.0/).
Share and Cite
Niamlang, P.; Supaphol, P.; Morlock, G.E. Performance of Electropun Polyacrylonitrile Nanofibrous Phases, Shown for the Separation of Water-Soluble Food Dyes via UTLC-Vis-ESI-MS. Nanomaterials 2017, 7, 218. https://doi.org/10.3390/nano7080218
Niamlang P, Supaphol P, Morlock GE. Performance of Electropun Polyacrylonitrile Nanofibrous Phases, Shown for the Separation of Water-Soluble Food Dyes via UTLC-Vis-ESI-MS. Nanomaterials. 2017; 7(8):218. https://doi.org/10.3390/nano7080218
Chicago/Turabian StyleNiamlang, Pimolpun, Pitt Supaphol, and Gertrud E. Morlock. 2017. "Performance of Electropun Polyacrylonitrile Nanofibrous Phases, Shown for the Separation of Water-Soluble Food Dyes via UTLC-Vis-ESI-MS" Nanomaterials 7, no. 8: 218. https://doi.org/10.3390/nano7080218
APA StyleNiamlang, P., Supaphol, P., & Morlock, G. E. (2017). Performance of Electropun Polyacrylonitrile Nanofibrous Phases, Shown for the Separation of Water-Soluble Food Dyes via UTLC-Vis-ESI-MS. Nanomaterials, 7(8), 218. https://doi.org/10.3390/nano7080218