Effect of the Composition of Lanthanide Complexes on Their Luminescence Enhancement by Ag@SiO2 Core-Shell Nanoparticles


College of Chemistry and Chemical Engineering, Inner Mongolia University, Huhhot 010021, China
*
Author to whom correspondence should be addressed.
Nanomaterials 2018, 8(2), 98; https://doi.org/10.3390/nano8020098
Submission received: 17 December 2017
/
Revised: 5 February 2018
/
Accepted: 5 February 2018
/
Published: 9 February 2018
(This article belongs to the Special Issue Nanosized Luminescent Materials: Advances and Applications)
Abstract
:Metal-enhanced luminescence of lanthanide complexes by noble metal nanoparticles has attracted much attention because of its high efficiency in improving the luminescent properties of lanthanide ions. Herein, nine kinds of europium and terbium complexes—RE(TPTZ)(ampca)3·3H2O, RE(TPTZ)(BA)3·3H2O, RE(phen)(ampca)3·3H2O, RE(phen)(PTA)1.5·3H2O (RE = Eu, Tb) and Eu(phen)(BA)3·3H2O (TPTZ = 2,4,6-tri(2-pyridyl)-s-triazine, ampca = 3-aminopyrazine-2-carboxylic acid, BA = benzoic acid, phen = 1,10-phenanthroline, PTA = phthalic acid)—have been synthesized. Meanwhile, seven kinds of core-shell Ag@SiO2 nanoparticles of two different core sizes (80–100 nm and 40–60 nm) and varied shell thicknesses (5, 12, 20, 30 and 40 nm) have been prepared. The combination of these nine types of lanthanide complexes and seven kinds of Ag@SiO2 nanoparticles provides an opportunity for a thorough investigation of the metal-enhanced luminescence effect. Luminescence spectra analysis showed that the luminescence enhancement factor not only depends on the size of the Ag@SiO2 nanoparticles, but also strongly relates to the composition of the lanthanide complexes. Terbium complexes typically possess higher enhancement factors than their corresponding europium complexes with the same ligands, which may result from better spectral overlap between the emission bands of Tb complexes and surface plasmon resonance (SPR) absorption bands of Ag@SiO2. For the complexes with the same lanthanide ion but varied ligands, the complexes with high enhancement factors are typically those with excitation wavelengths located nearby the SPR absorption bands of Ag@SiO2 nanoparticles. These findings suggest a combinatorial chemistry strategy is necessary to obtain an optimal metal-enhanced luminescence effect for lanthanide complexes.
1. Introduction
Luminescent lanthanide compounds have been widely used in various fields, such as fluorescence materials [1,2,3], electroluminescence devices [4,5], fluorescence probes and labels in biological systems [6,7,8,9], because they have the advantages of narrow emission bands, long fluorescence lifetimes and large Stokes shifts [10,11,12,13,14]. However, because of the parity rule, the f–f transition of lanthanide ions is forbidden, which leads to their weak luminescence intensities [1,2]. To enhance their luminescence intensities, one traditional strategy is to coordinate with various organic ligands. The ligands can sensitize the central lanthanide ions by ligand-to-metal energy transfer, the so-called “antenna effect” [15,16]. Typically, ternary lanthanide complexes utilizing both anion ligands and neutral organic ligands have shown superior luminescence properties. The aromatic anion ligands, such as benzoic acid (BA), terephthalic acid (PTA), and 3-aminopyrazine-2-carboxylic acid (ampca) can efficiently absorb light and transfer energy to the lanthanide ions [17,18]. Furthermore, the introduction of aromatic neutral ligands, including 1,10-phenanthroline (phen) and 2,4,6-tri(2-pyridyl)-s-triazine (TPTZ) can replace the solvent molecules coordinated with lanthanide ions to reduce the quenching effect [17,19].
In the past decade, another strategy based on metal-enhanced luminescence has been explored for the enhancement of luminescence properties of lanthanide complexes [20,21,22,23,24,25,26]. Metal-enhanced luminescence (MEL) is based on the localized surface plasmon resonance (SPR) effect of noble metal nanoparticles, especially gold or silver [27]. MEL occurs when fluorophores are positioned near-field from the metal nanoparticles. The actual mechanism of MEL is still debated at present [28]. The classical far-field fluorescence descriptions suggested a modification in the fluorophores’ intrinsic radiative decay rates [29]. In a new description, the excited fluorophores bring a mirror dipole in the nearby metal nanoparticle, which itself radiates the coupled quanta with high efficiency, leading to significantly enhanced luminescence [30]. The core-shell Ag@SiO2 nanoparticles have shown potential applications in many fields, such as optical biosensing, bioimaging, immunoassay, catalysts and antibacterial agents [20,23,25,31,32,33,34]. To achieve an optimized MEL effect on lanthanide complexes, many efforts have been paid to the size control of the nanoparticles and the distance adjustment between the particles and the lanthanide complexes [23]. For example, core-shell Ag@SiO2 nanoparticles with core size of tens of nanometer and shell thicknesses between 20 to 50 nm are frequently found to be efficacious for the luminescence enhancement of Eu and Tb complexes [31,35,36,37]. The SiO2 shell is important for avoiding the lanthanide complexes from having direct contact with the metal particles, which may lead to luminescence quench. Moreover, we have reported recently that the luminescence intensities of lanthanide complexes can also be tuned by controlling the ratios of the complexes and nanoparticles [18].
Furthermore, the luminescent properties of the lanthanide complexes depend strongly on their compositions, i.e., both the kind of lanthanide ions and the coordinated ligands. Herein, we synthesize nine kinds of Eu and Tb ternary complexes with both anion and neutral ligands, and prepare seven types of core-shell Ag@SiO2 nanoparticles of distinct size. By systematically comparing the luminescence enhancement effect of these complexes by these nanoparticles (9 × 7 = 63 combinations), the enhancement factors are found to not only rely on the size of the Ag@SiO2 nanoparticles, but also relate to the complex composition. The mechanism investigation indicates that the excitation enhancement and emission enhancement may lead to distinct enhancement factors for complexes with different lanthanide ions and organic ligands.
2. Experimental Section
2.1. Materials and Characterizations
The purities of terbium oxide and europium oxide were 99.99%. Silver nitrate (AgNO3), sodium citrate, tetraethyl orthosilicate (TEOS), ammonia (NH3·H2O), BA, PTA, phen, ampca, TPTZ, N,N-dimethylformamide (DMF) and other reagents were all of analytic grade and used as received.
Infrared spectra of the lathanide complexes and the ligands were recorded on a Nexus 670 FT-IR spectrophotometer (Nicolet, Madison, WI, USA) using KBr pellets. Molar conductivities were measured on a DDSJ-308A conductivity meter (Biocoteck, Ningbo, China) at room temperature using DMF as a solvent. Elemental analyses of C, H and N were performed by a Vario EL Cube elemental analysis instrument (Elementar, Hanau, Germany). Transmission electron microscopy (TEM, Tecnai F20, 200 kV, FEI, Hillsboro, OR, USA) was used to investigate the size and morphology of Ag@SiO2 nanoparticles. The UV-vis absorption spectra of the lathanide complexes and the core-shell Ag@SiO2 nanoparticles were recorded on a TU-1901 spectrophotometer (Beijing Purkinje, Beijing, China). The luminescence spectra of the lathanide complexes and the complex-doped Ag@SiO2 nanocomposites were recorded on the FLS-920 fluorescent spectrometer (Edinburgh Instruments, Livingston, UK) at room temperature.
2.2. The Preparation of Core-Shell Ag@SiO2 Nanoparticles
Two kinds of Ag nanoparticles, with particle sizes of 80–100 nm and 40–60 nm, respectively, were prepared by reducing AgNO3 with sodium citrate in water, as described in previous works [36,37]. The Ag nanoparticles were collected by centrifugation and finally, dispersed in ethanol.
The methods for preparing Ag@SiO2 nanoparticles with different shell thicknesses were explored by controlling the amount of TEOS added. The typical process is as follows: 10 mL 40–60 nm Ag nanoparticle solution was added to a three round-bottom flask (250 mL), 30 mL ethanol and 0.2 mL sodium citrate solution was added under stirring at room temperature. After the pH value of the solution was adjusted to 9 with ammonia, 5, 10 or 15 mL of TEOS were added dropwise under vigorous stirring. The reaction lasted for 24 h. The core-shell Ag@SiO2 nanoparticles with shell thickness of 12, 30 or 40 nm were obtained by centrifugation. The other series of core-shell Ag@SiO2 nanoparticles with core sizes of 80–100 nm and shell thicknesses of 5, 12, 20 and 30 nm were prepared by varying the amounts of TEOS added, by 5, 7, 10 and 15 mL, respectively.
2.3. Synthesis of Lanthanide Complexes
The solution of EuCl3 was prepared by the reaction of Eu2O3 with HCl solution. The solution was heated to remove extra HCl, after which ethanol was added to dissolve the europium chloride. Preparation of TbCl3 ethanol solution is similar to that of EuCl3, except H2O2 was added.
Typically, anionic ligands (3.0 mmol BA or ampca, or 1.5 mmol PTA), neutral ligands (1 mmol Phen or TPTZ) and 10 ml of anhydrous ethanol were added in the round bottom flask, and then the mixture was heated in a 60 °C water bath to obtain a clear solution. One mmol EuCl3 or TbCl3 was added into the above solution under stirring. The pH value of the solution was adjusted to about 6.4 with ammonia. After being heated for 3 h, the mixture was cooled to room temperature and left still overnight. Then the precipitates were filtered, washed with ethanol for several times and dried, to obtain the nine kinds of lanthanide complexes.
2.4. The Preparation of Complexes Doped Core-Shell Ag@SiO2 Nanocomposites
Two mL of the lanthanide complex in ethanol (1.0 × 10⁻⁴ mol·L−1) was put in a quartz cell and the luminescence spectrum was measured. Then, a small amount of Ag@SiO2 sol was added gradually until the strongest luminescence intensity was achieved. The total additional amount of Ag@SiO2 solution was 200 mL for each lanthanide complex.
3. Results and Discussions
3.1. Characterizations of the Core-Shell Ag@SiO2 Nanoparticles
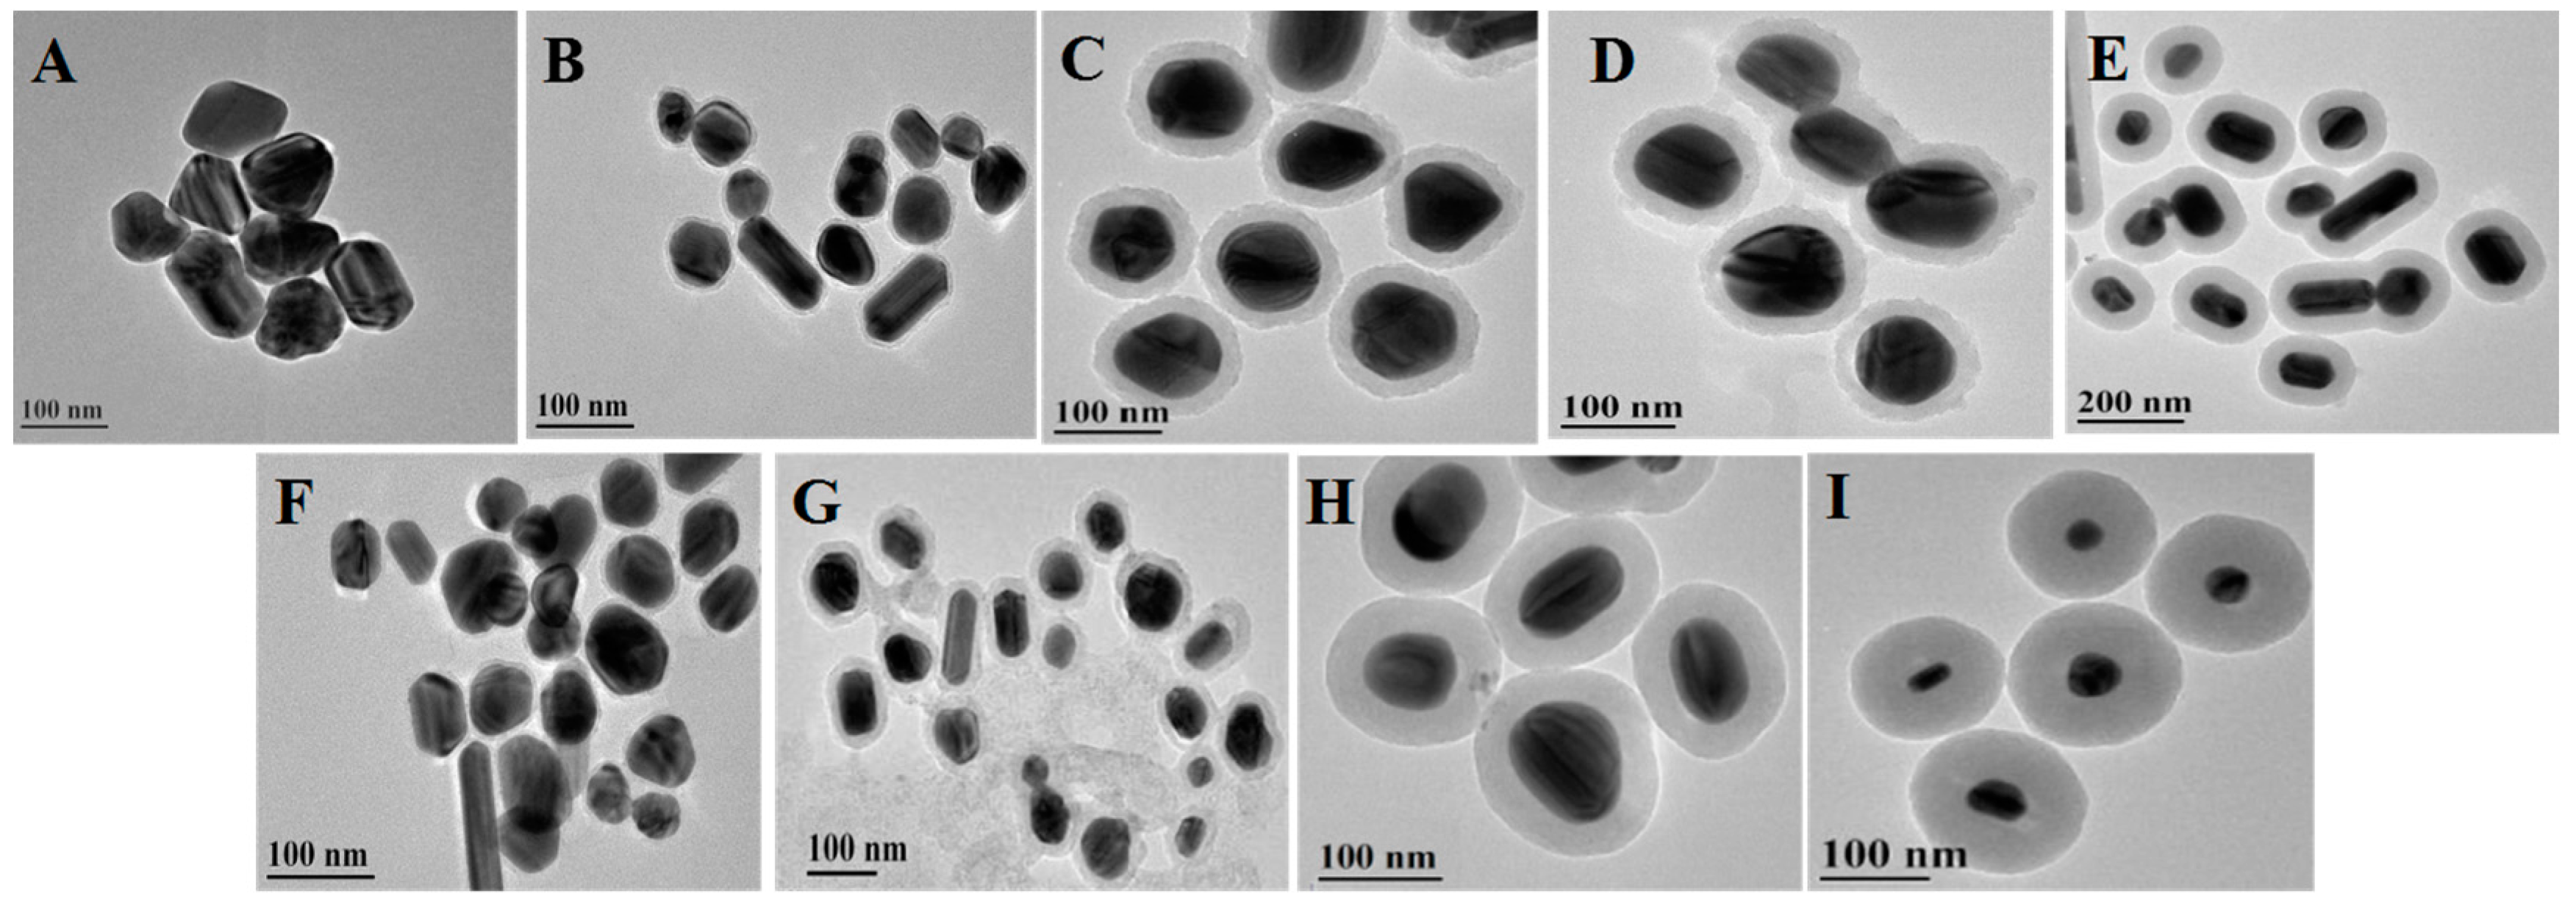
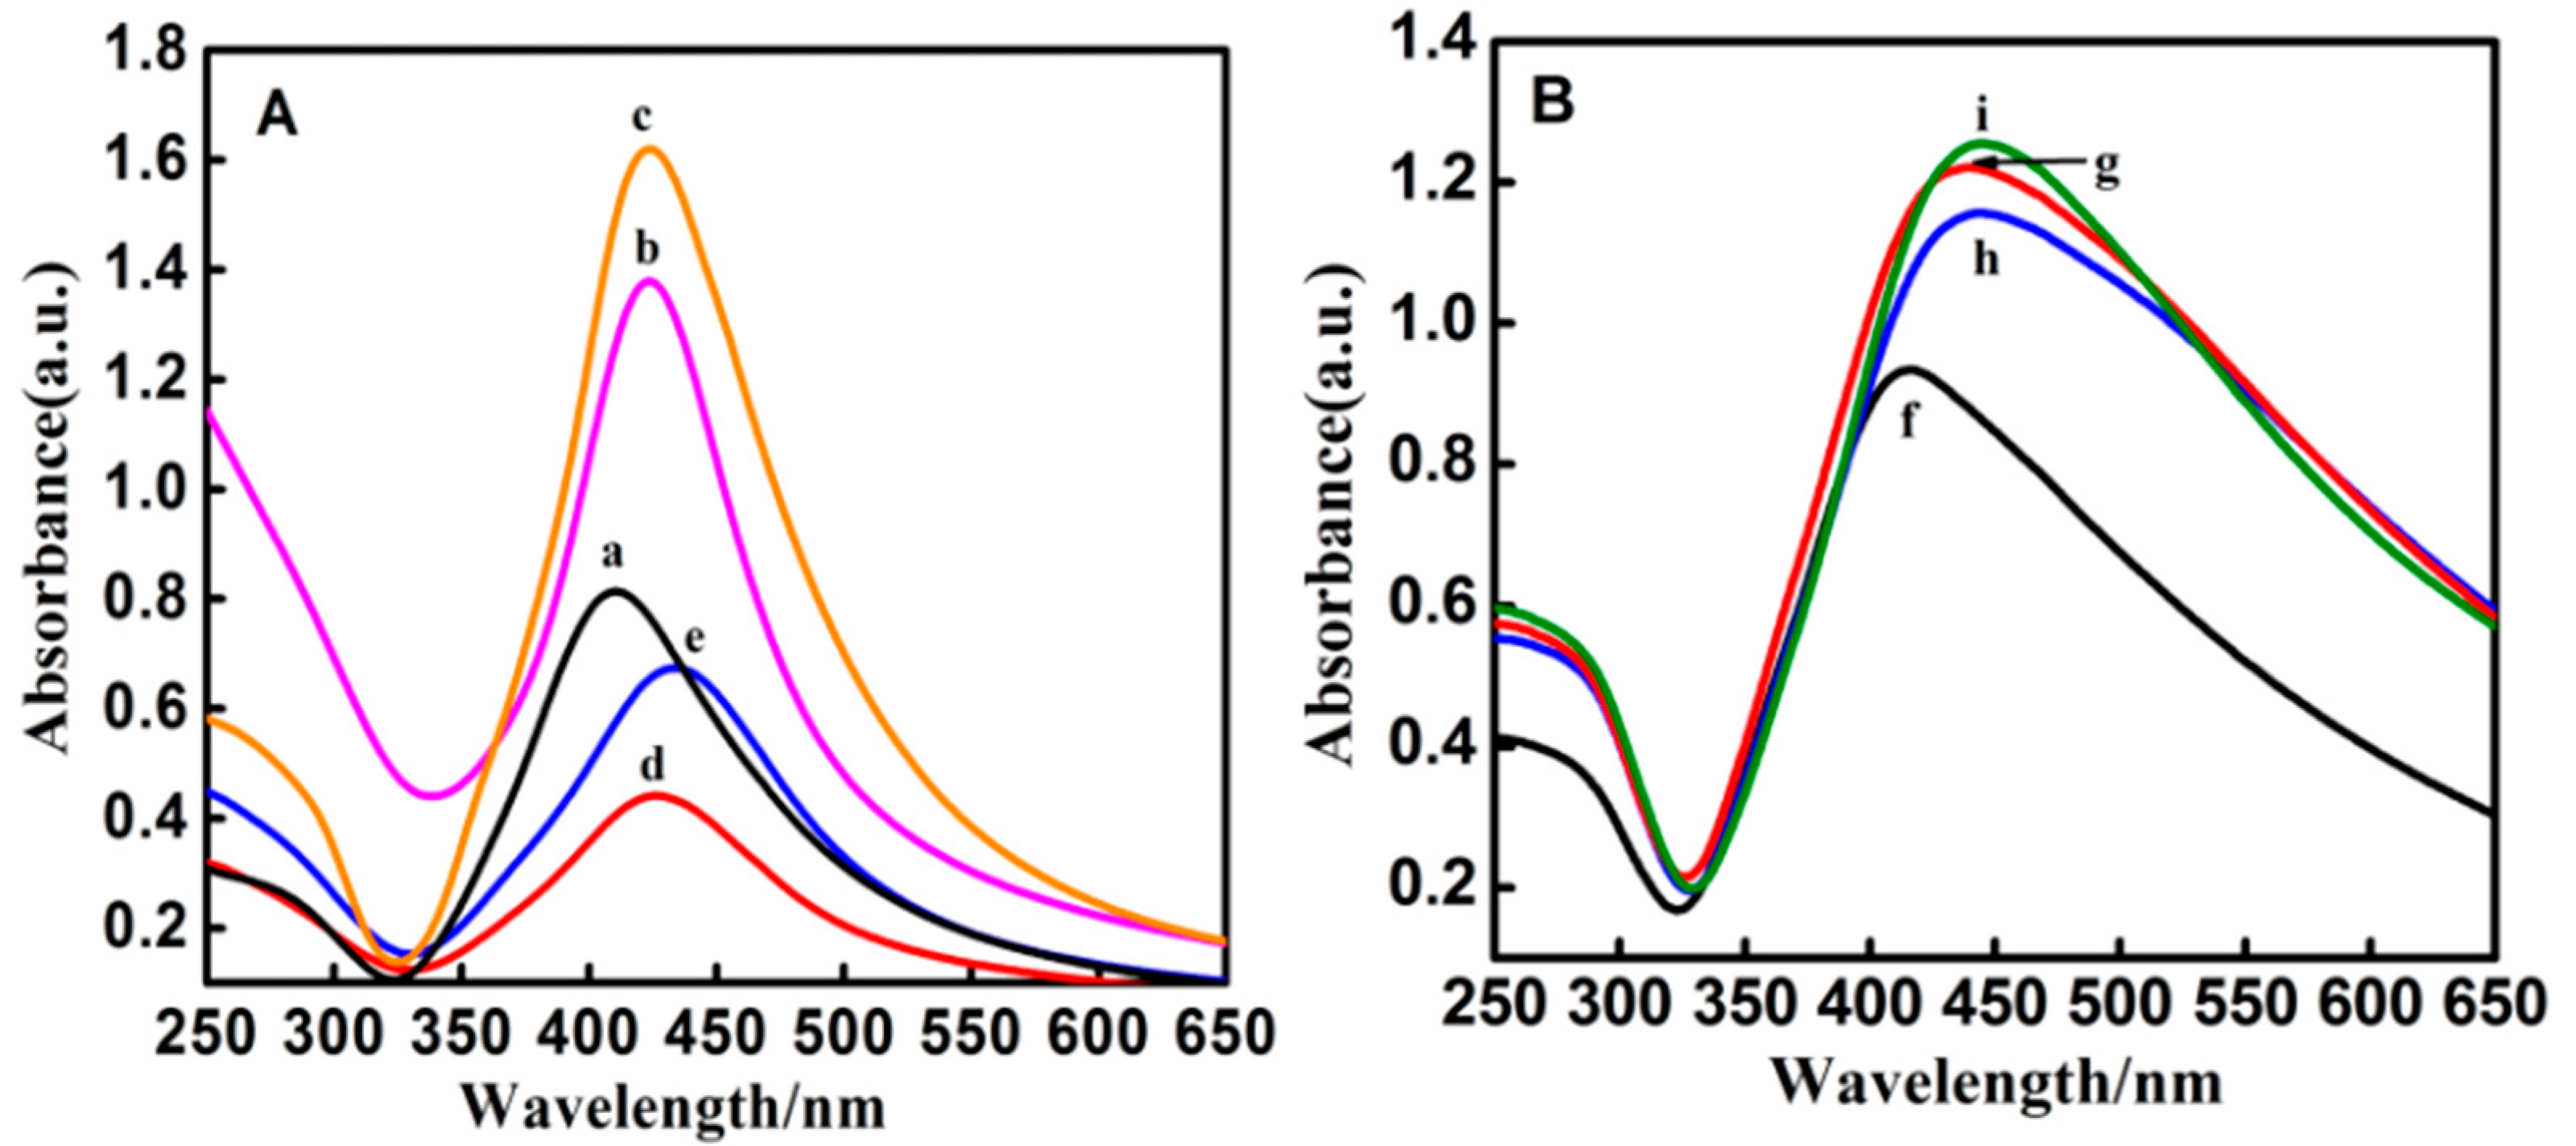
Figure 1 shows typical TEM images of two kinds of silver nanoparticles (A and F) and seven kinds of core-shell Ag@SiO2 nanoparticles (B–E and G–I) with different shell thickness. The shell thickness was controlled carefully by the concentration of TEOS. The diameters of silver cores in Figure 1A–E are all about 80–100 nm, while the silica shell thicknesses of the Ag@SiO2 nanoparticles in Figure 1B–E are 5, 12, 20 and 30 nm, respectively. The diameters of the silver cores in Figure 1F–I are about 40–60 nm and the silica shell thicknesses of the Ag@SiO2 nanoparticles in Figure 1G–I are 12, 30 and 40 nm, respectively. The particle size and the surrounding medium will affect the surface plasmon resonance absorption of Ag@SiO2 nanoparticles in the visible wavelength region [38,39]. As shown in Figure 2, the UV-vis absorption bands of silver nanoparticles red-shift when they are coated with silica, which is consistent with Mie’s theory [24,40,41]. The absorption peak locates at 407 nm for the silver particles of 80–100 nm. After coating with silica of different thicknesses, the absorption peaks of Ag@SiO2 nanoparticles red-shift to 422, 423, 425 and 433 nm for the thicknesses of 5, 12, 20 and 30 nm, respectively. The 40–60 nm silver nanoparticles exhibit an absorption peak around 412 nm, which red-shifts to 426, 434 and 438 nm after coating a silica shell of 12, 30 and 40 nm, respectively.
3.2. Characterizations of Lanthanide Complexes
The data from the elemental analyses (C, H, N) and molar conductivities of the complexes are listed in Table 1. The results indicate that the compositions of the nine complexes are RE(phen)(ampca)3·3H2O, RE(TPTZ)(BA)3·3H2O, RE(TPTZ)(ampca)3·3H2O, RE(phen)(PTA)1.5·3H2O (RE = Tb and Eu) and Eu(phen)(BA)3·3H2O, respectively. The molar conductivity values of these complexes are in the range of 11.2–18.3 S·cm2·mol−1, which indicates that the lanthanide complexes are non-electrolytes [42,43].
The UV-vis absorption spectra of the complexes and the ligands were determined using the mixture of DMF and ethanol (v/v = 1/25) as a solvent and reference. Because the UV-vis absorption peak positions of terbium complexes and europium complexes are similar, so only the UV-vis absorption data of the europium complexes and ligands are listed in Table S1. As shown in Figure S1, the ligands TPTZ and BA exhibit strong absorption bands around 282 and 226 nm, respectively. However, the BA absorption band disappeared in the complex Eu(TPTZ)(BA)3·3H2O, and a new band around 246 nm occurred. Meanwhile, the TPTZ absorption peak moved to 283 nm. These shifts suggested the formation of the complexes. Moreover, the absorption peaks of the ligands—ampca, phen and PTA—appeared at 350, 263 and 230 nm, but in the complexes Eu(TPTZ)(ampca)3·3H2O, Eu(phen)(ampca)3·3H2O, Eu(phen)(BA)3·3H2O and Eu(phen) (PTA)1.5·3H2O, the absorption peaks appeared at 364, 356, 289 and 264 nm respectively. These changes also indicate that the ligands have coordinated with Eu3+.
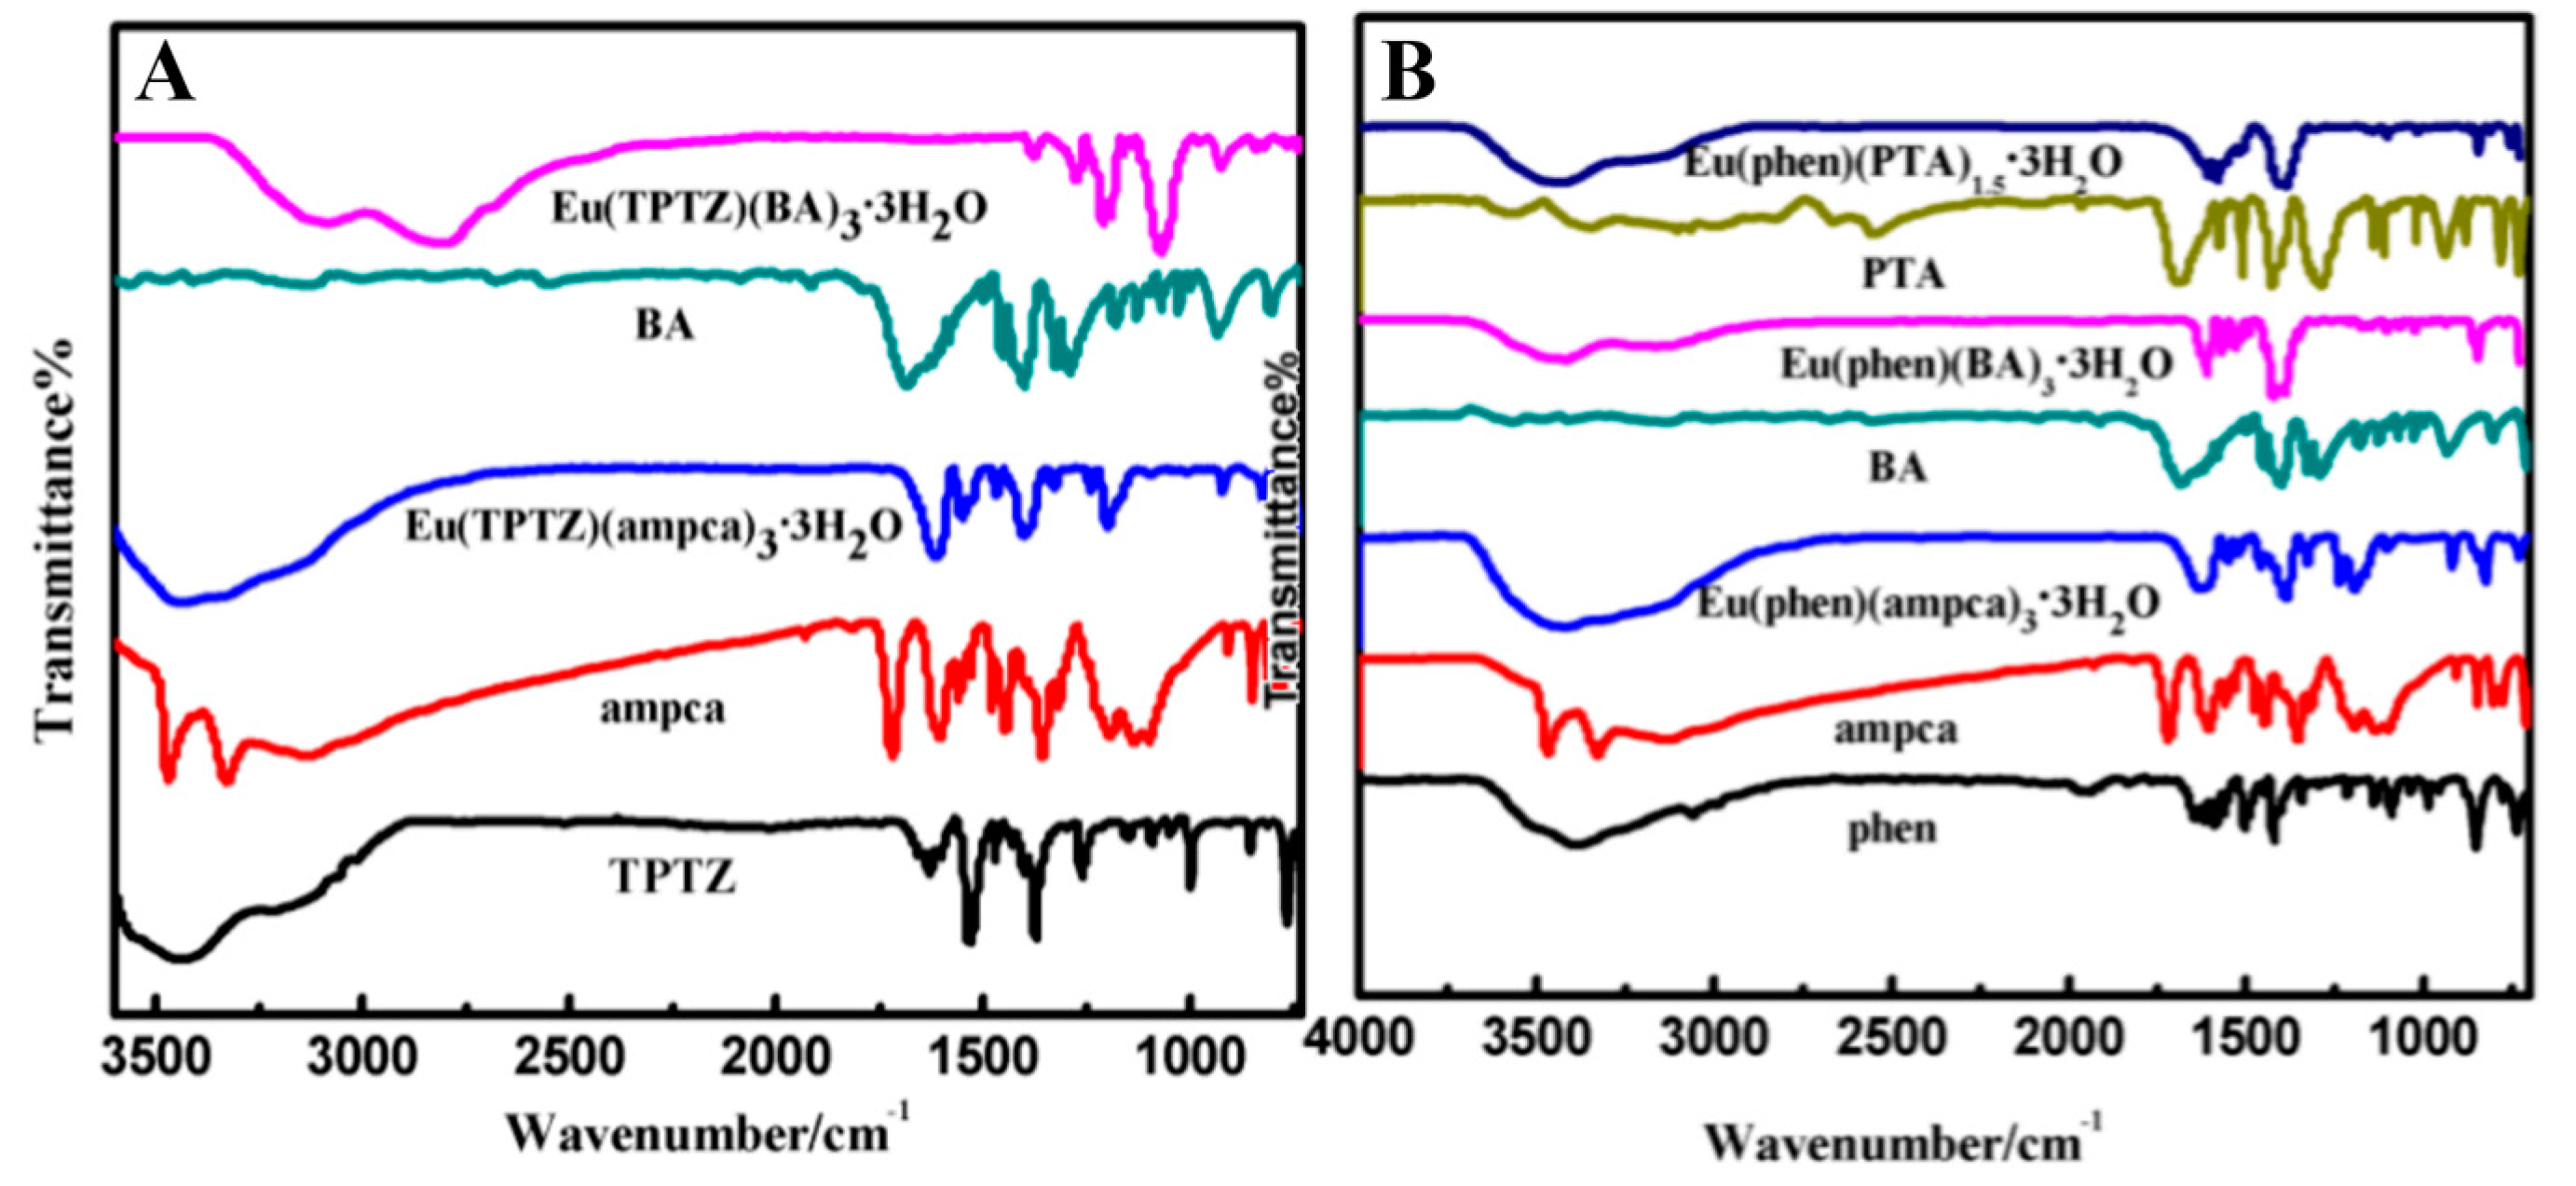
Since the Infrared spectra of the terbium complexes and the europium complexes are similar, only the IR spectra of the ligands and the europium complexes are given in Figure 3. Comparing the spectra of ligands with those of the complexes, it can be seen that the characteristic absorption peaks of the ligands have shifted in the complexes, which indicates the europium ions may have coordinated with the ligands. For example, the spectrum of TPTZ shows the absorption bands around 1374 and 1000 cm−1, which could be ascribed to the central ring breathing vibration and pyridine ring bending vibration [44]. These two bands move to around 1400 and 1007 cm−1 in the complexes Eu(TPTZ)(ampca)3·3H2O and Eu(TPTZ)(BA)3·3H2O, which suggests that the central ring and pyridine ring of TPTZ have been involved in the coordination of the europium complexes. For the ligand ampca, the vibration band of carbonyl group at 1720 cm−1 disappears in the complexes, Eu(TPTZ)(ampca)3·3H2O and Eu(phen)(ampca)3·3H2O, and two new bands appear at 1605 cm−1 and 1355 cm−1, which can be assigned to the asymmetric and symmetric stretching vibration of carboxyl [45,46]. These changes indicate that the carboxyl of ampca has coordinated with Eu3+ ions in the complexes. The stretching vibration band of carbonyl group in BA at 1686 cm−1 disappears in the complexes, Eu(phen)(BA)3·3H2O and Eu(TPTZ)(BA)3·3H2O, but at 1544 and 1491 cm−1 the anti-symmetric and symmetric stretching vibration peaks of carboxyl emerge. These changes also suggest that the ligand BA has coordinated with Eu3+ ions in the complexes. The spectra changes of the ligand phen are similar in the complexes, Eu(phen)(ampca)3·3H2O, Eu(phen)(BA)3·3H2O and Eu(phen)(PTA)1.5·3H2O. The C=N stretching vibration absorption band of phen moves from 1586 to 1551 cm−1 in the complexes, which indicates that coordinate bonds have formed between the europium ions and phen [47]. For the complex Eu(phen)(PTA)1.5·3H2O, the stretching vibration peak of the carbonyl group in PTA at 1689 cm−1 disappears after coordinated with the europium ions and new bands at 1610 cm−1 and 1518 cm−1 appeared in the complex, which can be ascribed to the anti-symmetric and symmetric stretching vibration of carboxyl group, indicating that the europium ions have coordinated with PTA [48].
3.3. Luminescence Enhancement of the Lanthanide Complexes by Ag@SiO2 Nanoparticles
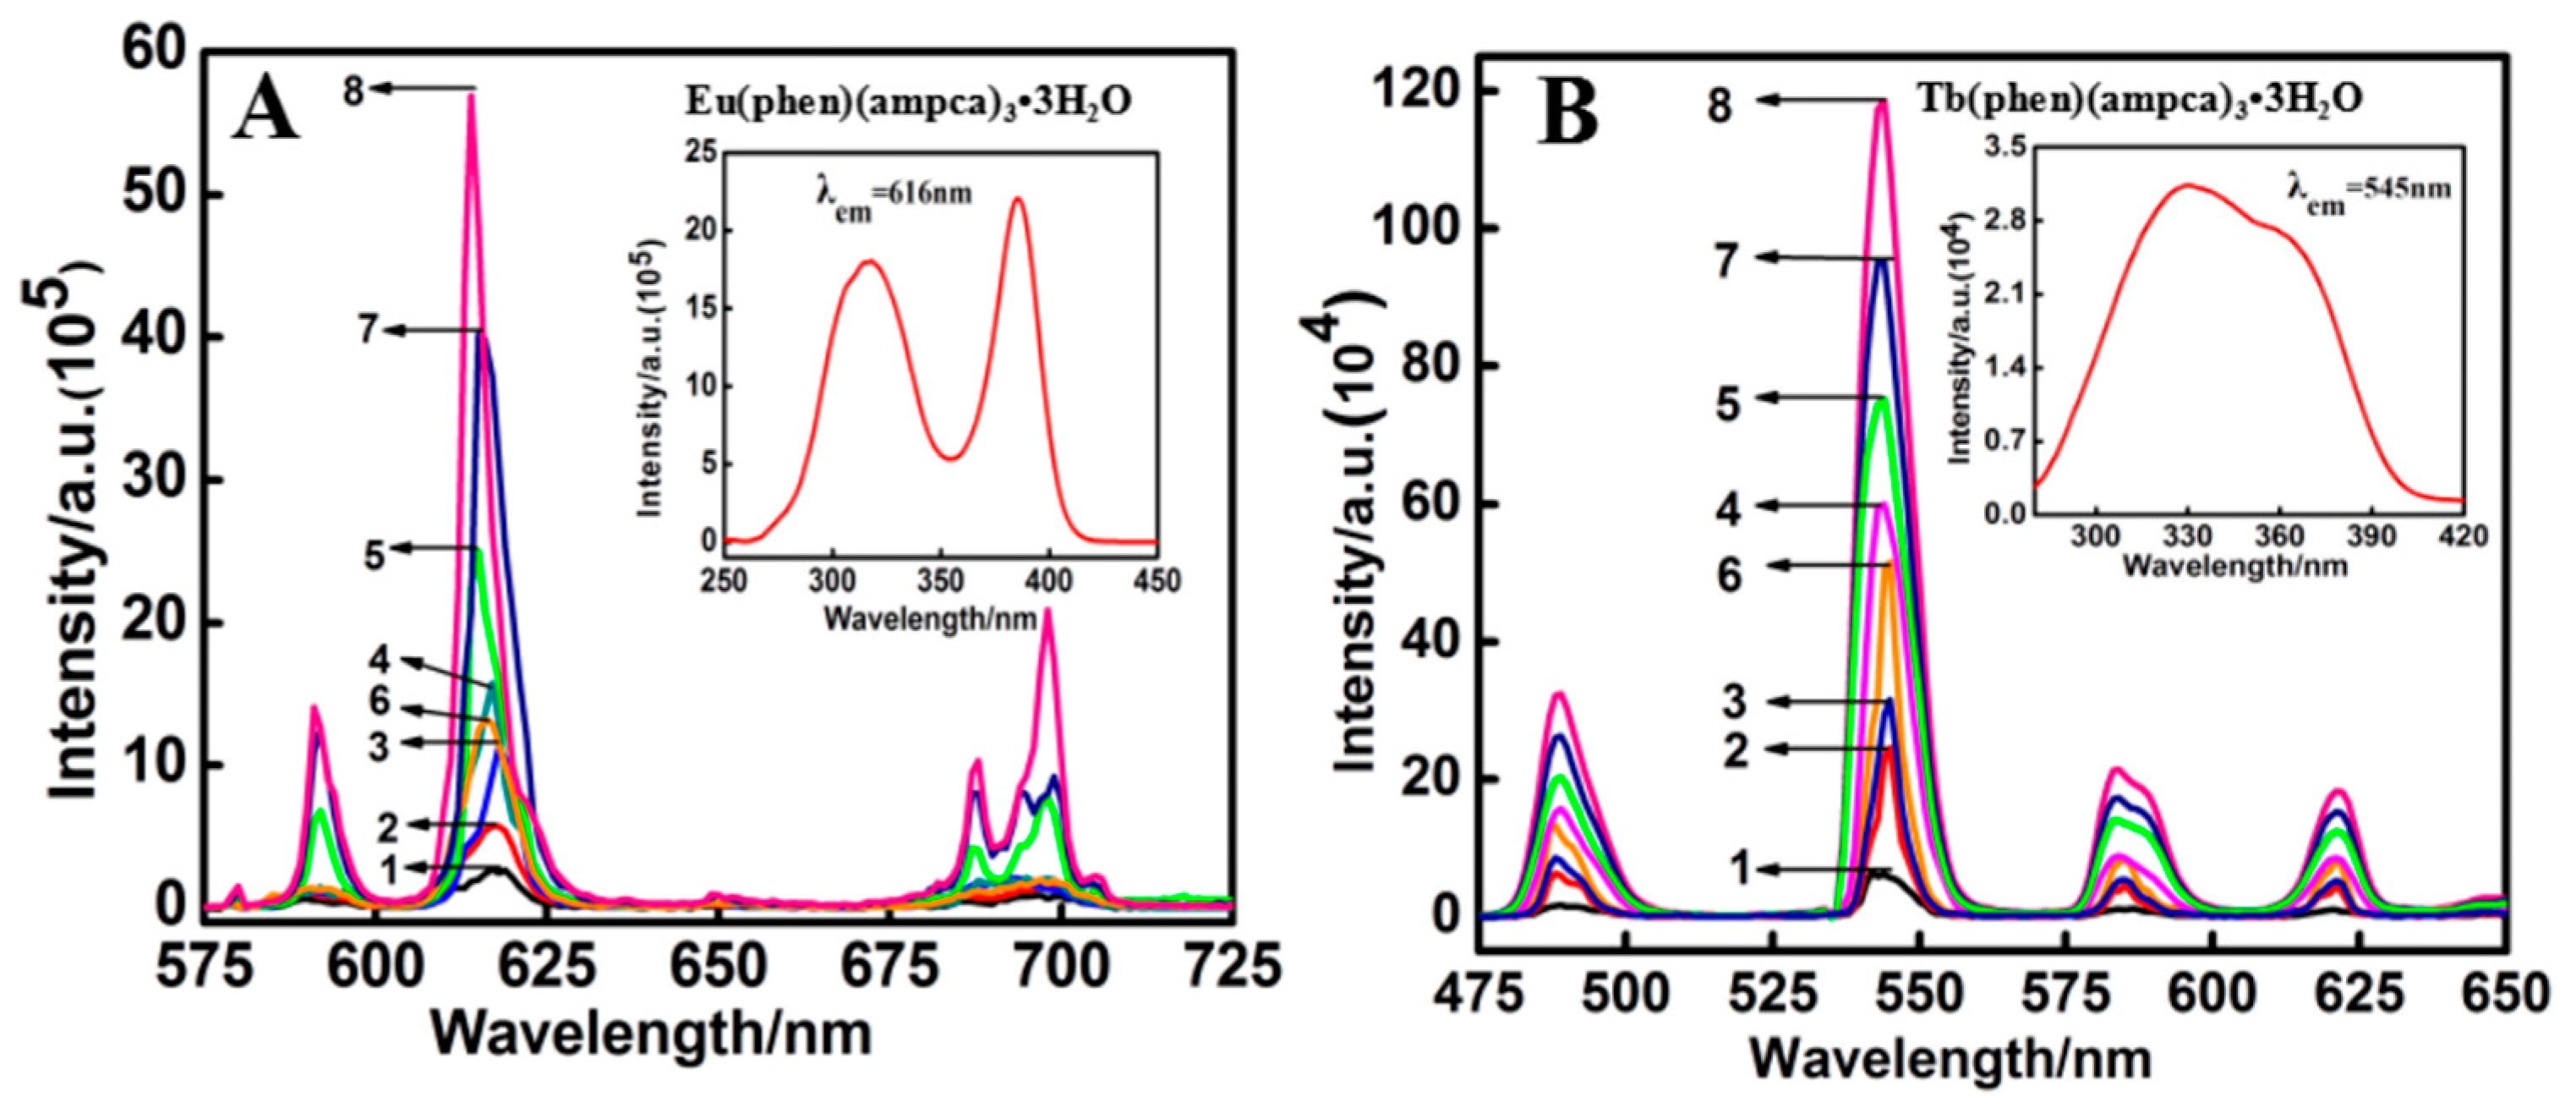
The luminescence spectra of the europium and terbium complexes before and after adding core-shell Ag@SiO2 nanoparticles were obtained in ethanol solution. Both of the excitation and emission slit widths were 3 nm for all measurements. The excitation spectra were obtained by monitoring the emission wavelengths at 617 and 543 nm, for europium and terbium complexes, respectively. Then the emission spectra were determined at the most efficacious excitation wavelengths for each complex. As shown in Figure 4A and Figure S2, the five europium complexes all exhibit a typical Eu3+ emission pattern with a maximum emission peak around 617 nm (5D0→7F2) and several other peaks around 580, 590, 650 and 697 nm, respectively. Figure 4B and Figure S3 show that the four terbium complexes all possess a typical Tb3+ emission pattern with a maximum emission peak around 543 nm (5D4→7F5) and several other peaks around 489, 585 and 621 nm, respectively. All the peak positions do not shift obviously after adding Ag@SiO2 nanoparticles. Table 2 lists the luminescence emission intensities of the europium (5D0→7F2 transitions) and terbium complexes (5D4→7F4 transitions), both before and after the introduction of Ag@SiO2 nanoparticles of varied size. In the following discussion, Sample 1 stands for the pure rare earth complex, Samples 2–5 mean the nanocomposites after adding Ag@SiO2 nanoparticles with core sizes of 80–100 nm and shell thicknesses of 5, 12, 20, 30 nm, respectively, and Samples 6–8 denote the nanocomposites containing Ag@SiO2 nanoparticles with core sizes of 40–60 nm and shell thicknesses of 12, 30 and 40 nm, respectively. It can be seen that the emission intensities of the europium complexes (1.7–2.9 × 10⁵ a.u.) are typically stronger than those of the terbium complexes (0.60–0.64 × 10⁵ a.u.). The sensitization effect of the lanthanide ions by organic ligands is related to energy gap between the triplet energy level of ligands and lowest excited states energy of the lanthanide ions. It is believed that the intramolecular ligand-to-metal energy transfer is effective if the energy gap is about 2000–5000 cm−1 [49]. The triplet energy levels of the ligands, BA (23,800 cm−1), PTA (21560 cm−1) and ampca, are high enough for effective ligand-to-metal transfer processes in the complexes. Besides, the triplet energy levels of phen (20,850 cm−1) and TPTZ (21,277 cm−1) are higher than the 5D0 level (17,250 cm−1) of Eu3+ [50]. The energy gaps of the triplet energy levels of phen and TPTZ, with the lowest excited energy of the Eu3+ ion, are about 3600 and 4300 cm−1 respectively. Therefore, the anion and neutral ligands can transfer their absorbed light energy to Eu3+ ions effectively, and the europium complexes exhibit superior luminescence properties. For the terbium complexes, because the 5D4 level of Tb3+ is around 20,430 cm−1, the anionic ligands (BA, PTA and ampca) can still transfer the absorbed energy to Tb3+. However, the triplet energy levels of TPTZ and phen are almost resonant with 5D4 of Tb3+ [51,52]. Thus, back transfer would reduce the luminescence intensities of terbium complexes.
As shown in Figure 4 and Figures S2 and S3, the luminescence emission intensities of the lanthanide complexes are obviously enhanced after adding the Ag@SiO2 nanoparticles. It can be seen from Figure S4 that the four transitions of the terbium complexes (5D4→7F6, 5D4→7F5, 5D4→7F4 and 5D4→7F3) obtain similar enhancement factors with the same kind of Ag@SiO2. While the five transitions (5D0→7F0, 5D0→7F1, 5D0→7F2, 5D0→7F3 and 5D0→7F4) of the europium complexes possess quite different enhancement factors with the same kind of Ag@SiO2 (Figure S5), and the enhancement factor of 5D0→7F2 is the largest among them. The difference in enhancement factors has also been checked by superimposing the emission spectra in a normalized way (Figure S6). The difference cannot be well explained at present. We only discuss the enhancement factors of the strongest emission peaks, as follows. For example, the luminescence enhancement factors of the complex Eu(phen)(ampca)3·3H2O at 5D0→7F2 transition reached 2.14, 4.23, 5.91, 9.32, 4.96, 14.96 and 21.40 times, with the seven kinds of Ag@SiO2 nanoparticles (Table 2, Samples 2–8), respectively. The highest enhancement factor was reached by Ag@SiO2 nanoparticles (Sample 8) with core diameters of 40–60 nm and a shell thickness of 40 nm. For the other four europium complexes—Eu(phen)(BA)3·3H2O, Eu(phen)(PTA)1.5·3H2O, Eu(TPTZ)(BA)3·3H2O and Eu(TPTZ)(amcpa)3·3H2O—the maximum enhancement factor was also reached by the same Ag@SiO2 nanoparticles. Their enhancement factors at 5D0→7F2 transitions are 14.7, 15.99, 12.47 and 16.91 (Figure S2 and Table 2), respectively. The enhancement factor strongly depends on the shell thickness and core diameter. For the Ag@SiO2 nanoparticles with core diameters of 80–100 nm, the enhancement factors for the same complex increase with the order of samples: 2, 3, 4, 5 (shell thickness of 5, 12, 20, 30 nm). In addition, for the Ag@SiO2 nanoparticles with core diameters of 40–60 nm, the enhancement factors for the same complex increase with the order of samples: 6, 7, 8 (shell thickness of 12, 30, 40 nm). When the SiO2 shell is too thin, the distance between the europium complexes and silver core is so close that it may lead to non-radiative energy transfer from the europium complexes to the silver core. Thus, the emission intensities of the complex-doped Ag@SiO2 nanocomposites with thinner silica shells are weaker than those of nanocomposites with thicker silica shells, in the range of 5–40 nm [35,36]. The core diameter of the nanoparticle also plays key roles in the enhancement effect. For example, Samples 3 and 6 have Ag@SiO2 nanoparticles with the same shell thickness of 12 nm, but with different core sizes (80–100 nm and 40–60 nm). The enhancement factors of Sample 6 are much higher than those of Sample 3 for all the nine lanthanide complexes (Table 2). The same trend can be found in Samples 5 and 7 with the same shell thickness of 30 nm, which is also similar to our previous report [18].
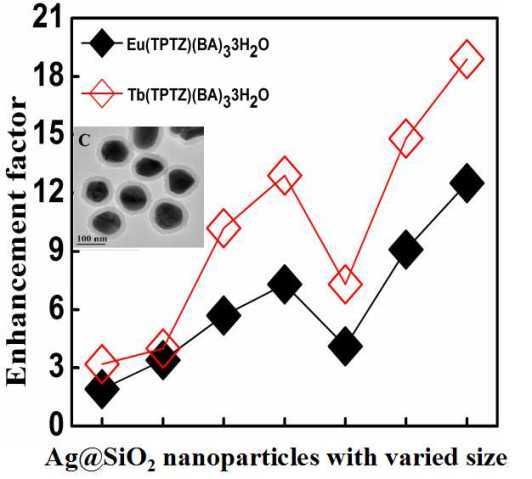
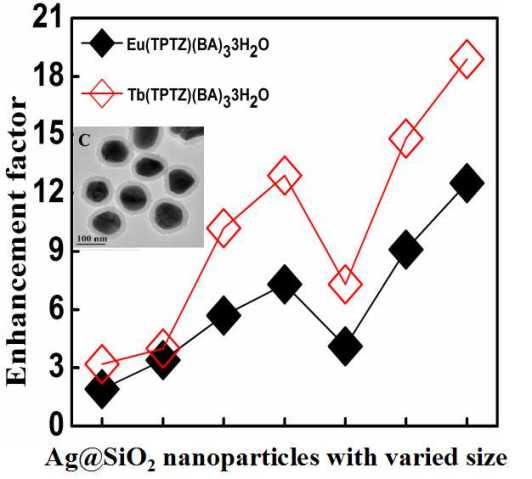
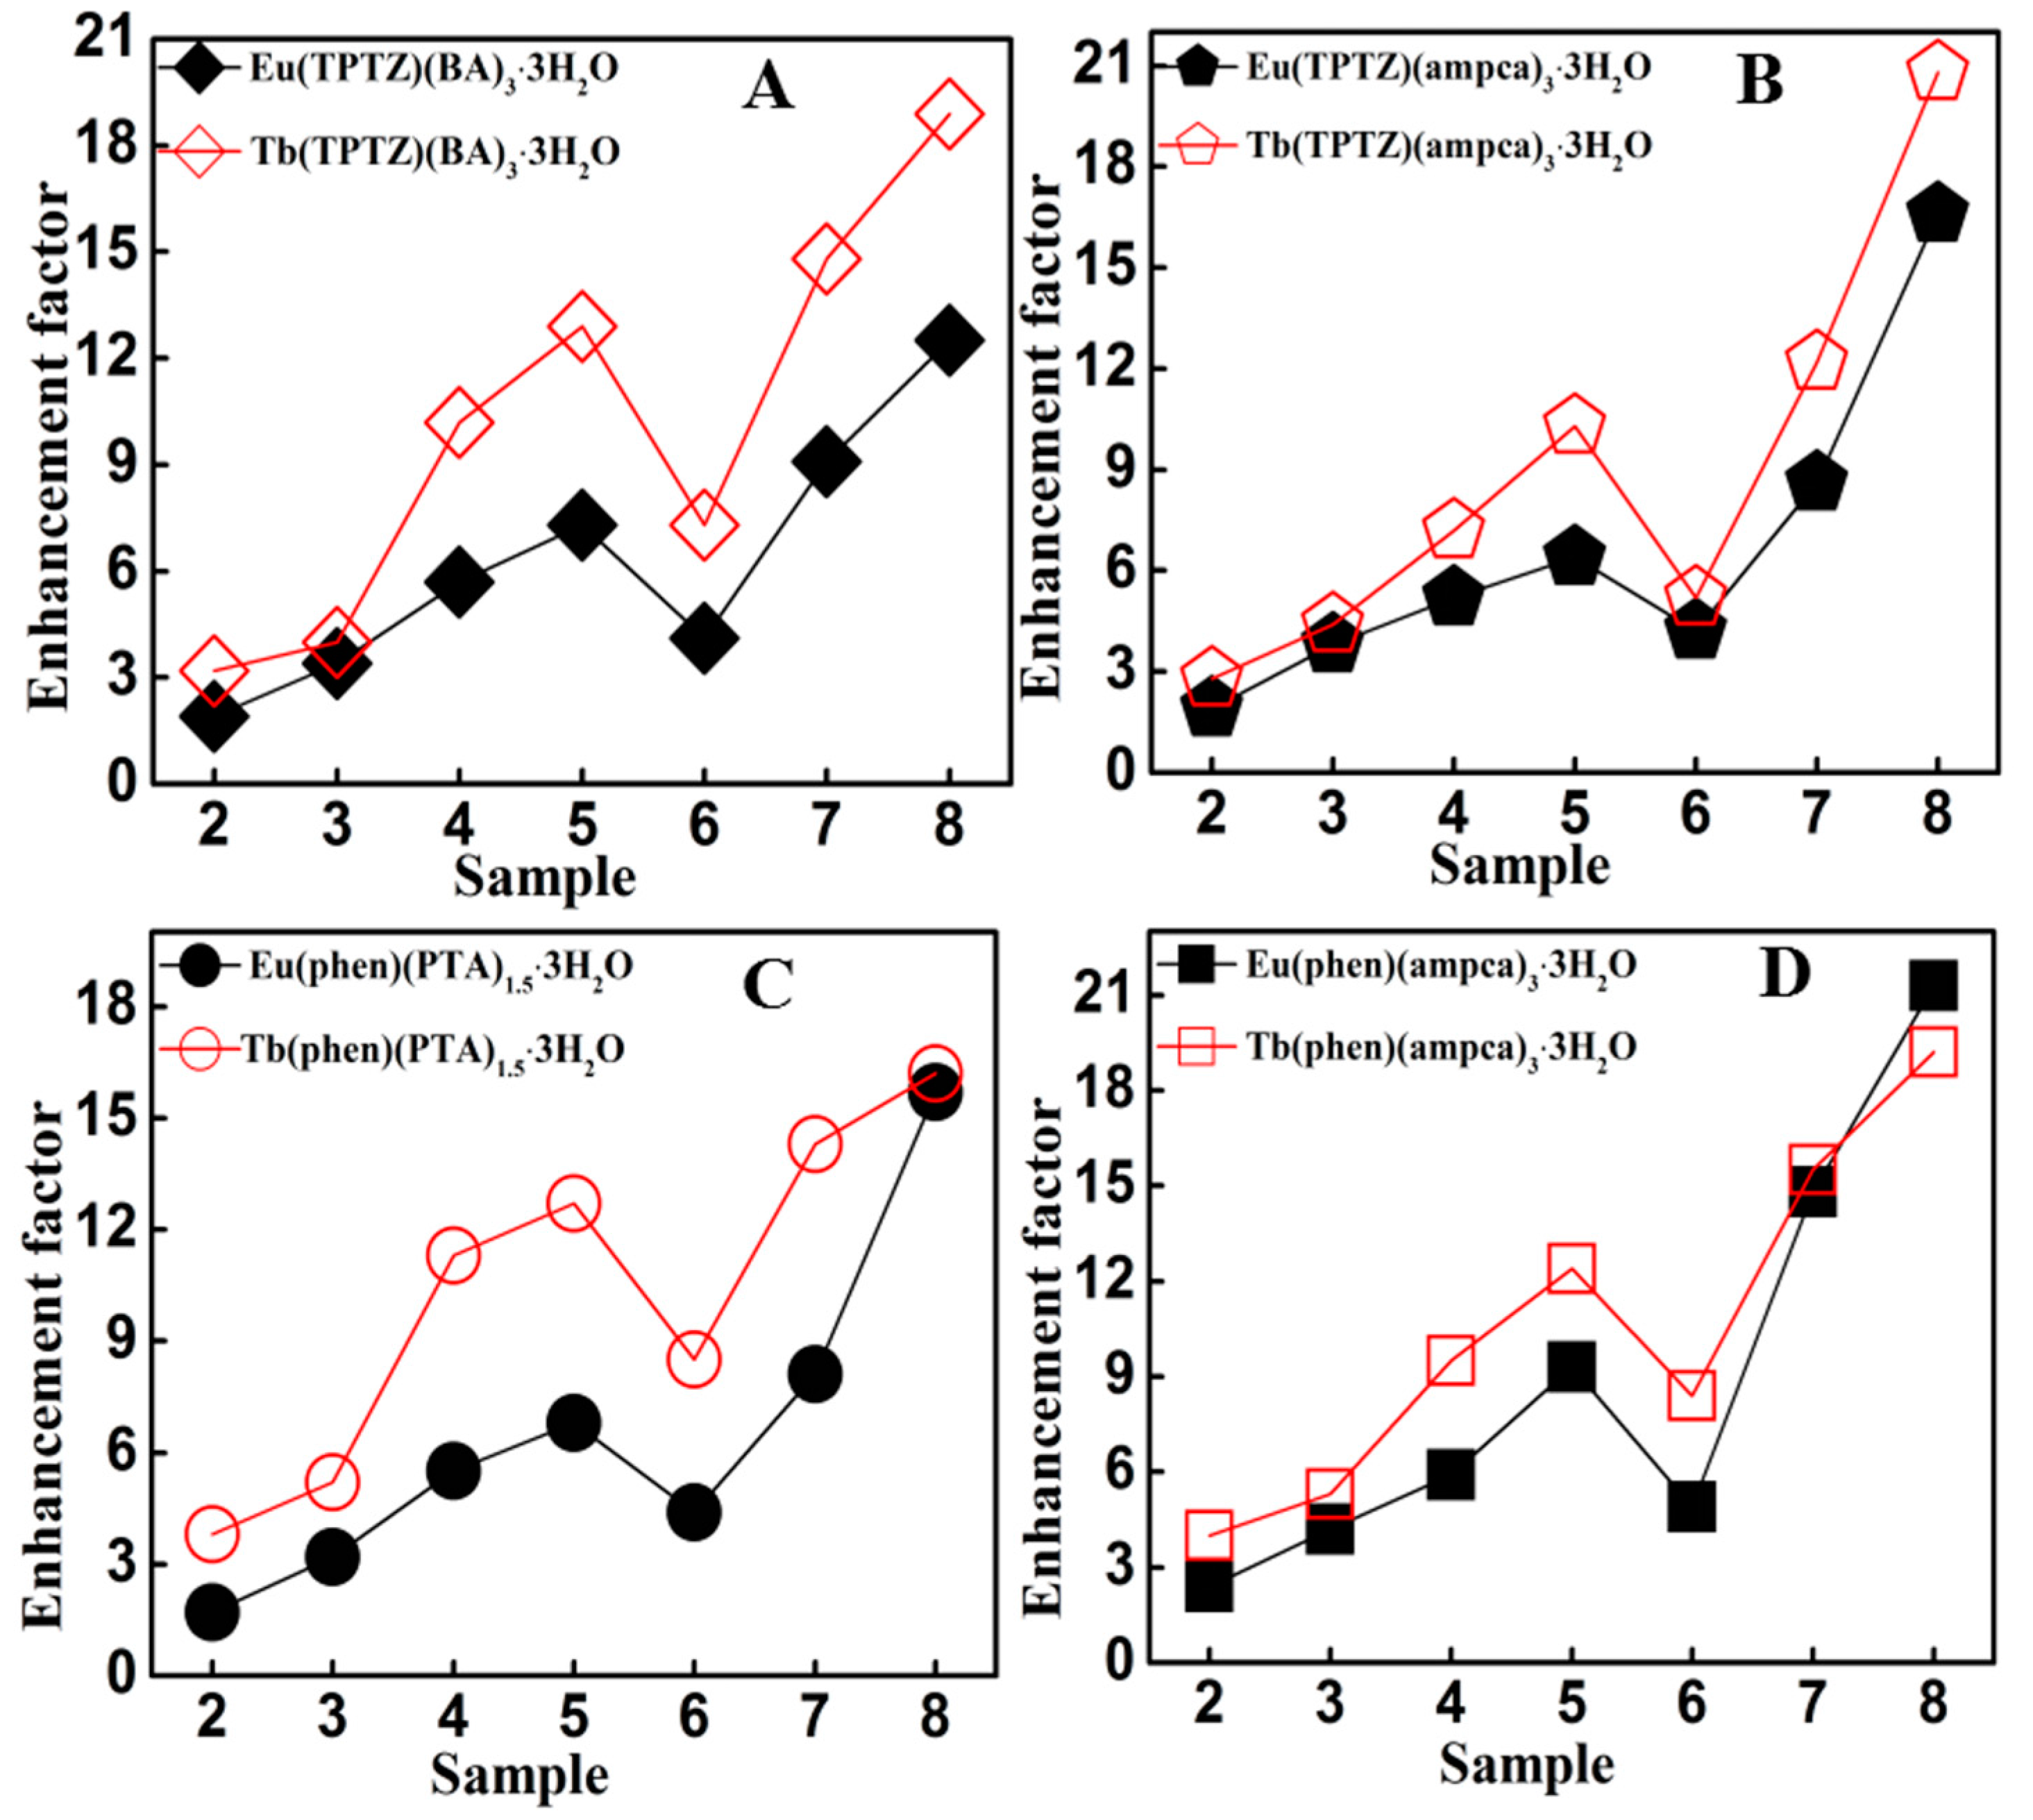
The luminescence properties of lanthanide complexes strongly depend on their compositions, including the lanthanide ions and the ligands, both of which may affect metal-enhanced luminescence. First, metal-enhanced luminescence of Tb and Eu complexes with the same ligands was systematically compared. As shown in Figure 5A and Table 2, the enhancement factors of the terbium complex Tb(TPTZ)(BA)3·3H2O are 3.2, 4.0, 10.2, 13.0, 7.4, 14.8 and 19.2, respectively, in the composites with the seven kinds of Ag@SiO2. These enhancement factors are much higher than those of the corresponding europium complex Eu(TPTZ)(BA)3·3H2O (2.4, 3.4, 5.7, 7.3, 4.0, 9.1 and 12.5). The same phenomena can be found in Tb(TPTZ)(ampca)3·3H2O vs. Eu(TPTZ)(ampca)3·3H2O (Figure 5B and Table 2), Tb(phen)(PTA)1.5·3H2O vs. Eu(phen)(PTA)1.5·3H2O (Figure 5C and Table 2) and Tb(phen)(ampca)3·3H2O vs. Eu(phen)(ampca)3·3H2O (Figure 5D and Table 2). Therefore, it can be concluded that the Tb complexes typically exhibit higher enhancement factors than Eu complexes with identical ligands and Ag@SiO2 nanoparticles.
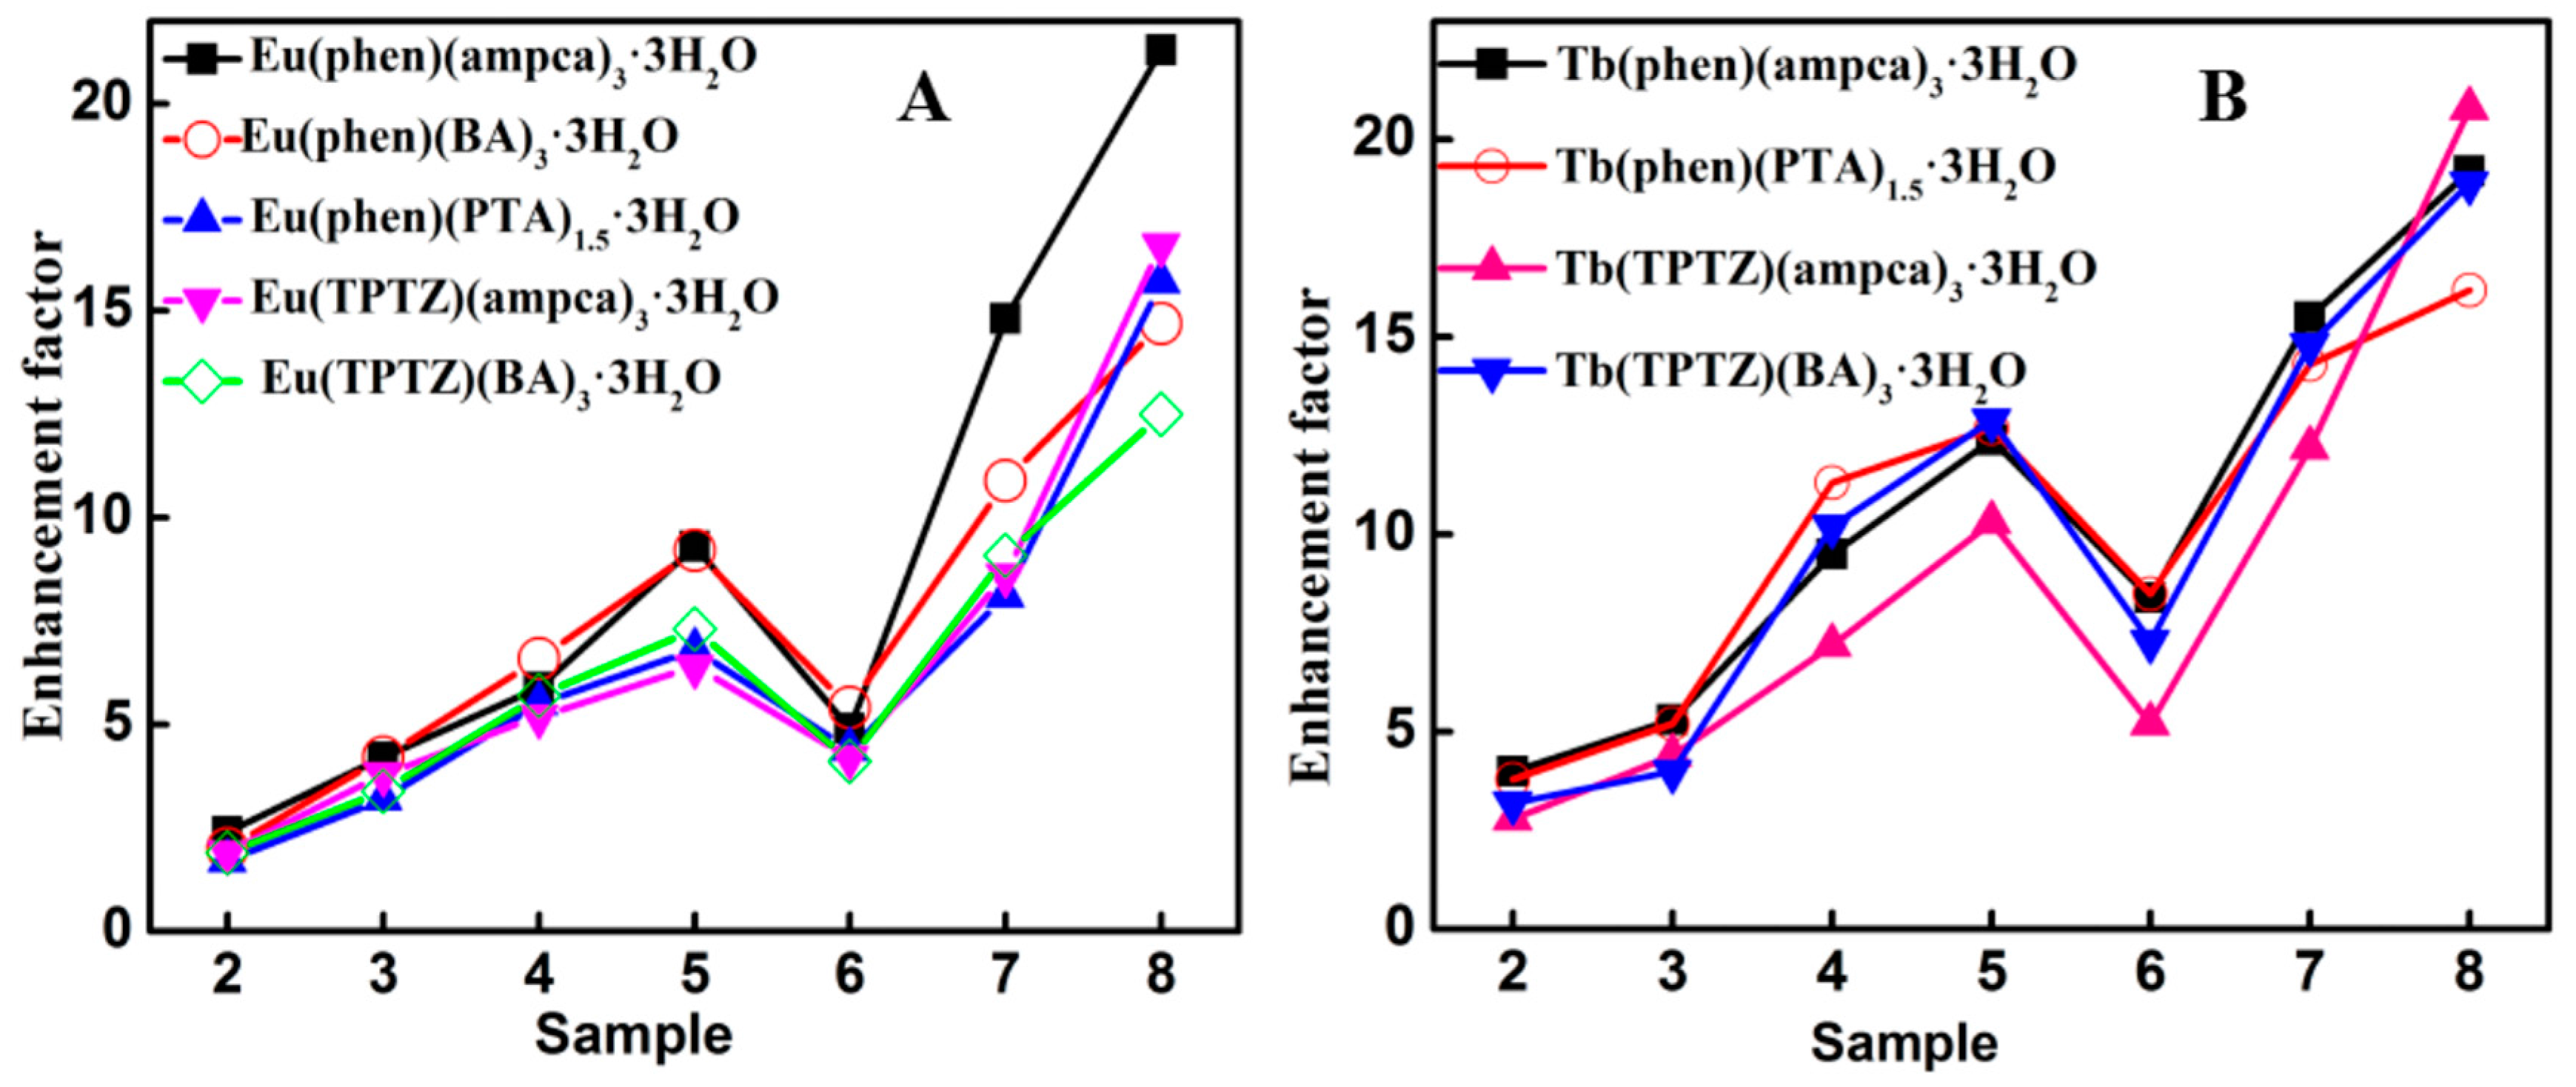
Second, the ligand also plays an important role in the metal-enhanced luminescence of lanthanide complexes. Figure 6A compares five kinds of Eu complexes with varied ligands. The highest enhancement factor of 21.4 is reached by Eu(phen)(ampca)3·3H2O in Sample 8. The corresponding enhancement factors of Eu(TPTZ)(ampca)3·3H2O, Eu(phen)(PTA)1.5·3H2O, Eu(phen)(BA)3·3H2O and Eu(TPTZ)(BA)3·3H2O are 16.9, 16.0, 14.6 and 12.5, respectively, with the same Ag@SiO2 nanoparticles. Note that the excitation wavelengths of these five complexes are 386, 366, 310, 291 and 276 nm, respectively. It seems that the enhancement factors would be large when the excitation wavelengths of the complexes locate nearby the SPR absorption peaks of the Ag@SiO2 nanoparticles (438 nm). Moreover, in Sample 8 (Figure 6B), the three terbium complexes, Tb(phen)(ampca)3·3H2O, Tb(TPTZ)(ampca)3·3H2O and Tb(TPTZ)(BA)3·3H2O, with excitation wavelengths at 330, 306 and 312 nm, also show higher enhancement factors (19.0, 20.6 and 19.2) than Tb(phen)(PTA)1.5·3H2O (16.1) whose excitation wavelength is much shorter at 276 nm.
The metal-enhanced luminescence of the lanthanide complex is considered to result from the following aspects [18,36,53]: (i) excitation enhancement due to increased light absorption; (ii) emission enhancement due to increased light absorption and radiative decay; (iii) quenching reduction due to decreased nonradiative decay. The varied enhancement factors of Tb and Eu complexes may be mainly attributed to the emission enhancement. Compared with the emission bands of Eu complexes (5D0→7F2 around 617 nm), the strongest emission bands of Tb complexes (5D4→7F4 around 543 nm) are much closer to the SPR absorption bands of Ag@SiO2 nanoparticles (peaks at 422–438 nm). Theoretical calculations have predicted that the highest fluorescence would come from fluorophores with emission peaks slightly lower energy than the SPR scattering peak [30]. Therefore, the luminescence enhancement factors of the Tb complexes are typically higher than the corresponding Eu complexes. Meanwhile, the ligand effect on the enhancement factors of the lanthanide complexes may arise from the varied excitation enhancement at different excitation wavelengths. The excitation wavelength of the lanthanide complexes can be varied over a wide range, from UV to visible light, with various ligands. The SPR absorption bands of Ag@SiO2 nanoparticles lie in the wavelength range of 300–500 nm, which could overlap with the excitation spectra of the lanthanide complexes. For example, the excitation wavelength of complex Eu(phen)(ampca)3·3H2O is 386 nm, lying in the middle of the SPR absorption band of Ag@SiO2 nanoparticles. As a result, the excitation of the complex could be enhanced enormously by the SPR absorption of Ag@SiO2 nanoparticles. Thus, the luminescence enhancement factor of Eu(phen)(ampca)3·3H2O is the highest among the five Eu complexes.
4. Conclusions
In summary, nine kinds of europium and terbium complexes have been synthesized. The compositions of them were confirmed to be RE(phen)(ampca)3·3H2O, RE(TPTZ)(BA)3·3H2O, RE(TPTZ)(ampca)3·3H2O, RE(phen)(PTA)1.5·3H2O (RE = Tb and Eu) and Eu(phen)(BA)3·3H2O by elemental analysis, molar conductivity measurement, UV–vis absorption spectra and IR spectra. Then, luminescence emissions of these complexes were enhanced by two series of Ag@SiO2 nanoparticles of varied sizes. Though the luminescence emission intensities of the europium complexes were stronger than the terbium complexes of the same ligands, the terbium complexes typically exhibited higher luminescence enhancement factors than the europium complexes after the introduction of Ag@SiO2 nanoparticles. Meanwhile, for the complex with the same lanthanide ions but different ligands, the closer excitation wavelength to the SPR absorption bands of Ag@SiO2, the stronger luminescence enhancement extent was. The highest luminescence enhancement fator of 21.4 was reached by the Eu(phen)(ampca)3·3H2O complex, whose excitation wavelength (386 nm) lies in the middle of the SPR absorption band of Ag@SiO2 nanoparticles. Therefore, if we can set up two databases, one consisting of the luminescence excitation and emission spectra of the lanthanide complexes with various compositions, and the other being composed of the SPR absorption spectra of the metal nanoparticles of distinct size, structure and compositions, optimization of the metal-enhanced luminescence of a certain complex with a combinatorial chemistry method would be realized with high efficiency.
Supplementary Materials
The following are available online at https://www.mdpi.com/2079-4991/8/2/98/s1.
Acknowledgments
The research work is supported by the National Natural Science Foundation of China (51501094, 21561023, 21161013), the Natural Science Foundation of Inner Mongolia Autonomous Region of China (2017JQ03), the Opening Foundation for Significant Fundamental Research of Inner Mongolia Autonomous Region of China (2010KF03), Scientific Rresearch Project of Inner Mongolia Autonomous Region Higher Education Institutions (NJZY17455) and the Program of High-level Talents of Inner Mongolia University (21300-5155104).
Author Contributions
Hai-Bin Chu and Yong-Liang Zhao conceived and designed the experiments; Yan-Rong Qu and Xiao-Jing Wang performed the preparation and characterization of the lanthanide complexes, nanoparticles and their composites; Xiao-Jing Wang analyzed the data; Xiao-Jing Wang, Hai-Bin Chu and Yong-Liang Zhao co-wrote the paper.
Conflicts of Interest
The authors declare no conflict of interest.
References
- Eliseeva, S.-V.; Bünzli, J.C.-G. Lanthanide luminescence for functional materials and bio-sciences. Chem. Soc. Rev. 2010, 39, 189–227. [Google Scholar] [CrossRef] [PubMed]
- Binnemans, K. Lanthanide-Based Luminescent Hybrid Materials. Chem. Rev. 2009, 109, 4283–4374. [Google Scholar] [CrossRef] [PubMed]
- Carvalhoa, C.-T.; Oliveir, G.-F.; Fernandes, J.; Siqueira, A.-B.; Ionashiroc, E.-Y.; Ionashiro, M. Rare-earth metal compounds with a novel ligand 2-methoxycinnamylidenepyruvate: A thermal and spectroscopic approach. Thermochim. Acta 2016, 637, 17–23. [Google Scholar] [CrossRef]
- Zondlo, S.-C.; Gao, F.; Zondlo, N.-J. Design of an encodable tyrosine kinase-inducible domain: Detection of tyrosine kinase activity by terbium luminescence. J. Am. Chem. Soc. 2010, 132, 5619–5621. [Google Scholar] [CrossRef] [PubMed]
- Guan, J.-B.; Chen, B.; Sun, Y.-Y.; Lian, H.; Zhang, Q.-J. Effects of synergetic ligands on the thermal and radiative properties of Eu(TTA)3nL-doped poly(methyl methacrylate). J. Non-Cryst. Solids 2005, 351, 849–855. [Google Scholar] [CrossRef]
- Pazos, E.; Torrecill, D.; Lopez, M.-V.; Castedo, L.; Mascarena, J.-L.; Vidal, A.; Vázquez, M.-E. Cyclin A Probes by Means of Intermolecular Sensitization of Terbium-Chelating Peptides. J. Am. Chem. Soc. 2008, 130, 9652–9653. [Google Scholar] [CrossRef] [PubMed]
- Kim, S.-H.; Gunther, J.-R.; Katzenellenbogen, J.-A. Monitoring a Coordinated Exchange Process in a Four-Component Biological Interaction System: Development of a Time-Resolved Terbium-Based One-Donor/Three-Acceptor Multicolor FRET System. J. Am. Chem. Soc. 2010, 132, 4685–4692. [Google Scholar] [CrossRef] [PubMed]
- Luppa, P.-B.; Sokoll, L.-J.; Chan, D.-W. Immunosensors—Principles and applications to clinical chemistry. Clin. Chim. Acta 2001, 314, 1–26. [Google Scholar] [CrossRef]
- Zhong, W.-W. Nanomaterials in fluorescence-based biosensing. Anal. Bioanal. Chem. 2009, 394, 47–59. [Google Scholar] [CrossRef] [PubMed]
- Davies, G.-L.; O’Brien, J.; Guńko, Y.-K. Rare earth doped silica nanoparticles via thermolysis of a single source metallasilsesquioxane precursor. Sci. Rep. 2017, 7, 45862. [Google Scholar] [CrossRef] [PubMed]
- Murray, K.; Cao, Y.-C.; Ali, S.; Hanley, Q. Lanthanide doped silica nanoparticles applied to multiplexed immunoassays. Analyst 2010, 135, 2132–2138. [Google Scholar] [CrossRef] [PubMed]
- Chiriua, D.; Stagia, L.; Carbonaroa, C.-M.; Corpinoa, R.; Casula, M.-F.; Ricci, P.-C. Towards the development of new phosphors with reduced content of rare earth elements: Structural and optical characterization of Ce:Tb: Al2SiO5. Mater. Res. Bull. 2016, 77, 15–22. [Google Scholar] [CrossRef]
- Bünzli, J.-C.G.; Eliseeva, S.-V. Intriguing aspects of lanthanide luminescence. Chem. Sci. 2013, 4, 1939–1949. [Google Scholar] [CrossRef]
- Atabaev, T.S.; Lee, J.H.; Shin, Y.C.; Han, D.-W.; Choo, K.S.; Jeon, U.B.; Hwang, J.Y.; Yeom, J.A.; Kim, H.-K.; Hwang, Y.-H. Eu, Gd-Codoped Yttria Nanoprobes for Optical and T1-Weighted Magnetic Resonance Imaging. Nanomaterials 2017, 7, 35. [Google Scholar] [CrossRef] [PubMed]
- Wu, J.; Ye, Z.-Q.; Wang, G.; Jin, D.-Y.; Yuan, J.-L.; Guan, Y.-F.; James, P. Visible-light-sensitized highly luminescent europium nanoparticles: Preparation and application for time-gated luminescence bioimaging. J. Mater. Chem. 2009, 19, 1258–1264. [Google Scholar] [CrossRef]
- Zhang, D.-J.; Wang, X.-M.; Qiao, Z.-A.; Tang, D.-H.; Liu, Y.-L.; Huo, Q.-S. Synthesis and characterization of novel lanthanide(III) complexes-functionalized mesoporous silica nanoparticles as fluorescent nanomaterials. J. Phys. Chem. C 2010, 114, 12505–12510. [Google Scholar] [CrossRef]
- Zhao, Y.F.; Chu, H.B.; Bai, F.; Gao, D.Q.; Zhang, H.X.; Zhou, Y.S.; Wei, X.Y.; Shan, M.N.; Li, H.Y.; Zhao, Y.L. Synthesis, crystal structure, luminescent property and antibacterial activity of lanthanide ternary complexes with 2,4,6-tri(2-pyridyl)-s-triazine. J. Organomet. Chem. 2012, 716, 167–174. [Google Scholar] [CrossRef]
- Kong, L.J.; Kong, K.; Zhao, Y.L.; Chu, H.B. Tuning the luminescence properties of lanthanide coordination polymers with Ag@SiO2 nanoparticles. Dalton Trans. 2017, 46, 6447–6455. [Google Scholar] [CrossRef] [PubMed]
- Wang, A.L.; Zhou, D.; Chen, Y.N.; Li, J.J.; Zhang, H.X.; Zhao, Y.L.; Chu, H.B. Crystal structure and photoluminescence of europium, terbium and samarium compounds with halogen-benzoate and 2,4,6-tri(2-pyridyl)-s-triazine. J. Lumin. 2016, 177, 22–30. [Google Scholar] [CrossRef]
- Aslan, K.; Wu, M.; Lakowicz, J.-R.; Geddes, C.-D. Fluorescent Core−Shell Ag@SiO2 Nanocomposites for Metal-Enhanced Fluorescence and Single Nanoparticle Sensing Platforms. J. Am.Chem. Soc. 2007, 129, 1524–1525. [Google Scholar] [CrossRef] [PubMed]
- Yang, B.-J.; Lu, N.; Qi, D.-P.; Ma, R.-P.; Wu, Q. Tuning the Intensity of Metal-Enhanced Fluorescence by Engineering Silver Nanoparticle Arrays. Small 2010, 6, 1038–1043. [Google Scholar] [CrossRef] [PubMed]
- Bae, S.; Han, H.; Bae, J.-G.; Lee, E.-Y.; Im, S.-H.; Kim, D.-H.; Seo, T.-S. Growth of silver nanowires from controlled silver chloride seeds and their application for fluorescence enhancement based on localized surface plasmon resonance. Small 2017, 13, 1603392. [Google Scholar] [CrossRef] [PubMed]
- Deng, W.; Jin, D.; Drozdowicz-Tomsia, K.; Yuan, J.; Wu, J.; Goldys, E.-M. Ultrabright Eu–Doped Plasmonic Ag@SiO2 Nanostructures: Time-gated Bioprobes with Single Particle Sensitivity and Negligible Background. Adv. Mater. 2011, 23, 4649–4654. [Google Scholar] [CrossRef] [PubMed]
- Cho, Y.-J.; Lee, S.-S.; Jung, J.-H. Recyclable fluorimetric and colorimetric mercury-specific sensor using porphyrin-functionalized Au@SiO2 core/shell nanoparticles. Analyst 2010, 135, 1551–1555. [Google Scholar] [CrossRef] [PubMed]
- Zhang, F.; Braun, G.-B.; Shi, Y.-F.; Zhang, Y.-C.; Sun, X.-H.; Reich, N.-O.; Zhao, D.-Y.; Stucky, G. Fabrication of Ag@SiO2@Y2O3:Er Nanostructures for Bioimaging: Tuning of the Upconversion Fluorescence with Silver Nanoparticles. J. Am. Chem. Soc. 2010, 132, 2850–2851. [Google Scholar] [CrossRef] [PubMed]
- Kudelski, A.; Wojtysiak, S. Silica-Covered Silver and Gold Nanoresonators for Raman Analysis of Surfaces of Various Materials. J. Phys. Chem. C. 2012, 116, 16167–16174. [Google Scholar] [CrossRef]
- Pham, X.-H.; Hahm, E.; Kim, H.M.; Shim, S.; Kim, T.H.; Jeong, D.H.; Lee, Y.-S.; Jun, B.-H. Silver Nanoparticle-Embedded Thin Silica-Coated Graphene Oxide as an SERS Substrate. Nanomaterials 2016, 6, 176. [Google Scholar] [CrossRef] [PubMed]
- Geddes, C.D. Metal-enhanced fluorescence. Phys. Chem. Chem. Phys. 2013, 15, 19537. [Google Scholar] [CrossRef] [PubMed]
- Geddes, C.D.; Lakowicz, J.R. Editorial: Metal-Enhanced Fluorescence. J. Fluoresc. 2002, 12, 121–129. [Google Scholar] [CrossRef]
- Geddes, C.D. Metal-Enhanced Fluorescence; John Wiley & Sons, Inc.: Hoboken, NJ, USA, 2010. [Google Scholar]
- Zhang, J.; Song, F.; He, Z.; Liu, Y.; Chen, Z.; Lin, Y.; Huang, L.; Huang, W. Wide-Range Tunable Fluorescence Lifetime and Ultrabright Luminescence of Eu-Grafted Plasmonic Core-Shell Nanoparticles for Multiplexing. Small 2016, 12, 397–404. [Google Scholar] [CrossRef] [PubMed]
- Kong, X.; Yu, Q.; Zhang, X.; Du, X.; Gong, H.; Jiang, H. Synthesis and application of surface enhanced Raman scattering (SERS) tags of Ag@SiO2 core/shell nanoparticles in protein detection. J. Mater. Chem. 2012, 22, 7767–7774. [Google Scholar] [CrossRef]
- Lee, J.E.; Bera, S.; Choi, Y.S.; Lee, W.I. Size-dependent plasmonic effects of M and M@SiO2 (M = Au or Ag) deposited on TiO2 in photocatalytic oxidation reactions. Appl. Catal. B 2017, 214, 15–22. [Google Scholar] [CrossRef]
- Mosselhy, D.A.; Granbohm, H.; Hynönen, U.; Ge, Y.; Palva, A.; Nordström, K.; Hannula, S.-P. Nanosilver–Silica Composite: Prolonged Antibacterial Effects and Bacterial Interaction Mechanisms for Wound Dressings. Nanomaterials 2017, 7, 261. [Google Scholar] [CrossRef] [PubMed]
- Kang, J.; Li, Y.; Chen, Y.-N.; Wang, A.-L.; Yue, B.; Qu, Y.-R.; Zhao, Y.-L.; Chu, H.-B. Core-shell Ag@SiO2 nanoparticles of different silica shell thicknesses: Preparation and their effects on photoluminescence of lanthanide complexes. Mater. Res. Bull. 2015, 71, 116–121. [Google Scholar] [CrossRef]
- Qu, Y.-R.; Lin, X.-M.; Wang, A.-L.; Wang, Z.-X.; Kang, J.; Chu, H.-B.; Zhao, Y.-L. Study on silicon oxide coated on silver nanocrystal to enhance fluorescence intensity of rare earth complexes. J. Lumin. 2014, 154, 402–409. [Google Scholar] [CrossRef]
- Zhou, D.; Lin, X.-M.; Wang, A.-L.; Li, J.-J.; Qu, Y.-R.; Chu, H.-B.; Zhao, Y.-L. Fluorescence enhancement of Tb3+ complexes by adding silica-coated silver nanoparticles. Sci. China Chem. 2015, 58, 979–985. [Google Scholar] [CrossRef]
- Haes, A.J.; Zou, S.L.; Schatz, G.C.; Duyne, R.P.V. Nanoscale Optical Biosensor: Short Range Distance Dependence of the Localized Surface Plasmon Resonance of Noble Metal Nanoparticles. J. Phys. Chem. B 2004, 108, 6961–6968. [Google Scholar] [CrossRef]
- Li, D.; Li, D.-W.; Li, Y.; Fossey, J.-S.; Long, Y.-T. Cyclic electroplating and stripping of silver on Au@SiO2 core/shell nanoparticles for sensitive and recyclable substrate of surface-enhanced Raman scattering. J. Mater. Chem. 2010, 20, 3688–3693. [Google Scholar] [CrossRef]
- Liu, S.; Zhang, Z.; Han, M. Gram-scale synthesis and biofunctionalization of silica-coated silver nanoparticles for fast colorimetric DNA detection. Anal. Chem. 2005, 77, 2595–2600. [Google Scholar] [CrossRef] [PubMed]
- Zhang, J.; Fu, Y.; Liang, D.; Zhao, R.Y.; Lakowicz, J.-R. Enhanced Fluorescence Images for Labeled Cells on Silver Island Films. Langmuir 2008, 24, 12452–12457. [Google Scholar] [CrossRef] [PubMed]
- Taylor, M.-D.; Carter, C.-P.; Wynter, C.-I. The infra-red spectra and structure of the rare-earth benzoates Original. J. Inorg. Nucl. Chem. 1968, 30, 1503–1511. [Google Scholar] [CrossRef]
- Geary, W.-J. The use of conductivity measurements in organic solvents for the characterisation of coordination compounds. Coord. Chem. Rev. 1971, 7, 81–122. [Google Scholar] [CrossRef]
- Nawrota, I.; Machuraa, B.; Kruszynskib, R. Thiocyanate cadmium(II) complexes of 2,4,6-tri(2-pyridyl)-1,3,5-triazine—Synthesis, structure and luminescence properties. J. Lumin. 2014, 156, 240–254. [Google Scholar] [CrossRef]
- Deng, Z.-P.; Kang, W.; Huo, L.-H.; Zhao, H.; Gao, S. Rare-earth organic frameworks involving three types of architecture tuned by the lanthanide contraction effect: Hydrothermal syntheses, structures and luminescence. Dalton Trans. 2010, 39, 6276–6284. [Google Scholar] [CrossRef] [PubMed]
- Gabr, I.M.; El-Asmy, H.A.; Emmam, M.S.; Mostafa, S.I. Synthesis, characterization and anticancer activity of 3-aminopyrazine-2-carboxylic acid transition metal complexes. Trans. Metal. Chem. 2009, 34, 409–418. [Google Scholar] [CrossRef]
- Tamer, Ö.; Avcı, D.; Atalay, Y. Synthesis, X-Ray crystal structure, photophysical characterization and nonlinear optical properties of the unique manganese complex with picolinate and 1,10 phenantroline: Toward the designing of new high NLO response crystal. J. Phys. Chem. Solids 2016, 99, 124–133. [Google Scholar] [CrossRef]
- Varaprasad, K.; Pariguana, M.; Raghavendra, G.-M.; Jayaramudu, T.; Sadiku, E.-R. Development of biodegradable metaloxide/polymer nanocomposite films based on poly-ε-caprolactone and terephthalic acid. Mater. Sci. Eng. C 2017, 70, 85–93. [Google Scholar] [CrossRef] [PubMed]
- Huang, C.-H. Rare Earth Coordination Chemistry: Fundamentals and Applications; John Wiley & Sons (Asia) Pte Ltd.: Singapore, 2010. [Google Scholar]
- Zhao, Y.-F.; Zhao, Y.-L.; Bai, F.; Wei, X.-Y.; Zhou, Y.-S.; Shan, M.-N.; Li, H.-H.; Ma, R.-J.; Fu, X.-T.; Du, Y. Fluorescent Property of the Gd3+-Doped Terbium Complexes and Crystal Structure of [Tb(TPTZ)(H2O)6]Cl3·3H2O. J. Fluoresc. 2010, 20, 763–770. [Google Scholar] [CrossRef] [PubMed]
- Bünzli, J.C.-G. On the design of highly luminescent lanthanide complexes. Coord. Chem. Rev. 2015, 293–294, 19–47. [Google Scholar] [CrossRef]
- Li, D.; Chen, F.-F.; Bian, Z.-Q.; Liu, Z.-W.; Zhao, Y.-L.; Huang, C.-H. Sensitized near-infrared emission of YbIII from an IrIII–YbIII bimetallic complex. Polyhedron 2009, 28, 897–902. [Google Scholar] [CrossRef]
- Kong, L.J.; Zhao, Y.F.; Kong, K.; Zhao, Y.L.; Chu, H.B. Fluorescence enhancement of europium nitrobenzoates by Ag@SiO2 nanoparticles in solution. J. Lumin. 2017, 186, 255–261. [Google Scholar] [CrossRef]
Figure 1.
TEM images of Ag nanoparticles (A,F) and core-shell Ag@SiO2 nanoparticles (B–E,G–I). The Ag core sizes are 80–100 nm in (A–E) and 40–60 nm in (F–I). The silica shell thickness of (B–E) are 5, 12, 20, 30 nm, and (G–I) are 12, 30, 40 nm, respectively.
Figure 1.
TEM images of Ag nanoparticles (A,F) and core-shell Ag@SiO2 nanoparticles (B–E,G–I). The Ag core sizes are 80–100 nm in (A–E) and 40–60 nm in (F–I). The silica shell thickness of (B–E) are 5, 12, 20, 30 nm, and (G–I) are 12, 30, 40 nm, respectively.

Figure 2.
(A) UV-vis absorption spectra of Ag@SiO2 nanoparticles with core sizes of 80–100 nm (a–e) and SiO2 thicknesses of 5 nm (b), 12 nm (c), 20 nm (d) and 30 nm (e); (B) UV-vis absorption spectra of Ag@SiO2 nanoparticles with core sizes of 40–60 nm (f–i) and SiO2 thicknesses of 12 nm (g), 30 nm (h) and 40 nm (i).

Figure 3.
Infrared spectra of the Eu complexes and related ligands. (A) Eu(TPTZ)(BA)3·3H2O, Eu(TPTZ)(amcpa)3·3H2O, BA, ampca and TPTZ; (B) Eu(phen)(PTA)1.5·3H2O, Eu(phen)(BA)3·3H2O, Eu(phen)(ampca)3·3H2O, BA, ampca and phen.
Figure 3.
Infrared spectra of the Eu complexes and related ligands. (A) Eu(TPTZ)(BA)3·3H2O, Eu(TPTZ)(amcpa)3·3H2O, BA, ampca and TPTZ; (B) Eu(phen)(PTA)1.5·3H2O, Eu(phen)(BA)3·3H2O, Eu(phen)(ampca)3·3H2O, BA, ampca and phen.

Figure 4.
Luminescent emission spectra of Eu(phen)(ampca)3·3H2O (A) and Tb(phen)(ampca)3·3H2O (B) before and after the addition of varied Ag@SiO2 nanoparticles. The insets show the corresponding excitation spectra of the complexes. Sample 1 is the pure complex. Samples 2–5 represent the complexes added with the Ag@SiO2 nanoparticles with core sizes of 80–100 nm and shell thicknesses of 5, 12, 20 and 30 nm. Samples 6–8 represent the complexes added with the Ag@SiO2 nanoparticles with core sizes of 40–60 nm and shell thicknesses of 12, 30 and 40 nm, respectively.

Figure 5.
Comparison of the luminescence enhancement factors between Tb and Eu complexes. (A) Eu(TPTZ)(BA)3·3H2O and Tb(TPTZ)(BA)3·3H2O; (B) Eu(TPTZ)(amcpa)3·3H2O and Tb(TPTZ)(amcpa)3·3H2O; (C) Eu(phen)(PTA)1.5·3H2O and Tb(phen)(PTA)1.5·3H2O; (D) Eu(phen)(ampca)3·3H2O and Tb(phen)(ampca)3·3H2O.
Figure 5.
Comparison of the luminescence enhancement factors between Tb and Eu complexes. (A) Eu(TPTZ)(BA)3·3H2O and Tb(TPTZ)(BA)3·3H2O; (B) Eu(TPTZ)(amcpa)3·3H2O and Tb(TPTZ)(amcpa)3·3H2O; (C) Eu(phen)(PTA)1.5·3H2O and Tb(phen)(PTA)1.5·3H2O; (D) Eu(phen)(ampca)3·3H2O and Tb(phen)(ampca)3·3H2O.

Figure 6.
Comparison of the luminescence enhancement factors among the lanthanide complexes with different ligands. (A) Eu complexes; (B) Tb complexes.
Figure 6.
Comparison of the luminescence enhancement factors among the lanthanide complexes with different ligands. (A) Eu complexes; (B) Tb complexes.


Table 1.
Data of elemental analysis and molar conductivities of the complexes.
| Complex | C(%) | H(%) | N(%) | Conductivity (S·cm2·mol−1) |
|---|---|---|---|---|
| Eu(phen)(ampca)3·3H2O | 40.03(40.48) | 3.56(3.50) | 18.92(19.24) | 11.2 |
| Eu(TPTZ)(BA)3·3H2O | 53.46(53.18) | 4.22(4.07) | 9.98(9.55) | 13.1 |
| Eu(TPTZ)(ampca)3·3H2O | 42.88(42.46) | 3.67(3.22) | 22.90(22.52) | 12.6 |
| Eu(phen)(BA)3·3H2O | 52.47(52.62) | 4.47(4.52) | 3.79(3.72) | 13.2 |
| Eu(phen)(PTA)1.5·3H2O | 45.47(45.33) | 3.46(3.17) | 3.97(4.41) | 14.2 |
| Tb(phen)(ampca)3·3H2O | 40.57(40.14) | 3.59(3.25) | 19.47(19.08) | 14.2 |
| Tb(TPTZ)(BA)3·3H2O | 52.07(52.49) | 4.03(4.04) | 9.78(9.42) | 18.3 |
| Tb(TPTZ)(ampca)3·3H2O | 42.57(42.17) | 3.59(3.22) | 22.70(22.37) | 17.4 |
| Tb(phen)(PTA)1.5·3H2O | 45.37(45.14) | 3.47(3.73) | 4.48(4.38) | 15.9 |
Note: the values in brackets are theoretical values. phen, 1,10-phenanthroline; ampca, 3-aminopyrazine-2-carboxylic acid; BA, benzoic acid; PTA, phthalic acid; TPTZ, 2,4,6-tri(2-pyridyl)-s-triazine.
Table 2.
Luminescence emission data of the complexes and complex-doped Ag@SiO2 nanocomposites at the strongest emissions (europium complex at 5D0→7F2 transitions, terbium complex at 5D4→7F4 transitions).
Table 2.
Luminescence emission data of the complexes and complex-doped Ag@SiO2 nanocomposites at the strongest emissions (europium complex at 5D0→7F2 transitions, terbium complex at 5D4→7F4 transitions).
| Complex | λex (nm) | Emission Intensity (a.u.) (105) | |||||||
|---|---|---|---|---|---|---|---|---|---|
| 1 | 2 | 3 | 4 | 5 | 6 | 7 | 8 | ||
| Eu(phen)(ampca)3·3H2O | 386 | 2.7 | 5.7(2.1) | 11.4(4.2) | 15.8(5.9) | 25.0(9.3) | 13.2(4.9) | 39.9(14.8) | 57.6(21.3) |
| Eu(phen)(BA)3·3H2O | 291 | 1.7 | 3.4(2.0) | 7.1(4.2) | 11.3(6.6) | 15.6(9.2) | 9.1(5.4) | 18.5(10.9) | 25.0(14.7) |
| Eu(phen)(PTA)1.5·3H2O | 276 | 2.3 | 3.8(1.7) | 7.3(3.2) | 12.6(5.5) | 15.6(6.8) | 10.0(4.4) | 18.6(8.1) | 36.1(15.7) |
| Eu(TPTZ)(ampca)3·3H2O | 366 | 2.9 | 5.4(1.9) | 11.1(3.8) | 15.0(5.2) | 18.7(6.4) | 12.1(4.2) | 24.8(8.6) | 48.2(16.6) |
| Eu(TPTZ)(BA)3·3H2O | 310 | 2.0 | 3.8(1.9) | 6.8(3.4) | 11.3(5.7) | 14.6(7.3) | 8.1(4.1) | 18.2(9.1) | 25.0(12.5) |
| Tb(phen)(ampca)3·3H2O | 330 | 0.62 | 2.5(4.0) | 3.3(5.3) | 5.9(9.5) | 7.7(12.4) | 5.2(8.4) | 9.6(15.5) | 11.9(19.2) |
| Tb(phen)(PTA)1.5·3H2O | 306 | 0.60 | 2.3(3.8) | 3.1(5.2) | 6.8(11.3) | 7.6(12.7) | 5.1(8.5) | 8.6(14.3) | 9.7(16.2) |
| Tb(TPTZ)(ampca)3·3H2O | 273 | 0.64 | 1.8(2.8) | 2.8(4.4) | 4.6(7.2) | 6.6(10.3) | 3.3(5.2) | 7.8(12.2) | 13.3(20.8) |
| Tb(TPTZ)(BA)3·3H2O | 312 | 0.63 | 2.0(3.2) | 2.5(4.0) | 6.4(10.2) | 8.1(12.9) | 4.6(7.3) | 9.3(14.8) | 11.9(18.9) |
Note: The data in brackets are the luminous enhancement factors.
© 2018 by the authors. Licensee MDPI, Basel, Switzerland. This article is an open access article distributed under the terms and conditions of the Creative Commons Attribution (CC BY) license (http://creativecommons.org/licenses/by/4.0/).
Share and Cite
MDPI and ACS Style
Wang, X.-J.; Qu, Y.-R.; Zhao, Y.-L.; Chu, H.-B. Effect of the Composition of Lanthanide Complexes on Their Luminescence Enhancement by Ag@SiO2 Core-Shell Nanoparticles. Nanomaterials 2018, 8, 98. https://doi.org/10.3390/nano8020098
AMA Style
Wang X-J, Qu Y-R, Zhao Y-L, Chu H-B. Effect of the Composition of Lanthanide Complexes on Their Luminescence Enhancement by Ag@SiO2 Core-Shell Nanoparticles. Nanomaterials. 2018; 8(2):98. https://doi.org/10.3390/nano8020098
Chicago/Turabian StyleWang, Xiao-Jing, Yan-Rong Qu, Yong-Liang Zhao, and Hai-Bin Chu. 2018. "Effect of the Composition of Lanthanide Complexes on Their Luminescence Enhancement by Ag@SiO2 Core-Shell Nanoparticles" Nanomaterials 8, no. 2: 98. https://doi.org/10.3390/nano8020098
Note that from the first issue of 2016, this journal uses article numbers instead of page numbers. See further details here.