Communication

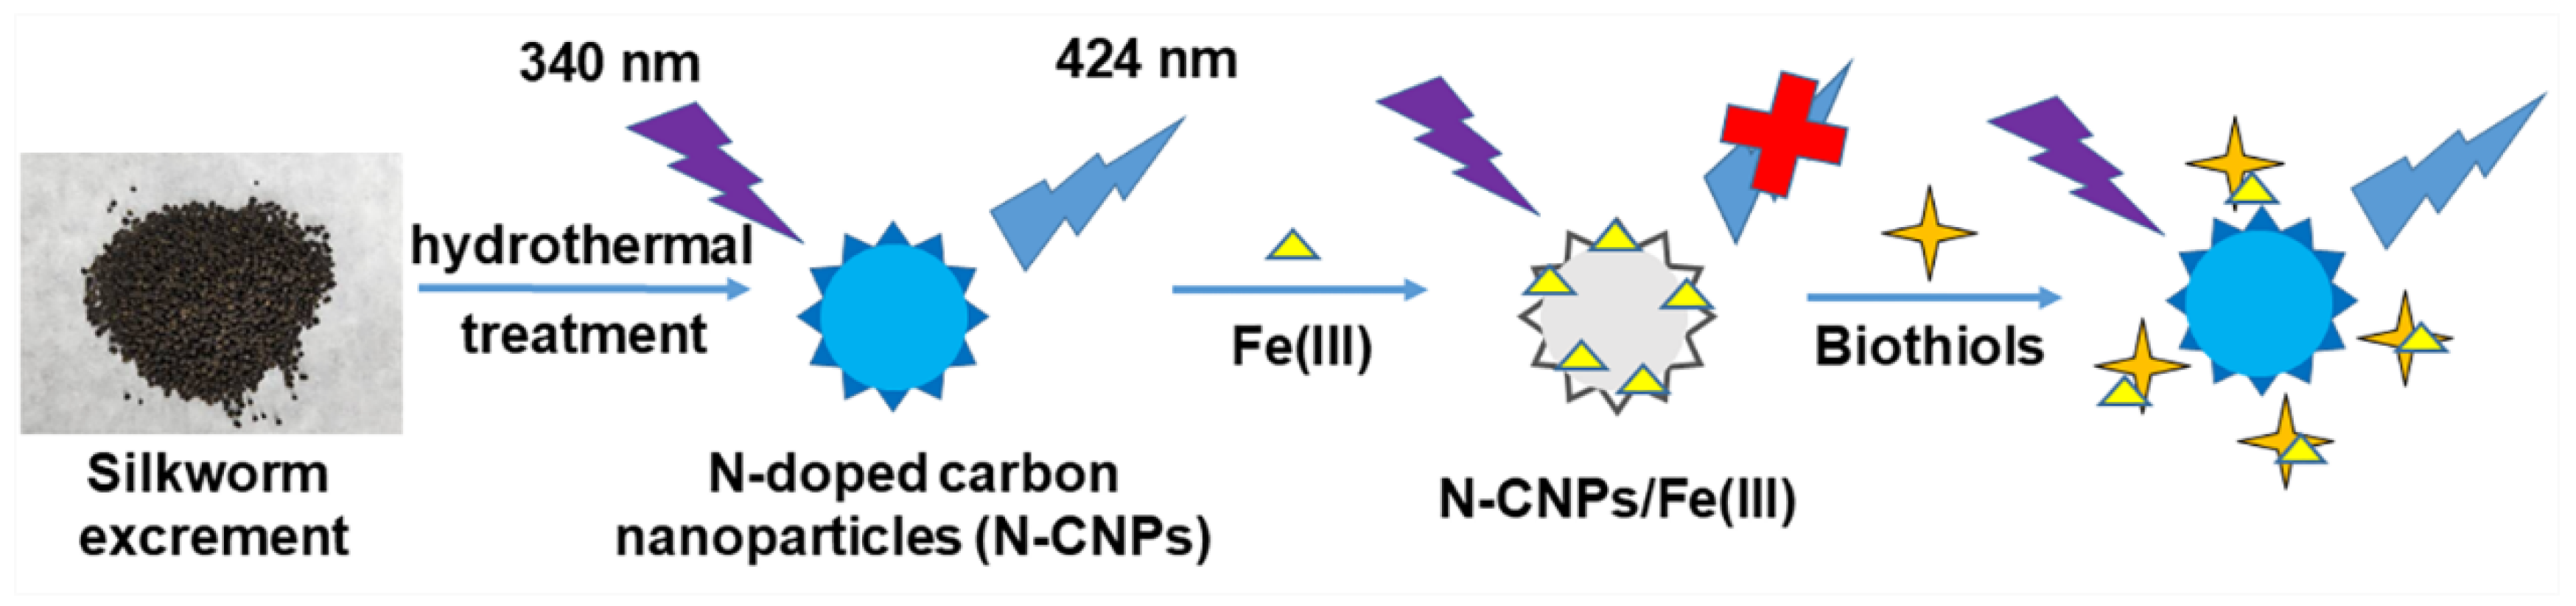
Nitrogen-Doped Carbon Nanoparticles Derived from Silkworm Excrement as On–Off–On Fluorescent Sensors to Detect Fe(III) and Biothiols

College of Science, Huazhong Agricultural University, Wuhan 430070, China
*
Authors to whom correspondence should be addressed.
Nanomaterials 2018, 8(6), 443; https://doi.org/10.3390/nano8060443
Submission received: 28 May 2018 / Revised: 14 June 2018 / Accepted: 14 June 2018 / Published: 17 June 2018
(This article belongs to the Special Issue Nanostructured Biosensors)

Abstract

:
On–off–on fluorescent sensors based on emerging carbon nanoparticles (CNPs) or carbon dots (CDs) have attracted extensive attention for their convenience and efficiency. In this study, dumped silkworm excrement was used as a novel precursor to prepare fluorescent nitrogen-doped CNPs (N-CNPs) through hydrothermal treatment. The obtained N-CNPs showed good photoluminescent properties and excellent water dispersibility. Thus, they were applied as fluorescence “on–off–on” probes for the detection of Fe(III) and biothiols. The “on–off” process was achieved by adding Fe(III) into N-CNP solution, which resulted in the selective fluorescence quenching, with the detection limit of 0.20 μM in the linear range of 1–500 μM. Following this, the introduction of biothiols could recover the fluorescence efficiently, in order to realize the “off–on” process. By using glutathione (GSH) as the representative, the linear range was in the range of 1–1000 μM, and the limit of detection was 0.13 μM. Moreover, this useful strategy was successfully applied for the determination of amounts of GSH in fetal calf serum samples.

1. Introduction

Biothiols, such as glutathione (GSH), cysteine (Cys), and homocysteine (Hcy) are small molecular weight biomolecules with thiol groups, which play crucial roles in numerous biological processes [1,2,3]. For example, GSH is abundant in cells to help maintain the cellular redox homeostasis, control signal transduction, and take part in gene regulation [4,5]. The abnormal concentration of biothiols is related to various ailments and disorders, including AIDS, HIV, Alzheimer’s disease, liver damage, heart disease, and cancer [6,7,8]. Moreover, biothiols are also widely used in the food industry, as well as in cosmetic and pharmaceutical areas, due to their unique physiological properties [9]. Consequently, the analysis of biothiols in biological or environmental systems is of great importance. Although many analytical strategies, including colorimetry [10], high performance liquid chromatography (HPLC) [11], electrochemistry [12], and surface-enhanced Raman scattering (SERS) [13] have been developed for the detection of biothiols, the fluorescent method is thought of as a powerful kind of technology because of its easy operation, high sensitivity, and flexibility [14,15]. In recent years, several fluorescent systems based on emerging carbon nanoparticles (CNPs) or carbon dots (CDs) have been developed for sensing biothiols. Most of these strategies are based on the fluorescence “on–off–on” mechanism, which needs an intermediate to quench the photoluminescence, and biothiols to recover the fluorescence. However, almost all intermediates are heavy metal ions such as Hg(II) [16,17,18,19], Ag(I) [20,21], Cu(II) [22,23], and Au(III) [24], which are not eco-friendly, and will cause serious problems to the environment and public health. Thus, searching for an alternative ion (e.g., Fe3+) is extremely important for this kind of detection platform, which is application-oriented. In addition, Fe(III) detection is of vital importance, since Fe(III) is essential for many biological systems, and a deficiency of Fe(III) could cause various diseases, including anemia, renal failure, and liver injury [25,26,27].
Fluorescent CNPs and CDs are novel carbon-based nanomaterials with good biocompatibility, eco-friendliness, excellent photoluminescence, and high photostability, and are widely applied in chemical sensing, bio-imaging, and other fields [28,29,30,31,32]. The synthetic approaches of CNPs and CDs are usually classified as top-down cutting of bulk carbon sources (graphite [33,34], graphene [35], carbon nanotubes [36], coal [37] etc.) and bottom-up carbonization of molecules (citric acid [38,39], glucose [40], phenylenediamine [41,42] etc.). It is believed that the raw materials are related to the properties of prepared CNPs or CDs, including fluorescent emission and solubility [41,43]. Biomass is abundant in nature, and supplies quantities of carbon and heteroatoms, which will participate in the synthetic procedure, and help passivate the product itself. Therefore, the employment of bio-resources is becoming more and more popular, and is considered to be a low-cost and renewable route to obtaining low biotoxic CNPs and CDs [44,45,46,47]. Silkworm excrement is an agricultural waste produced by Bombyx mori in quantities of millions of metric tons every year, and has always been utilized as a traditional Chinese medicine and fertilizer [48,49]. In fact, silkworm excrement is mainly composed of fibers, fats, proteins, amino acids and so on, which is suitable for the preparation of nitrogen-doped CNPs.
In this paper, novel nitrogen-doped CNPs (N-CNPs) were prepared by the hydrothermal treatment of silkworm excrement that could be employed as both a carbon and a nitrogen source. These as-prepared N-CNPs showed bright blue emission under ultraviolet illumination, with excellent aqueous solubility. The strong fluorescence of N-CNPs could be selectively quenched by Fe(III) to form an N-CNPs/Fe(III) system. This quenched system could be restored by adding biothiols. Thus, the fluorescence “on–off–on” process was achieved for the detection of Fe(III) and biothiols. Furthermore, the GSH in the practical sample was successfully evaluated.

2. Materials and Methods

2.1. Materials and Chemicals

Silkworm excrement was obtained from sericulturists (Zhejiang, China) and washed to remove impurities. AgNO3, AlCl3·6H2O, CaCl2, CdCl2·2.5H2O, CrCl3·6H2O, FeCl2·4H2O, FeCl3·6H2O, KCl, LiCl, MnCl2·4H2O, NaCl, NH4Cl, NiCl2·6H2O, PbCl2, ZnCl2 were provided by Sinopharm Chemical Reagent Co., Ltd. (Shanghai, China). Glucose, α-Lactose, sucrose, dopamine hydrochloride, β-alanine, l-arginine, l-asparagine, l-glutamic acid, glycine, l-histidine, l-methionine, l-phenylalanine, l-proline, dl-homocysteine, l-cysteine, reduced l-glutathione of analytical reagent grade were purchased from Aladin Ltd. (Shanghai, China). The fetal calf serum (main compositions: globular protein and bovine serum albumin) was obtained from Tianhang Biotechnology Co., Ltd. (Zhejiang, China). Ultrapure water (18.2 MΩ cm−1) obtained from the Millipore system was used in this study.

2.2. Characterization

Transmission electron microscopy (TEM) images were observed by a H-7650 electron microscope (Hitachi, Tokyo, Japan) at an accelerating voltage of 80 kV. The N-CNPs were dropped onto 400-mesh carbon-coated Cu grids and dried at room temperature. X-ray diffraction (XRD) patterns were obtained by using a D8 Advance X-ray diffractometer (Bruker, Billerica, MA, USA) with a filtered Cu Ka radiation. Fourier transform infrared (FT-IR) spectroscopy was performed on a NEXUS 670 FTIR spectrometer (Thermo Scientific, Waltham, MA, USA), ranging from 400–4000 cm−1. The N-CNPs were dispersed in KBr pellets. X-ray photoelectron spectroscopy (XPS) results were collected using an ESCALab 250Xi XPS instrument (Thermo Scientific, Waltham, MA, USA). Ultraviolet-visible (UV-vis) absorption spectrum was recorded by a Shimadzu 2450 UV-vis spectrophotometer (Shimadzu, Kyoto, Japan). All fluorescence spectra were conducted by a RF-5301PC fluorescence spectrometer (Shimadzu, Kyoto, Japan) with 5 nm slit width for the excitation and 10 nm slit width for the emission.

2.3. Preparation and Purification of Nitrogen-Doped CNPs (N-CNPs)

150 mg of silkworm excrement and 10 mL of ultrapure water were added into 15 mL of Teflon equipped stainless steel autoclave. The mixture was heated at 200 °C for 24 h and cooled down to room temperature naturally. The obtained yellow solution was centrifuged at 10,000 rpm for 15 min to precipitate out insoluble precipitate, and filtered by 220 nm membrane. Following this, the solution was dialyzed for 1 day (MWCO = 3.5 kD). Finally, the product of N-CNPs was collected by freeze-drying for further use.

2.4. Selectivity and Quantitative Measurements for Fe(III) and Biothiols

The detection of Fe(III) and biothiols was performed at pH = 7.0, and at room temperature. For Fe(III) detection, 400 μL of N-CNPs (0.1 mg mL−1, pH = 7.0) was dispersed into 3.2 mL of Tris-HCl buffer (pH = 7.0), then 400 μL of Fe(III) solution (pH = 7.0) was added, and the final concentration of Fe(III) was in the range of 0–500 μM. For comparison, the same procedure was performed for other ions at the final concentration of 500 μM. To detect biothiols, GSH was chosen and added into an N-CNPs/Fe(III) complex solution with different concentrations (0, 1, 2, 5, 10, 20, 50, 100, 200, 400, 600, 800, and 1000 μM). The same procedure was also performed for other biomolecules at the final concentration of 1 mM. All the emission spectra were recorded at 340 nm excitation.

2.5. The Detection of Glutathione (GSH) in Fetal Calf Serum Samples

The fetal calf serum was used to evaluate the detection ability of N-GNPs/Fe(III) in a practical situation. All the samples were filtered through 0.22 μm membranes to remove the large suspended particles, and their pH levels were regulated to 7.0. Then, 2.8 mL of Tris-HCl, 400 μL of sample, 400 μL of Fe(III) solution, and 400 μL of N-CNPs were mixed and recorded with the fluorescence spectrometer.

2.6. Quantum Yield (QY) Measurement

The QY of N-CNPs was calculated by the equation below as Equation (1):
QYs = QYr·IsArηs2/(IrAsηr2)
where “s” and “r” refer to the sample and reference, respectively. The reference quinine sulfate is dissolved in 0.1 M H2SO4 and its QY is 0.54 at 340 nm [50]. “I” represents the integrated emission intensity of fluorescent spectra at the excited wavelength of 340 nm. “A” is the UV-vis absorbance at 340 nm, controlled as 0.1–0.01 to avoid re-absorption. “η” is the refractive index of the solvent.

3. Results and Discussion

The synthesis of N-CNPs from silkworm excrement and the fluorescence “on–off–on” strategy to detect Fe(III) and biothiols were summarized in Figure 1. The silkworm excrement was a deep gray granulum which could not be dispersed in water. However, under the high temperature and pressure of the hydrothermal process, the silkworm excrement was likely decomposed, and carbonized to form N-CNPs with self-passivation. The N-CNPs were stable, and demonstrated good blue photoluminescence under UV excitation, which could be quenched in the presence of Fe(III), and formed the N-CNPs/Fe(III) mixture. In a further step, the weak fluorescence of N-CNPs/Fe(III) could be restored by biothiols though the interaction between Fe(III) and biothiols.
TEM was employed to characterize the morphology and size distribution of N-CNPs. As demonstrated in Figure 2a, the N-CNPs were well-separated spherical nanoparticles. The corresponding particle size distribution histogram in Figure 2b showed that the N-CNPs ranged from 40–85 nm in size, and the mean diameter was about 62 nm. Although N-CNPs had a larger size than traditional CDs (usually less than 10 nm), their solution was stable for several weeks without any aggregate and precipitate.
To confirm the crystallinity of N-CNPs, XRD was measured, and the result was shown in Figure 2c. It was clear that a broad diffraction peak (2θ) was observed at 23.3°, which revealed that N-CNPs had an amorphous crystal phase [51]. FT-IR was used to identify the functional groups and chemical structure of N-CNPs. As shown in Figure 2d, the peaks at 3391 and 3247 cm−1 were attributed to O–H/N–H stretching vibration. The intense peak at around 1586 cm−1 was attributed to the vibration of C=C, which was formed in the hydrothermal process. The small absorption peak at 1752 cm−1 indicated the C=O group. The other peak at 1071 cm−1 was assigned to the C–O and C–O–C bands.
XPS analysis was used to investigate the surface composition and element states of the N-CNPs. The three peaks centered at 285.0, 399.1, and 532.0 eV in the XPS spectra of N-CNPs (Figure 3a) were ascribed to C 1s, N 1s, and O 1s, which had an atomic ratio of 61.51:3.99:34.5. The presence of the N 1s peak revealed that the nitrogen was successfully doped in the resultant CNPs. Furthermore, the C 1s spectrum in Figure 3b had three peaks at 284.7, 286.1, and 288.3 eV, which were assigned to C=C/C–C, C–N/C–O, and C=O groups, respectively. The three peaks at 399.5, 400.0, and 401.3 eV in the N 1s spectrum (Figure 3c) were attributed to C–N–C, N–(C)3, and N–H respectively. The O 1s spectrum in Figure 3d was deconvoluted into two peaks at 531.5 and 532.7 eV, which were attributed to C=O and C–OH/C–O–C, respectively. The existence of various functional groups in N-CNPs created a good dispersibility in the aqueous solution system.
The UV-vis absorption and photoluminescent (PL) emission spectra were explored to investigate the optical properties of N-CNPs. As shown in Figure 4a, the UV-vis absorption spectrum of N-CNPs had two peaks at about 274 and 318 nm, which were caused by π → π* transition of the conjugate structure, and n → π* transition of the C=O bond [52,53]. The inset photographs in Figure 4a display N-CNPs dispersed in water under daylight (left), and under UV illumination (right). It was evident that N-CNPs emitted bright blue fluorescence under 365 nm excitation. Furthermore, the PL emission spectra were recorded under various excitation wavelengths, and exhibited in Figure 4b. The wavelength of the emission peak shifted from 392 to 451 nm when the excitation wavelength increased from 300 to 380 nm. The excitation-dependent redshift of the emission was consistent with previous CNPs or CDs, which probably resulted from the difference in size of the carbon cores, and the complex surface defects [54,55,56]. The emission peak reached its maximum at 424 nm under 340 nm excitation, which was set as the detective condition. The QY of the prepared N-CNPs was calculated as 13.1% in Table S1, with quinine sulfate as the standard reference. It was found that N-CNPs had good PL properties, making them suitable for further analytical application.
The influence of pH (1–13) on the emission spectra of N-CNPs was researched, and the PL intensity of 424 nm under 340 nm excitation was recorded in Figure S1. With the increase in pH, the PL intensity increased at first and then decreased. The N-CNPs performed a high PL intensity in neutral conditions, and the strong acid and alkaline environment would reduce the fluorescence intensity of N-CNPs, possibly due to the protonation and deprotonation effect [16]. Thus the pH = 7.0 was chosen as the optimal detection condition for the following experiment.
To explore the specific ability of N-CNPs towards Fe(III), the fluorescence emissions of N-CNPs with various positive ions (500 μM) were measured at 340 nm excitation and exhibited in Figure S2. It was clear that the emission peak of N-CNPs decreased remarkably with the addition of Fe(III). The relationship between F/F0 (the ratio of PL intensities of N-CNPs in the presence and absence of ions) and ion species is shown in Figure 5a. Most of the added ions including Ag(I), Al(III), Ca(II), Cd(II), Cr(III), K(I), Li(I), Mn(II), Na(I), NH4+, Ni(II), Pb(II), and Zn(II) did not cause an obvious fluorescence change of the N-CNPs, while Cu(II) and Fe(II) could partially quench the fluorescence of N-CNPs. N-CNPs with a Fe(III) system had the lowest value compared with N-CNPs with other ions. The corresponding quenching efficiency was over 80%, which confirmed that N-CNPs had a selective response to Fe(III).
Figure S3 exhibited the fluorescence spectra of N-CNPs with different concentrations of Fe(III). It was clear that the PL intensity of 424 nm decreased gradually, while further increasing the Fe(III) concentration from 0 to 500 μM. The relationship between F0/F (the ratio of PL intensities of N-CNPs in the absence and presence of Fe(III)) and [Fe(III)] (the concentration of Fe(III)) was presented in Figure 5b. A good fitted line (R2 = 0.9992) was observed and the equation was shown as Equation (2):
F0/F = 1 + 0.00903[Fe(III)]
The LOD (limit of detection) was calculated as 0.20 μM (S/N = 3, S/N: the signal to noise ratio, based on the standard deviation of 10 blank measurements) [57]. The performance of N-CNPs was compared with the recently reported CNPs or CDs (Table S2) and exhibited lower LOD, wider linear range, or better selectivity. These results indicated that the N-CNPs could be applied as a fluorescent probe to detect Fe(III) quantitatively in the solution. It should also be noted that the limit of quantification (LOQ) was 0.66 μM according to S/N = 10 [58].
The mechanism of the selective fluorescence quenching effect of N-CNPs with Fe(III) was possibly related to the high affinity of Fe(III) towards O/N-containing groups on the surface of N-CNPs, which led to the formation of the N-CNPs/Fe(III) complex [59]. The UV-vis absorption spectrum of N-CNPs with Fe(III) was further investigated, and showed a new absorption peak at 290 nm (Figure S4), indicating the stable metal ion/N-CNP structure was formed to realize the static quenching effect [60,61].
Since Fe (III) also has a great chelation towards biothiols, their strong coordination could recover the quenched PL emission of the N-CNPs/Fe(III) system. To confirm the fluorescent restoration of biothiols, various biological molecules (1 mM) including glucose (G), sacrose (S), lactose (L), dopamine (DA), alanine(Ala), arginine(Arg), asparagine(Asn), glutamic acid(Glu), glycine (Gly), histidine (Hls), methionine(Met), phenylalanine (Phe), proline (Pro), homocysteine(Hcy), cysteine (Cys), and glutathione (GSH) were added into N-CNPs/Fe(III) (N-CNPs with 500 μM Fe(III)). The fluorescence spectra were recorded at 340 nm excitation, and shown in Figure S5. The relationship between F’/F’0 (the ratio of PL intensities of N-CNPs/Fe(III) in the presence and absence of biological molecules) and biomolecule species was shown in Figure 6a. Saccharides and non-thiol amino acids did not have a significant influence on fluorescence intensities, while dopamine (DA) could partially restore the fluorescence of N-CNPs/Fe(III). Biothiols could dramatically enhance the weak fluorescence of N-CNPs/Fe(III), probably due to their interaction with Fe(III), and GSH performed the highest F’/F’0 of 4.21 ± 0.05 compared with Hcy (2.86 ± 0.01) and Cys (3.45 ± 0.02). This result confirmed the specificity of the sensing system towards biothiols. Then, we chose GSH as the typical analyte, and the enhancement was dependent on the GSH concentration. As shown in Figure S6, the fluorescent intensity increased with the increase in concentration of GSH, which revealed that the Fe(III) could be separated from N-CNPs. The F’/F’0 and [GSH]1/2 had a good fitted line (R2 = 0.9997) as shown in Figure 6b, which could be summarized as Equation (3):
F’/F’0 = 1 + 0.10249[GSH]1/2
The LOD was 0.13 μM with S/N = 3, which was equal to or lower than other reported fluorescent sensors based on CNPs or CDs (Table S3).
To evaluate the detection performance of N-CNPs/Fe(III) towards GSH in a complicated biological environment, serum sample was tested, and the results are shown in Table 1. Different spiked concentrations of GSH were added into the fetal calf serum samples with N-CNPs. The recovery efficiencies (the ratio of found GSH and added GSH) were 108.7, 103.9, and 102.4% for 4, 50, and 100 μM GSH, respectively. The corresponding relative standard deviations (RSD) are 1.50, 2.14, and 2.43%, respectively. These results revealed that the N-CNPs could be used for the determination of GSH in practical samples.

4. Conclusions

In summary, a facile and one-step hydrothermal process was used to prepare N-CNPs by applying silkworm excrement as the suitable nitrogen and carbon source. The obtained N-CNPs could be used as efficient fluorescence “on–off–on” probes to detect Fe(III) and biothiols. Fe(III) could quench the fluorescence of N-CNPs selectively to form N-CNPs/Fe(III), and the linear range was 1–500 μM with the LOD of 0.20 μM. Upon the addition of biothiols, the N-CNPs/Fe(III) could be restored efficiently. By using GSH as the example, the linear range was 1–1000 μM, with the LOD of 0.13 μM. Additionally, the platform was successfully used to evaluate the amount of GSH in a fetal calf serum sample, which achieved the goal for practical use. This novel detection strategy will help in the design of biological and environmental sensors based on fluorescent carbon nanoparticles.

Supplementary Materials

The following are available online at https://www.mdpi.com/2079-4991/8/6/443/s1, Figure S1: pH effect on PL intensity (424 nm) of N-CNPs under 340 nm excitation, Figure S2: PL emission spectra of N-CNPs in absence and presence of various ions under 340 nm excitation, Figure S3: PL emission spectra of N-CNPs with different concentrations of Fe(III), Figure S4: UV-vis absorption spectra of N-CNPs/Fe(III) and N-CNPs, Figure S5: PL emission spectra of N-CNPs/Fe(III) in absence and presence of different biomolecules under 340 nm excitation, Figure S6: PL emission spectra of N-CNPs/Fe(III) with different concentrations of GSH, Table S1: QY calculation of N-CNPs, Table S2: The comparison between various CNPs and CDs toward Fe(III), Table S3: The comparison between various fluorescent sensors based on CNPs or CDs toward GSH.

Author Contributions

X.L. prepared the nitrogen-doped carbon nanoparticles and drafted the manuscript. C.L. and Z.W. did the detection experiments. J.Y. and M.X. performed the UV-vis absorption and fluorescence spectra. J.D. helped fabricate the nitrogen-doped carbon nanoparticles. P.W. provided and washed the silkworm excrement. J.G. and F.C. designed the whole work and revised the manuscript. All authors discussed the results and approved the final manuscript.

Funding

This research was funded by the Fundamental Research Funds for the Central Universities of China (Nos. 2662016QD028, 2662015PY163), the open funds of the State Key Laboratory of Agricultural Microbiology (AMLKF201702), Beijing National Laboratory for Molecular Sciences (BNLMS, BNLMS20160102) and the National Natural Science Foundation of China (No. 21603080).

Conflicts of Interest

The authors declare no conflict of interest.

References

  1. Chen, W.; Luo, H.; Liu, X.; Foley, J.W.; Song, X. Broadly Applicable Strategy for the Fluorescence Based Detection and Differentiation of Glutathione and Cysteine/Homocysteine: Demonstration in Vitro and in Vivo. Anal. Chem. 2016, 88, 3638–3646. [Google Scholar] [CrossRef] [PubMed]
  2. Yin, J.; Kwon, Y.; Kim, D.; Lee, D.; Kim, G.; Hu, Y.; Ryu, J.-H.; Yoon, J. Cyanine-Based Fluorescent Probe for Highly Selective Detection of Glutathione in Cell Cultures and Live Mouse Tissues. J. Am. Chem. Soc. 2014, 136, 5351–5358. [Google Scholar] [CrossRef] [PubMed]
  3. Labib, M.; Sargent, E.H.; Kelley, S.O. Electrochemical Methods for the Analysis of Clinically Relevant Biomolecules. Chem. Rev. 2016, 116, 9001–9090. [Google Scholar] [CrossRef] [PubMed]
  4. Gupta, A.; Verma, N.C.; Khan, S.; Nandi, C.K. Carbon dots for naked eye colorimetric ultrasensitive arsenic and glutathione detection. Biosens. Bioelectron. 2016, 81, 465–472. [Google Scholar] [CrossRef] [PubMed]
  5. Wu, Y.; Liu, X.; Wu, Q.; Yi, J.; Zhang, G. Carbon Nanodots-Based Fluorescent Turn-On Sensor Array for Biothiols. Anal. Chem. 2017, 89, 7084–7089. [Google Scholar] [CrossRef] [PubMed]
  6. Li, Z.; Zhang, J.; Li, Y.; Zhao, S.; Zhang, P.; Zhang, Y.; Bi, J.; Liu, G.; Yue, Z. Carbon dots based photoelectrochemical sensors for ultrasensitive detection of glutathione and its applications in probing of myocardial infarction. Biosens. Bioelectron. 2018, 99, 251–258. [Google Scholar] [CrossRef] [PubMed]
  7. Zhou, X.; Zhao, G.; Chen, M.; Gao, W.; Zhou, X.; Xie, X.; Yang, L.; Du, G. Facile and Green Approach to Prepare Nanostructured Au@MnO2 and Its Applications for Catalysis and Fluorescence Sensing of Glutathione in Human Blood. ACS Sustain. Chem. Eng. 2018, 6, 3948–3956. [Google Scholar] [CrossRef]
  8. Niu, L.-Y.; Guan, Y.-S.; Chen, Y.-Z.; Wu, L.-Z.; Tung, C.-H.; Yang, Q.-Z. BODIPY-Based Ratiometric Fluorescent Sensor for Highly Selective Detection of Glutathione over Cysteine and Homocysteine. J. Am. Chem. Soc. 2012, 134, 18928–18931. [Google Scholar] [CrossRef] [PubMed]
  9. Pan, J.; Zheng, Z.; Yang, J.; Wu, Y.; Lu, F.; Chen, Y.; Gao, W. A novel and sensitive fluorescence sensor for glutathione detection by controlling the surface passivation degree of carbon quantum dots. Talanta 2017, 166, 1–7. [Google Scholar] [CrossRef] [PubMed]
  10. Durocher, S.; Rezaee, A.; Hamm, C.; Rangan, C.; Mittler, S.; Mutus, B. Disulfide-Linked, Gold Nanoparticle Based Reagent for Detecting Small Molecular Weight Thiols. J. Am. Chem. Soc. 2009, 131, 2475–2477. [Google Scholar] [CrossRef] [PubMed]
  11. Janeš, L.; Lisjak, K.; Vanzo, A. Determination of glutathione content in grape juice and wine by high-performance liquid chromatography with fluorescence detection. Anal. Chim. Acta 2010, 674, 239–242. [Google Scholar] [CrossRef] [PubMed]
  12. Safavi, A.; Maleki, N.; Farjami, E.; Mahyari, F.A. Simultaneous Electrochemical Determination of Glutathione and Glutathione Disulfide at a Nanoscale Copper Hydroxide Composite Carbon Ionic Liquid Electrode. Anal. Chem. 2009, 81, 7538–7543. [Google Scholar] [CrossRef] [PubMed]
  13. Saha, A.; Jana, N.R. Detection of Cellular Glutathione and Oxidized Glutathione Using Magnetic–Plasmonic Nanocomposite-Based “Turn-Off” Surface Enhanced Raman Scattering. Anal. Chem. 2013, 85, 9221–9228. [Google Scholar] [CrossRef] [PubMed]
  14. Achadu, O.J.; Nyokong, T. Graphene quantum dots decorated with maleimide and zinc tetramaleimido-phthalocyanine: Application in the design of “OFF-ON” fluorescence sensors for biothiols. Talanta 2017, 166, 15–26. [Google Scholar] [CrossRef] [PubMed]
  15. Yang, C.; Deng, W.; Liu, H.; Ge, S.; Yan, M. Turn-on fluorescence sensor for glutathione in aqueous solutions using carbon dots–MnO2 nanocomposites. Sens. Actuators B Chem. 2015, 216, 286–292. [Google Scholar] [CrossRef]
  16. Xu, S.; Liu, Y.; Yang, H.; Zhao, K.; Li, J.; Deng, A. Fluorescent nitrogen and sulfur co-doped carbon dots from casein and their applications for sensitive detection of Hg2+ and biothiols and cellular imaging. Anal. Chim. Acta 2017, 964, 150–160. [Google Scholar] [CrossRef] [PubMed]
  17. Huang, H.; Weng, Y.; Zheng, L.; Yao, B.; Weng, W.; Lin, X. Nitrogen-doped carbon quantum dots as fluorescent probe for “off-on” detection of mercury ions, l-cysteine and iodide ions. J. Colloid Interface Sci. 2017, 506, 373–378. [Google Scholar] [CrossRef] [PubMed]
  18. Iqbal, A.; Iqbal, K.; Xu, L.; Li, B.; Gong, D.; Liu, X.; Guo, Y.; Liu, W.; Qin, W.; Guo, H. Heterogeneous synthesis of nitrogen-doped carbon dots prepared via anhydrous citric acid and melamine for selective and sensitive turn on-off-on detection of Hg(II), glutathione and its cellular imaging. Sens. Actuators B Chem. 2018, 255, 1130–1138. [Google Scholar] [CrossRef]
  19. Ju, J.; Zhang, R.; He, S.; Chen, W. Nitrogen-doped graphene quantum dots-based fluorescent probe for the sensitive turn-on detection of glutathione and its cellular imaging. RSC Adv. 2014, 4, 52583–52589. [Google Scholar] [CrossRef]
  20. Borse, V.; Thakur, M.; Sengupta, S.; Srivastava, R. N-doped multi-fluorescent carbon dots for ‘turn off-on’ silver-biothiol dual sensing and mammalian cell imaging application. Sens. Actuators B Chem. 2017, 248, 481–492. [Google Scholar] [CrossRef]
  21. Wang, Y.; Xu, J.; Lei, L.; Wang, F.; Xu, Z.; Zhang, W. Multi-functional carbon dots-based nanoprobe for ratiometric enzyme reaction monitoring and biothiol analysis. Sens. Actuators B Chem. 2018, 264, 296–303. [Google Scholar] [CrossRef]
  22. Yang, R.; Guo, X.; Jia, L.; Zhang, Y. A fluorescent “on-off-on” assay for selective recognition of Cu(II) and glutathione based on modified carbon nanodots, and its application to cellular imaging. Microchim. Acta 2017, 184, 1143–1150. [Google Scholar] [CrossRef]
  23. Guo, Y.; Yang, L.; Li, W.; Wang, X.; Shang, Y.; Li, B. Carbon dots doped with nitrogen and sulfur and loaded with copper(II) as a “turn-on” fluorescent probe for cystein, glutathione and homocysteine. Microchim. Acta 2016, 183, 1409–1416. [Google Scholar] [CrossRef]
  24. Gu, J.; Hu, D.; Wang, W.; Zhang, Q.; Meng, Z.; Jia, X.; Xi, K. Carbon dot cluster as an efficient “off–on” fluorescent probe to detect Au(III) and glutathione. Biosens. Bioelectron. 2015, 68, 27–33. [Google Scholar] [CrossRef] [PubMed]
  25. Shangguan, J.; Huang, J.; He, D.; He, X.; Wang, K.; Ye, R.; Yang, X.; Qing, T.; Tang, J. Highly Fe3+-Selective Fluorescent Nanoprobe Based on Ultrabright N/P Codoped Carbon Dots and Its Application in Biological Samples. Anal. Chem. 2017, 89, 7477–7484. [Google Scholar] [CrossRef] [PubMed]
  26. Li, S.; Li, Y.; Cao, J.; Zhu, J.; Fan, L.; Li, X. Sulfur-doped graphene quantum dots as a novel fluorescent probe for highly selective and sensitive detection of Fe3+. Anal. Chem. 2014, 86, 10201–10207. [Google Scholar] [CrossRef] [PubMed]
  27. Atchudan, R.; Edison, T.N.J.I.; Aseer, K.R.; Perumal, S.; Karthik, N.; Lee, Y.R. Highly fluorescent nitrogen-doped carbon dots derived from Phyllanthus acidus utilized as a fluorescent probe for label-free selective detection of Fe3+ ions, live cell imaging and fluorescent ink. Biosens. Bioelectron. 2018, 99, 303–311. [Google Scholar] [CrossRef] [PubMed]
  28. Paulo, S.; Palomares, E.; Martinez-Ferrero, E. Graphene and Carbon Quantum Dot-Based Materials in Photovoltaic Devices: From Synthesis to Applications. Nanomaterials 2016, 6, 157. [Google Scholar] [CrossRef] [PubMed]
  29. Baker, S.N.; Baker, G.A. Luminescent Carbon Nanodots: Emergent Nanolights. Angew. Chem. Int. Ed. 2010, 49, 6726–6744. [Google Scholar] [CrossRef] [PubMed]
  30. Ding, C.; Zhu, A.; Tian, Y. Functional Surface Engineering of C-Dots for Fluorescent Biosensing and in Vivo Bioimaging. Acc. Chem. Res. 2014, 47, 20–30. [Google Scholar] [CrossRef] [PubMed]
  31. Georgakilas, V.; Perman, J.A.; Tucek, J.; Zboril, R. Broad Family of Carbon Nanoallotropes: Classification, Chemistry, and Applications of Fullerenes, Carbon Dots, Nanotubes, Graphene, Nanodiamonds, and Combined Superstructures. Chem. Rev. 2015, 115, 4744–4822. [Google Scholar] [CrossRef] [PubMed]
  32. Lim, S.Y.; Shen, W.; Gao, Z. Carbon quantum dots and their applications. Chem. Soc. Rev. 2015, 44, 362–381. [Google Scholar] [CrossRef] [PubMed]
  33. Sun, Y.-P.; Zhou, B.; Lin, Y.; Wang, W.; Fernando, K.A.S.; Pathak, P.; Meziani, M.J.; Harruff, B.A.; Wang, X.; Wang, H.; et al. Quantum-Sized Carbon Dots for Bright and Colorful Photoluminescence. J. Am. Chem. Soc. 2006, 128, 7756–7757. [Google Scholar] [CrossRef] [PubMed]
  34. Luo, Z.; Qi, G.; Chen, K.; Zou, M.; Yuwen, L.; Zhang, X.; Huang, W.; Wang, L. Microwave-Assisted Preparation of White Fluorescent Graphene Quantum Dots as a Novel Phosphor for Enhanced White-Light-Emitting Diodes. Adv. Funct. Mater. 2016, 26, 2739–2744. [Google Scholar] [CrossRef]
  35. Ting, Z.X.; Arundithi, A.; Qian, L.K.; Peng, C. Glowing Graphene Quantum Dots and Carbon Dots: Properties, Syntheses, and Biological Applications. Small 2015, 11, 1620–1636. [Google Scholar]
  36. Tao, H.; Yang, K.; Ma, Z.; Wan, J.; Zhang, Y.; Kang, Z.; Liu, Z. In Vivo NIR Fluorescence Imaging, Biodistribution, and Toxicology of Photoluminescent Carbon Dots Produced from Carbon Nanotubes and Graphite. Small 2012, 8, 281–290. [Google Scholar] [CrossRef] [PubMed]
  37. Ye, R.; Xiang, C.; Lin, J.; Peng, Z.; Huang, K.; Yan, Z.; Cook, N.P.; Samuel, E.L.G.; Hwang, C.-C.; Ruan, G.; et al. Coal as an abundant source of graphene quantum dots. Nat. Commun. 2013, 4, 2943. [Google Scholar] [CrossRef] [PubMed] [Green Version]
  38. Han, S.; Chang, T.; Zhao, H.; Du, H.; Liu, S.; Wu, B.; Qin, S. Cultivating Fluorescent Flowers with Highly Luminescent Carbon Dots Fabricated by a Double Passivation Method. Nanomaterials 2017, 7, 176. [Google Scholar] [CrossRef] [PubMed]
  39. Zhu, S.; Meng, Q.; Wang, L.; Zhang, J.; Song, Y.; Jin, H.; Zhang, K.; Sun, H.; Wang, H.; Yang, B. Highly Photoluminescent Carbon Dots for Multicolor Patterning, Sensors, and Bioimaging. Angew. Chem. Int. Ed. 2013, 52, 3953–3957. [Google Scholar] [CrossRef] [PubMed]
  40. Shi, B.; Su, Y.; Zhang, L.; Huang, M.; Liu, R.; Zhao, S. Nitrogen and Phosphorus Co-Doped Carbon Nanodots as a Novel Fluorescent Probe for Highly Sensitive Detection of Fe3+ in Human Serum and Living Cells. ACS Appl. Mater. Interfaces 2016, 8, 10717–10725. [Google Scholar] [CrossRef] [PubMed]
  41. Jiang, K.; Sun, S.; Zhang, L.; Lu, Y.; Wu, A.; Cai, C.; Lin, H. Red, Green, and Blue Luminescence by Carbon Dots: Full-Color Emission Tuning and Multicolor Cellular Imaging. Angew. Chem. Int. Ed. 2015, 54, 5360–5363. [Google Scholar] [CrossRef] [PubMed]
  42. Jiang, K.; Zhang, L.; Lu, J.; Xu, C.; Cai, C.; Lin, H. Triple-Mode Emission of Carbon Dots: Applications for Advanced Anti-Counterfeiting. Angew. Chem. Int. Ed. 2016, 55, 7231–7235. [Google Scholar] [CrossRef] [PubMed]
  43. Gu, J.; Hu, D.; Huang, J.; Huang, X.; Zhang, Q.; Jia, X.; Xi, K. One-pot synthesis and control of aqueous soluble and organic soluble carbon dots from a designable waterborne polyurethane emulsion. Nanoscale 2016, 8, 3973–3981. [Google Scholar] [CrossRef] [PubMed]
  44. Hsu, P.-C.; Shih, Z.-Y.; Lee, C.-H.; Chang, H.-T. Synthesis and analytical applications of photoluminescent carbon nanodots. Green Chem. 2012, 14, 917–920. [Google Scholar] [CrossRef]
  45. Zhang, J.; Yuan, Y.; Liang, G.; Yu, S.-H. Scale-Up Synthesis of Fragrant Nitrogen-Doped Carbon Dots from Bee Pollens for Bioimaging and Catalysis. Adv. Sci. 2015, 2, 1500002. [Google Scholar] [CrossRef] [PubMed] [Green Version]
  46. Yao, Y.-Y.; Gedda, G.; Girma, W.M.; Yen, C.-L.; Ling, Y.-C.; Chang, J.-Y. Magnetofluorescent Carbon Dots Derived from Crab Shell for Targeted Dual-Modality Bioimaging and Drug Delivery. ACS Appl. Mater. Interfaces 2017, 9, 13887–13899. [Google Scholar] [CrossRef] [PubMed]
  47. Hu, Y.; Zhang, L.; Li, X.; Liu, R.; Lin, L.; Zhao, S. Green Preparation of S and N Co-Doped Carbon Dots from Water Chestnut and Onion as Well as Their Use as an Off–On Fluorescent Probe for the Quantification and Imaging of Coenzyme, A. ACS Sustain. Chem. Eng. 2017, 5, 4992–5000. [Google Scholar] [CrossRef]
  48. Lei, S.; Chen, L.; Zhou, W.; Deng, P.; Liu, Y.; Fei, L.; Lu, W.; Xiao, Y.; Cheng, B. Tetra-heteroatom self-doped carbon nanosheets derived from silkworm excrement for high-performance supercapacitors. J. Power Sources 2018, 379, 74–83. [Google Scholar] [CrossRef]
  49. Wei, Y.; Wu, Y.; Chang, Q.; Xie, M.; Wang, X.; Mo, J.; He, X.; Zhao, Z.; Zhao, Z. Ultrasonic-assisted modification of a novel silkworm-excrement-based porous carbon with various Lewis acid metal ions for the sustained release of the pesticide thiamethoxam. RSC Adv. 2017, 7, 30020–30031. [Google Scholar] [CrossRef] [Green Version]
  50. Yuan, Y.; Jiang, J.; Liu, S.; Yang, J.; Zhang, H.; Yan, J.; Hu, X. Fluorescent carbon dots for glyphosate determination based on fluorescence resonance energy transfer and logic gate operation. Sens. Actuators B Chem. 2017, 242, 545–553. [Google Scholar] [CrossRef]
  51. Fang, B.; Wang, P.; Zhu, Y.; Wang, C.; Zhang, G.; Zheng, X.; Ding, C.; Gu, J.; Cao, F. Basophilic green fluorescent carbon nanoparticles derived from benzoxazine for the detection of Cr(vi) in a strongly alkaline environment. RSC Adv. 2018, 8, 7377–7382. [Google Scholar] [CrossRef] [Green Version]
  52. Shen, C.; Sun, Y.; Wang, J.; Lu, Y. Facile route to highly photoluminescent carbon nanodots for ion detection, pH sensors and bioimaging. Nanoscale 2014, 6, 9139–9147. [Google Scholar] [CrossRef] [PubMed]
  53. Holá, K.; Sudolská, M.; Kalytchuk, S.; Nachtigallová, D.; Rogach, A.L.; Otyepka, M.; Zbořil, R. Graphitic Nitrogen Triggers Red Fluorescence in Carbon Dots. ACS Nano 2017, 11, 12402–12410. [Google Scholar] [CrossRef] [PubMed]
  54. Li, F.; Li, T.; Sun, C.; Xia, J.; Jiao, Y.; Xu, H. Selenium-Doped Carbon Quantum Dots for Free-Radical Scavenging. Angew. Chem. Int. Ed. 2017, 56, 9910–9914. [Google Scholar] [CrossRef] [PubMed]
  55. Wang, H.; Reiva, R.; Wang, K.; Kant, R.J.; Mu, Q.; Gai, Z.; Hong, K.; Zhang, M. Paramagnetic Properties of Metal-Free Boron-Doped Graphene Quantum Dots and Their Application for Safe Magnetic Resonance Imaging. Adv. Mater. 2017, 29, 1605416. [Google Scholar] [CrossRef] [PubMed]
  56. Arcudi, F.; Đorđević, L.; Prato, M. Synthesis, Separation, and Characterization of Small and Highly Fluorescent Nitrogen-Doped Carbon NanoDots. Angew. Chem. Int. Ed. 2016, 55, 2107–2112. [Google Scholar] [CrossRef] [PubMed] [Green Version]
  57. Rao, L.; Tang, Y.; Li, Z.; Ding, X.; Liang, G.; Lu, H.; Yan, C.; Tang, K.; Yu, B. Efficient synthesis of highly fluorescent carbon dots by microreactor method and their application in Fe3+ ion detection. Mater. Sci. Eng. C 2017, 81, 213–223. [Google Scholar] [CrossRef] [PubMed]
  58. Shrivastava, A.; Gupta, V.B. Methods for the determination of limit of detection and limit of quantitation of the analytical methods. Chron. Young Sci. 2011, 2, 21–25. [Google Scholar] [CrossRef]
  59. Chin, S.-F.; Tan, S.-C.; Pang, S.-C.; Ng, S.-M. Nitrogen doped carbon nanodots as fluorescent probes for selective detection and quantification of Ferric(III) ions. Opt. Mater. 2017, 73, 77–82. [Google Scholar] [CrossRef]
  60. Dong, Y.; Su, M.; Chen, P.; Sun, H. Chemiluminescence of carbon dots induced by diperiodato-nicklate(IV) in alkaline solution and its application to a quenchometric flow-injection assays of paracetamol, l-cysteine and glutathione. Microchim. Acta 2015, 182, 1071–1077. [Google Scholar] [CrossRef]
  61. Gao, G.; Jiang, Y.-W.; Jia, H.-R.; Yang, J.; Wu, F.-G. On-off-on fluorescent nanosensor for Fe3+ detection and cancer/normal cell differentiation via silicon-doped carbon quantum dots. Carbon 2018, 134, 232–243. [Google Scholar] [CrossRef]
Figure 1. A schematic illustration of the formation of nitrogen-doped CNPs (N-CNPs) from silkworm excrement, and the fluorescence “on–off–on” detection of Fe(III) and biothiols.
Nanomaterials 08 00443 g001
Figure 2. Transmission electron microscopy (TEM) image (a); the particle size distribution histogram (b); X-ray diffraction (XRD) pattern (c); and fourier transform infrared (FT-IR) spectrum (d) of N-CNPs.
Nanomaterials 08 00443 g002
Figure 3. X-ray photoelectron spectroscopy (XPS) full survey (a); C 1s (b); N 1s (c) and O 1s (d) spectra of N-CNPs. Black line: raw, navy line: background, other lines: fitting.
Nanomaterials 08 00443 g003
Figure 4. Ultraviolet-visible (UV-vis) absorption spectrum (a) and photoluminescent (PL) emission spectra at different excitation wavelengths (b) of N-CNPs. Inset: photographs of N-CNPs in water under daylight and UV irradiation.
Nanomaterials 08 00443 g004
Figure 5. (a) Selectivity of N-CNPs with different ions at the same concentration (500 μM); (b) The linear relationship between F0/F and Fe(III) concentration. F and F0 were the PL intensities (424 nm) of N-CNPs at 340 nm excitation in the presence and absence of ions, respectively.
Nanomaterials 08 00443 g005
Figure 6. (a) Selectivity of N-CNPs/Fe(III) to different biological molecules at the same concentration (1 mM); (b) The linear relationship between (F’/F’0) and the square root of glutathione (GSH) concentration. F’ and F’0 were the PL intensities (424 nm) of N-CNPs/Fe(III) at 340 nm excitation in the absence and presence of biological molecules, respectively.
Nanomaterials 08 00443 g006
Table 1. Nitrogen-doped CNPs (N-CNPs) for the detection of glutathione (GSH) in fetal calf serum samples.
Added GSH (μM)Found GSH (μM)Recovery (%)RSD (%)
44.35108.71.50
5051.96103.92.14
100102.4102.42.43

